
Genome-wide member identification, phylogeny and expression analysis of PEBP gene family in wheat and its progenitors
- Published
- Accepted
- Received
- Academic Editor
- Yuriy Orlov
- Subject Areas
- Agricultural Science, Bioinformatics, Genetics, Plant Science
- Keywords
- Wheat, PEBP, Gene family, Phylogeny, Expression profile
- Copyright
- © 2020 Dong et al.
- Licence
- This is an open access article distributed under the terms of the Creative Commons Attribution License, which permits unrestricted use, distribution, reproduction and adaptation in any medium and for any purpose provided that it is properly attributed. For attribution, the original author(s), title, publication source (PeerJ) and either DOI or URL of the article must be cited.
- Cite this article
- 2020. Genome-wide member identification, phylogeny and expression analysis of PEBP gene family in wheat and its progenitors. PeerJ 8:e10483 https://doi.org/10.7717/peerj.10483
Abstract
The phosphatidylethanolamine binding protein (PEBP) family comprises ancient proteins found throughout the biosphere that play an important role in plant growth and development, flowering, seed development and dormancy. However, not all PEBP genes have been identified or analyzed in common wheat (Triticum aestivum L.) and its progenitors. In this study, we identified the PEBP genes in common wheat, Triticum dicoccoides, Triticum urartu and Aegilops tauschii by searching whole genome sequences, and characterized these genes by phylogenetic and transcriptome analyses. A total of 76, 38, 16 and 22 PEBP genes were identified in common wheat, T. dicoccoides, T. urartu and Ae. tauschii, respectively. Phylogenetic analysis classified the PEBP genes into four subfamilies (PEBP-like, MFT-like, TFL-like and FT-like); the PEBP-like subfamily was identified as a new subfamily with genes in this subfamily were conserved in plants. Group 2, 3 and 5 chromosomes of common wheat and its progenitors contained more PEBP genes than other chromosomes. The PEBP genes were conserved in wheat during evolution, and tandem duplication played a more important role in the amplification of PEBP genes than segmental duplication. Furthermore, transcriptome analysis revealed that PEBP genes showed tissue/organ-specific expression profiles and some PEBP genes were induced to express by biotic stresses. Quantitative real-time PCR (qRT-PCR) analysis revealed that seven randomly selected PEBP genes expressed differently during seed germination under cold, drought, flood, heat and salt stress treatments, and five of these genes (TaPEBP1, TaPEBP5, TaPEBP9, TaPEBP66 and TaPEBP69) showed significantly higher expression under different stress treatments, indicating that these genes play important roles during seed germination under stress conditions.
Introduction
The phosphatidylethanolamine binding protein (PEBP) family comprises highly conserved proteins and is represented in all three major phylogenetic divisions: Eukaryota, Bacteria and Archaea (Banfield et al., 1998; Chautard et al., 2004; Hengst et al., 2001). In Arabidopsis thaliana, six PEBP genes have been identified and grouped into three subfamilies: TFL1-like, FT-like and MFT-like (Kardailsky et al., 1999). The TFL-like subfamily comprises three genes, TERMINAL FLOWER1 (TFL1), ARABIDOPSIS THALIANA CENTRORADIALIS (ATC) and BROTHER OF FT AND TFL1 (BFT); the FT-like subfamily contains two genes, FLOWERING LOCUS T (FT) and TWIN SISTER OF FT (TSF); the MFT-like subfamily contains only one gene, MOTHER OF FT AND TFL1 (MFT). The MFT-like subfamily is ancestral to the FT-like and TFL1-like subfamilies. The MFT-like proteins function in the gametophyte, sporophyte, and seed development and germination of bryophytes, whereas the FT-like and TFL1-like proteins play important roles in the vegetative-to-reproductive phase transition in seed plants (Liu et al., 2016).
The plant PEBP genes including Arabidopsis TFL1 and tomato (Solanum lycopersicum) SELF PRUNING (SP) were initially cloned from mutants with altered inflorescence structure (Bradley et al., 1997; Pnueli et al., 1998). The TFL1 gene controls both vegetative and reproductive phase durations by maintaining both apical and inflorescence meristem indeterminacy (Bradley et al., 1997; Shannon & Meeks-Wagner, 1991). Mutation of the tomato SP gene changed the uncertain growth habit to a definite type, resulting in bud growth restriction and dense compact habit (Pnueli et al., 1998). These mutant phenotypes indicated that TFL1 and SP genes maintain the uncertain state of inflorescence meristem. The expression of TFL1 and its paralog, ATC, was weak in the inner cells of mature shoot meristem during the vegetative phase but increased following the transition to the reproductive phase (Bradley et al., 1997; Ratcliffe, Bradley & Coen, 1999). The BFT gene (TFL1-like subfamily) plays an important role in the growth of plant meristem (Mimida et al., 2001). The FT gene demonstrates the opposite function of TFL1 in Arabidopsis, promoting the vegetative-to-reproductive phase transition (Gursky et al., 2018; Taoka et al., 2011). FT is a key activator of flowering that mediates both photoperiod and vernalization regulation. FT and BFT may provide an adaptation strategy that finetunes photoperiodic flowering under high salt stress (Ryu et al., 2014). The function of FT is also highly conserved in plants. The tomato FT homolog, SINGLE FLOWER TRUSS (SFT), also regulates flowering time and shoot architecture by generating a graft-transmissible signal. TSF is also a floral activator, and mutation of the TSF gene delays flowering (Kardailsky et al., 1999; Yamaguchi et al., 2005). The FT and TSF genes are up-regulated in chaperone cells of phloem under long periods of sunshine (Jang, Torti & Coupland, 2009). MFT regulates dormancy through the mediation of gibberellin (GA) and abscisic acid (ABA) (Xi et al., 2010). In germinated seeds, the expression of MFT is directly regulated by transcription factors ABA-INSENSITIVE3 (ABI3) and ABI5 in the ABA signaling pathway. In addition, MFT promotes embryo growth by directly inhibiting ABI5 through a negative feedback loop (Xi et al., 2010). These results indicate that the plant PEBP family members play an important role in the vegetative-to-reproductive phase transition and seed dormancy (Bradley et al., 1997; Kojima et al., 2002; Xi et al., 2010).
Some of the PEBP genes have been studied in the Gramineae family. In rice (Oryza sativa L.), the FT protein encoded by the Heading date 3a (Hd3a) gene, also known as OsFTL2, migrates from leaves to meristem tips to induce flowering (Kojima et al., 2002). In wheat and barley (Hordeum vulgare L.), the VERNALIZATION LOCUS3 (VRN3) gene, an ortholog of the FT gene, also plays an important role in flowering regulation (Faure et al., 2007; Yan et al., 2006). The MFT homolog, TaPHS1, of wheat regulates grain dormancy (Liu et al., 2013). Compared with the study of individual PEBP genes, the identification of the PEBP gene family is equally important in plants but relatively less common (Zhao et al., 2020). For example, 23 PEBP genes have been identified in soybean (Glycine max L.), which is almost 4-fold higher than the number of PEBP genes in Arabidopsis. Among these genes, GmFT2a and GmFT5a control flowering by regulating the photoperiod pathway (Wang et al., 2015; Nan et al., 2014). In maize (Zea mays L.), 24 PEBP genes have been identified, of which only ZCN8 shows the most similar function to the Arabidopsis FT gene (Meng, Muszynski & Danilevskaya, 2011). Chardon & Damerval (2005) used expressed sequence tag (EST) and genomic sequence databases to carry out phylogenetic analyses of the Gramineae PEBP genes, and identified a total of 19, 9, and 10 PEBP genes in wheat, barley and rice, respectively (Chardon & Damerval, 2005). Halliwell et al. (2016) identified 12, 12, 13, and 12 FT-like genes in wheat, barley, rice and Brachypodium (Brachypodium distachyon), respectively (Halliwell et al., 2016).
Common wheat is one of the most important crops in the world, accounting for more than 50% of the total human food consumption (Shewry & Hey, 2015). Recent genome sequencing of common wheat and its progenitors allows detailed analysis of PEBP gene families in these species (Appels et al., 2018; Avni et al., 2017; Ling et al., 2018; Luo et al., 2017). In this study, we aimed to identify the gene structure, physical properties, chromosomal location of PEBP genes and their phylogenetic relationship in common wheat and its progenitors. We searched the PEBP genes in common wheat and its progenitors, and analyzed their expression patterns in various tissues, during the process of grain development and under various biotic and abiotic stresses. We also examined the expression of seven TaPEBP genes under adverse germination conditions. The results of this study provided valuable information for further investigation of the evolution and molecular function of PEBP genes in common wheat and its progenitors.
Materials & Methods
Identification of PEBP family members
The complete protein sequences of the common wheat cultivar Chinese Spring (Triticum aestivum L., AABBDD, 2n = 6x = 42, IWGSC RefSeq_v1.0 & v2.0), wild emmer cultivar Zavitan (Triticum dicoccoides, AABB, 2n = 4x = 28, WEWSeq_v1.0 & v2.0) and Aegilops tauschii cultivar AL8/78 (DD, 2n = 2x = 14, AET_v4.0) were downloaded from the Ensembl database (http://plants.ensembl.org/index.html). Protein sequences of Triticum urartu G1812 (AA, 2n = 2x = 14, G1812 Tu_2.0) was downloaded from the MBKBASE website (http://www.mbkbase.org/Tu/). To identify PEBP gene candidates, protein sequences of common wheat and its progenitors were searched using two methods. In the first method, six PEBP genes of Arabidopsis were used to search the protein database of common wheat and its progenitors by blastp (e-value ≤ 1e−5). The second method was to obtain the Hidden Markov model (HMM) of PEBP (PF01161) from Pfam website (http://pfam.xfam.org/) and use it to retrieve all protein databases. All of the searched putative PEBP proteins were submitted to the CDD (https://www.ncbi.nlm.nih.gov/Structure/cdd/wrpsb.cgi) and SMART (http://smart.embl-heidelberg.de/) databases to confirm the conserved PEBP domain. The second method was also used to identify the novel PEBP-like subfamily in monocotyledonous plants including barley, Oryza sativa ssp. japonica, sorghum (Sorghum bicolor L.), maize and Brachypodium, and dicotyledonous plants including Arabidopsis, cotton (Gossypium raimondii), soybean (Glycine max), tomato (Solanum lycopersicum), cucumber (Cucumis sativus) and tobacco (Nicotiana attenuata) in the Ensembl Plants database. The predicted protein sequences lacking the PEBP domain were excluded from the analysis. Each PEBP gene must contain a complete PEBP conserved domain. When there are multiple transcripts of this gene, the most consistent transcripts (transcripts with the lowest e-value) with the HMM model are selected as PEBP genes. These PEBP genes in T. aestivum L., T. dicoccoides, T. urartu and Ae. tauschii were designated as TdPEBP, TuPEBP and AetPEBP genes, respectively, and the PEBP genes in Arabidopsis were designated as AtPEBP. For each species, the PEPB genes were numbered according to the sequence of homologous groups (A, B and D) and the physical location from small to large on the chromosomes (Ouyang et al., 2009).
Phylogenetic analysis and classification of PEBP genes
Full-length amino acid sequences of the PEBP proteins from Arabidopsis as well as common wheat and its progenitors were used for phylogenetic analysis. Phylogenetic relationship was inferred using the maximum likelihood (ML) method, based on the LG model, with MEGA7.0 software (Kumar, Stecher & Tamura, 2016). A midpoint rooted base tree was produced using the Evolview (https://www.evolgenius.info/evolview/). The PEBP genes of common wheat and its progenitors were divided into different groups, according to the topological structure of phylogenetic tree and clustering of Arabidopsis PEBP genes.
Sequence analysis and structural characterization
All highly reliable PEBP sequences were submitted to ExPASy (http://web.expasy.org/protparam/) to calculate the number of amino acids and to determine their isoelectric point (pI), molecular weight (MW) and instability index. The subcellular localization of PEBPs was predicted using CELLO (http://cello.life.nctu.edu.tw/). The chromosomal location and exon number of all PEBPs were obtained from the Triticeae Multi-omics Center (http://wheatomics.info/). Conserved PEBP sequences were identified with the MEME 5.0 suite (http://meme-suite.org/) using parameters established for Arabidopsis PEBP protein sequences, and conserved PEBPs were identified based on the following criteria: each sequence comprised non-overlapping repeats of each motif >1; number of different motifs = 20; motif width = 6–50 amino acids (aa). The predicted motifs were visualized using the TBtools software (https://github.com/CJ-Chen/TBtools). The annotation information of PEBPs was interpreted using GSDS version 2.0 (http://gsds.gao-lab.org/) to determine the gene structure and intron/exon distribution (Hu et al., 2015).
Chromosomal location and tandem duplication
The chromosomal location of PEBP genes was obtained from the Triticeae Multi-omics Center. MapChart was used to draw the map of the chromosomes harboring the PEBP genes and to indicate the relative distance between two PEBP genes on the same chromosome (Voorrips, 2002). Tandem repeats of the PEBP genes were confirmed based on two criteria: (a) aligned length of shorter sequences covering the longer sequences >70%; (b) similarity between two aligned sequences >70% (Gu et al., 2002; Yang et al., 2008). Two genes on the same chromosome within a 100-kb physical distance were designated as tandem repeats (Wang et al., 2010). Synonymous substitution (Ks) and non-synonymous substitution (Ka) rates of tandem repeats were calculated as described previously (Wang et al., 2010). The divergence time (T) is obtained using the synonym for 6.5 × 10⁻⁹ per substitution per year, i.e., T = Ks / (2 × 6.5 × 10−9) (Gaut et al., 1996; Lynch & Conery, 2000; Wolfe, Sharp & Li, 1989). The number of tandem duplication events of gene families and the collinearity between wheat and other species were performed using the MCScanX software (Wang, Li & Paterson, 2013). A wheat PEBP gene, which has no collinear relationship with wheat progenitor species, is considered to be a wheat specific PEBP gene. Segmental duplications of TaPEBP genes were identified using the Circos software (Krzywinski et al., 2009).
Expression analysis of TaPEBP genes
To analyze the expression of TaPEBP genes, the RNA-seq data of different tissues at adult stage including leaf, root, spike, stem and grain (at 10, 20 and 30 days post anthesis [DPA]) of Chinese Spring was downloaded from the expVIP website (http://www.wheat-expression.com/) (Borrill, Ramirez-Gonzalez & Uauy, 2016). Additionally, RNA-seq data of plants under different biotic stresses (powdery mildew and stripe rust) and abiotic stresses (cold, drought, heat and salt) were downloaded from the Triticeae Multi-omics Center. Heat maps were generated using the TBtools software. Hierarchical cluster analysis was conducted based on log2 of the transcripts per million (TPM) values of TaPEBP genes.
Plant material and abiotic stress treatments
The expression of TaPEBP genes was verified using the wheat variety SN5058. Seeds were sterilized with 75% ethanol and then absorbed in an incubator at 25 °C for 8 h. To perform drought, flood, salt, cold and heat stress treatments, the sterilized seeds were exposed to 20% PEG6000, 10-mL sterile water, 200 mM NaCl, 4 °C and 45 °C, respectively. Three biological replicates were performed for each treatment, and each replicate contained 10 embryos. To analyze gene expression, embryos were collected at 0, 3, 6 and 12 h, immediately frozen in a liquid nitrogen tank and stored at −80 °C for RNA extraction.
Quantitative real-time PCR (qRT-PCR) and data analysis
Expression profiles of seven randomly selected TaPEBP genes, including three that showed differential expression in the embryo, endosperm and seed coat (TaPEBP1, TaPEBP5 and TaPEBP66 [We use differential expression index greater than 5 to determine differentially expressed genes. The differences of TaPEBP1, TaPEBP5 and TaPEBP66 were 8.8, 16.8 and 8.6 times, respectively.]) and four that showed no differential expression (TaPEBP9, TaPEBP28, TaPEBP50 and TaPEBP69), were verified by qRT-PCR. Total RNA was extracted using the RNAsimple Total RNA Kit (TransGen Biotech, Beijing, China) and reverse transcribed using the PrimeScript RT Reagent Kit with gDNA Eraser (TaKaRa, Beijing, China), according to the manufacturer’s instructions. Then, qRT-PCR was performed using the TransStart Top Green qPCR SuperMix (TransGen Biotech, Beijing, China) on the Light Cycler 96 Detection System (Roche, Switzerland) in a 20- µL reaction volume containing 10 µL of 2X Green Mix, 1 µL of each primer (10 µM), 1 µL of cDNA template (∼400 ng/ µL) and 7 µL of double distilled water. The PCR conditions were as follows: pre-denaturation at 94 °C for 3 min, followed by 40 cycles of denaturation at 94 °C for 10 s, annealing/extension and collection of fluorescence signal at 60 °C for 30 s. Three replications were performed for each cDNA. The Actin gene was used as an endogenous control, and gene-specific primers were designed using Primer Premier 5.0 (Table S1). Relative gene expression levels were determined using the 2−ΔΔCt method. The expression level of TaPEBP genes was plotted using the TBtools software. Statistically significant differences between the control and treatment groups were calculated using the independent Student’s t-test.
Results
Identification of PEBP genes
A total of 76, 38, 16, 22 and 7 PEBP genes were identified in common wheat, T. dicoccoides, T. urartu, Ae. tauschii and Arabidopsis, respectively. In addition, the identified TaPEBP genes and TdPEBP genes were corrected with the newly released and updated genome sequences, IWGSC RefSeq_v2.0 (no gff3 file) and WEWSeq_v2.0 (no gff3 file), respectively, and the chromosome positions of four TaPEBP and two TdPEBP genes, not mapped to any chromosome in the previous genome sequence assemblies, were determined (Table S2). Among the 152 PEBPs in common wheat and its progenitors, TaPEBP23 and AetPEBP4 were identified as genes encoding the smallest proteins with 152 aa, whereas AetPEBP1 encoded the largest protein (245 aa). The MW of the encoded PEBP proteins ranged from 16.93 to 26.91 kDa, and the pI ranged from 4.84 (TaPEBP1 and TaPEBP5) to 9.85 (TaPEBP73). The predicted subcellular localization indicated that the PEBP proteins were located in the cytoplasm (41.9%), nucleus (6.6%), mitochondria (8.7%), chloroplast (5.8%), plasma membrane (2.1%) and extracellular space (34.9%).
Phylogenetic analysis and classification of PEBP genes
All of the identified 159 PEBP sequences, including seven AtPEBP sequences, were divided into four subfamilies, namely PEBP-like, MFT-like, TFL-like and FT-like, with 6, 14, 21, and 111 PEBP genes of wheat and its progenitors, respectively (Figs. 1, 2A). The PEBP-like subfamily was identified in this study for the first time. The FT-like subfamily members could be further divided into four classes: FT- like-1, FT- like-2, FT- like-3 and FT-like-4.
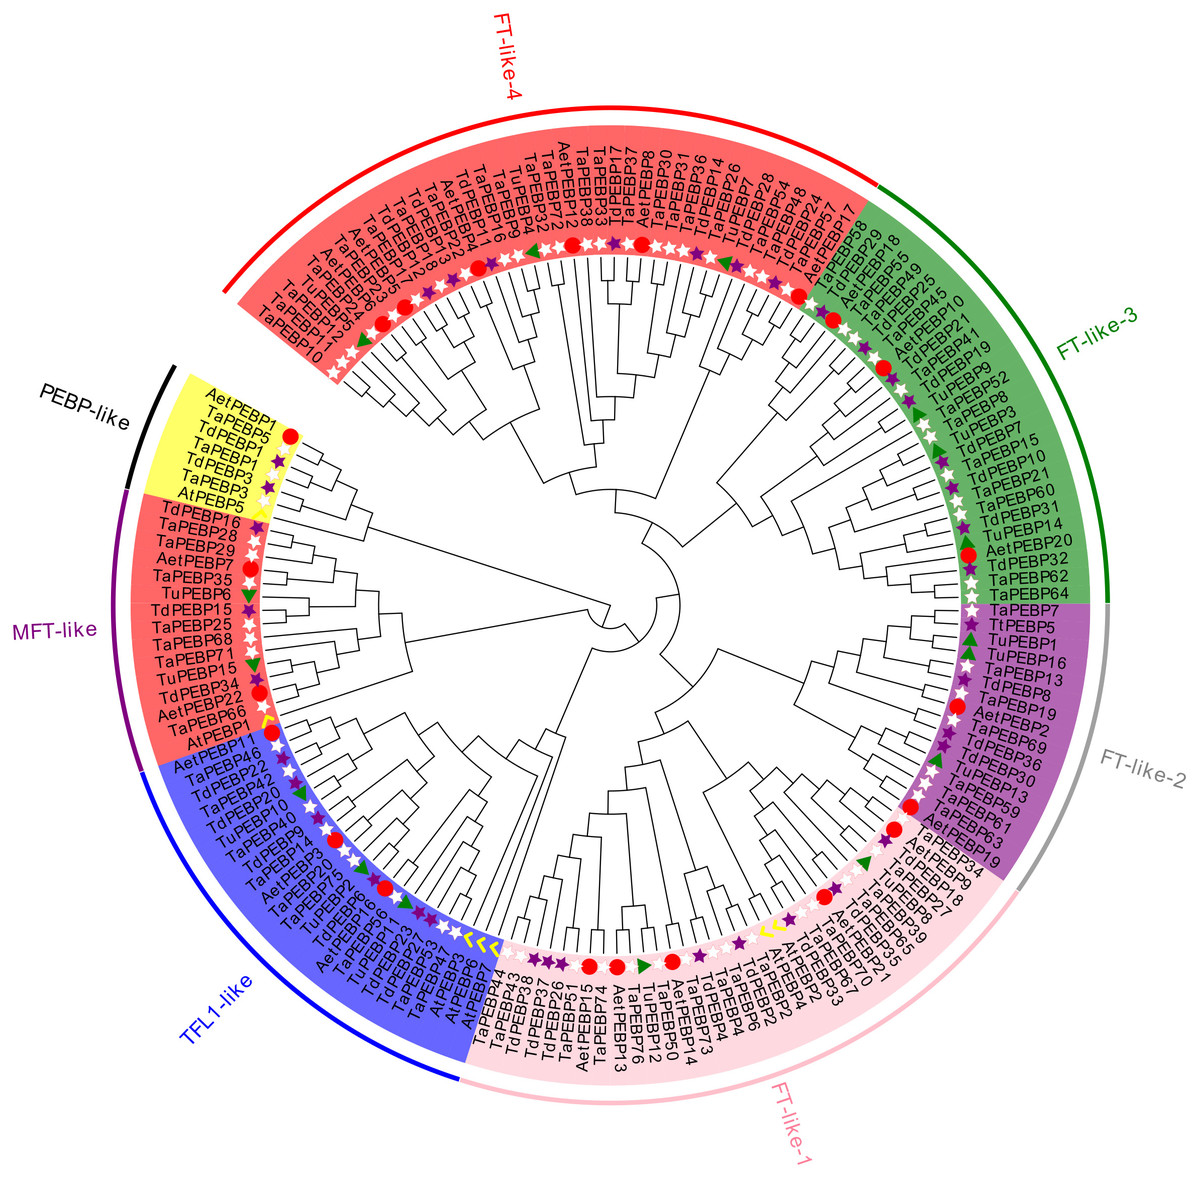
Figure 1: Phylogenetic analysis of PEBP genes in Triticum aestivum, T. dicoccoides, T. urartu, Ae. tauschii and Arabidopsis thaliana.
The phylogenetic tree depicts the relationships among 76 TaPEBP (white star), 38 TdPEBP (purple star), 16 TuPEBP (green triangle), 22 AetPEBP (red circle) and 7 AtPEBP (yellow check) genes. The rootless tree was constructed using the LG model of MEGA7.0 and divided into four subfamilies, of which the FT-like subfamily was further divided into four classes. Different groups are marked with different branch color branches and the same background color to indicate various PEBP gene types.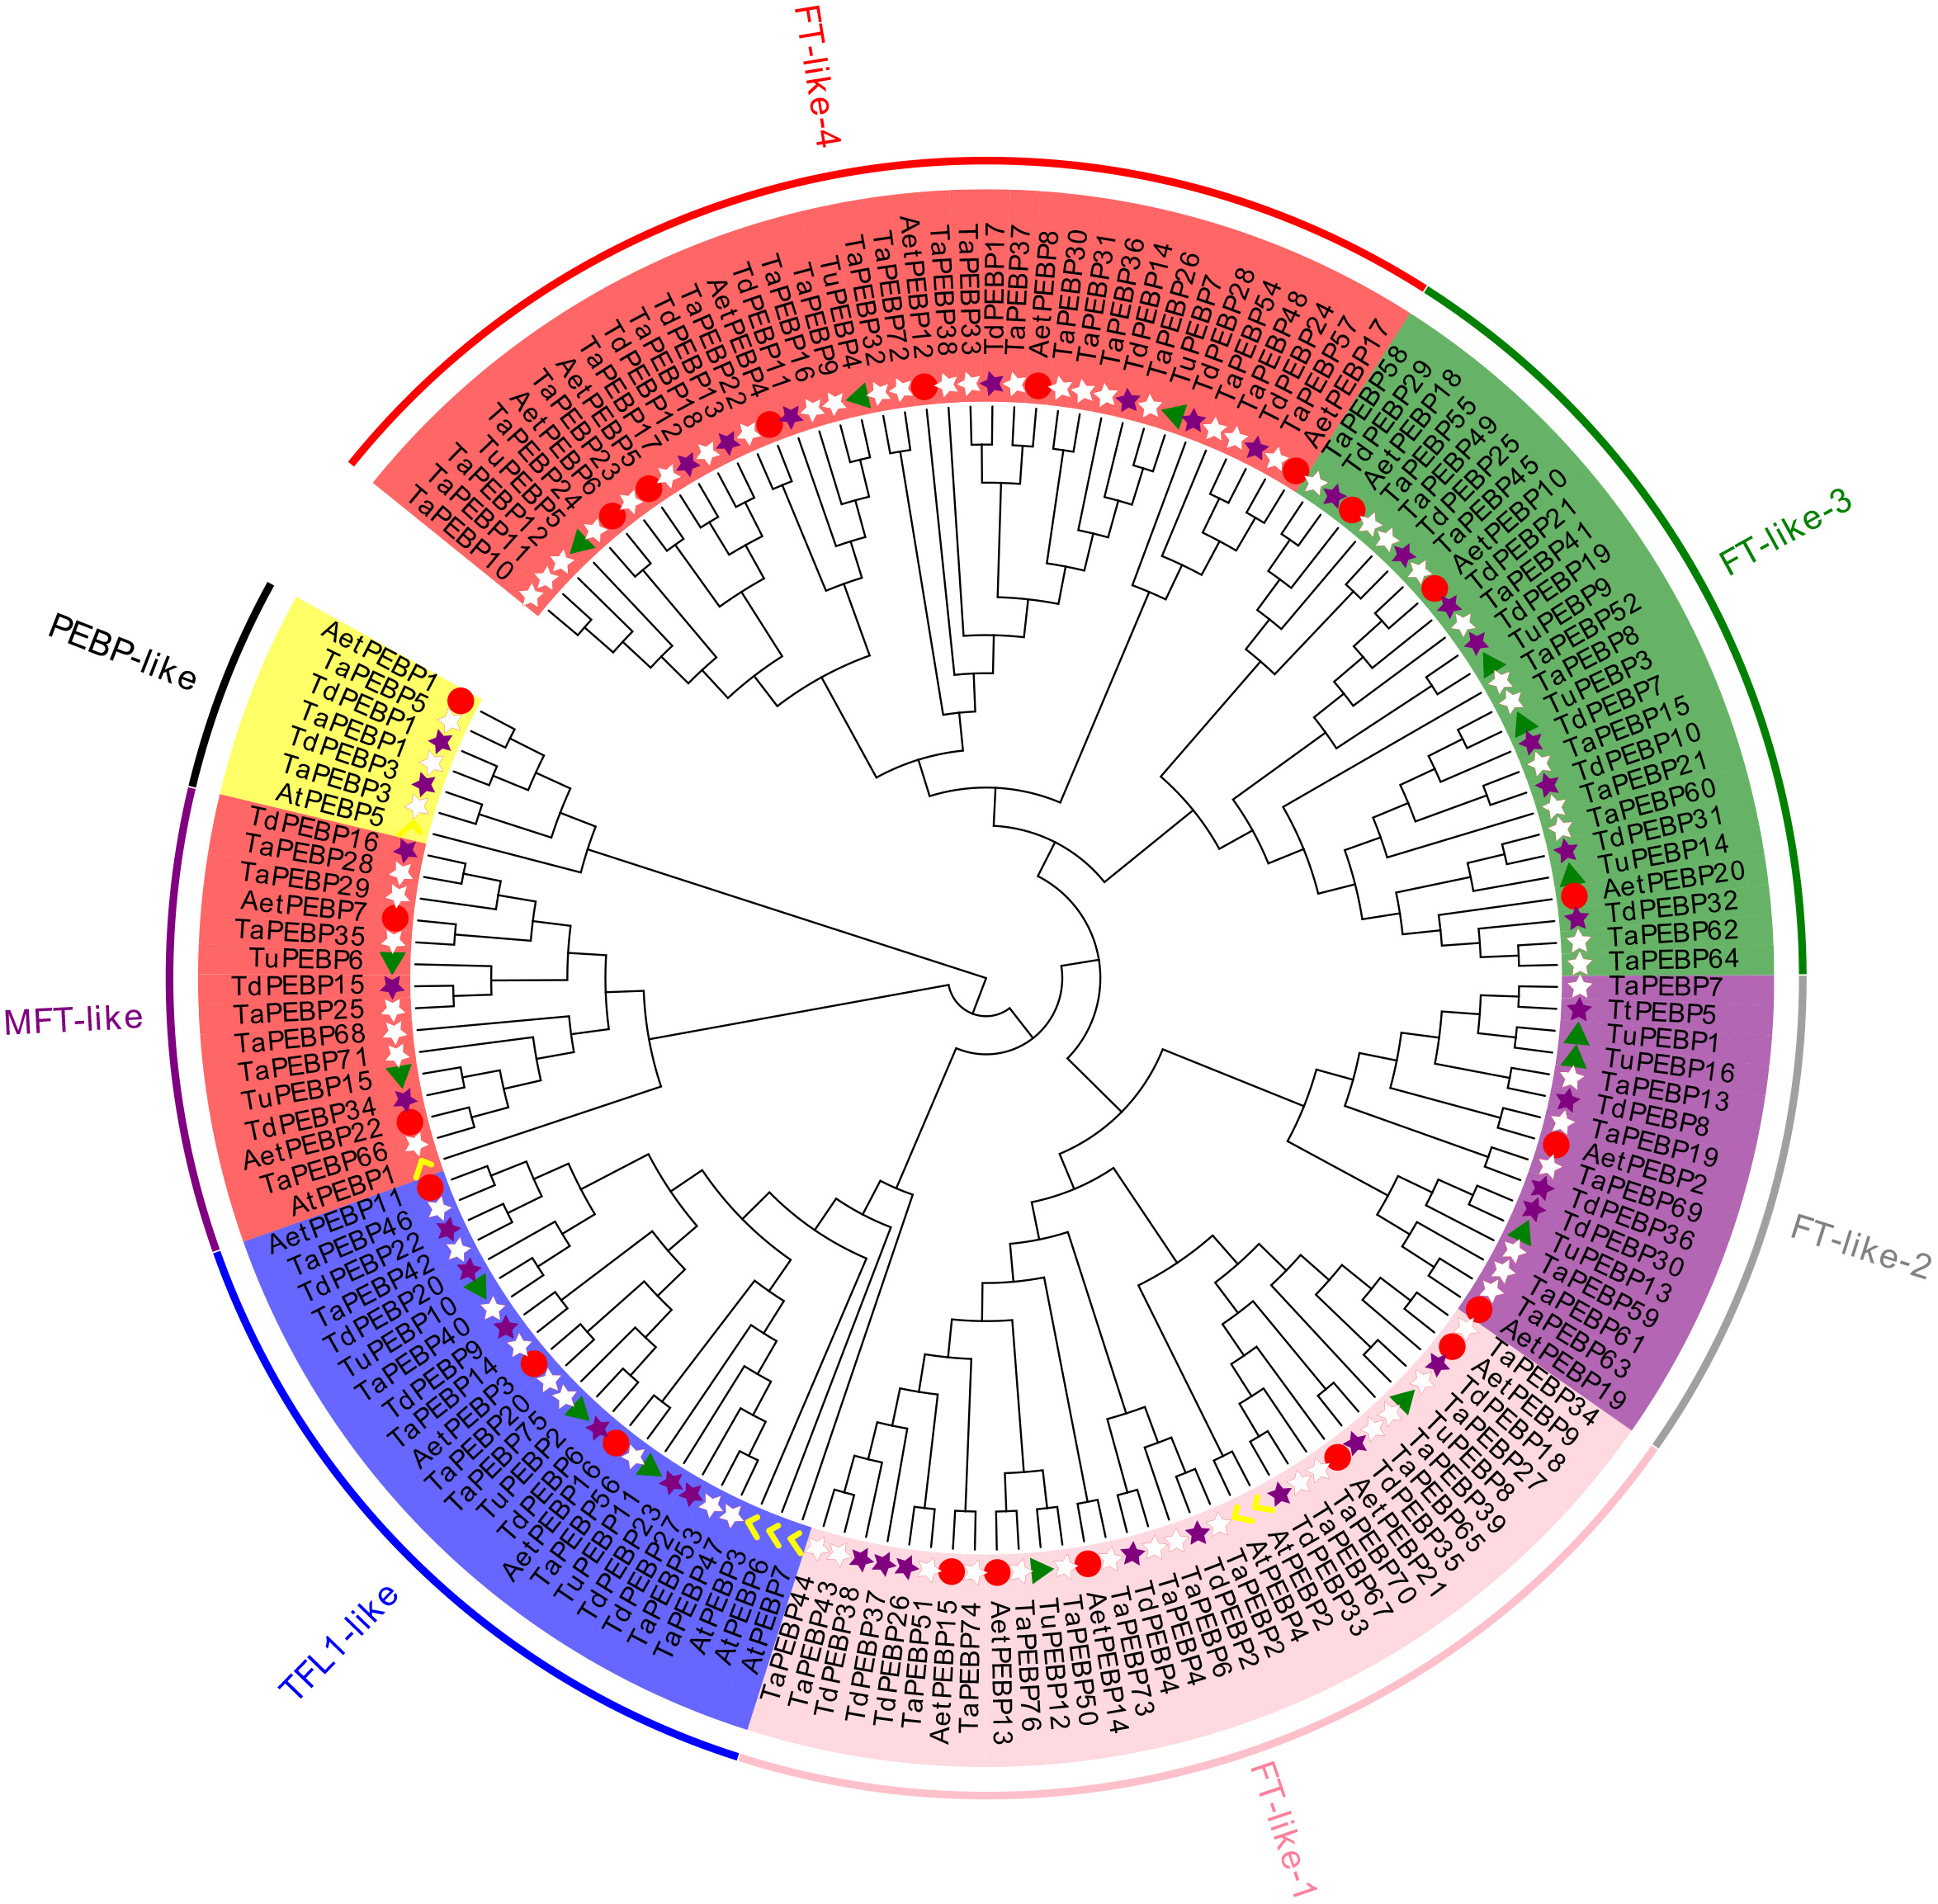
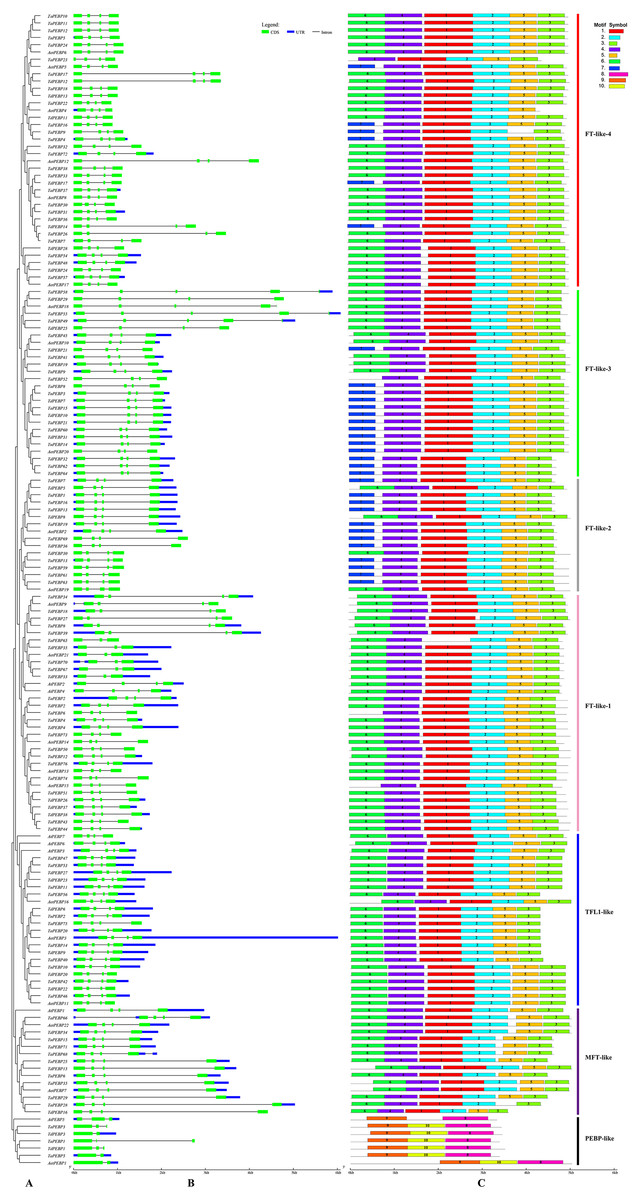
Figure 2: Phylogenetic relationships, gene structure and conserved motifs of the PEBP genes.
(A) Rootless adjacent phylogenetic tree constructed using 152 wheat and its progenitors and 7 Arabidopsis PEBP protein sequences. (B) Exon/intron structure of the PEBP genes. Green boxes indicate exons, and black lines of the same length indicate introns. The untranslated regions (UTRs) of the PEBP genes are indicated with blue boxes. The length of the exon can be inferred from the ratio of the bottom. (C) Distribution of conserved motifs in the PEBP genes. Different colored boxes indicate different motifs, and the motif number in each gene has been indicated in the colored box. Vertical bars of different colors represent different subfamily classifications. See Table 1 for more information on motifs.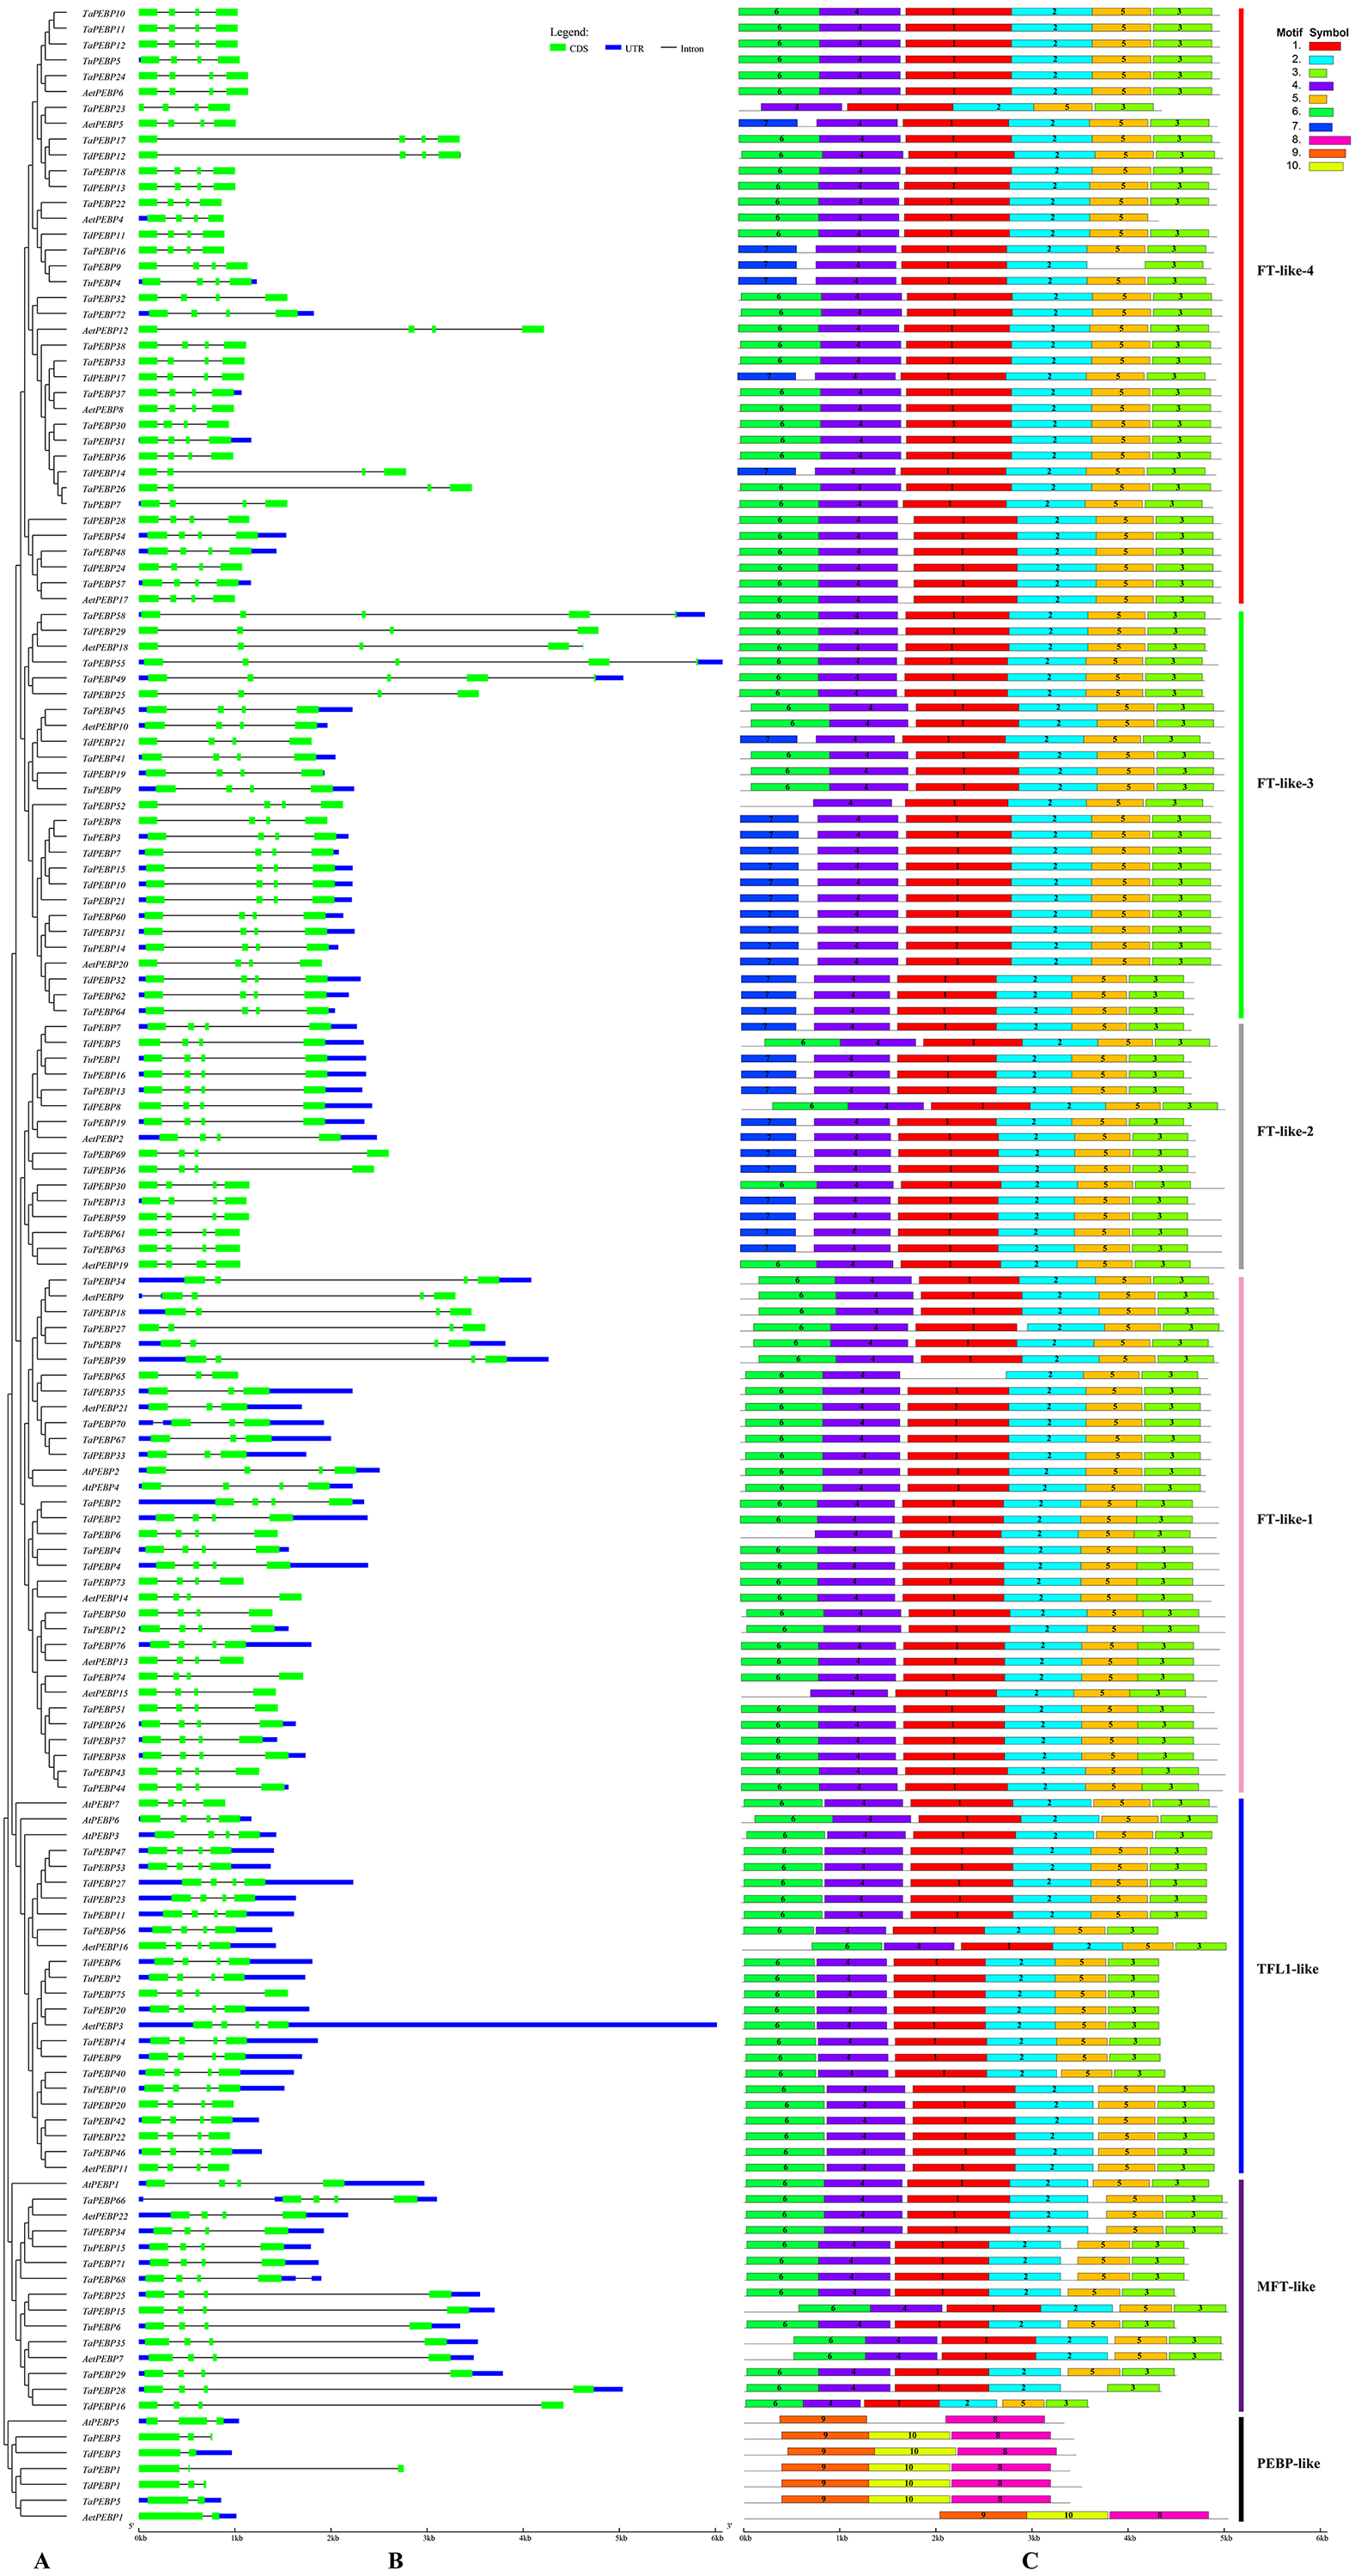
Gene structure and motif composition
The classic PEBP genes contain four exons (Danilevskaya et al., 2008). The 152 PEBP genes from common wheat and its progenitors identified in this study contained two to six exons (3 genes with 2 exons, 9 with 3 exons, 136 with 4 exons, 4 with 5 exons, and 6 with 6 exons) (Fig. 2B). A total of 10 conserved motifs (1–10) were identified in the predicted 159 PEBP genes, each comprising 20–50 aa (Fig. 2C, Table 1). PEBP proteins in the same subfamily had similar conserved motifs, which were distinct from those in PEBP proteins belonging to the other subfamilies. Except three genes (AetPEBP4, TaPEBP9 and TaPEBP65), the MFT-like, TFL-like and FT-like subfamily genes contained motifs 1–5. Proteins in the FT-like-1 class, except TaPEBP65, contained seven motifs (1–7). On this basis, AetPEBP15 and TaPEBP65 lacked motifs 6 and 1, respectively, and only TaPEBP6 contained motif 7. All proteins in the FT-like-2 class contained six motifs (1–5 and 7). The FT-like-3 proteins contained seven motifs (1–7); The FT-like-4 proteins contained seven motifs (1–7). AetPEBP4, TaPEBP9 and TaPEBP23 contained six motifs, while the remaining proteins contained seven motifs. Proteins in the newly identified PEBP-like subfamily contained three motifs (8–10), which were different from those present in the other subfamilies. Motifs in the PEBP-like proteins of common wheat and its progenitor species were highly conserved; however, the AtPEBP5 protein lacked motif 10. To analyze sequence conservation of the proteins in the PEBP-like subfamily, we clustered the members of the PEBP-like subfamily in monocots (common wheat, T. dicoccoides, Ae. tauschii, T. urartu, Hordeum vulgare, Oryza sativa, Sorghum bicolor, Zea mays and Brachypodium) and dicots (Arabidopsis, cotton, soybean, tomato, cucumber and tobacco) (Table S2) and found that the PEBP-like subfamily was divided into two groups, indicating divergence of the PEBP-like subfamily genes between monocots and dicots. However, motif analysis showed that all PEBP-like subfamily proteins, except those in Arabidopsis and tomato, contained three motifs, and the amino acid sequence of the motifs was highly conserved (Fig. S1), indicating that PEBP-like proteins are conserved in plants.
| Motif | Width | Sites | Best possible match |
|---|---|---|---|
| Motif 1 | 38 | 151 | LYTLVMVDPDAPSPSBPTLREYLHWLVTDIPGTTDASF |
| Motif 2 | 29 | 152 | GTEVVPYESPKPTAGIHRFVFVLFRQLGR |
| Motif 3 | 21 | 151 | LGLPVAAVYFNCQREGGCGGR |
| Motif 4 | 29 | 152 | YGNREVTNGSELRPSAVANKPRVEIGGRD |
| Motif 5 | 21 | 150 | QTVYAPGWRQNFNTRDFAECY |
| Motif 6 | 29 | 116 | SRSRDPLVVGRVIGDVVDPFDPTVPLRVT |
| Motif 7 | 21 | 32 | MSRDPLVVGRIVGDILDPFVK |
| Motif 8 | 50 | 7 | NDWKQPGWRGPVPDSHGHRIQFRLYALDDVLSLGNKVTVDKVMEAIEGHV |
| Motif 9 | 44 | 7 | LPRQYTLEGQGAKKDISPPLEWYGVPDGTRSLAVVVQDVDADER |
| Motif 10 | 41 | 6 | VPWTHWVVVNISPEEKGLPEGFSGAGGNANAGGGDGGVQEG |
Chromosomal distribution and homology analysis of PEBP genes
Out of 152 PEBP genes identified in wheat and its progenitors, 147 were mapped to chromosomes (Fig. 3). Group 2, 3 and 5 chromosomes harbored more PEBP genes than other chromosomes, with 37, 26 and 24 PEBP genes, respectively. In addition, group 1 chromosomes harbored the lowest number of PEBP genes, with only 11 in total. Chromosome 3B of common wheat harbored the highest number of PEBP genes (7), whereas chromosome 1A of T. urartu contained no PEBP genes.
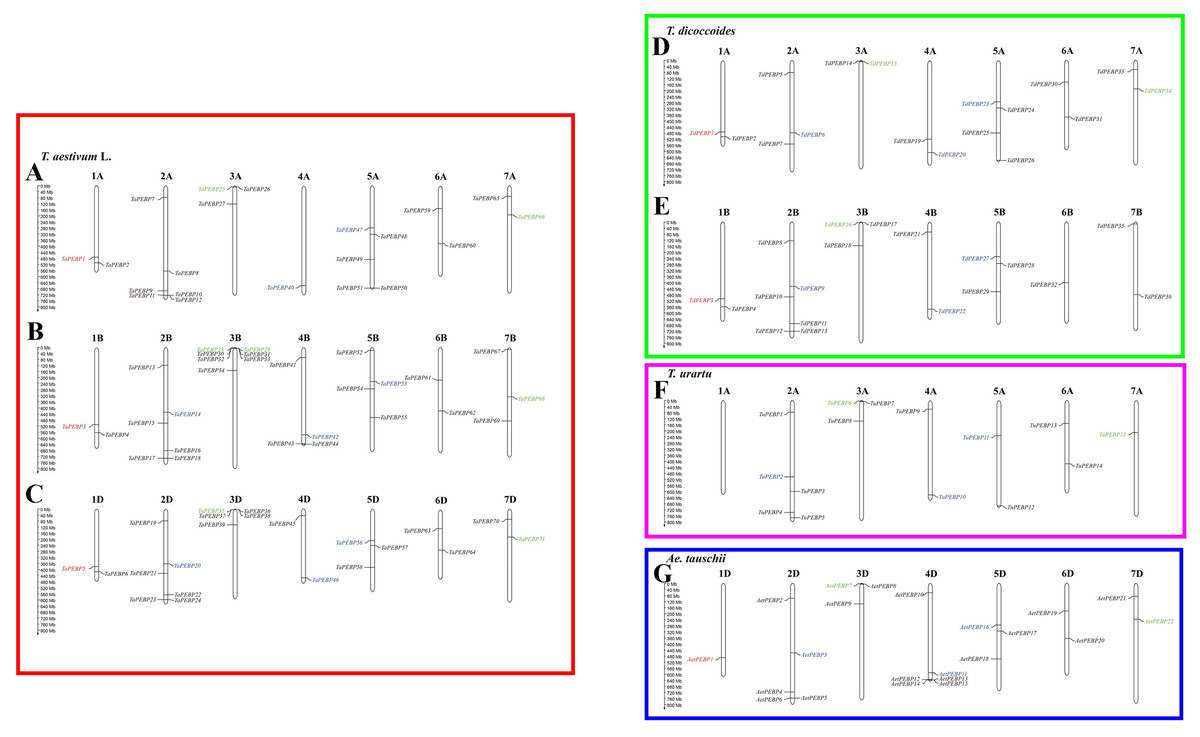
Figure 3: Chromosomal distribution of PEBP genes in wheat and its progenitor species.
PEBP-like, MFT-like, TFL1-like and FT-like genes are indicated in red, green, blue and black, respectively. The names with the prefixes ‘T. aestivum L.’, ‘T. dicoccoides’, ‘T. urartu’, and ‘Ae. tauschii’, are for common wheat (A–C), Triticum dicoccoides (D–E), Triticum urartu (F) and Aegilops tauschii (G), respectively.
Nine TaPEBP genes (TaPEBP10/TaPEBP11, TaPEBP30/TaPEBP31/TaPEBP32/TaPEBP33, TaPEBP36/TaPEBP37/TaPEBP38) clustered into four tandem repeat regions on chromosome 4D, and three AetPEBP genes (AetPEBP13/AetPEBP14/AetPEBP15) formed three clusters on chromosomes 3B, 3D and 4D of Ae. tauschii. Next, the Ka/Ks ratios of 10 tandem PEBP gene pairs were calculated. The Ka/Ks ratios of eight PEBP genes pairs were <1, and that of two gene pairs were >1 (Table 2), suggesting that most of the PEBP genes underwent intense purifying selection during evolution. In addition to tandem repeats, six pairs of segmental repeats consisting of eight genes were identified by MCScanX (Fig. S2). These data suggest that segmental and tandem duplication together led to the expansion of the PEBP family in wheat, with the latter being the main driving force.
| Paralogous pairs | Origin | Ka | Ks | Ka/Ks | Divergence time (mya) |
|---|---|---|---|---|---|
| TaPEBP10-TaPEBP11 | AABBDD | NA | NA | NA | NA |
| TaPEBP30-TaPEBP31 | AABBDD | 0.01 | 0.07 | 0.20 | 5.64 |
| TaPEBP31-TaPEBP32 | AABBDD | 0.05 | 0.21 | 0.22 | 16.48 |
| TaPEBP32-TaPEBP33 | AABBDD | 0.07 | 0.28 | 0.24 | 21.33 |
| TaPEBP36-TaPEBP37 | AABBDD | 0.04 | 0.18 | 0.22 | 14.08 |
| TaPEBP36-TaPEBP38 | AABBDD | 0.05 | 0.17 | 0.30 | 13.21 |
| TaPEBP37-TaPEBP38 | AABBDD | 0.04 | 0.19 | 0.23 | 14.77 |
| AetPEBP13-AetPEBP14 | DD | 1.05 | 0.86 | 1.23 | 65.82 |
| AetPEBP13-AetPEBP15 | DD | 0.09 | 0.16 | 0.56 | 12.11 |
| AetPEBP14-AetPEBP15 | DD | 1.01 | 0.98 | 1.03 | 75.39 |
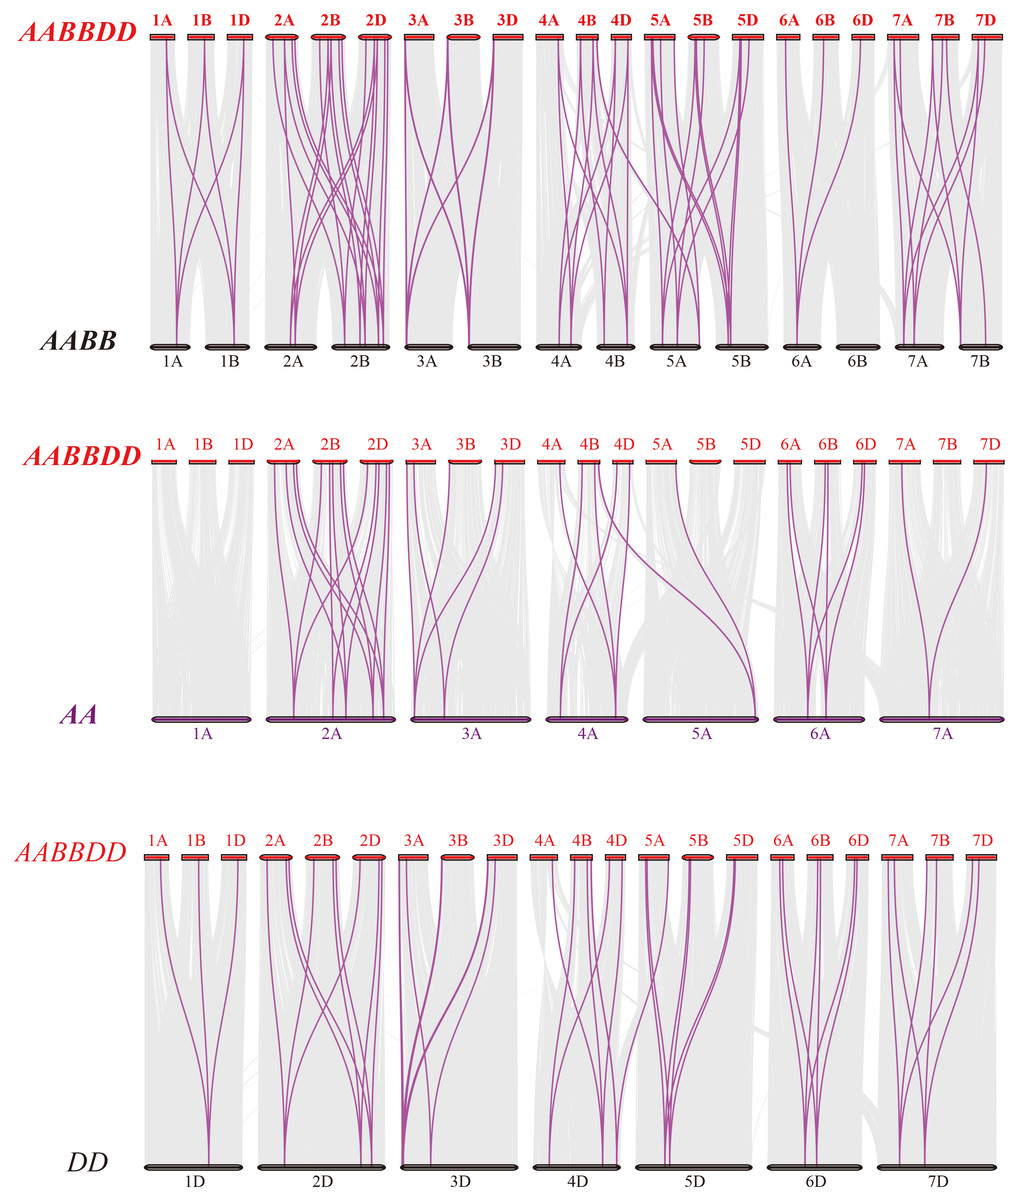
Figure 4: Synteny analysis of PEBP genes between wheat and its progenitors.
Gray lines in the background indicate the collinear blocks within wheat and its progenitor species, while red lines highlight the syntenic PEBP gene pairs. Species with the AABBDD, AABB, AA and DD genomes indicate Triticum aestivum L., T. dicoccoides, T. urartu and Aegilops tauschii, respectively.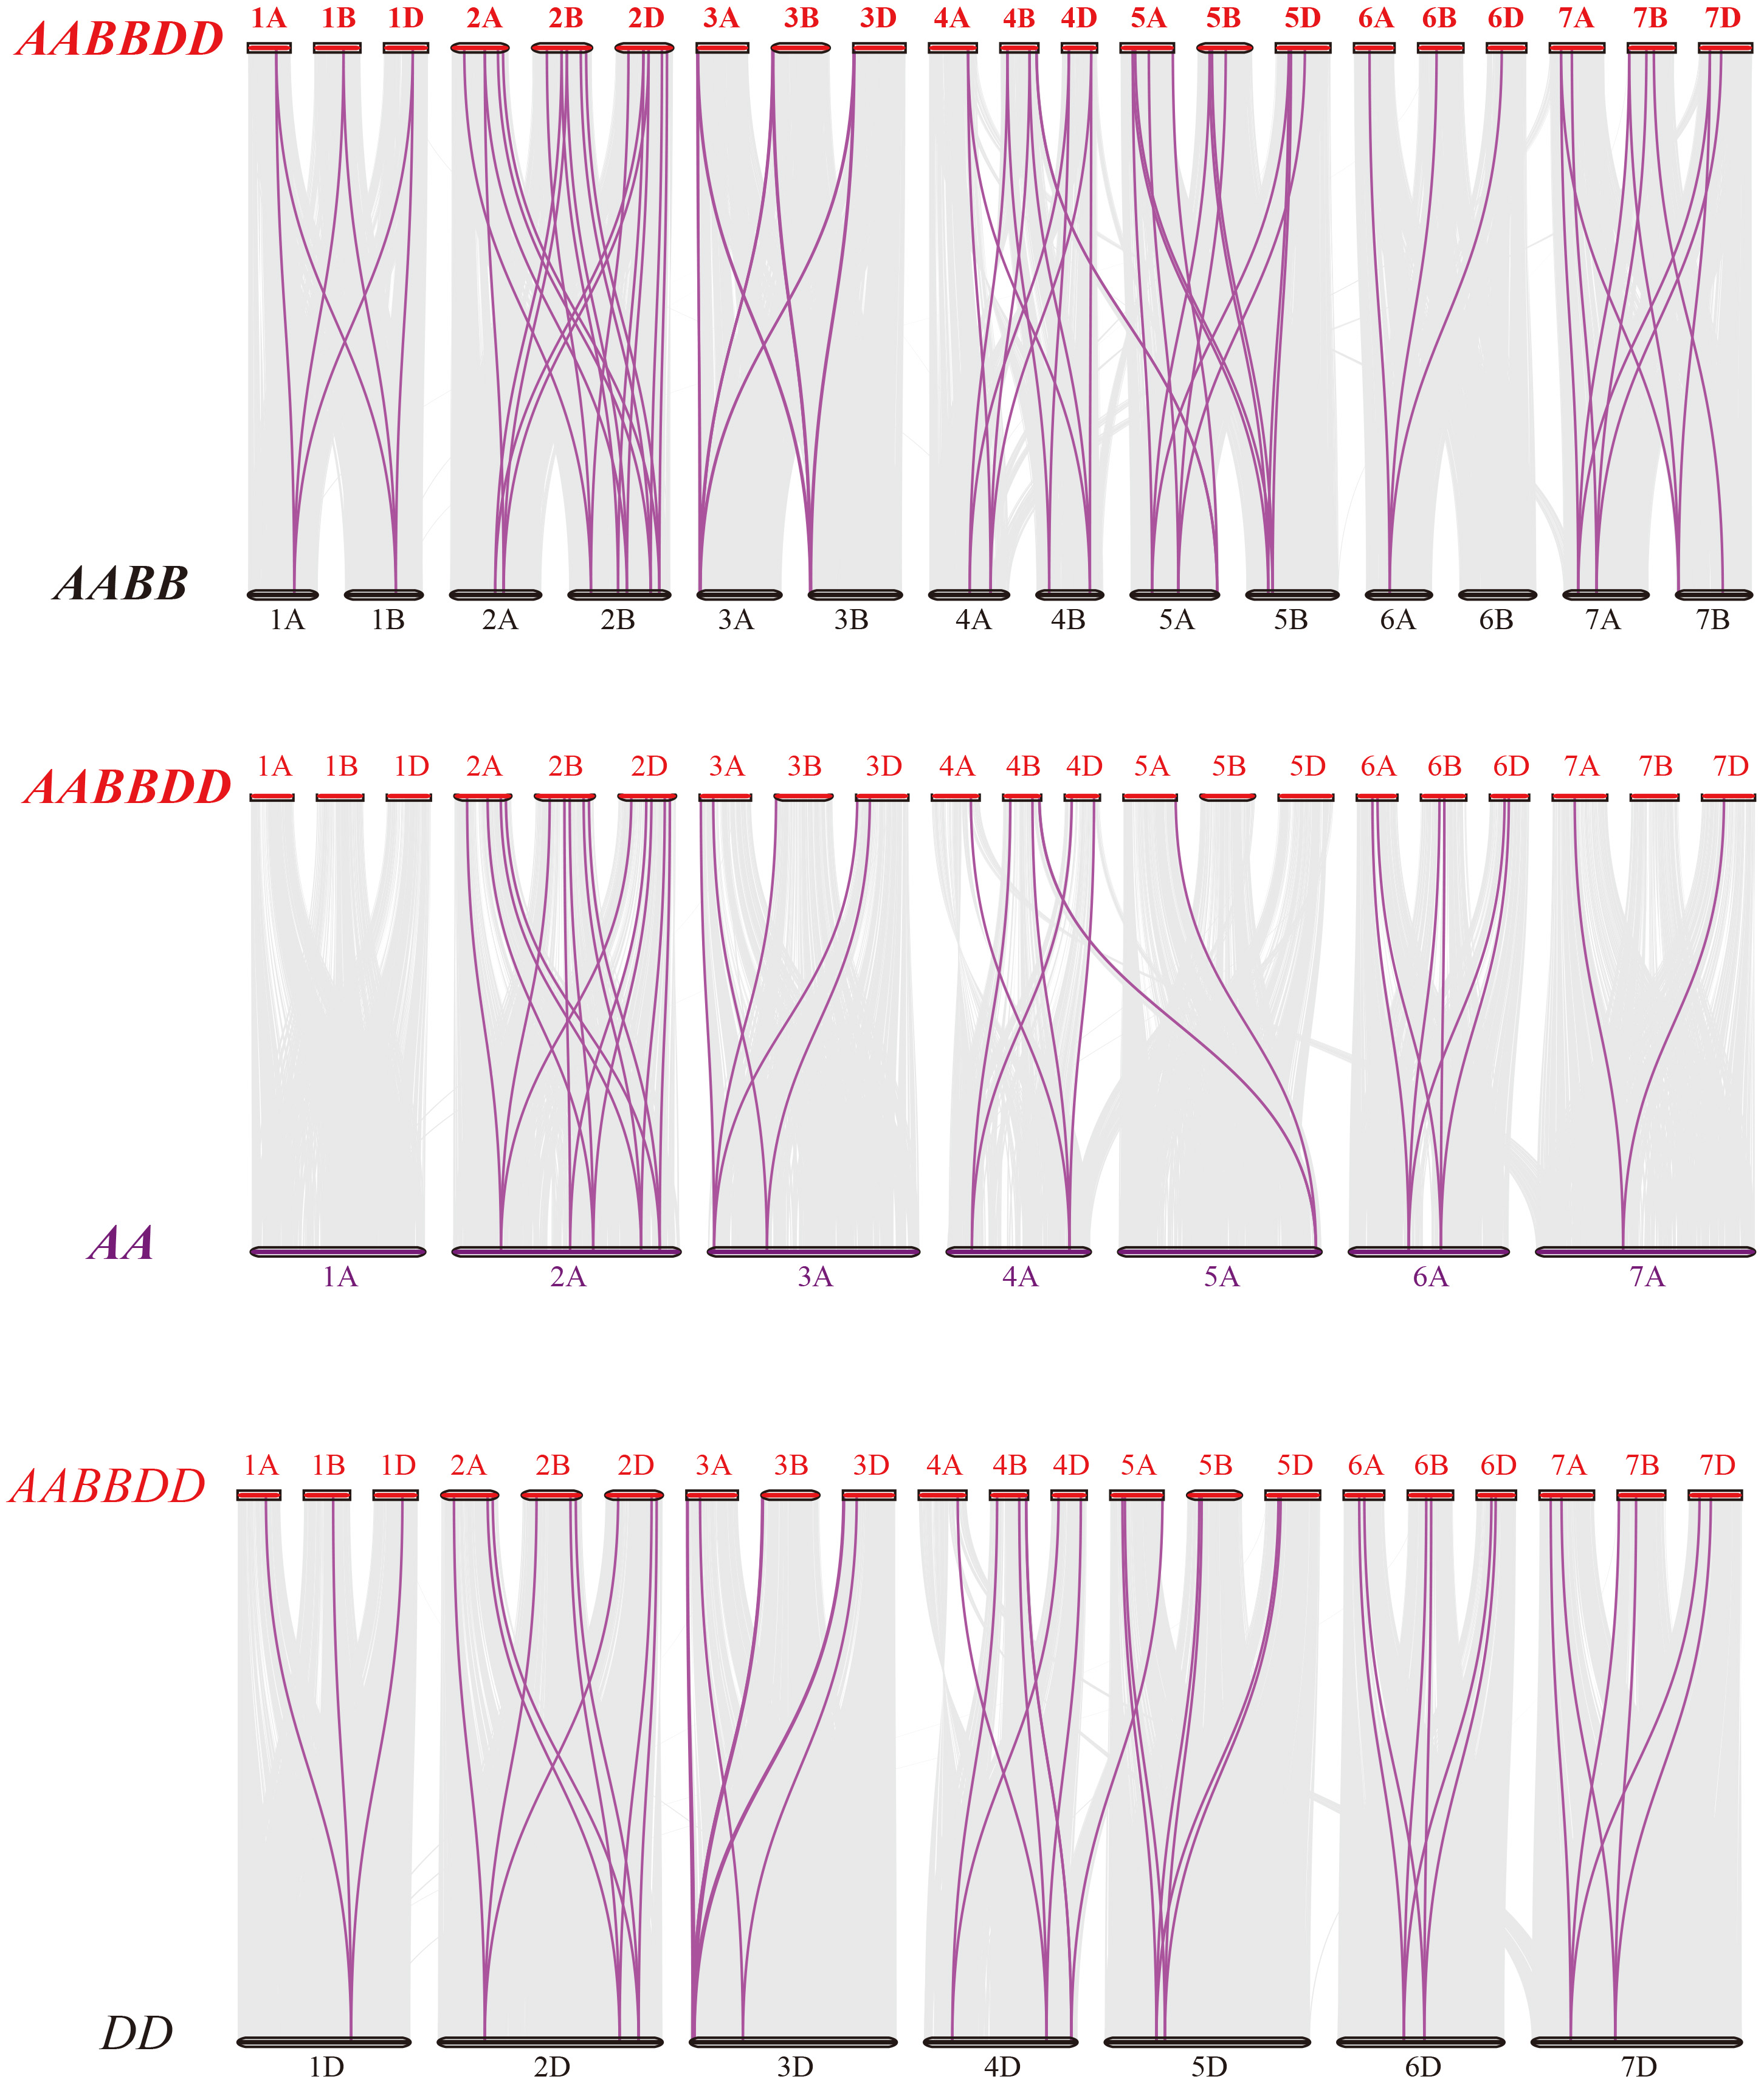
To further elucidate the phylogenetic mechanisms of the wheat PEBP family, we constructed a comparative map of common wheat, T. dicoccoides, T. urartu and Ae. tauschii (Fig. 4). A total of 51 TaPEBP genes were synonymous with T. dicoccoides genes, followed by Ae. tauschii (47) and T. urartu (36) (Table S3). It was found that 25 TaPEBP genes were also present in the three progenitor species, indicating that these genes likely played an important role in the evolution of the PEBP gene family. Interestingly, six PEBP genes identified as paralogs between common wheat and T. dicoccoides were not identified as paralogs between common wheat and T. urartu, suggesting that these paralogous pairs were formed after wheat tetraploidization. In addition, some genes (TaPEBP20/21/43/44/58/61/62/68) in wheat B and D subgenomes formed no homologous gene pairs or showed homologous relationships with other genes in other subgenomes. In addition, 15 wheat specific genes showed no collinearity with the PEBP genes in the donor species, suggesting that these genes are the result of gene loss, gene acquisition or chromosome translocation during wheat polyploidization.
RNA-seq data of TaPEBP genes
Among the 76 TaPEBP genes, 37 showed no expression (TPM<1) in different tissues including root, stem, leaf, spike, embryo, endosperm, seed coat, stigma & ovary and anther, indicating that these genes might be pseudogenes or have a special spatiotemporal expression pattern, which was not detected in the transcriptome data. Of the 39 remaining TaPEBP genes, 36 were expressed in nine different tissues (TPM ≥ 1), and three genes (TaPEBP5, TaPEBP27 and TaPEBP39) showed structural expression (TPM >1) (Fig. S3, Table S4). The TaPEBP gene family members were expressed in different tissues and showed different expression patterns. Expression patterns of genes were similar within subfamilies. Some genes showed preferential expression (TPM >10) in different tissues, such as TFL1-like genes (TaPEBP47/53/56) in the roots, FT-like-1 genes (TaPEBP27/39/67/70/76) and TFL1-like genes (TaPEBP40 and TaPEBP53) in the stem, FT-like-1 gene (TaPEBP27) and PEBP-like genes (TaPEBP1/3/5) in the leaf, MFT-like genes (TaPEBP66/68/71) and PEBP- like genes (TaPEBP1/3/5) in the endosperm, MFT-like genes (TaPEBP66/68), FT-like-1 genes (TaPEBP27/34/39) and PEBP-like genes (TaPEBP1/3) in the seed coat. Additionally, PEBP-like genes (TaPEBP1/3/5), MFT-like genes (TaPEBP25/29/35) and TFL1-like gene (TaPEBP35) were highly expressed in the embryo, whereas the TFL-like gene (TaPEBP20), FT-like-2 gene (TaPEBP27), and PEBP-like gene (TaPEBP5) were highly expressed in the stigma, ovary, spike and anther. All PEBP-like genes (TaPEBP1/3/5) and MFT-like genes (TaPEBP25/28/29/35/66/68/71) showed similar expression patterns during grain development, reaching a peak at 20 DPA, followed by a gradual decline (Fig. S3, Table S4).
We also analyzed the expression profiles of PEBP genes in wheat under biotic and abiotic stresses (Fig. 5). Of the 76 TaPEBP genes, 25 were expressed under one or more stress treatments (TPM >1), and 10 of these genes showed TPM >10 under different stress treatments (Table S4). Most of the TaPEBP genes were not highly expressed. Only PEBP-like and FT-like-3 genes responded significantly to salt stress, while FT-like-2 and FT-like-3 genes responded to drought and heat stresses. The expression of FT-like-3 and FT-like-4 genes changed in response to infection by powdery mildew and stripe rust pathogens. The newly identified PEBP-like genes (TaPEBP1/3/5) were highly responsive to both biotic and abiotic stress treatments (Fig. 5, Table S4).

Figure 5: Expression patterns of TaPEBP genes under various stress treatments.
The heat map generated by TBtools shows the cluster map of TaPEBP genes under powdery mildew, stripe rust, drought, heat, cold and salt treatments. The color gradient (red/white/blue) indicates the gene expression level (from high to low). CK1 is the control of powdery mildew and stripe rust; CK2 is the control of drought and heat treatments; CK3 is the control of cold treatment; CK4 is the control of salt stress treatment. Each subfamily was clustered separately.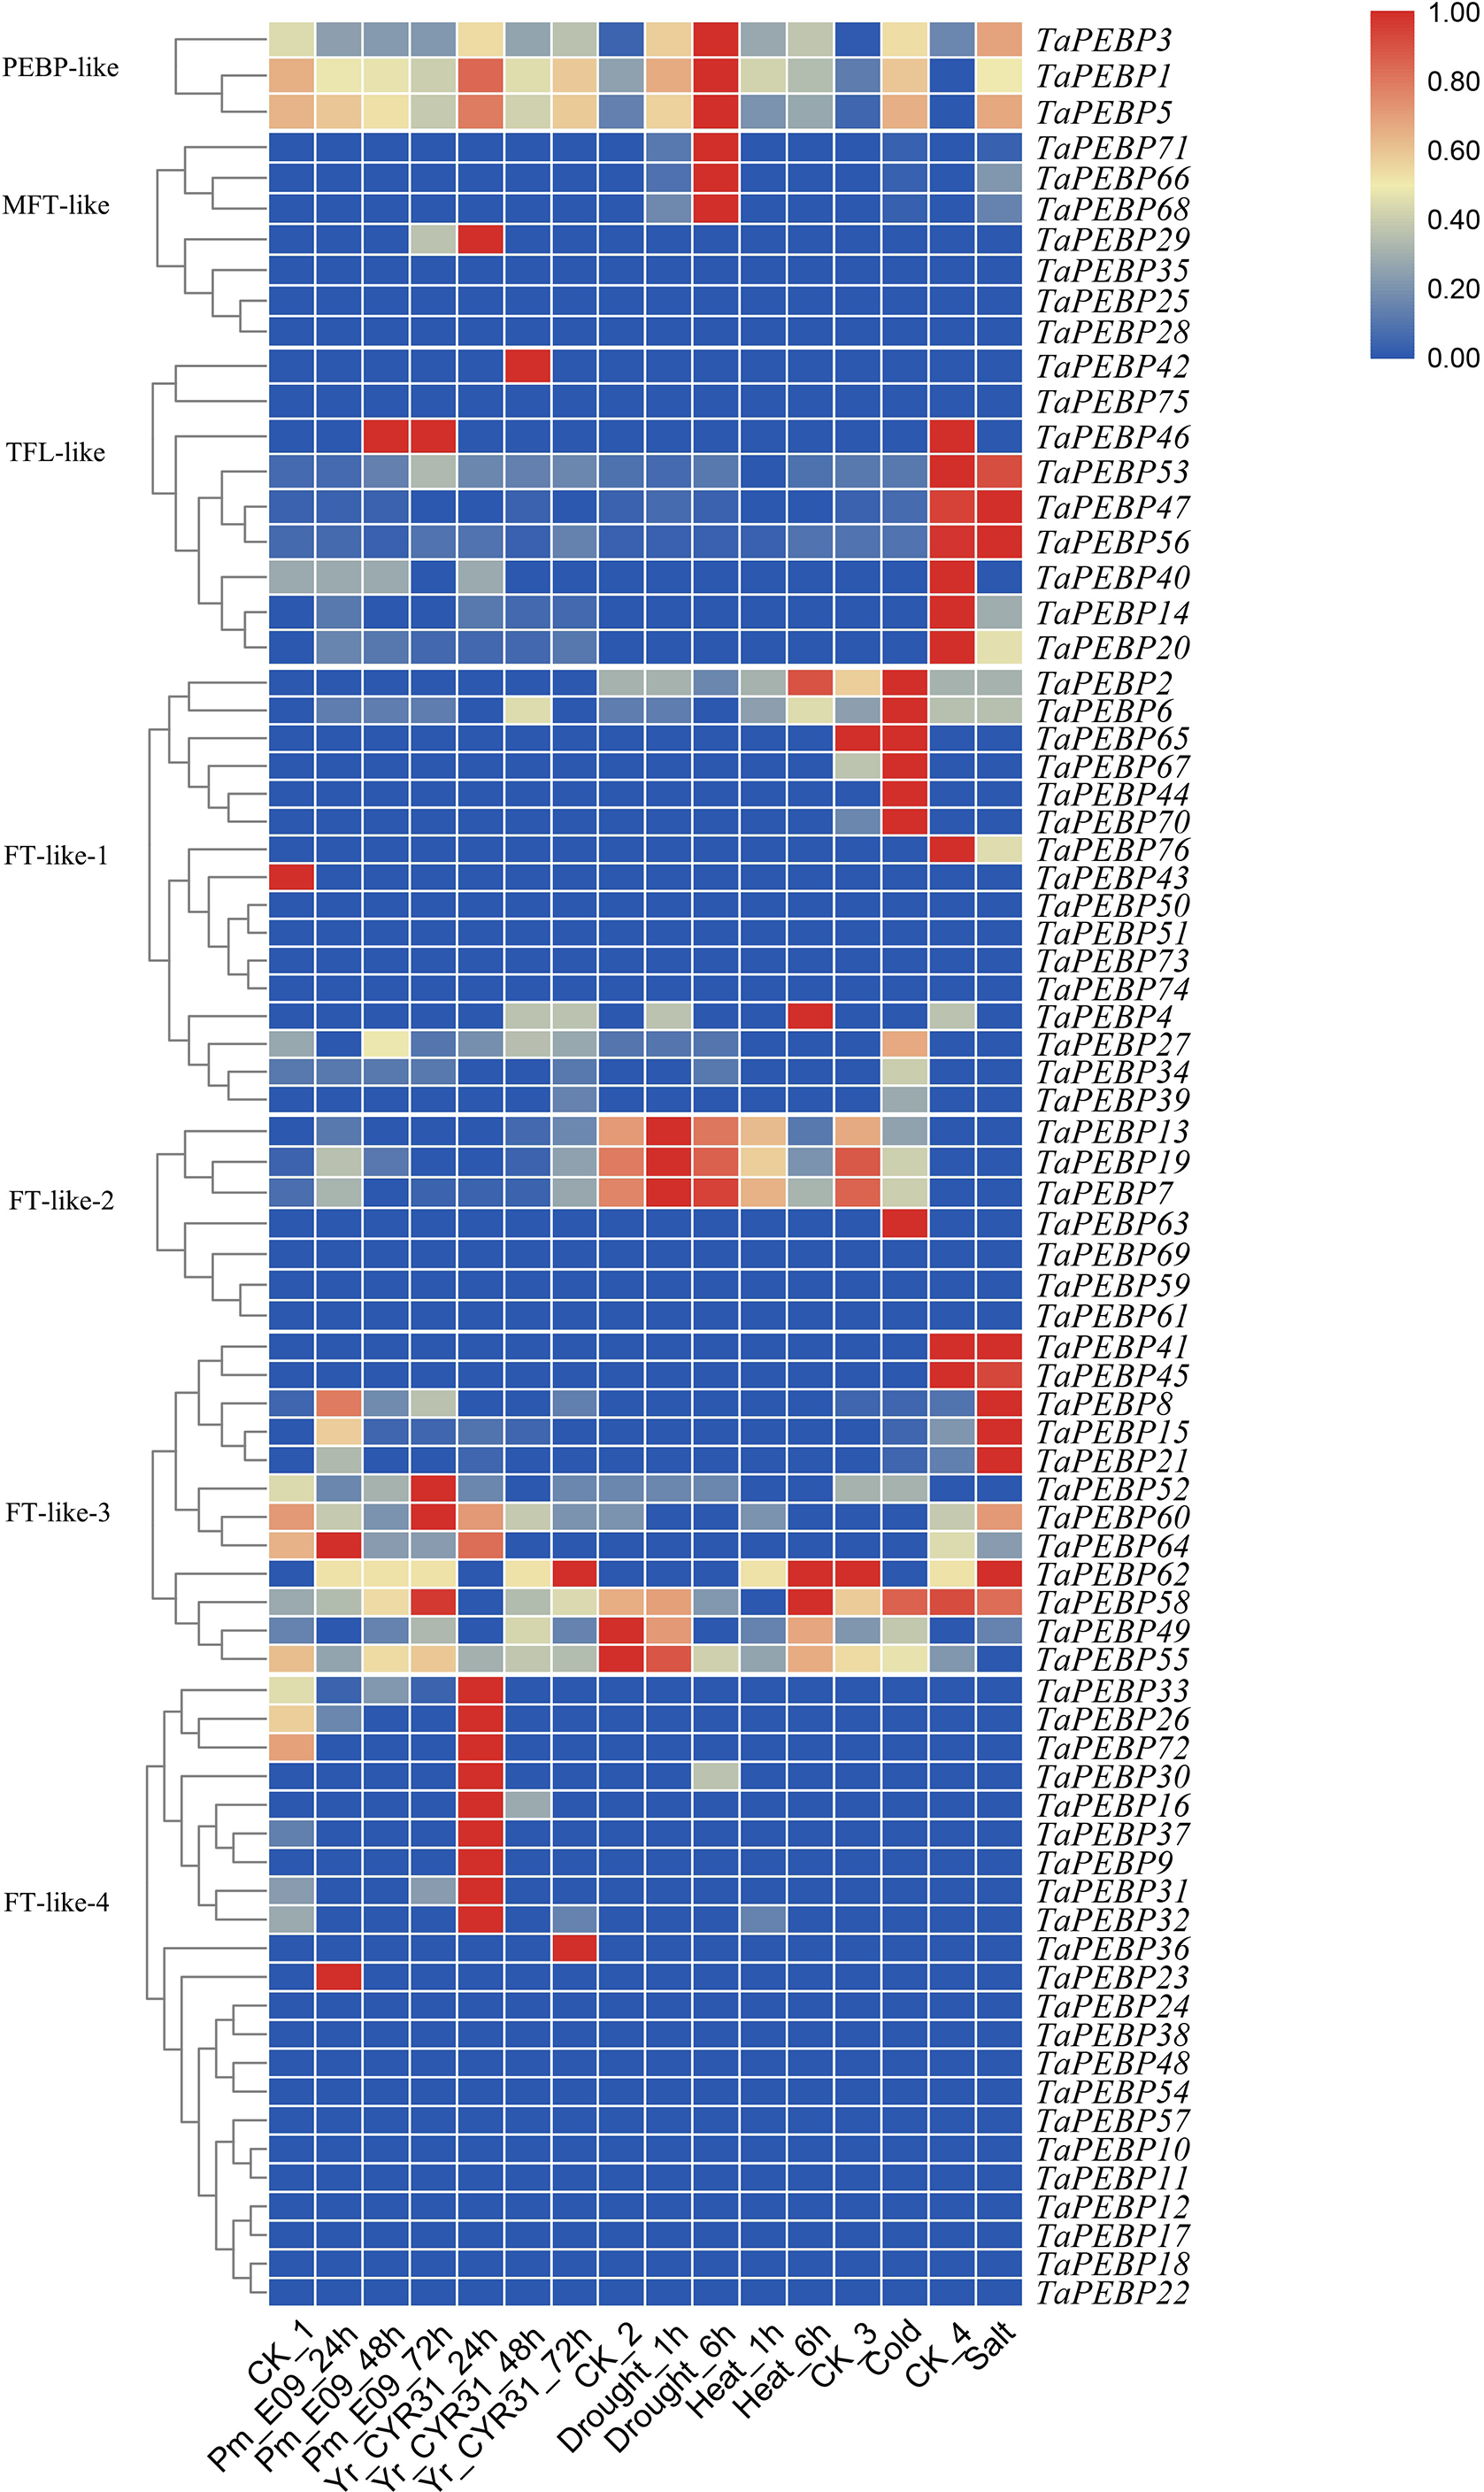
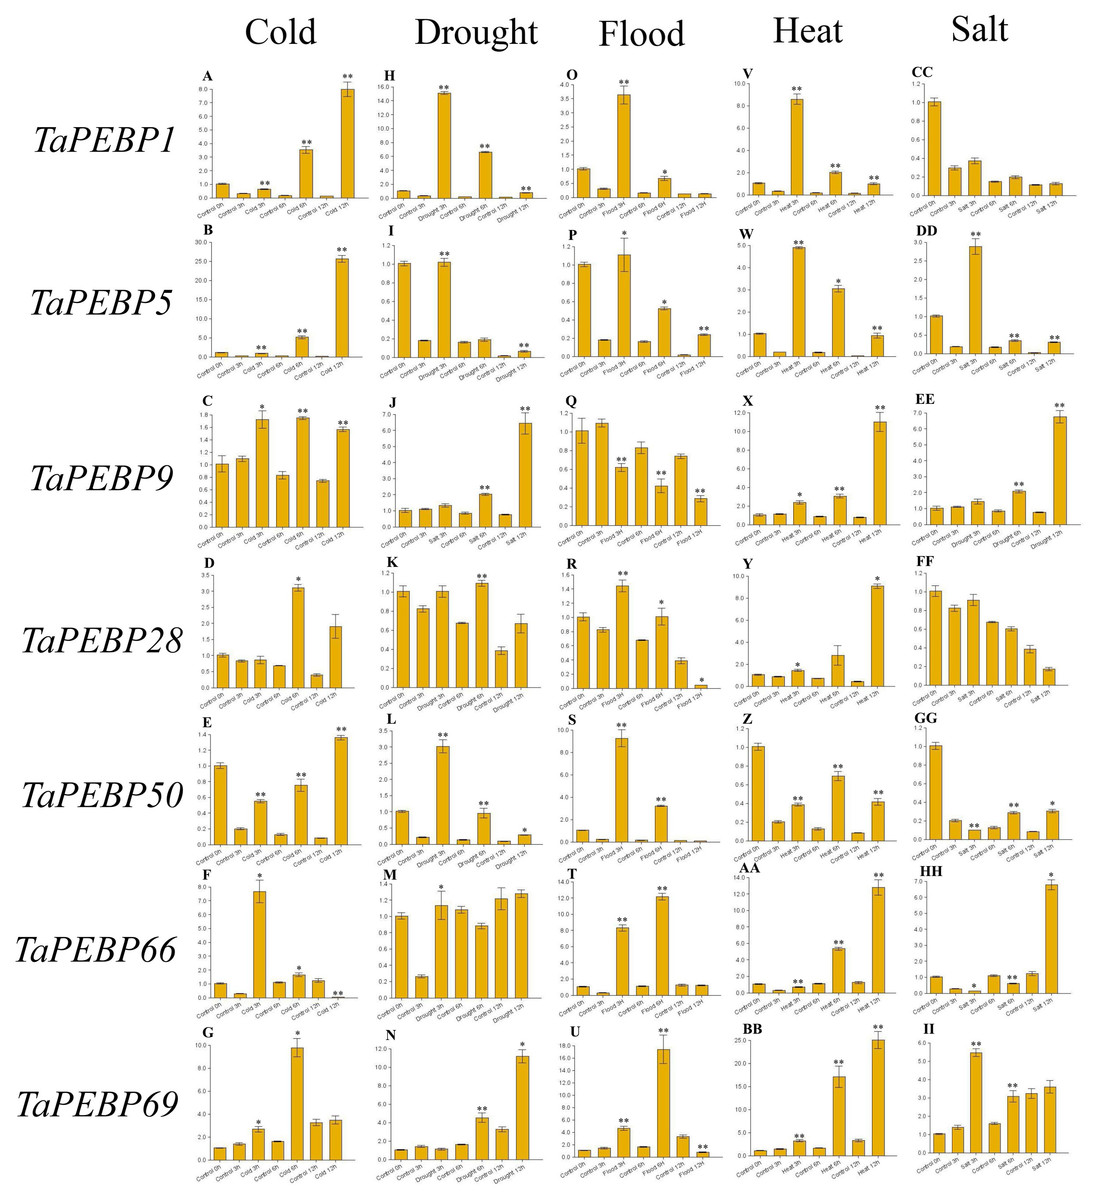
Figure 6: Expression levels of seven PEBP genes in wheat under cold (A–G), drought (H–N), flood (O–U), heat (V-BB), and salt (CC-II) stresses validated by qRT-PCR.
Seeds were treated with cold (four), drought (20% PEG6000), flood, heat (45 °C) and salt (200 mM NaCl), and embryos were sampled at 0, 3, 6 and 12 h. Data represent mean ± standard error (SE) of three biological replicates. Statistically significant differences between the control and treatment groups are indicated using asterisks (* p < 0.05, ** p < 0.01; independent Student’s t-test).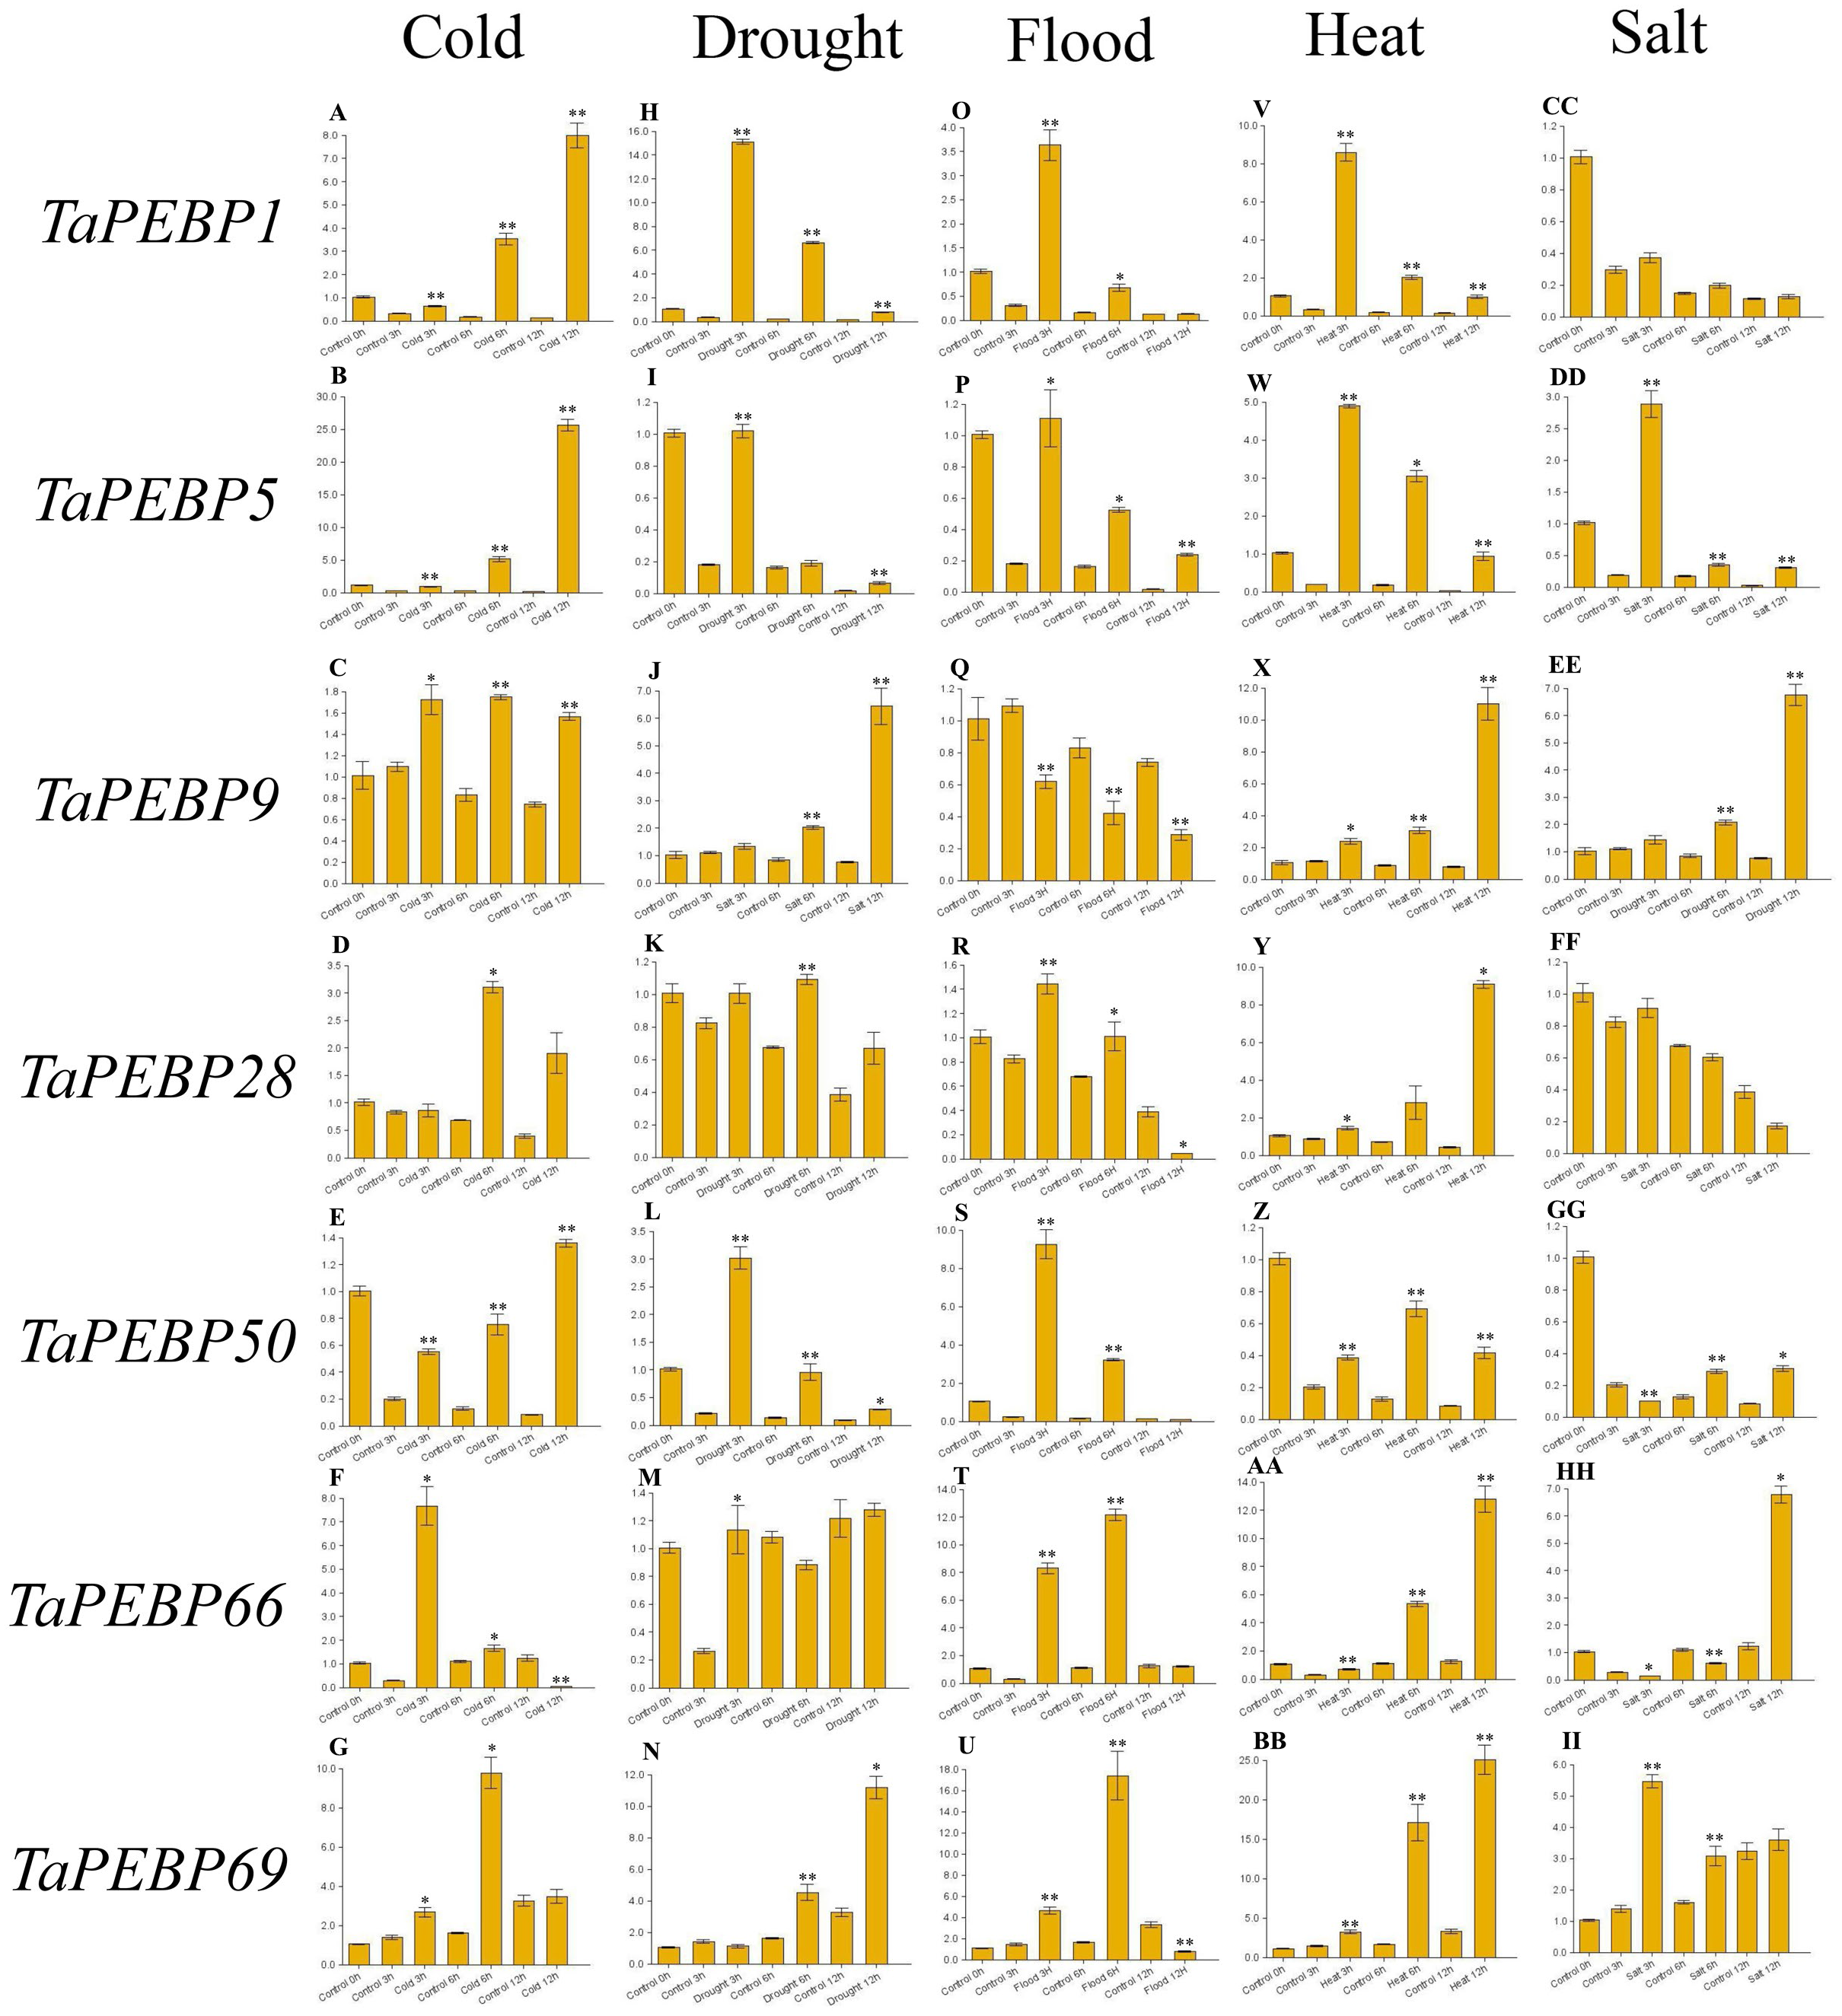
Expression of TaPEBP genes under adverse conditions during seed germination
To study the role of PEBP family genes during seed germination, the expression profiles of seven genes were examined under cold, drought, flood, heat and salt stress treatments by qRT-PCR (Fig. 6, Table S4). Except for TaPEBP1 and TaPEBP28 that showed no expression difference under salt stress, the other genes show differential expression under other treatments. The response patterns of the seven genes to salt stress varied, with TaPEBP5 and TaPEBP50 showed significant expression differences at different time points. Under cold and heat stresses, all seven genes were up-regulated, with the expression patterns of TaPEBP1 and TaPEBP5 were similar in cold and hot conditions, whereas those of TaPEBP9 and TaPEBP66 were similar under heat treatment. Under drought stress, all genes, except TaPEBP66, were up-regulated to varying degrees. The expression patterns of TaPEBP1, TaPEBP5 and TaPEBP50 were the same but opposite to those of TaPEBP9 and TaPEBP69. In the flood treatment, except TaPEBP9, all the other genes were up-regulated, the expression of TaPEBP66 and TaPEBP69 was dynamic, increasing until 6 h and then gradually decreasing. The same TaPEBP gene showed different response to different stress treatments, indicating that the same TaPEBP gene might play different roles under different stresses. In addition to salt treatment, the expression of TaPEBP1 and TaPEBP5 not only changed significantly, but also showed similar trends, indicating that the members of the PEBP-like subfamily were conservative in function.
Discussion
Growing evidence indicates that functional units of PEBP proteins have an ancient common origin, and are significantly related to the growth and development of plants and their seasonal adaptability (Pnueli et al., 1998). Although the importance of the PEBP gene family in cereals has been published previously, wheat PEBP genes were mainly analyzed from public EST data, which was insufficient because of the lack of whole genome sequence of wheat (Chardon & Damerval, 2005). In this study, we address this gap by identifying the entire PEBP gene family in wheat and its progenitor species using whole genome sequences. We analyzed the complete gene and protein structures, evolutionary relationships with Arabidopsis and spatiotemporal gene expression patterns. We identified 76, 38, 16 and 22 PEBP genes in common wheat, T. dicoccoides, T. urartu and Ae. tauschii by genome-wide searches and protein sequence alignments. Phylogenetic analysis revealed that the PEBP genes of common wheat and its progenitor species, unlike those of other plant species, were divided into four subfamilies, PEBP-like, TFL1-like, MFT-like and FT-like, which were different from the three main subfamilies identified by predecessors (Kardailsky et al., 1999). In addition, we identified the PEBP-like gene subfamily in various monocotyledons, including H. vulgare, O. sativa ssp. japonica, S. bicolor, Z. mays and B. distachyon, and dicotyledons such as A. thaliana, Gossypium raimondii, G. max, S. lycopersicum, C. sativus, and N. attenuata. Cluster and motif analyses revealed the PEBP genes of common wheat, T. dicoccoides, T. urartu, Ae. tauschii and the above mentioned species. Although the PEBP-like subfamily genes showed differences between monocotyledons and dicotyledons, the sequences were highly conserved, suggesting that the PEBP-like subfamily performed important functions during evolution. The PEBP-like subfamily was identified in this study for the first time using the HMM model, indicating that the HMM model provides powerful support for the integrity and accuracy of gene families.
The PEBP family is a large taxon in Triticeae crops similar to that in other plant species, with six genes in Arabidopsis, 24 in maize, 23 in soybean, 19 in rice, 12 in tomato, 19 in sorghum, and 20 in Setaria italica (Kardailsky et al., 1999; Liu et al., 2016; Danilevskaya et al., 2008; Wang et al., 2015). In this study, we mapped 71 TaPEBP, 36 TdPEBP, 15 TuPEBP and 22 AetPEBP genes to their respective chromosomes (Fig. 3). Although hexaploid wheat is formed as a result of two hybridization events, the number of PEBP genes in each wheat subgenome is not the same as that in the corresponding progenitor species genomes. Hexaploid wheat is derived from three diploid ancestors through two interspecific crosses. The first hybridization event generated the heterotetraploid species, T. dicoccoides. The number of PEBP genes in the A subgenome of T. dicoccoides (17) increased by two compared with T. urartu (15). The second hybridization event formed the heterohexaploid, in which the number of PEBP genes in the A and B subgenomes increased by four and nine, respectively. In addition, compared with Ae. tauschii, the number of PEBP genes in the D subgenome of common wheat didn’t change, but the number of PEBP genes on 1D, 2D and 3D increased, whereas those on 4D decreased. Doubling of the genome during the formation of hexaploid wheat may be the reason for the increase or loss of PEBP genes. A total of 13 TaPEBP duplicated genes were detected in common wheat, including six pairs of segmentally duplicated genes and seven tandemly duplicated genes (Fig. 3, Table 2, Fig. S2), indicating that both tandem and segmental duplications contributed to the evolution and increase of TaPEBP genes in common wheat, however, these tandem repeat genes are not expressed in different tissues and stress treatments, which might be caused by the spatiotemporal expression of genes and some of the specific period or process were not involved in our study (Fig. 5, Fig. S3, Table S4).
The ratio of TFL1-like: MFT-like: FT-like genes was 4:2:13 and 6:3:15 in rice and maize, respectively (Chardon & Damerval, 2005; Danilevskaya et al., 2008), but 2:3:11, 3:6:27, 2:3:16 and 7:9:56 in T. urartu, T. dicoccoides, Ae. tauschii and common wheat, respectively, indicating that the FT-like genes in common wheat and its progenitor species increased in numbers compared with rice and maize. An ancient whole genome duplication (WGD) event has been reported in the ancestors of existing angiosperms, which resulted in duplicate copies of each gene including flowering regulatory genes (Jiao et al., 2011; Jiao et al., 2014). In the PEBP subfamily, new gene duplication or genome duplication is often detected in angiosperms and gymnosperms. All monocotyledons underwent ancestral replication events during early evolution, which coincided with the new discovery of ancient WGD events before the divergence between Gramineae and Archaea (Jiao et al., 2014). Most dicot species have no more than 10 PEBP genes. Compared with similar species, these species have been shown to experience additional WGD events. For example, in Brassicales, Brassica experienced an additional recent genome-wide triplication (WGT) event compared with Arabidopsis (Liu et al., 2016). Similarly, WGDs may also promote the diversity of PEBP genes in soybean and apple (Malus domestica) (Liu et al., 2016; Wang et al., 2015). Therefore, in combination with the divergence time of tandem repeat genes, multiple WGD events during evolution are undoubtedly responsible for the large number of PEBP genes in common wheat.
The tissue/organ-specific expression pattern usually reflects the corresponding biological function of a gene. The RNA-seq data of different wheat tissues showed that FT-like-1 genes (TaPEBP27/39/67/70/76) and TFL1-like genes (TaPEBP40 and TaPEBP53) were highly expressed in the stem, MFT-like genes (TaPEBP66/68/71) and PEBP-like genes (TaPEBP1/3/5) in the endosperm, TaPEBP25, TaPEBP29 and TaPEBP35 in the embryo, MFT-like genes (TaPEBP66/68), FT-like-1 genes (TaPEBP27/34/39) and PEBP-like genes (TaPEBP1/3) in the seed coat and PEBP-like gene (TaPEBP5) in the anther. Some PEBP genes are not expressed in any tissues, it is possible that these genes have tissue-specific and time- specific expression pattern and the current RNA-seq data didn’t reveal the expression pattern of these special genes/tissue/time. These results suggest that PEBP genes play different roles at different stages during plant growth and development (Karlgren et al., 2011; Kikuchi et al., 2009).
The expression profiles of TaPEBP genes under biotic and abiotic stresses were also investigated (Fig. 5). The expression of FT-like-3 and FT-like-4 genes changed in response to infection by powdery mildew and stripe rust pathogens. Genes in FT-like-2 and FT-like-3 classes responded to drought and heat. PEBP-like genes (TaPEBP1, TaPEBP3 and TaPEBP5) were up-regulated in response to stripe rust, drought, heat and cold treatments, and these results were confirmed by qRT-PCR, indicating that the PEBP family plays an important role in biotic and abiotic stress responses. Our findings are consistent with those obtained in previous studies, including genes such as TaFT3 (TaPEBP2), VRN3 (TaPEBP67) and TaPHS1 (TaPEBP25) (Fang et al., 2019; Hamoud et al., 2016; Ryu, Park & Seo, 2011; Liu et al., 2013). In this study, some of the results of qRT-PCR and RNA-seq are inconsistent, which may be caused by the inconsistency of materials. However, we still found some genes showed consistent expression among different species, such as TaPEBP25, which was consistent with that of Arabidopsis (AtMFT), and TaPEBP67, which was consistent with that of HvFT1 and HvFT2 in barley and Hd3a in rice, suggesting the functional conservation of PEBP gene in the evolution process (Xi et al., 2010; Liu et al., 2013; Kikuchi et al., 2009; Kojima et al., 2002). The newly discovered PEBP-like genes were not only expressed in response to abiotic and abiotic stresses such as cold, drought, salt and stripe rust, but were also highly expressed in leaves and grains, and reaching a peak at 20 DPA (Fig. S3), suggesting that the PEBP-like subfamily plays an important role in disease resistance, stress tolerance and grain development in wheat, although the specific functions of these genes need to be further investigated.
Conclusion
Our results provide new evidence for further understanding the structure, evolution and function of PEBP family genes in common wheat and its progenitor species. Furthermore, the results of this study provide a basis for further understanding the role of TaPEBP genes in the vegetative-to-reproductive phase transition and grain dormancy as well as seed germination under adverse conditions.
Supplemental Information
Identification of PEBP protein in wheat, its progenitors and Arabidopsis
Collinearity analysis of PEBP genes between wheat and its progenitor species
The expression data of PEBP genes in different tissues, multiple stress treatments and RT-qPCR
Cluster and motif analyses of PEBP- like genes in monocotyledons and dicotyledons
Different colored boxes indicate different motifs, and motifs in each gene are indicated in the colored boxes. In addition, species with black gene IDs are monocotyledons, and those with red gene IDs are dicotyledons.
Gene duplication identified in wheat.
Seven chromosomes in each subgenome of wheat (A, B and D) are indicated in different colors. Duplicated gene pairs are connected with lines of the corresponding color.
Expression analysis of TaPEBP genes in nine different tissues and in grains at different developmental stages
Heatmap generated using TBtools shows the cluster map of TaPEBP genes in roots, stem, leaf, spike, embryo, endosperm, seed coat, stigma & ovary, anther and grain (at 10, 20 and 30 days post anthesis [DPA]). The color gradient (red/white/blue) indicates the gene expression level (from high to low). Each subfamily formed a separate cluster.