
Clinical and prognostic relevance of CXCL12 expression in acute myeloid leukemia
- Published
- Accepted
- Received
- Academic Editor
- Ulrich Pfeffer
- Subject Areas
- Bioinformatics, Hematology, Oncology, Medical Genetics
- Keywords
- CXCL12, SDF-1, CXCR4, Gene expression, Prognosis, AML
- Copyright
- © 2021 Wang et al.
- Licence
- This is an open access article distributed under the terms of the Creative Commons Attribution License, which permits unrestricted use, distribution, reproduction and adaptation in any medium and for any purpose provided that it is properly attributed. For attribution, the original author(s), title, publication source (PeerJ) and either DOI or URL of the article must be cited.
- Cite this article
- 2021. Clinical and prognostic relevance of CXCL12 expression in acute myeloid leukemia. PeerJ 9:e11820 https://doi.org/10.7717/peerj.11820
Abstract
Background
Accumulating studies have been made to understand the association between CXC chemokine ligand-12 (CXCL12)/CXC chemokine receptor 4 (CXCR4) and acute myeloid leukemia (AML). However, large-scale data analysis of potential relationship between CXCL12 and AML remains insufficient.
Methods
We collected abundant CXCL12 expression data and AML samples from several publicly available datasets. The CIBERSORT algorithm was used to quantify immune cell fractions and the online website of STRING was utilized for gene ontology (GO) enrichment and Kyoto Encyclopedia of Genes and Genomes (KEGG) analysis. The statistical analysis and graphical work were mainly performed via the R software.
Results
CXCL12 expression was extremely down-regulated in AML. Clinically, low CXCL12 expression was correlated with higher white blood cells (WBCs) (P < 0.0001), more blasts in bone marrow (BM) (P < 0.001) and peripheral blood (PB) (P < 0.0001), FLT3-internal tandem duplications (FLT3-ITD) (P = 0.010) and NPM1 mutations (P = 0.015). More importantly, reduced CXCL12 expression predicted worse overall survival (OS) and event-free survival (EFS) in all AML, non-M3-AML, and cytogenetically normal (CN)-AML patients in three independent cohorts. As for immune cell infiltration, high CXCL12 expressed groups tended to harbor more memory B cells and plasma cells infiltration while low CXCL12 expressed groups exhibited more eosinophils infiltration. GO enrichment and KEGG pathways analysis revealed the potential biological progress the gene participating in.
Conclusions
CXCL12 is significantly down-regulated in AML and low CXCL12 expression is an independent and poor predictor of AML prognosis. CXCL12 expression level correlates with clinical and immune characteristics of AML, which could provide potential assistance for treatment. Prospective studies are needed to further validate the impact of CXCL12 expression before routine clinical application in AML.
Introduction
Acute myeloid leukemia (AML) represents a heterogeneous disease characterizing by complex molecular signatures, complicated pathogeny and aggressive progression, as well as a poor clinical outcome (Döhner, Weisdorf & Bloomfield, 2015). Bone marrow (BM) microenvironment contributes significantly to leukemogenesis and leukemia progression (Ayala et al., 2009; Meads, Hazlehurst & Dalton, 2008). Most adult patients are still terribly suffering from AML, even though tremendous advancements such as novel chemotherapy drugs and hematopoietic stem cell transplantation (HSCT) have been achieved recently (Döhner et al., 2017; Döhner, Weisdorf & Bloomfield, 2015). Until now, chromosome aberration analysis remains the main method for diagnosis, classification, prognosis, and guiding clinical therapy while 40–50% of patients lack representative chromosome aberrations (Mrózek, Heerema & Bloomfield, 2004). Therefore, it is necessary to discover more specific and accurate biomarkers for AML. In recent years, immunophenotype and cytochemistry analysis are found valuable in the diagnosis of AML, and immunophenotyping surface type molecules like CD123, CD45, CD34, CD38 have been reported to help confirm the diagnosis of AML (Prada-Arismendy, Arroyave & Röthlisberger, 2017). Additionally, it is now evident that oncogene mutations affect the progression of AML and some of these mutated genes are FLT3, NPM1 and CEBPA (Grove & Vassiliou, 2014; Meyer & Levine, 2014). Unfortunately, despite extensive researches that have been carried out to find prognostic biomarkers, AML is still a tough disease with a variable prognosis and poor survival rate, with 5-year overall survival less than 50% and even lower in the elderly (Kell, 2004). Considering all the above, further studies are essential for a better understanding of how various factors contribute to the disease progression.
Chemokines and their receptors mediate crucial biological functions of tumor progression including leukocyte recruitment and function, cellular senescence, tumor cell proliferation and survival, and invasion and metastasis (Mantovani et al., 2010). CXC chemokine ligand-12 (CXCL12), also known as stromal cell-derived factor-1 (SDF-1), is a CXC chemokine that belongs to the large family of chemotactic cytokines. The protein, functioning through its receptor CXC chemokine receptor 4 (CXCR4), plays an important role in hematopoietic cell development, immune system foundation, and retention of hematopoietic stem and progenitor cells in the BM microenvironment (Janssens, Struyf & Proost, 2018). CXCL12 expression has been found to be related to at least 23 different types of tumors (Balkwill, 2004) and the gene’s critical influences on solid tumors have been illustrated in prostate cancer (Taichman et al., 2002), non-small cell lung cancer (Phillips et al., 2003), renal cell carcinoma (Pan et al., 2006) and so on. As for hematological malignancies, CXCL12 is reported to be overexpressed in chronic lymphocytic leukemia (CLL) (Möhle et al., 1999), as well as in childhood acute lymphoblastic leukemia (Crazzolara et al., 2001). Also, Spoo et al. (2007) have proved that elevated CXCR4 expression is relevant to inferior prognosis of AML in adult patients (Konoplev et al., 2007; Rombouts et al., 2004; Spoo et al., 2007). All these findings may contribute to a better understanding of CXCL12’s potential mechanism and clinical relevance in both solid tumors and blood cancers.
Despite enormous progress having been made to understand the relationship between CXCR4 and AML, studies concentrating on CXCL12 and AML remain insufficient, and large-scale analysis of the potential association between the gene and AML hasn’t been performed before. Herein, we adopted similar methods of our previous research (Xu et al., 2019) and made comprehensive analyses of the gene’s possible interaction with AML using public datasets, trying to reveal the implication of CXCL12 expression in AML and providing potential treatment strategies for the clinic.
Materials & Methods
Patients and database
We used six publicly available datasets from Gene Expression Omnibus (GEO, http://www.ncbi.nlm.nih.gov/geo/) and The Cancer Genome Atlas (TCGA, https://cancergenome.nih.gov/) in this study. Of these datasets, three of them consist of expression data for bulk primary AML samples (the TCGA dataset, GSE6891 and GSE10358), two involve expression data for healthy and AML bone marrow samples (GSE30029 and GSE63270) and one includes expression data for major hematopoietic lineages during the differentiation (GSE42519), respectively. Expression data for FAB AML subtypes and patient characteristics were acquired from TCGA sequencing data. Normal mRNA expression data from Genotype-Tissue Expression (GTEx) database and pan-cancer cell line sequencing data from Broad Institute Cancer Cell Line Encyclopedia (CCLE) database were extracted through their portal websites for analysis.
Estimation of immune cell fractions
The CIBERSORT algorithm (https://cibersort.stanford.edu/index.php) was used to quantify immune cell fractions according to the expression pattern of CXCL12. More detailed information for this method is available in Newman AM et al.’s introduction (Newman et al., 2015). Immune cells calculated in this study contains B cells (including B cells memory and B cells naive), T cells (including CD8+ T cells, CD4+ naive T cells, CD4+ memory resting T cells, CD4+ memory activated T cells, follicular helper T cells, regulatory T cells and T cells gamma delta), macrophage (including M0 macrophage, M1 macrophage, and M2 macrophage), NK cells (including NK cells resting and NK cells activated), dendritic cells (including dendritic cells resting and dendritic cells activated), mast cells (including mast cells resting and mast cells activated), plasma cells, monocyte, eosinophils, and neutrophils. Multiple immune infiltration deconvolution methods including TIMER, quanTIseq, xCell, MCP-counter and EPIC were achieved from their websites.
Statistical analysis and bioinformatics
Low and high CXCL12 expressers were discriminated against based on the median expression level of the gene. Analyses of patient characteristics and survival were described previously (Xu et al., 2019). Differential expression was analyzed using ‘limma’ or ‘edgeR’ R package. The Pearson Correlation coefficient (denoted as Cor) was calculated to assess whether there was a correlation between cell infiltration and CXCL12 expression. Moreover, ‘ggplot2’ and ‘ggpubr’ R packages were applied for visualizing the results of data analysis. The single-cell correlation analysis of CXCL12 was conducted using single-cell data sequenced by Van Galen et al. (2019), and the published scRNA-seq dataset was downloaded from GEO: GSE116256. And gene ontology (GO) enrichment and Kyoto encyclopedia of genes and genomes (KEGG) analysis were conducted using the online website of STRING (http://string-db.org). One-way ANOVA was used to test for differences among at least three groups and the Wilcoxon test was used to determine differences in each two-group comparison. All statistical analyses and figure plotting were performed using the R software version 3.5.3 (https://www.r-project.org/). All differences were considered statistically significant at the level of P < 0.05.
Results
A systematic overview of differential genes and cytokines in AML
Initially, we systematically analyzed a total of 261 cytokine and cytokine receptor genes (Supplemental Data 1) in AML patients and normal controls utilizing GSE30029, and all genes were screened in Supplemental Data 2 with the difference considered significant if adjusted p-value < 0.05 and |logFC| > 0. As obviously displayed in Fig. 1A, the CXCL12 gene was one of the most significantly different genes between AML patients and normal controls. Then, we further verified the differences in GSE63270 (Fig. 1B, Supplemental Data 3). The top 50 genes with significant differences were extracted from two analytic results respectively and then intersected. The common 11 genes included CXCL12, TNFRSF10B, IL1RAP, IL12RB1, IL3RA, CSF2RA, EPOR, TNFSF14, IL18BP, TNFRSF4 and IL2RG. Furthermore, considering the essential functions of CXCL12 in AML, we ultimately decided to study CXCL12 in detail.
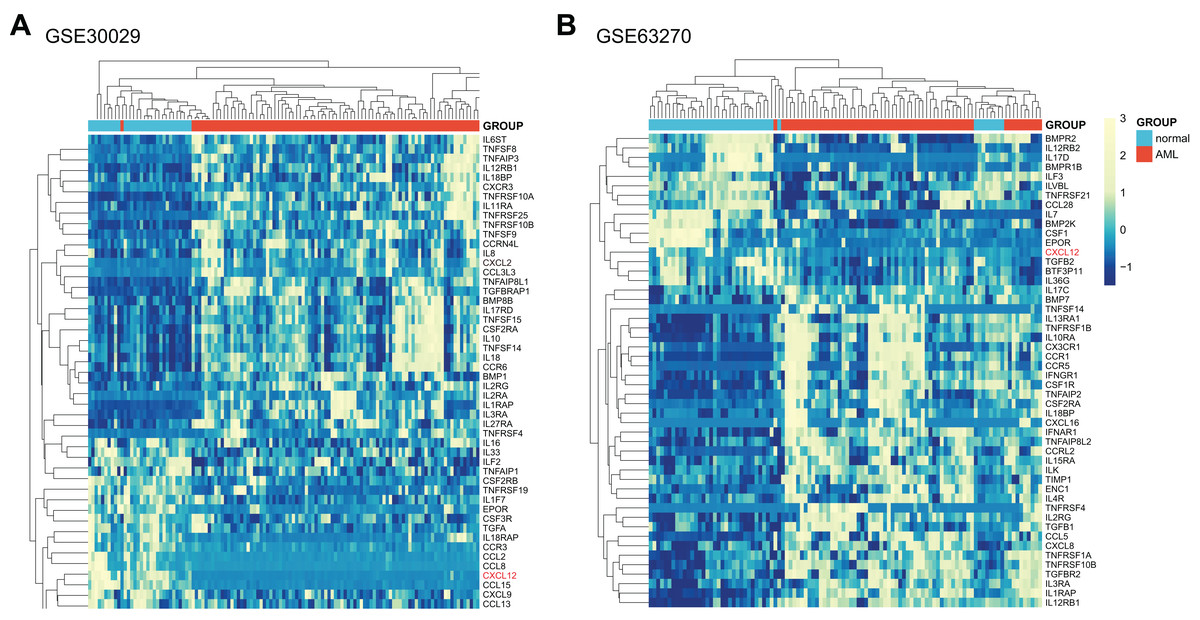
Figure 1: Expression heat map of differentially expressed cytokine and cytokine receptor genes between AML patients and normal controls.
(A) Differentially expressed genes between AML patients and normal controls in GSE30029. (B) Differentially expressed genes between AML patients and normal controls in GSE63270. Only the top 50 genes were shown if adjusted p-value < 0.05 and |logFC| > 0.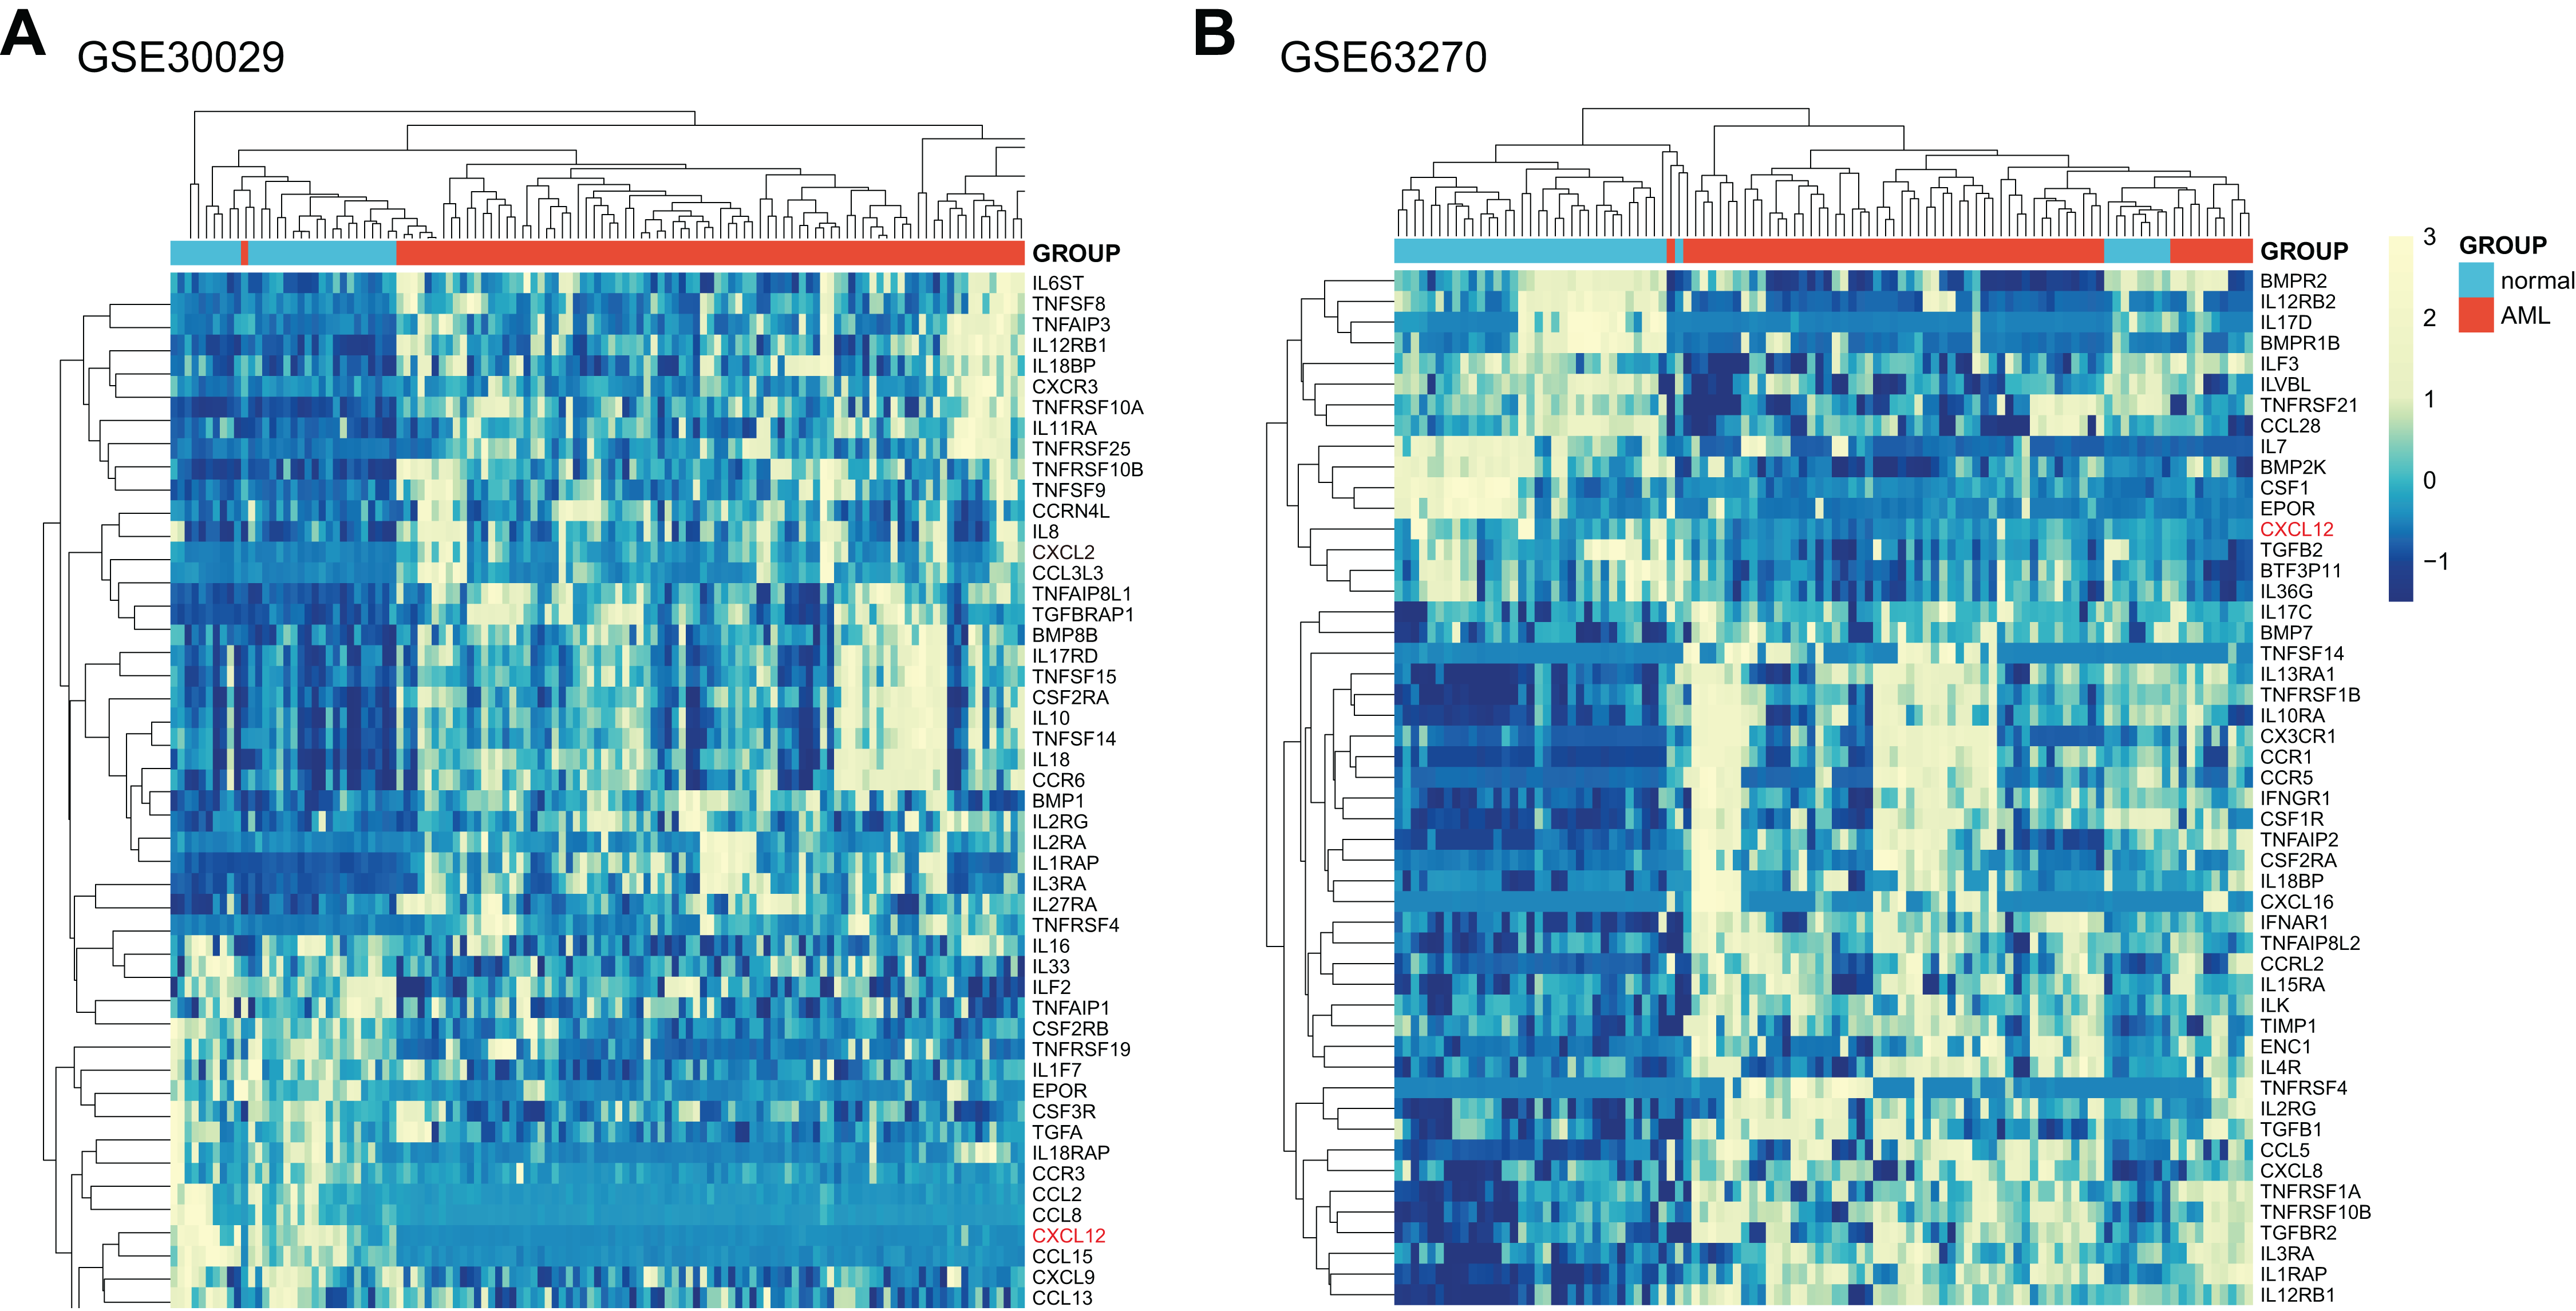
CXCL12 expression is different among normal tissues and various carcinomas
To explore how CXCL12 is expressed across various tissues in healthy people, we analyzed the mRNA expression status utilizing the GTEx database (Fig. 2A, Supplemental Data 4). Apparently, CXCL12 expression was extremely low in blood and bone marrow while it was much higher among other normal tissues. It was also worth mentioning that the brain, stomach, and testis showed a relatively low level of CXCL12 expression compared with other tissues. More importantly, when analyzing different cancer cell lines (Supplemental Data 5), we found CXCL12 was lowly expressed among most hematopoietic neoplasms, especially in AML and chronic myelocytic leukemia (CML). Interestingly, cervix cancer cells showed exclusively lower CXCL12 expression levels than AML and CML, as shown in Fig. 2B.
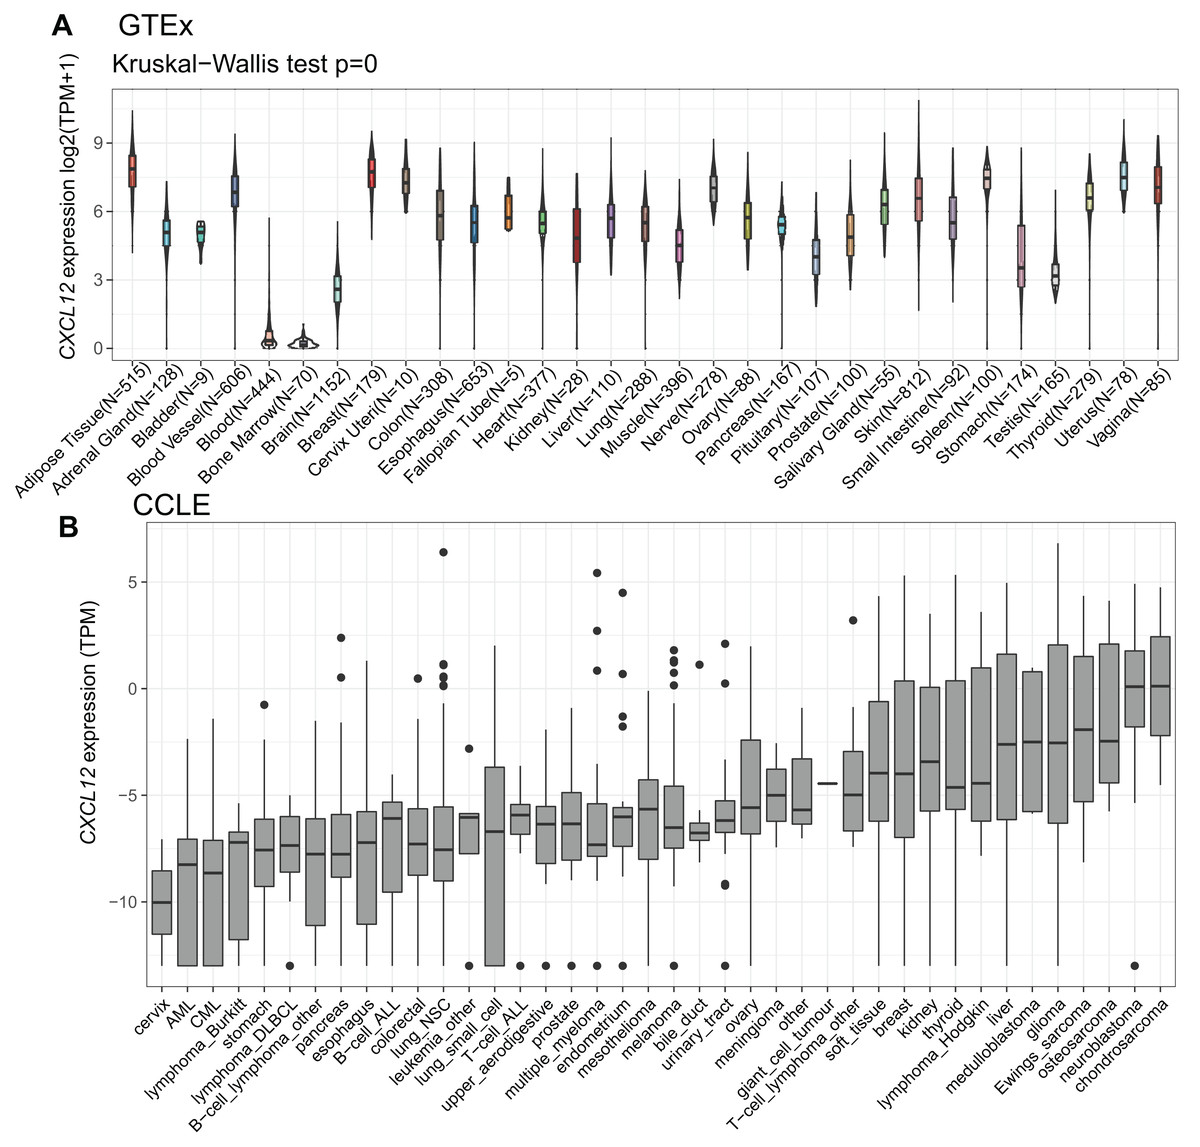
Figure 2: mRNA expression levels of CXCL12 from different tissue origins and tumors.
(A) mRNA expression levels of CXCL12 in different tissues from the GTEx database. (B) mRNA expression levels of CXCL12 in various tumor cell lines from the CCLE database.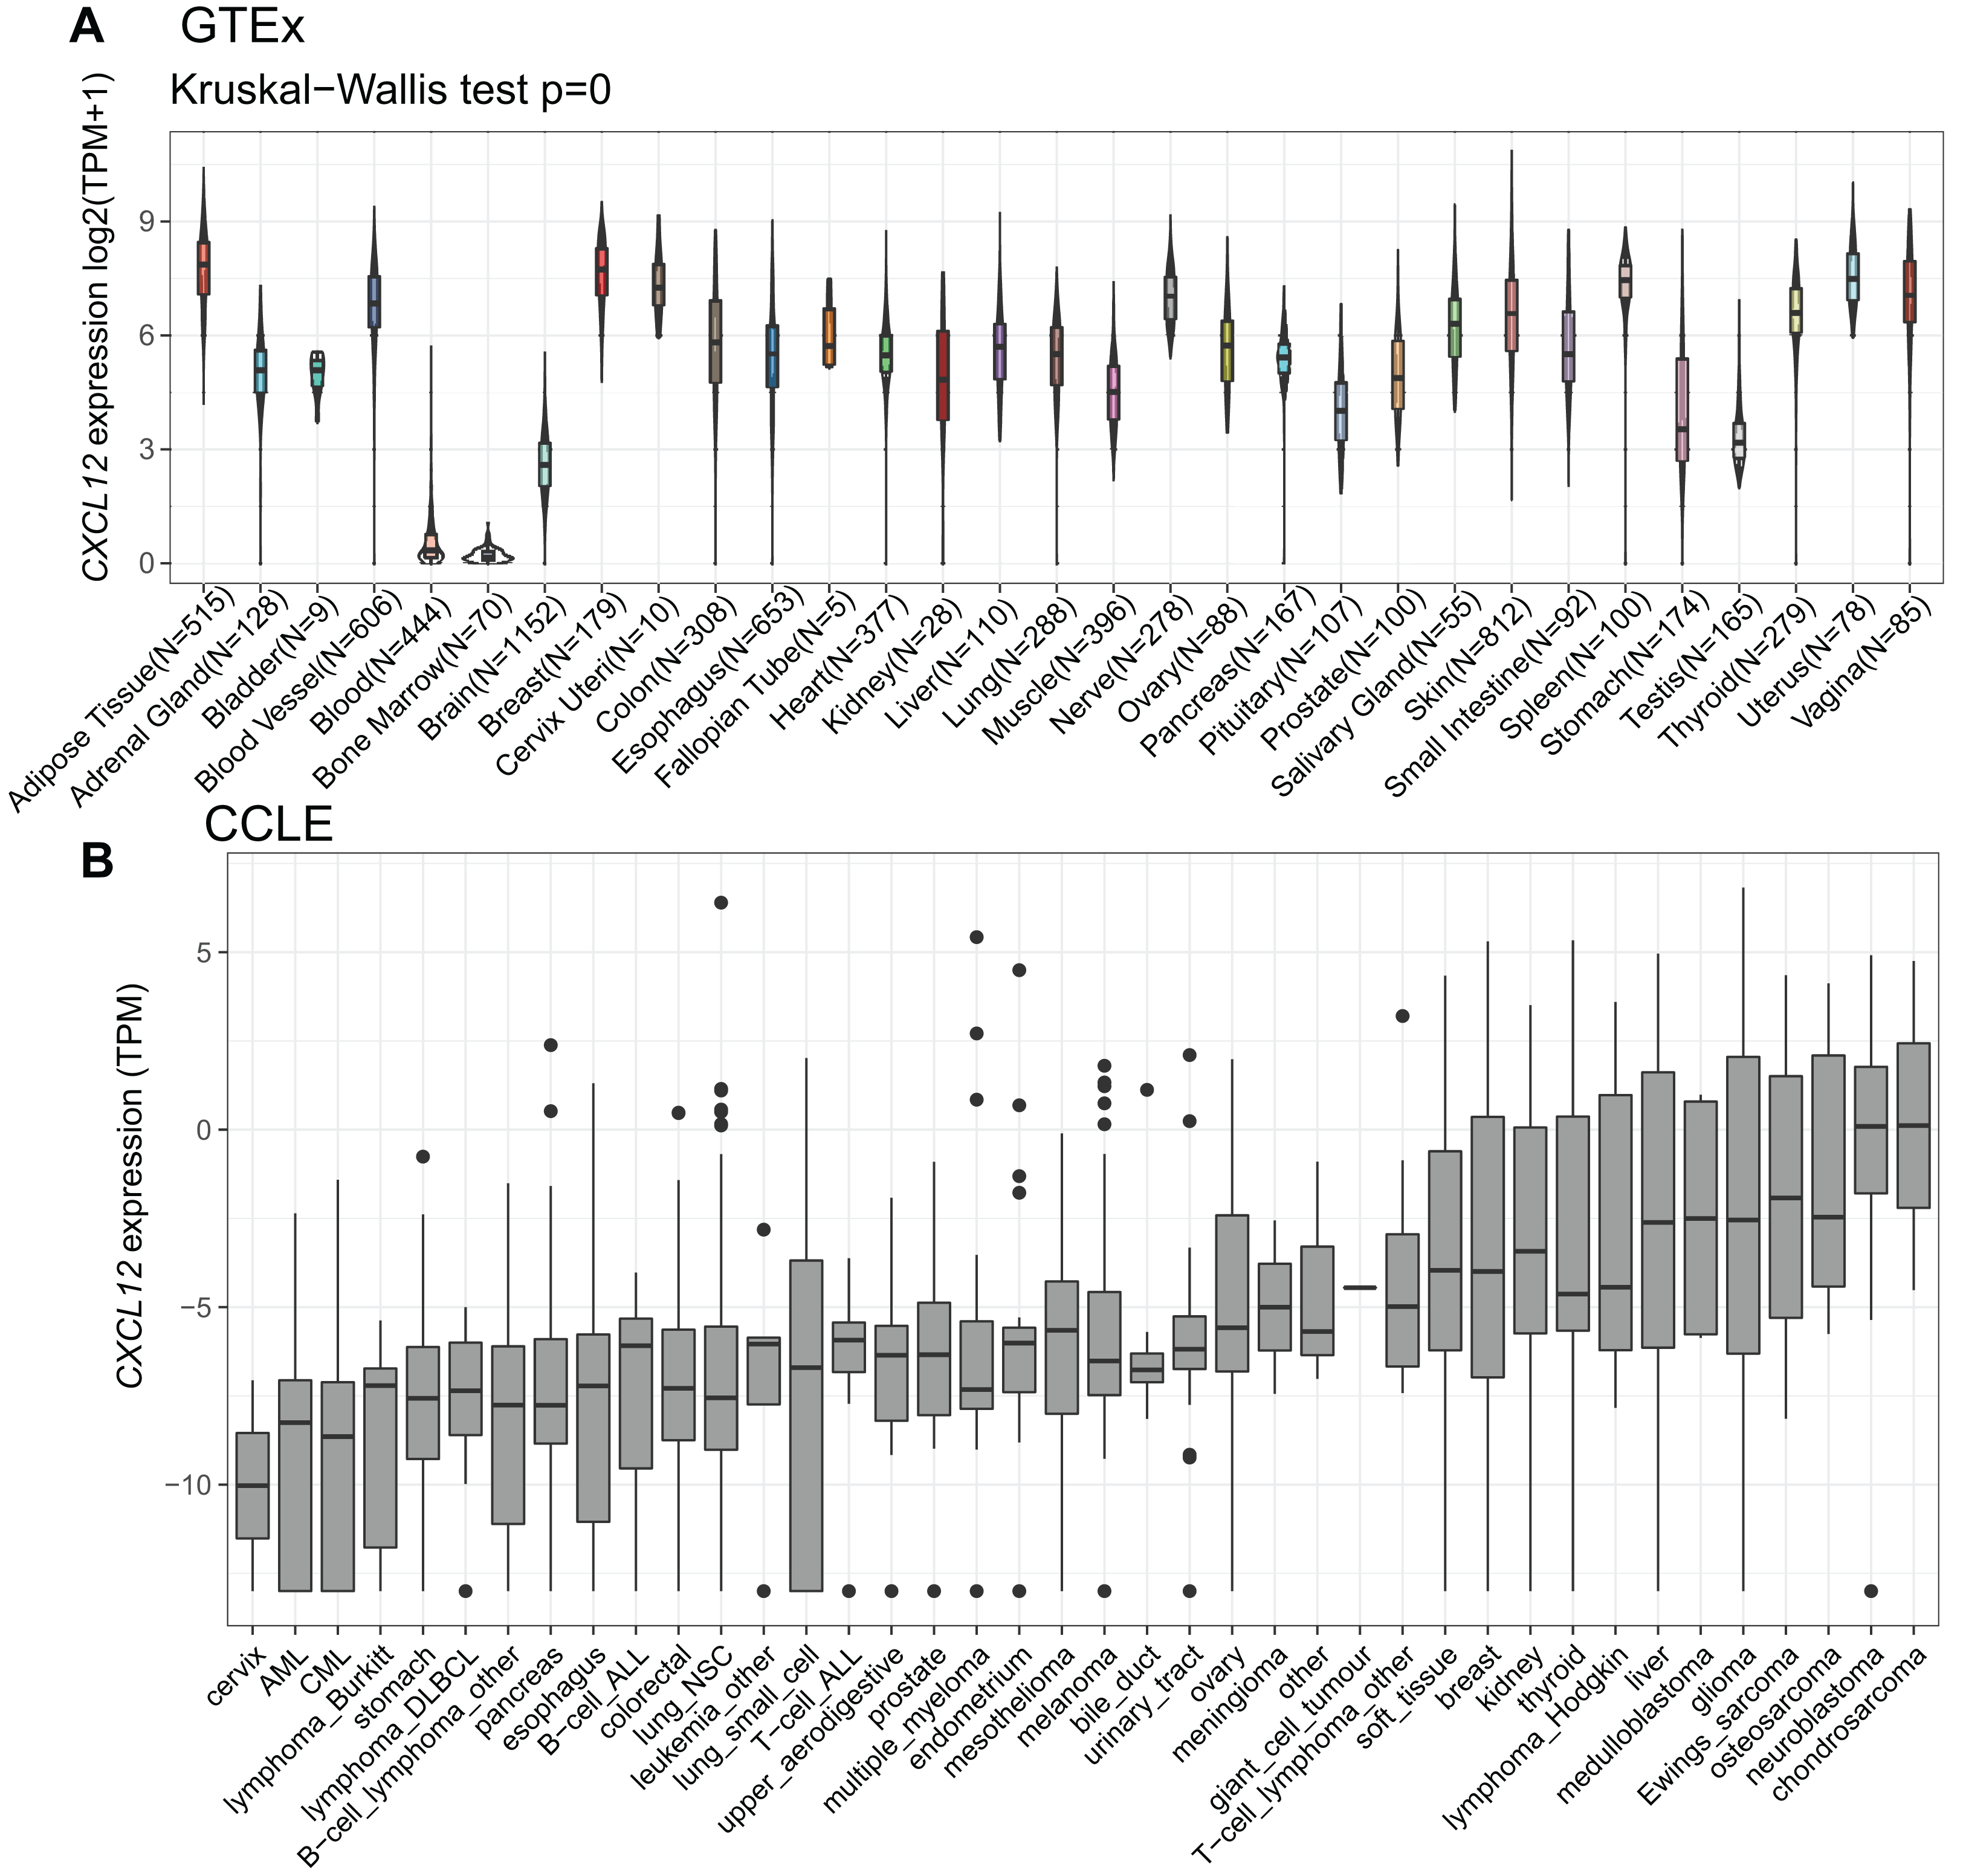
CXCL12 expression is markedly reduced in AML and single cells
Considering our purpose, we studied the CXCL12 expression difference between healthy people and AML patients. A significant decrease of CXCL12 expression was identified in AML cells (GSE30029, n = 90) in comparison to normal cells (GSE30029, n = 31) (P = 3.2E−16, Fig. 3A). We detected a similar result in the GSE63270 cohort (nAML = 62, nnormal = 42, P = 7.4E−06), as indicated in Fig. 3B. Additionally, we analyzed CXCL12 expression difference in eight FAB AML subtypes from M0 to M7 (Fig. S1) and CXCL12 transcription during hematopoiesis differentiation (Fig. S2), although the difference was of no statistical significance.
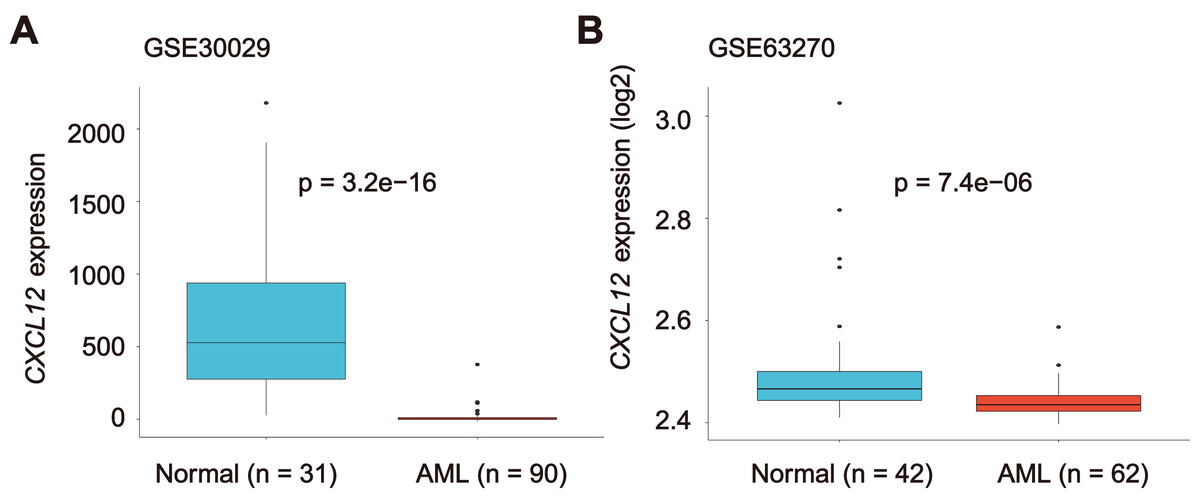
Figure 3: CXCL12 expression in normal hematopoiesis and AML cells.
The CXCL12 expression level of normal controls and AML patients from GSE30029 (A) and GSE63270 (B) datasets.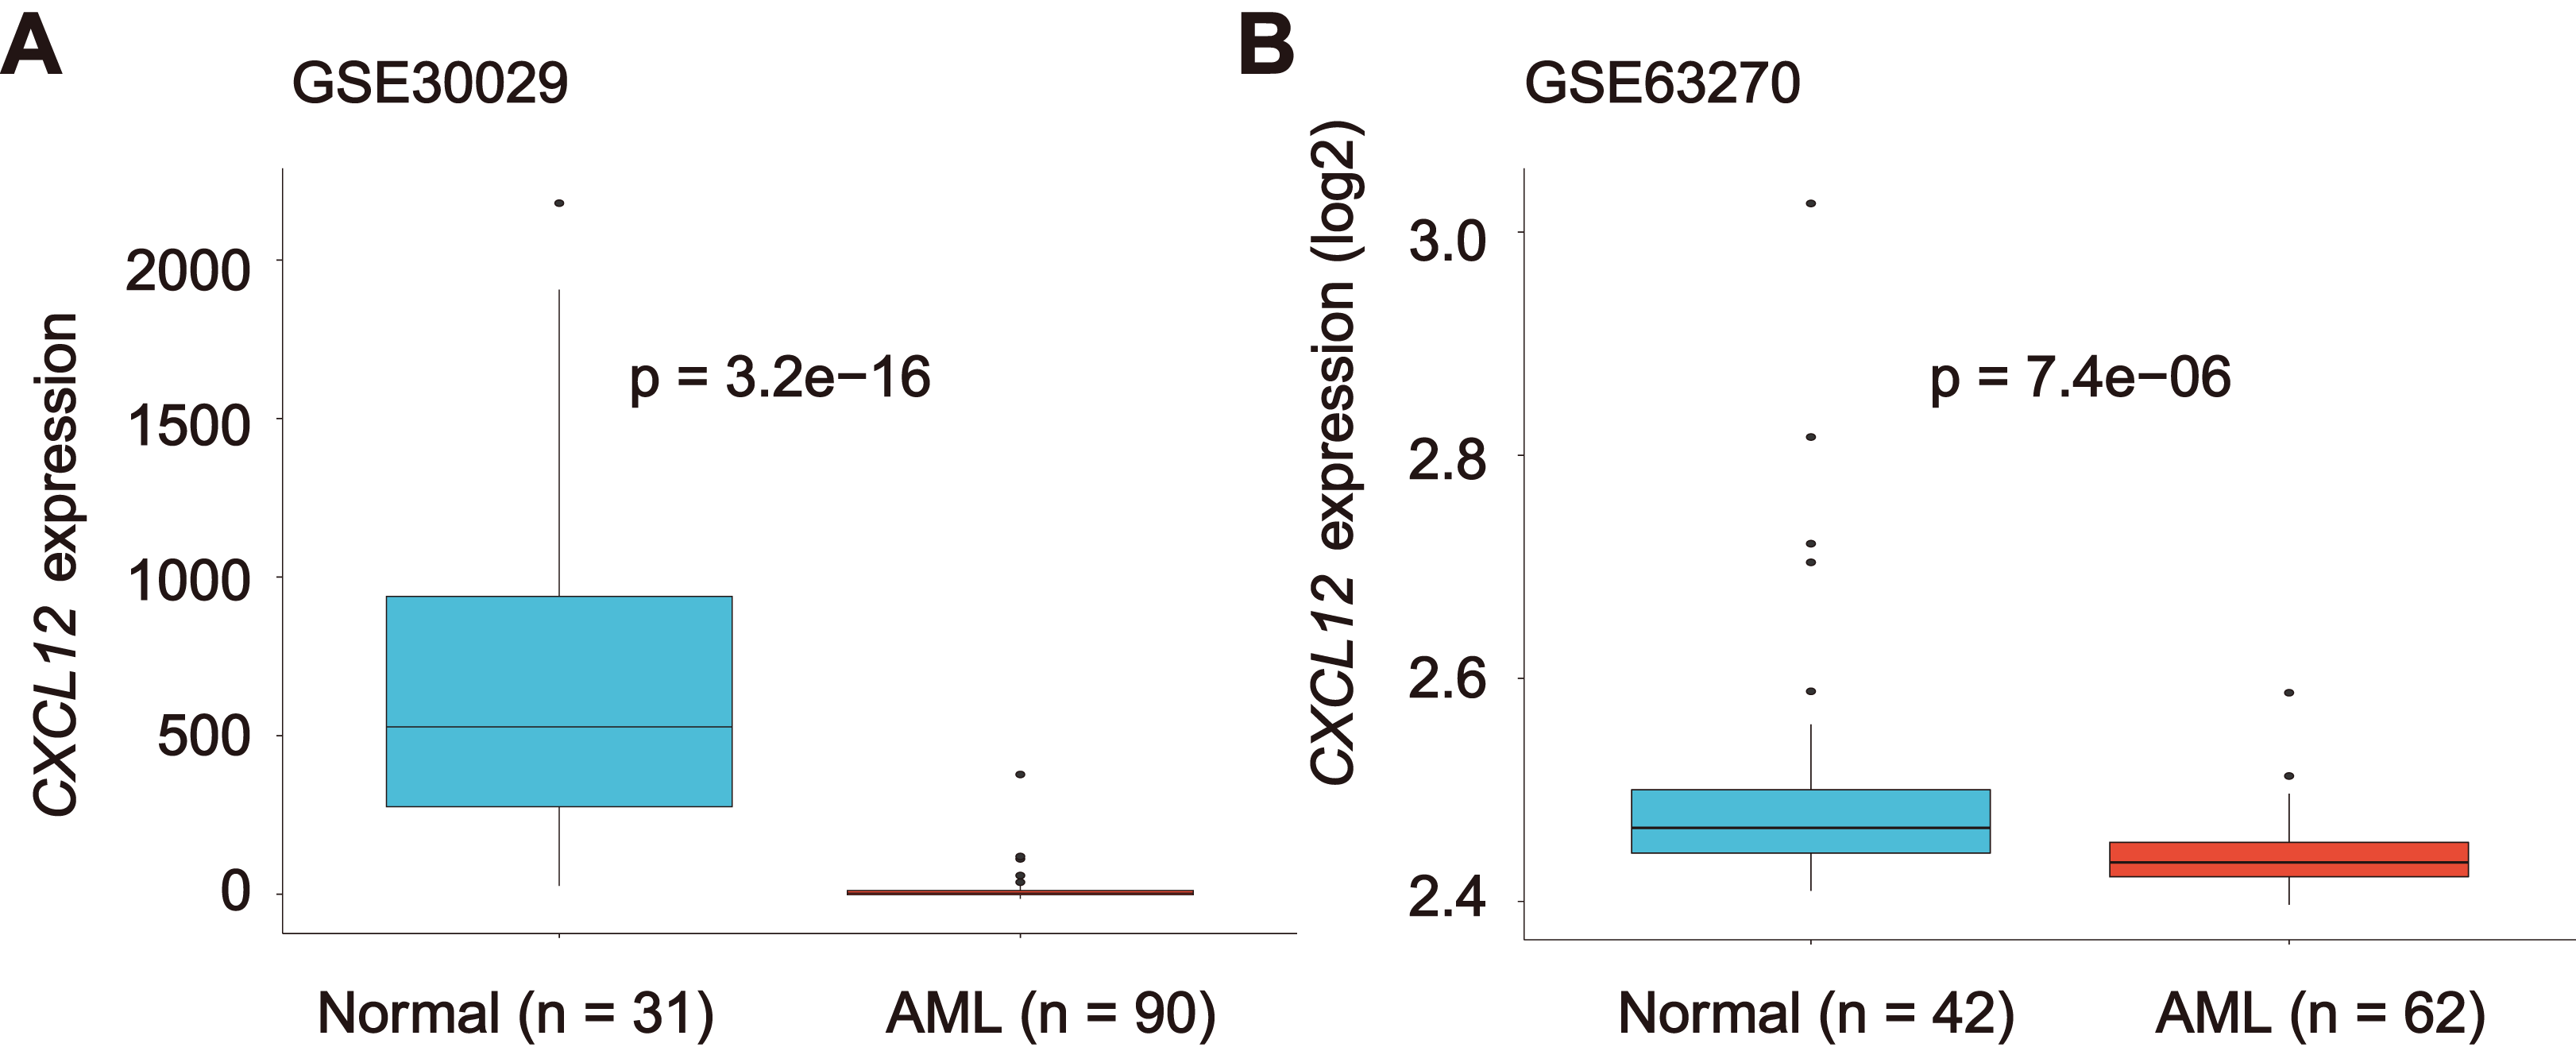
For further exploration, we delineated CXCL12 expression patterns in several hematological cells including hematopoietic stem cells (HSCs), multipotent progenitor cells (MPPs), granulo-monocyte progenitor cells (GMPs), common myeloid progenitor cells (CMPs), megakaryocyte-erythroid progenitor cells (MEPs), monocytes, and erythrocytes using the single-cell data sequenced by Van Galen et al. (2019), as shown in Fig. S3A. Interestingly, unlike the former result, MPPs and MEPs showed exclusively high expression of CXCL12. Also, we studied CXCL12 and CXCR4 expression status in the single-cell sequenced data and found CXCR4 expression was abundant in single cells from all patients while CXCL12 was rarely expressed (Fig. S3B).
Clinical features and molecular insights of CXCL12
The patient characteristics with respect to CXCL12 expression from TCGA were summarized (Table 1). Low CXCL12 expressed patients tended to have higher white blood cell (WBC) counts (P < 0.0001) and more percentages of blasts in BM (P < 0.001) and peripheral blood (PB) (P < 0.0001). With regard to frequently mutated genes in AML, low CXCL12 expressers were more likely to have FLT3-internal tandem duplications (FLT3-ITD) (P = 0.010) and NPM1 mutations (P = 0.015) and less likely to have mutated TP53 (P = 0.046) than those with high CXCL12 expression.
| Patient characteristics | AML (TCGA dataset) | ||
|---|---|---|---|
| High CXCL12 (n = 86) | Low CXCL12 (n = 87) | P | |
| Age, years | 0.537 | ||
| Median | 60 | 57 | |
| Range | 21–88 | 18–81 | |
| Sex (male/female) | 52/34 | 40/47 | 0.056 |
| WBC count, ×109/L | <0.0001 | ||
| Median | 6.4 | 42.1 | |
| Range | 0.4–116.2 | 0.9–297.4 | |
| BM blasts, % | <0.001 | ||
| Median | 62 | 77 | |
| Range | 30–100 | 32–100 | |
| PB blasts, % | <0.0001 | ||
| Median | 14 | 52 | |
| Range | 0–97 | 0–98 | |
| Karyotype | 0.872 | ||
| Favorable | 15 | 17 | |
| Intermediate | 50 | 51 | |
| Adverse | 20 | 17 | |
| Unknown | 1 | 2 | |
| FLT3-ITD | 0.010 | ||
| Present | 7 | 19 | |
| Absent | 79 | 66 | |
| NPM1 | 0.015 | ||
| Mutated | 17 | 31 | |
| Wild-type | 69 | 54 | |
| CEBPA | 0.318 | ||
| Single mutated | 3 | 5 | |
| Double mutated | 4 | 1 | |
| Wild-type | 79 | 79 | |
| IDH1 | 0.980 | ||
| Mutated | 8 | 8 | |
| Wild-type | 78 | 77 | |
| IDH2 | 0.818 | ||
| Mutated | 9 | 8 | |
| Wild-type | 77 | 77 | |
| RUNX1 | 0.062 | ||
| Mutated | 11 | 4 | |
| Wild-type | 75 | 81 | |
| DNMT3A | 0.965 | ||
| Mutated | 21 | 21 | |
| Wild-type | 65 | 64 | |
| TP53 | 0.046 | ||
| Mutated | 10 | 3 | |
| Wild-type | 76 | 82 | |
Note:
Abbreviations: AML, acute myeloid leukemia; TCGA, The Cancer Genome Atlas; WBC, white blood cells; BM, bone marrow; PB, peripheral blood; ITD, internal tandem duplication.
Decreased CXCL12 expression predicts adverse prognosis
Survival analyses were further performed using three independent cohorts (TCGA, GSE6891, and GSE10358), and all cohorts were divided base on optional cut-off values determined by the x-tile method. In the TCGA whole-AML cohort, CXCL12low patients showed significantly decreased overall survival (OS) (P = 0.013, Fig. 4A) and event-free survival (EFS) (P = 0.0001, Fig. 4D). The impact of CXCL12 expression on outcome was also observed in the non-M3-AML (OS, P = 0.002, Fig. 4B; EFS, P = 0.0007, Fig. 4E) and cytogenetically normal (CN)-AML (OS, P = 0.002, Fig. 4C; EFS, P = 0.002, Fig. 4F) subgroups. This finding was further validated using GSE6891 (Fig. S4) and GSE10358 (Fig. S5) and the results were identical to the former.
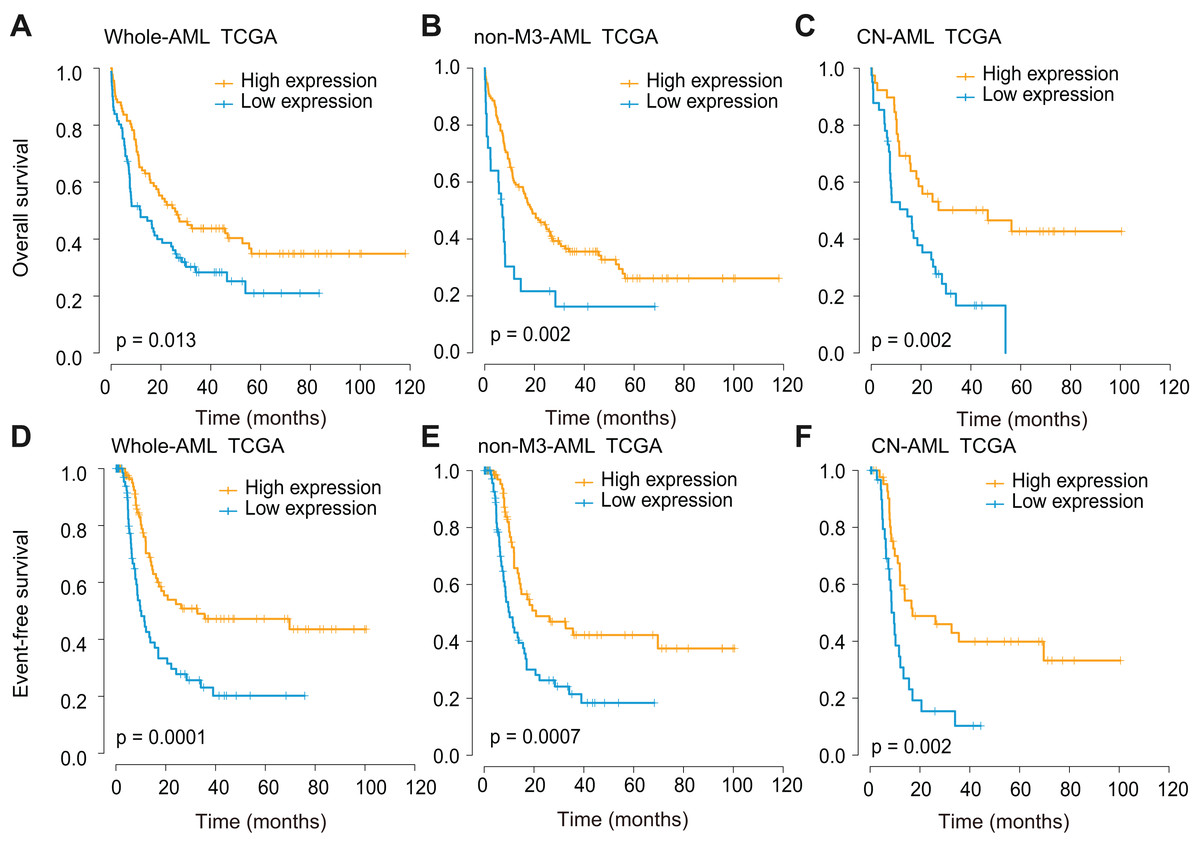
Figure 4: Survival analysis of CXCL12 using the TCGA cohort.
(A, D) The correlation of CXCL12 expression level with OS (A) and EFS (D) for the total AML patients. (B, E) The correlation of CXCL12 expression level with OS (B) and EFS (E) for the non-M3-AML patients. (C, F) The correlation of CXCL12 expression level with OS (C) and EFS (F) for the CN-AML patients.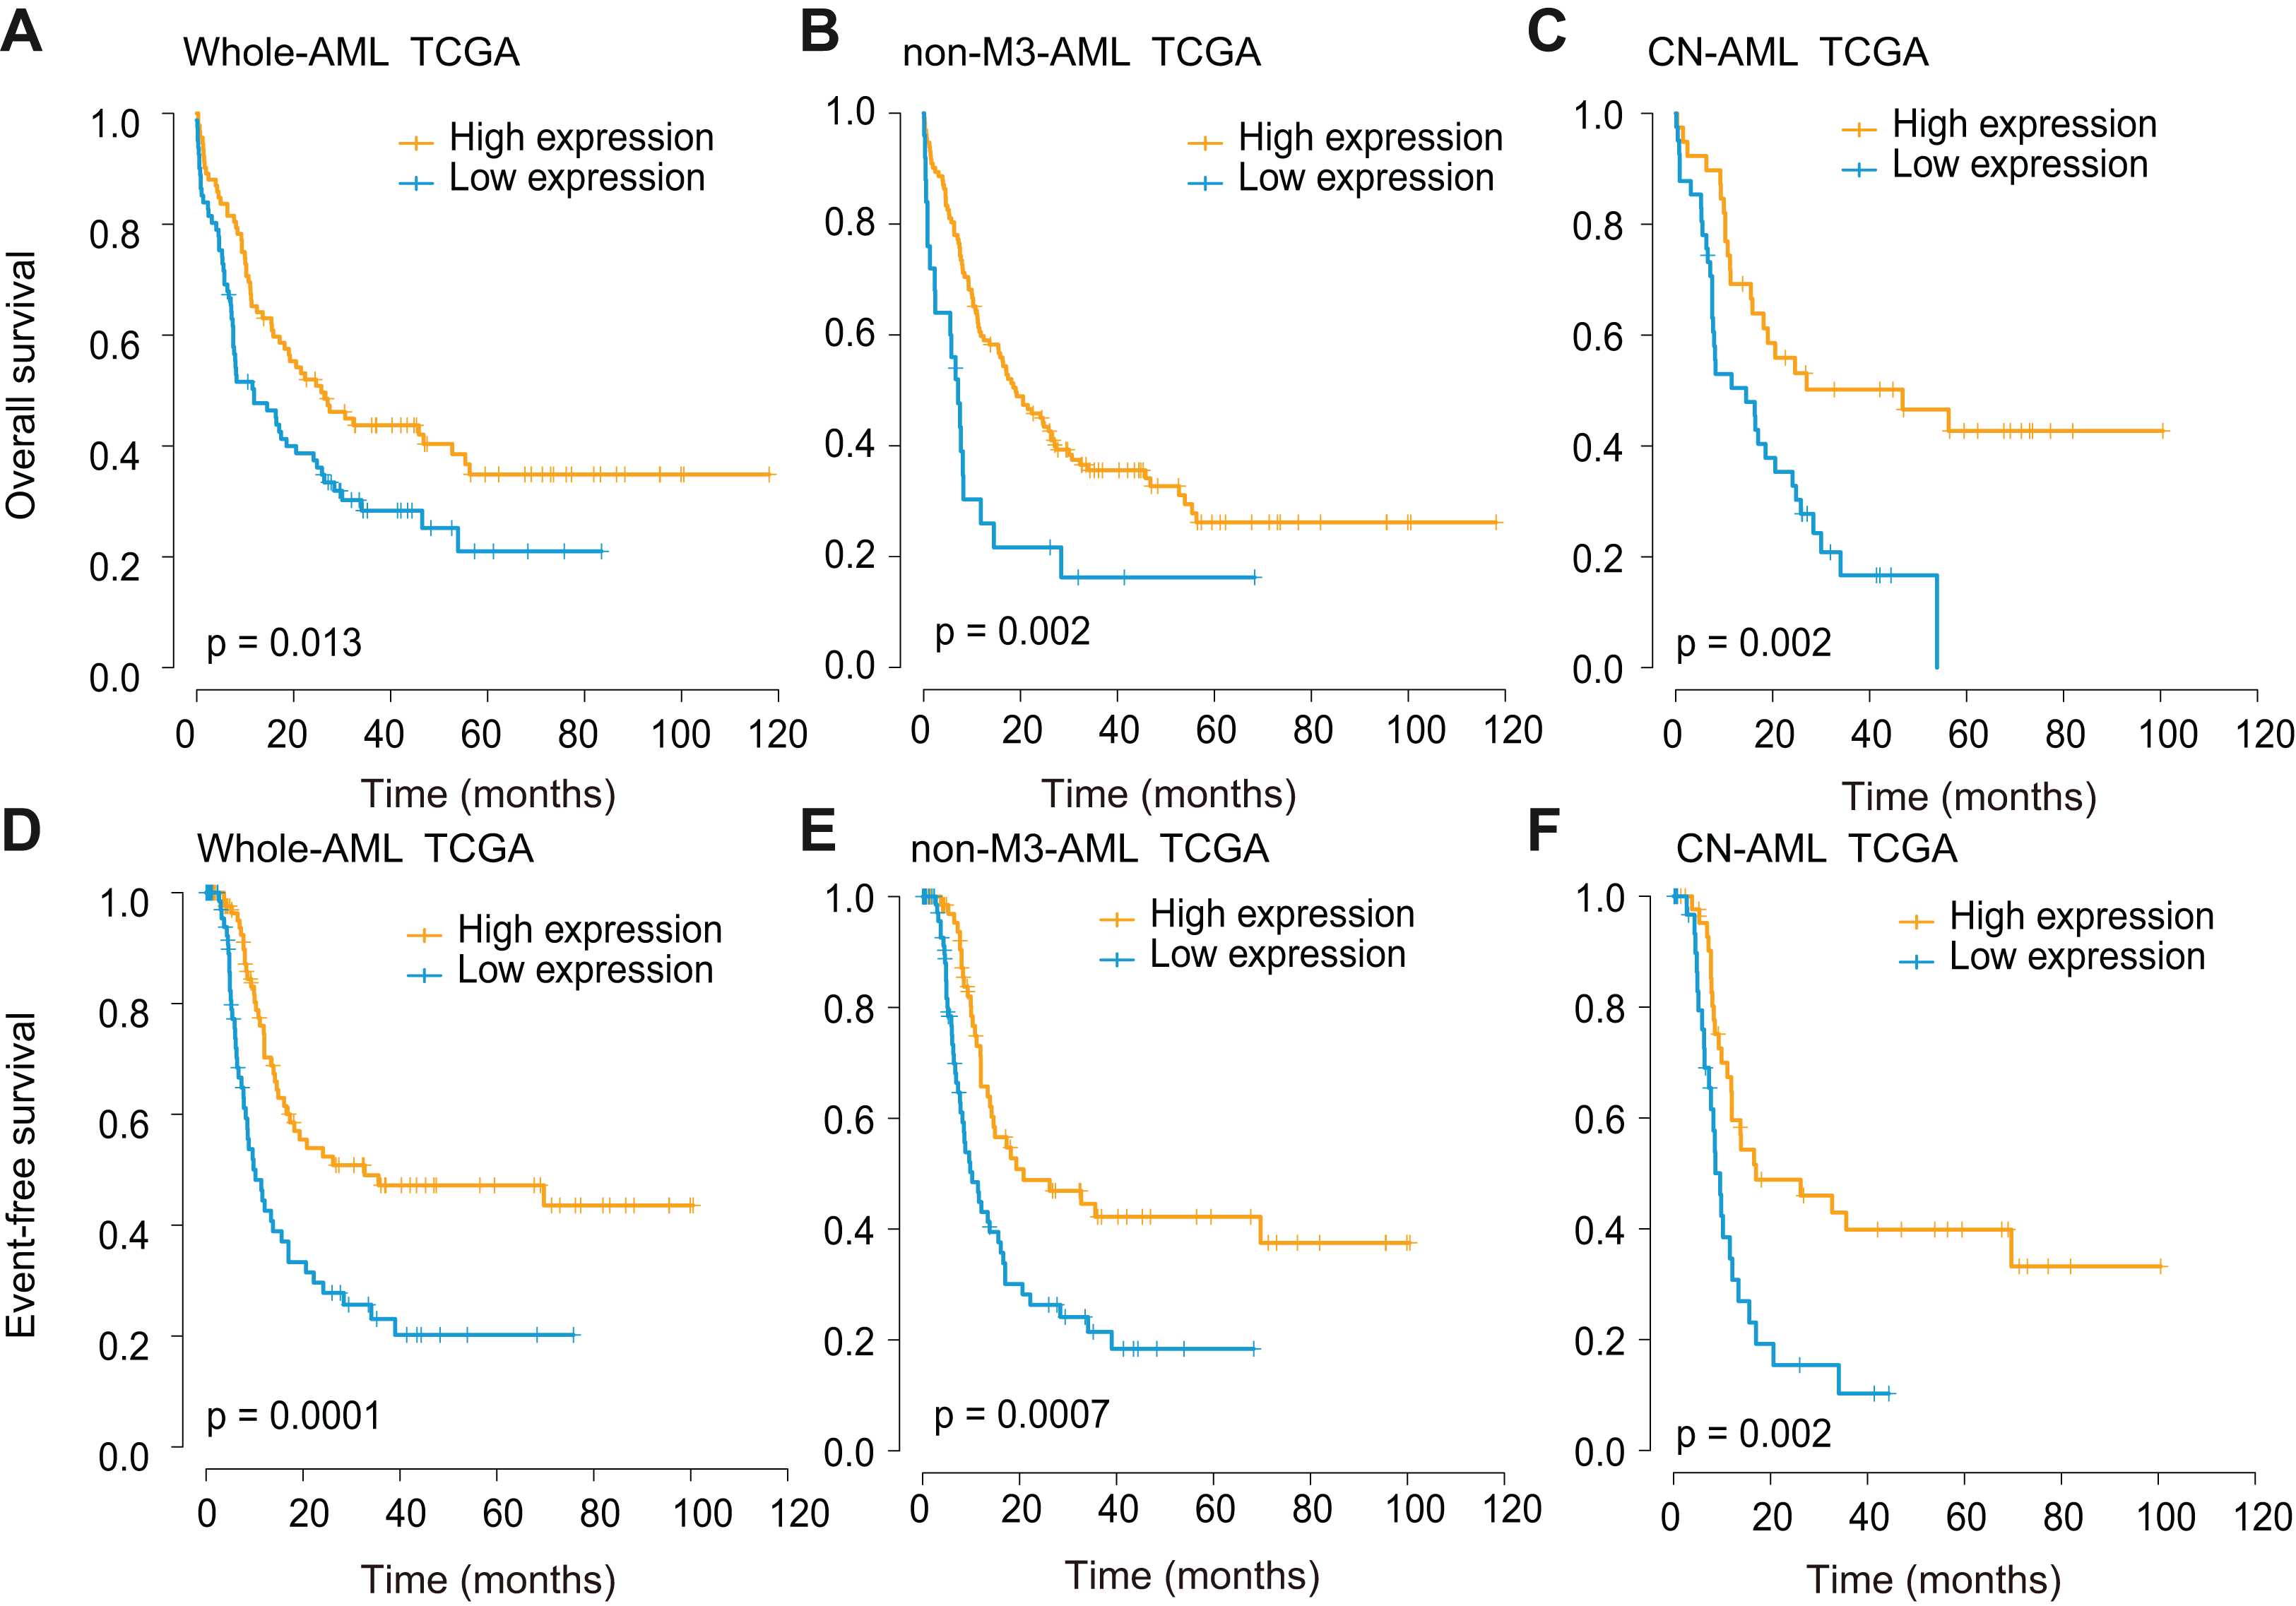
The potential relationship between low CXCL12 expression and the existence of FLT3-ITD and NPM1 mutations led us to further explore the additional prognostic value of the gene in more subdivided groups. As expected, low CXCL12 expression patients showed significantly inferior survival probability in the FLT3-ITD absent (Fig. 5A, P = 0.003) and NPM1 mutated (Fig. 5B, P = 0.068, a trend for significance actually) patients, which could provide more subdivision proofs for AML based on the dichotomous stratification of CXCL12 expression.
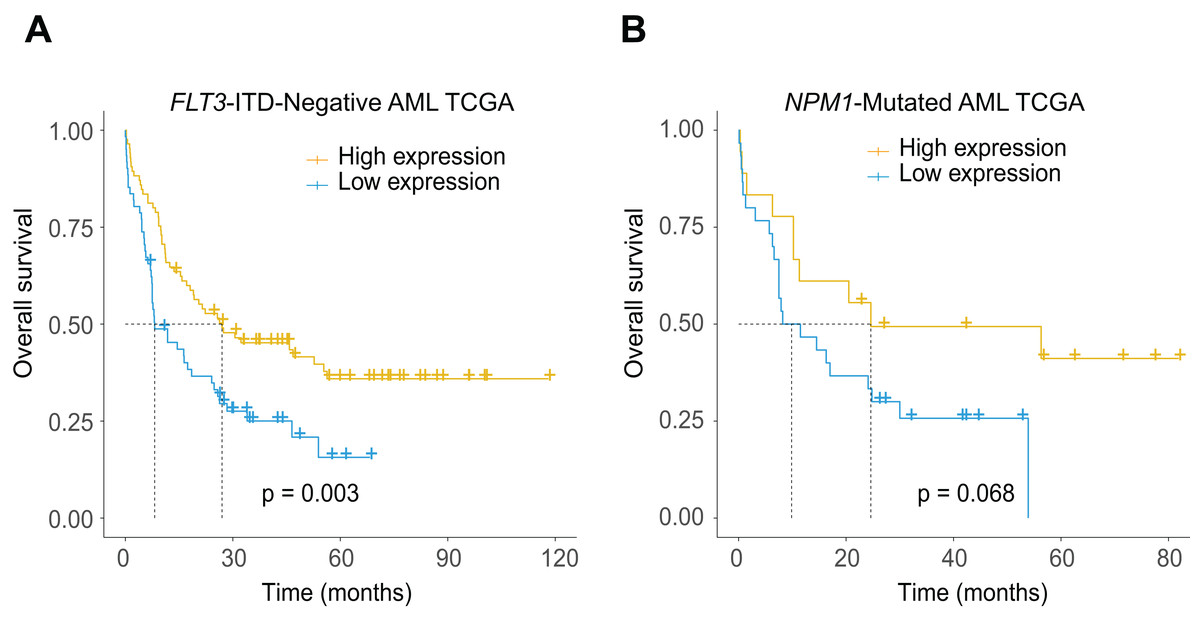
Figure 5: Prognostic significance of CXCL12 in the molecularly defined subgroups in the TCGA cohort.
(A) Kaplan–Meier estimate for OS of FLT3-ITD-negative AML patients. (B) Kaplan–Meier estimate for OS of NPM1-mutated AML patients.
Multivariate analysis of CXCL12 expression for OS in the TCGA cohorts
To evaluate whether there were potential interrelationships between CXCL12 expression and known clinical factors, we first conducted a univariate analysis in the TCGA dataset and then covered variables with a univariable P ≤ 0.20 in the multivariate Cox proportional hazard model. The multivariate analysis result of CXCL12 expression for OS was displayed in Table 2. Low CXCL12 expression maintained a high hazard rate for whole-AML patients (HR = 2.25, 95% CI [1.51–3.35], P < 0.0001), after adjusting age (P < 0.0001), WBC count (P < 0.0001), cytogenetic risk (P = 0.002) and mutation status of TP53 (P = 0.004), RUNX1 (P = 0.023) and DNMT3A (P = 0.012). The predictive significance also applied to CN-AML patients (HR = 2.14, 95% CI [1.15–3.97], P = 0.016), as indicated.
| Variables | Whole-AML (n = 173) | CN-AML (n = 80) | ||
|---|---|---|---|---|
| Hazard Ratio (95% CI) | P | Hazard Ratio (95% CI) | P | |
| CXCL12a | 2.25 [1.51–3.35] | <0.0001 | 2.14 [1.15–3.97] | 0.016 |
| Ageb | 1.01 [1.00–1.03] | <0.0001 | 2.37 [1.35–4.18] | 0.003 |
| WBC countc | 3.14 [1.92–5.14] | <0.0001 | 1.21 [0.67–2.19] | 0.520 |
| Cytogenetic riskd | 1.79 [1.25–2.57] | 0.002 | – | – |
| TP53e | 2.85 [1.41–5.75] | 0.004 | – | – |
| RUNX1e | 2.08 [1.10–3.93] | 0.023 | – | – |
| DNMT3Ae | 1.74 [1.13–2.68] | 0.012 | 1.95 [1.11–3.44] | 0.020 |
| IDH1e | – | – | 0.60 [0.21–1.75] | 0.351 |
Notes:
Abbreviations: TCGA, The Cancer Genome Atlas; CN-AML, cytogenetically normal AML; WBC, white blood cells; CI, confidence interval.
Hazard Ratio > 1 or Hazard Ratio < 1 indicate a higher or lower risk. Only variables with a univariable P ≤ 0.20 were included in the multivariable models.
Profile of relationship between CXCL12 expression and immune cells infiltration
The landscape of the relationship between CXCL12 expression and immune cell infiltration was systematically evaluated by the CIBERSORT algorithm (Fig. 6). We found that B cells memory, plasma cells, T cells regulatory (Tregs), T cells gamma delta, NK cells activated, mast cells activated, and eosinophils were significantly changed between high CXCL12 and low CXCL12 groups, while B cell naive, T cells CD8, T cells CD4 naive, T cells CD4 memory resting, T cells CD4 memory activated, T cell follicular helper, NK cells resting, monocyte, macrophages M0, macrophages M1, macrophages M2, dendritic cells resting, dendritic cells activated, mast cells resting, and neutrophils were not obviously altered between groups. More specifically, high CXCL12 expressed groups tended to harbor more memory B cells and plasma cells infiltration while low CXCL12 expressed groups exhibited more eosinophils infiltration. Less importantly, T cells regulatory (Tregs), T cells gamma delta, and NK cells were rarely infiltrated in both high and low CXCL12 expressed groups.
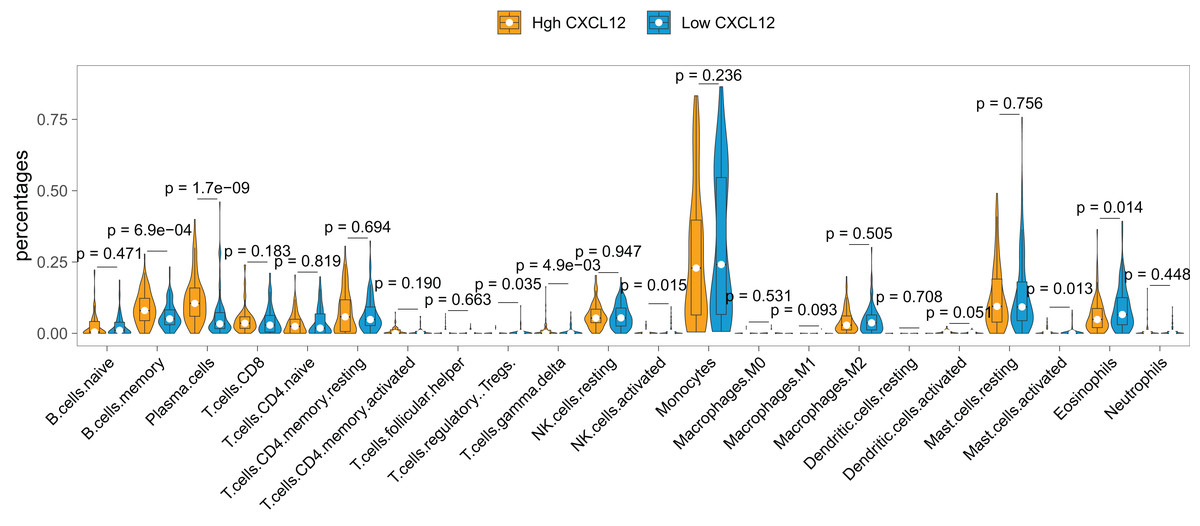
Figure 6: Immune cell infiltration difference between high and low CXCL12 expressers.
The Violin plot exhibits the difference between 22 CIBERSORT immune cell fractions between high and low CXCL12 expressers.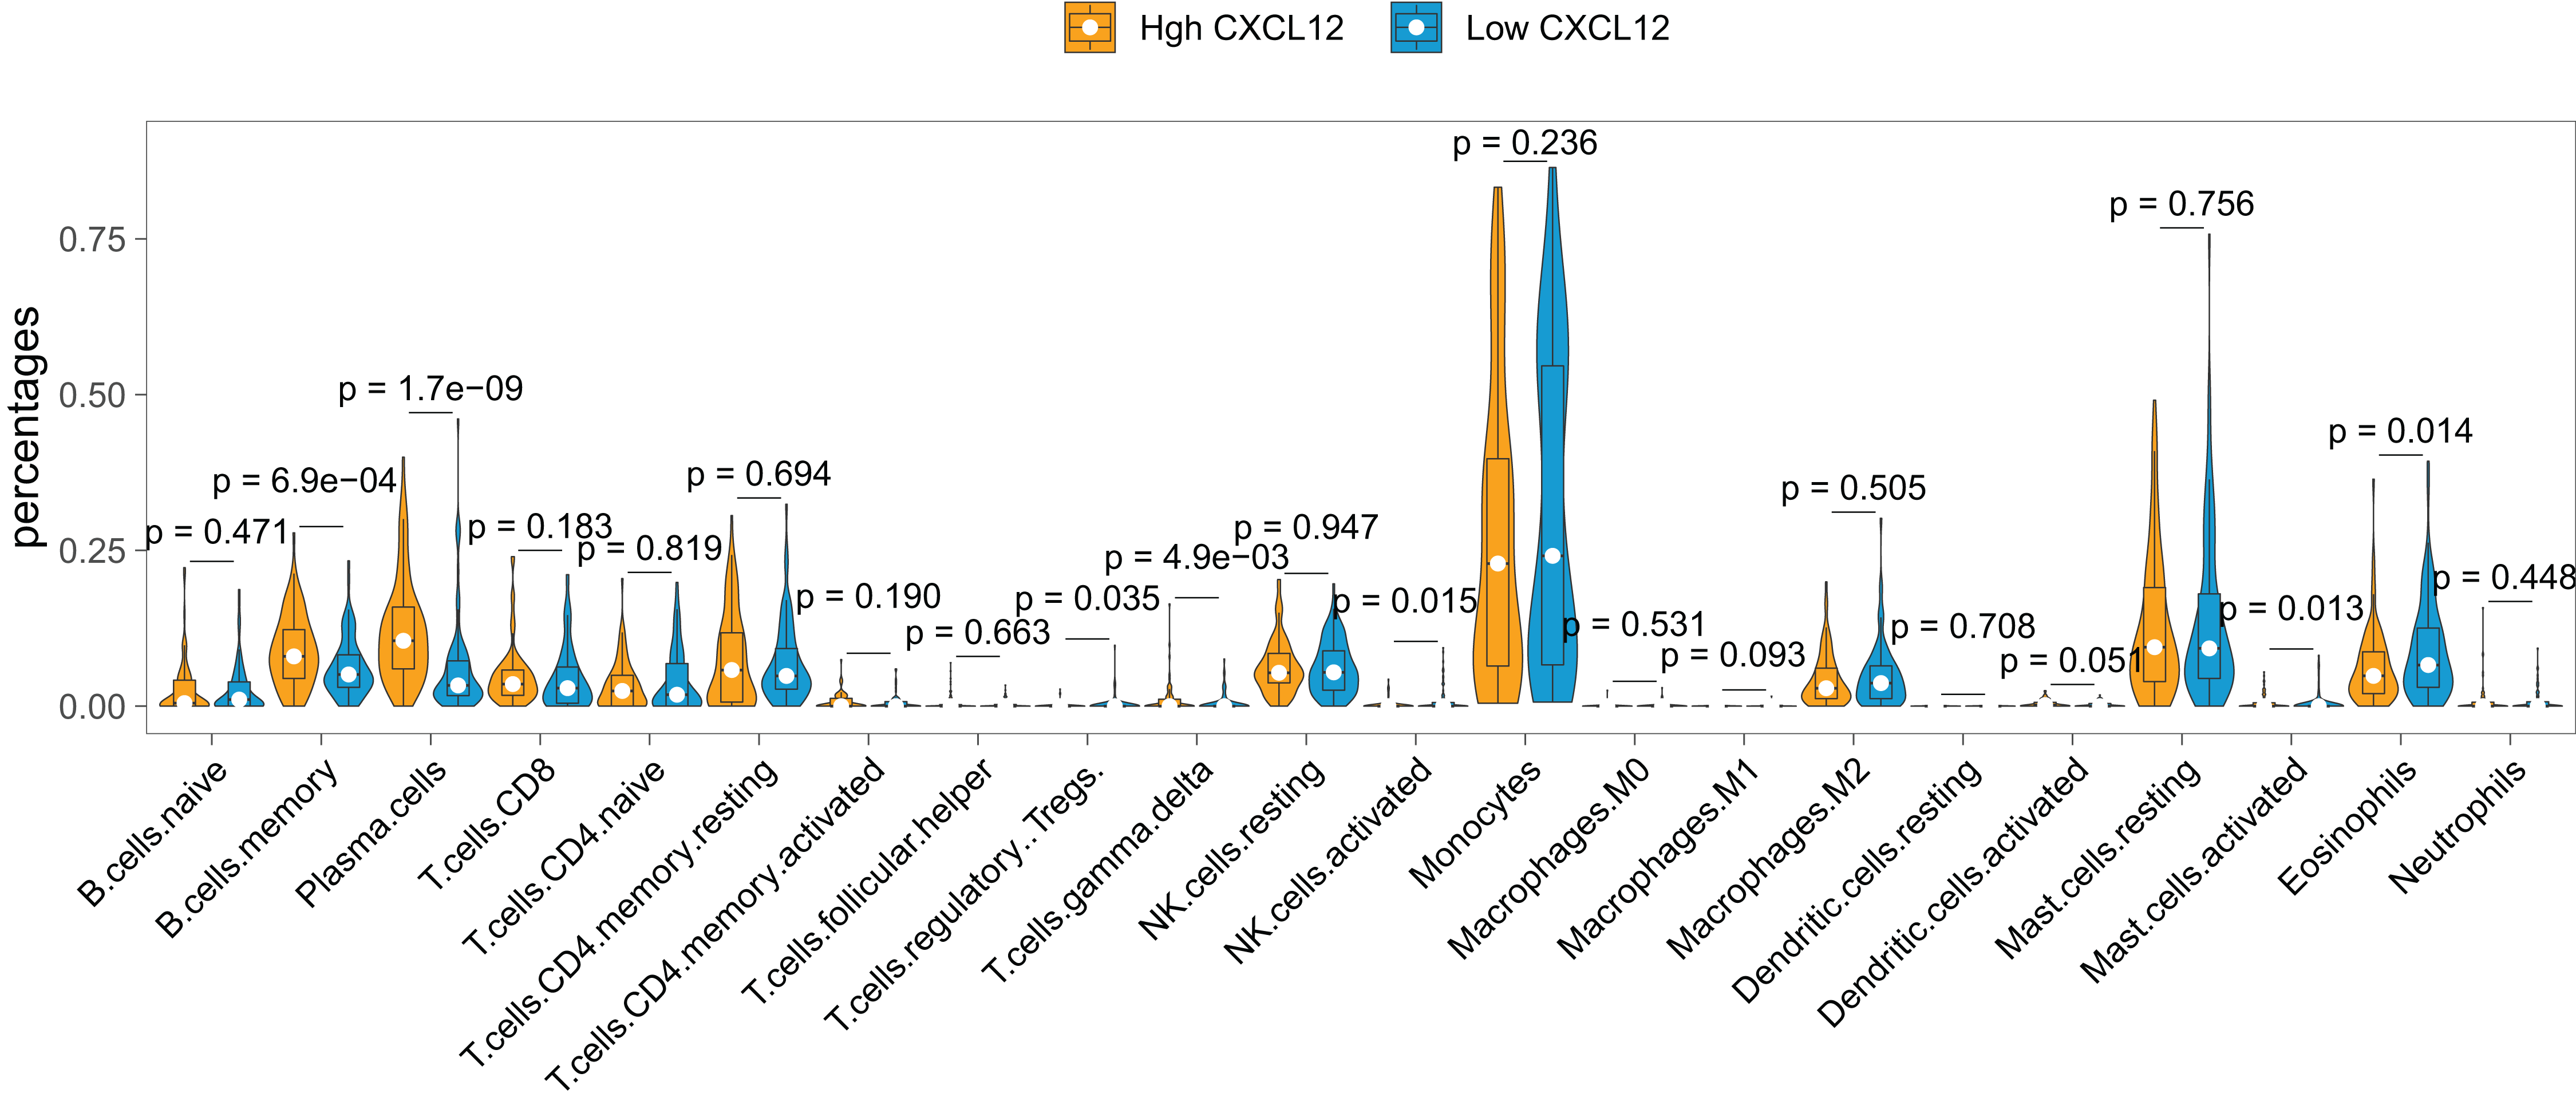
To verify the signatures of immune infiltration, we adopted multiple deconvolution methods including TIMER, quanTIseq, xCell, MCP-counter, and EPIC to cross-check the analytic results of CIBERSORT. Then, we made a Pearson correlation analysis between all infiltration results and CXCL12 expression, and totally 16 significantly correlated results were displayed in Fig. S6. Plasma cells (xCell, Cor = 0.273, P < 0.001) and B cells (quanTIseq, Cor = 0.246, P < 0.001; EPIC, Cor = 0.198, P = 0.007; MCP-counter, Cor = 0.145, P = 0.050) had a positive correlation with CXCL12 expression.
GO analysis and KEGG pathways analysis of CXCL12
GO analyses of CXCL12 for biological process (BP), cellular component (CC) and molecular function (MF) were performed on the online website of STRING (http://string-db.org) (Fig. 7), using genes differentially expressed between high and low CXCL12 expressers (|log FC| > 1.5, adjusted p-value < 0.05, Supplemental Data 6). GO term annotation showed that CXCL12 was correlated with anatomical structure morphogenesis, extracellular structure organization, animal organ morphogenesis, biological adhesion, system development, multicellular organismal process, animal organ development, cell adhesion, extracellular matrix organization, and multicellular organism development (BP); extracellular region, extracellular space, extracellular matrix, intrinsic component of plasma membrane, integral component of plasma membrane, cell periphery, plasma membrane, collagen-containing extracellular matrix, basement membrane, and collagen trimer (CC); binding, growth factor binding, signaling receptor binding, calcium ion binding, cell adhesion molecule binding, glycosaminoglycan binding, chemokine activity, heparin binding, receptor ligand activity, and receptor regulator activity (MF) (Fig. 7, Supplemental Data 7). GO analysis showed significantly high enrichment in anatomical structure morphogenesis for biological process, extracellular region for cellular component, and binding for molecular function. Moreover, CXCL12 was involved directly or indirectly in the protein digestion and absorption pathway according to the KEGG pathways analysis (Fig. 7, Supplemental Data 7).
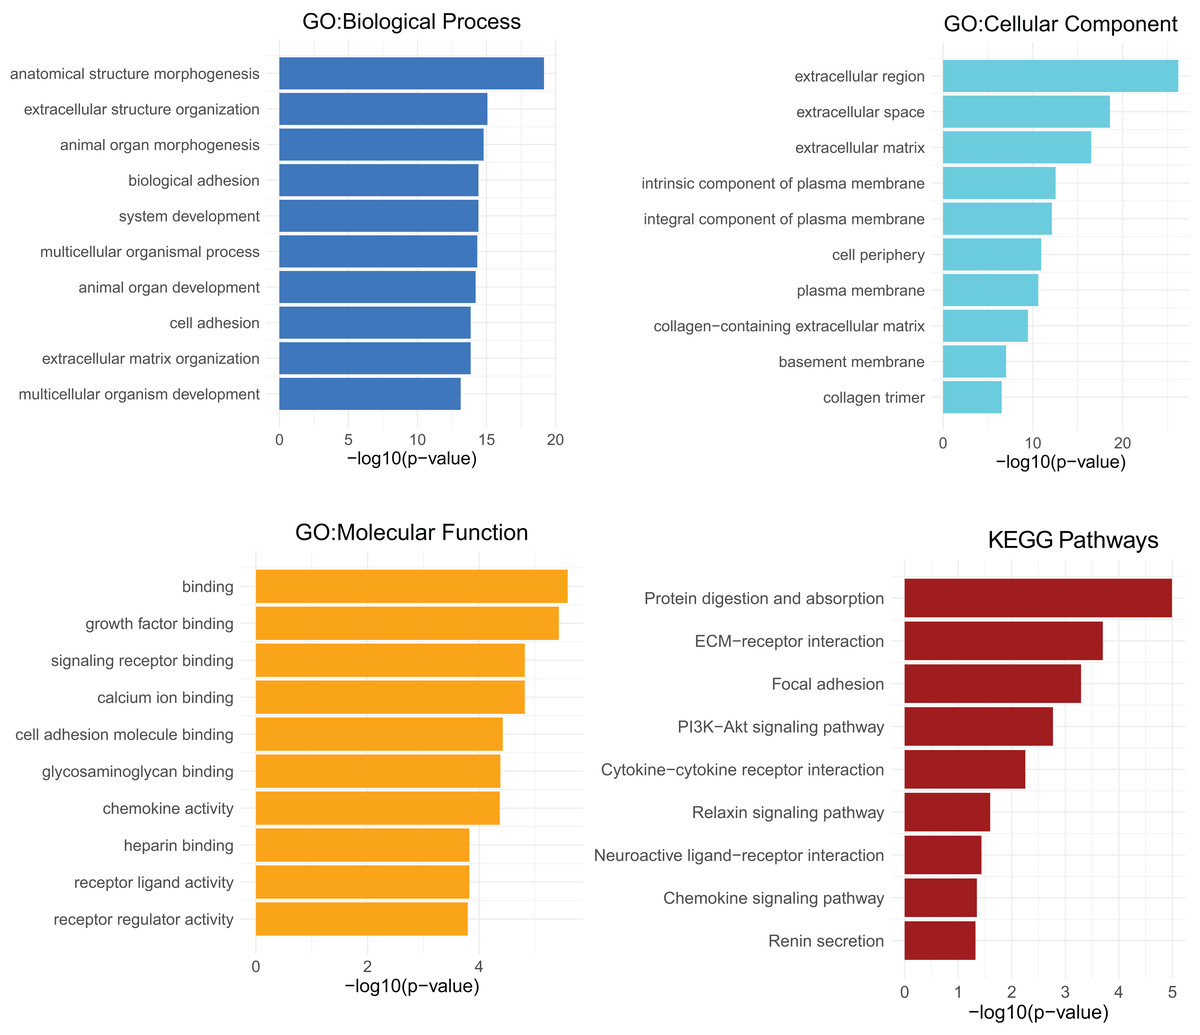
Figure 7: GO and KEGG pathways analysis of differentially expressed genes between high and low CXCL12 expressers.
The top-ten statistically significant results identified including biological process (BP), cellular component (CC), molecular function (MF), and KEGG pathways are listed according to their -log10 (p-value) (colored bars).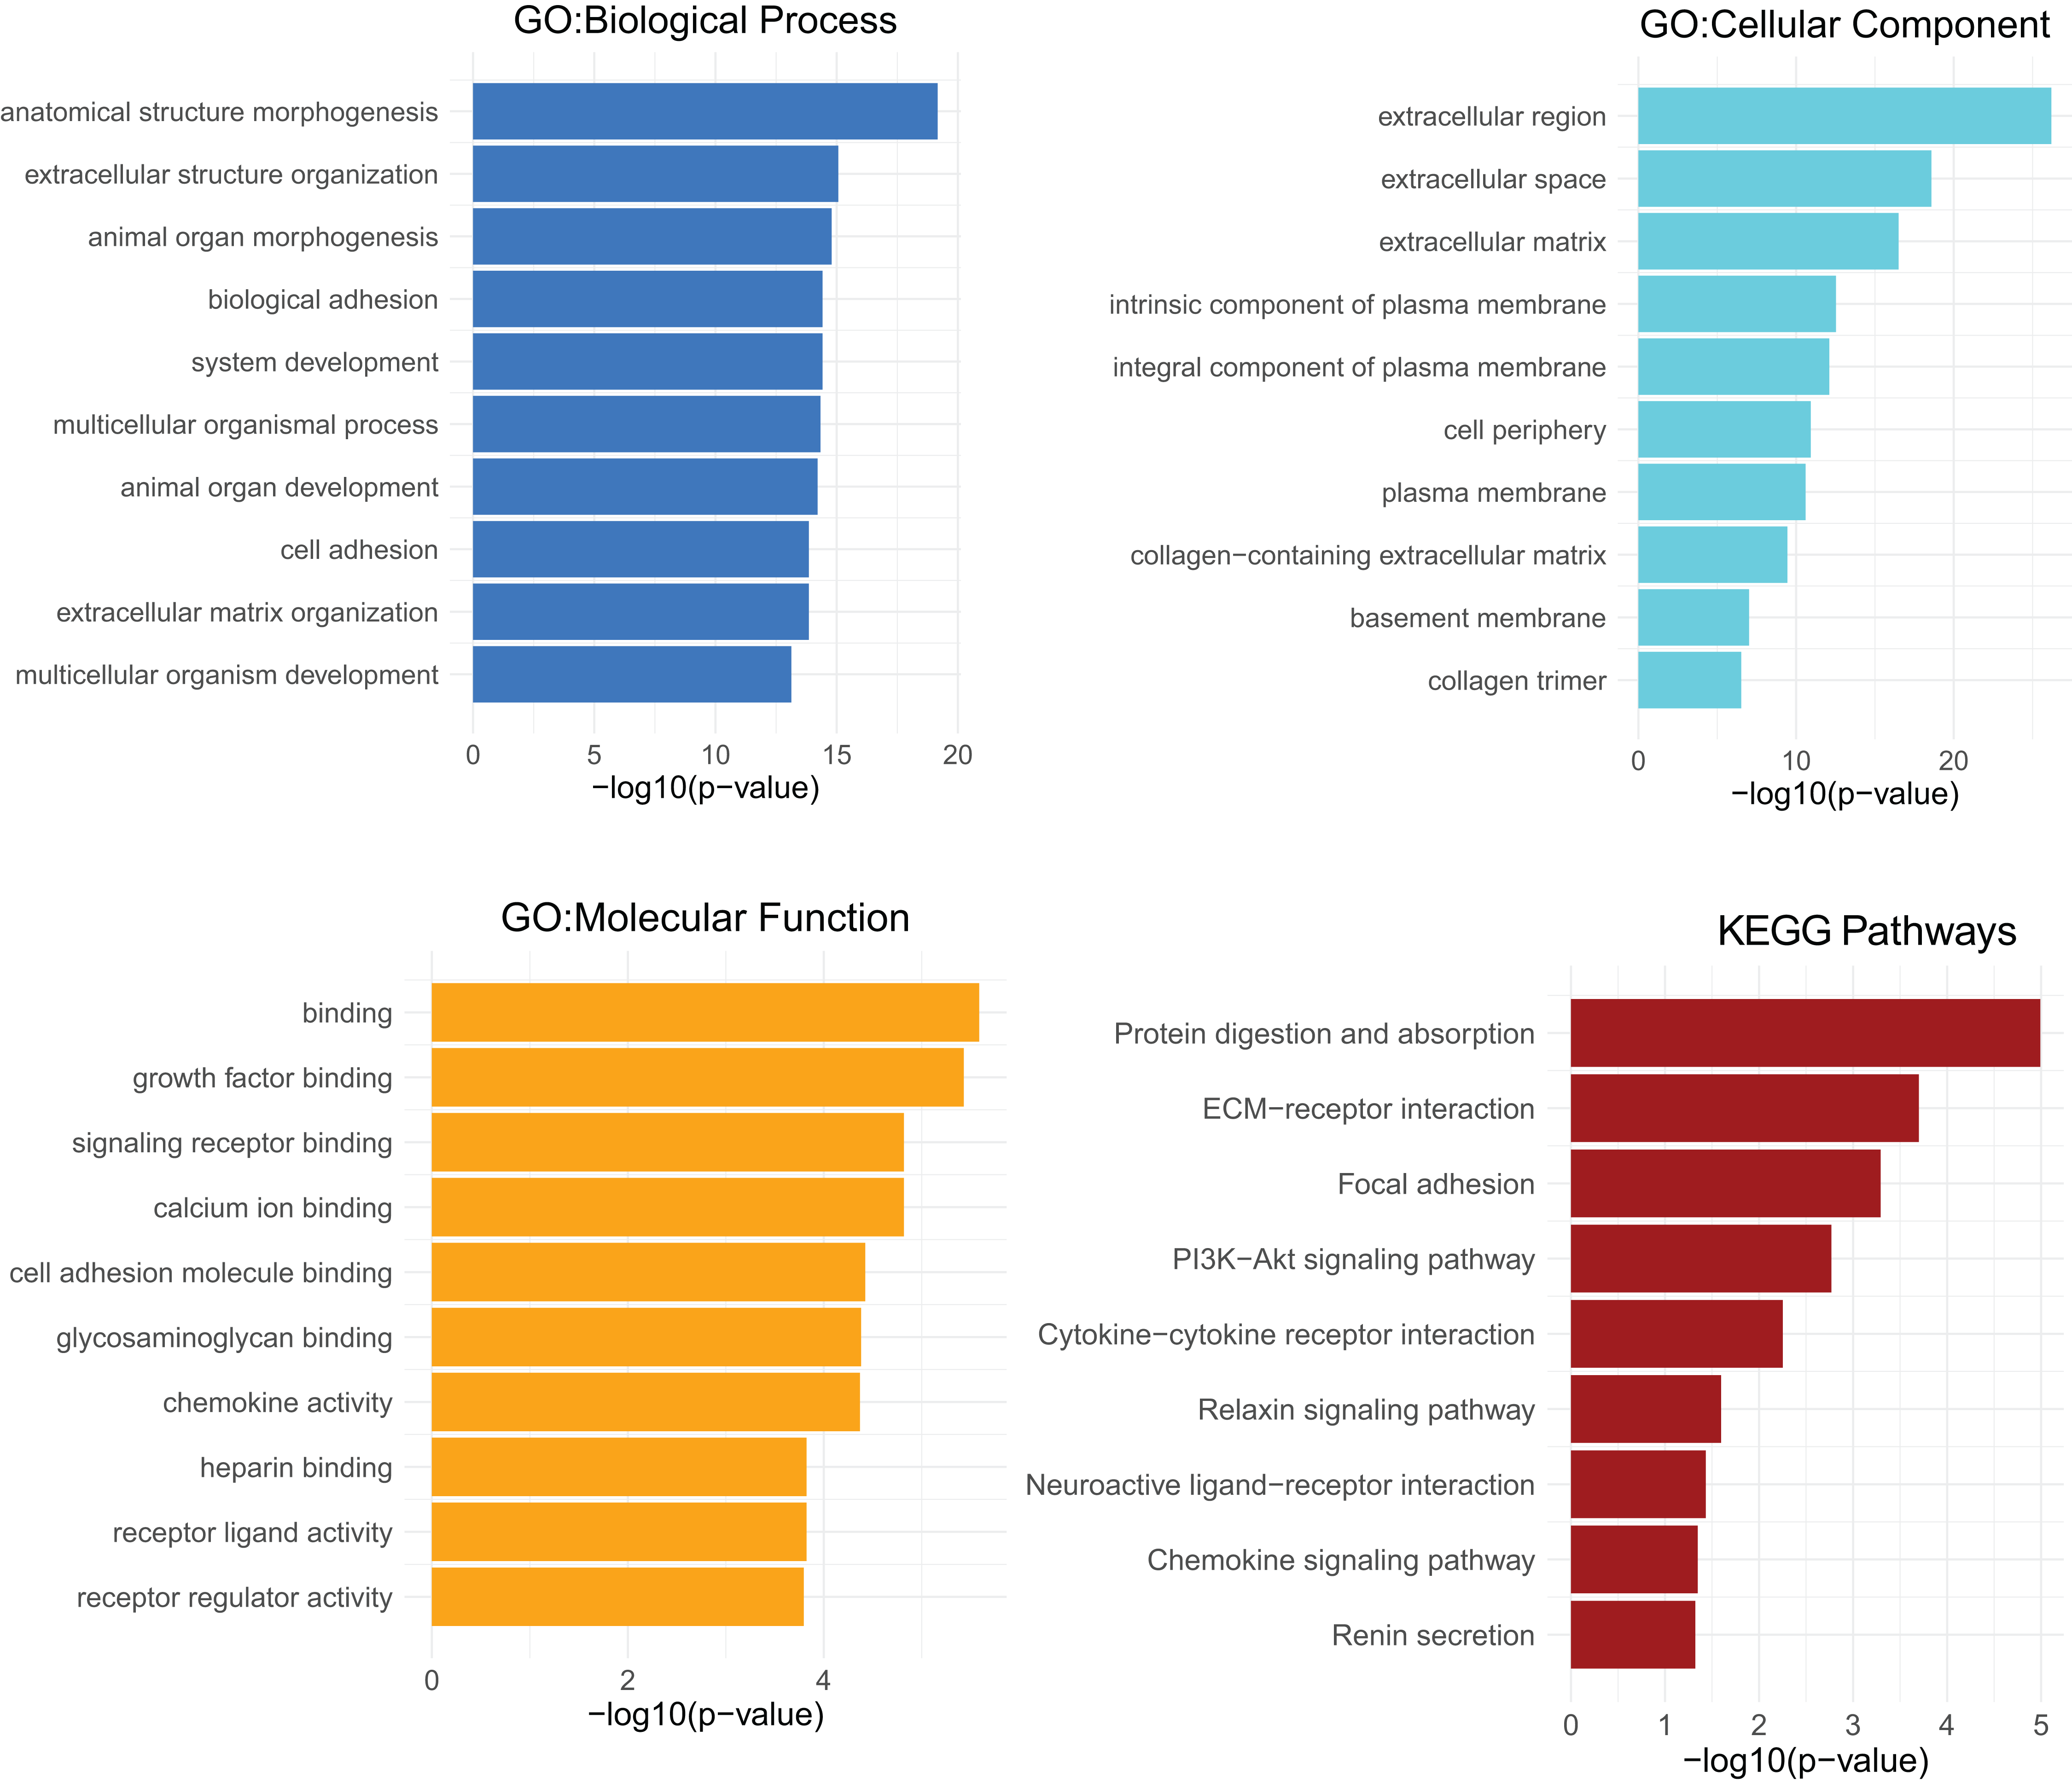
Discussion
Our study showed CXCL12 expression was extremely low in blood and bone marrow compared with other normal tissues and also downgraded in hematological neoplasms among pan-carcinomas. For our purpose, we then validated the expression differences between AML and their normal contrasts in two independent cohorts and found a consistent result. Herein, we concluded that CXCL12 was notably down-regulated in AML. Hitherto, there hasn’t been enough researches to investigate CXCL12 expression in AML, although its receptor CXCR4 has been demonstrated to be overexpressed in AML (Rombouts et al., 2004). To our knowledge, CXCL12 plays a prominent role in the interaction between AML cells and the BM microenvironment, and the CXCL12/CXCR4-axis is importantly involved in the migration, infiltration and overproliferation of AML cells (Ladikou et al., 2020).
The clinical implications of CXCL12 were further investigated. CXCL12low patients tended to have higher WBC counts and more percentages of blasts, implying more active proliferation of CXCL12-reduced AML cells. Moreover, CXCL12low patients were more likely to harbor FLT-ITD and NPM1 mutations and less often to have TP53 mutation.
Concerning prognostic relevance, we identified and validated low CXCL12 expression as a prognostic indicator for inferior OS and EFS in all AML, non-M3-AML, and CN-AML patients. In fact, high CXCR4 expression level has been associated with inferior prognosis of AML (Burger & Bürkle, 2007; Spoo et al., 2007) and CXCR4 antagonists such as AMD3100 have been proven to enhance chemosensitization of AML (Nervi et al., 2009). However, it was interesting to discover the predictive value of CXCL12 for AML prognosis exactly opposite to CXCR4, which was beyond our expectation. Previously, Petit I et al. demonstrated that up-regulation of CXCR4 could serve to increase the sensitivity of cells to lower CXCL12 signals (Petit et al., 2002), and Mandawat et al. found that exposure to CXCL12 caused the lowering of the surface expression of CXCR4 on AML cells (Mandawat et al., 2010), which might provide an explanation for this phenomenon. Moreover, we pointed out that FLT3-ITD absent patients and NPM1 mutated patients could be further subdivided into high-risk groups (with CXCL12 down-regulation) and low-risk groups (with CXCL12 up-regulation) respectively based on the expression level of CXCL12.
GO analysis helped us understand the concrete functions of CXCL12 and the result showed that the gene dynamically participated in anatomical structure morphogenesis for biological process, extracellular region for cellular component, and binding for molecular function. It was also reasonable to extrapolate protein digestion and absorption pathway was curbed molecularly in some way during the development of AML. It has been widely evidenced that CXCL12 plays an essential role in stem cell anchorage to the BM microenvironment and reduction of CXCL12 concentrations within the BM may interfere with retention and facilitate the egress of cells (Petit et al., 2002), which could promote the progress of AML. As previously demonstrated, CXCL12 promoted glycolytic reprogramming in AML cells (Braun et al., 2016) whereas the malignant cells could benefit from aerobic glycometabolism, which endowed them with better capacity for cell proliferation, immune evasion, and chemotherapeutics resistance (Vander Heiden, Cantley & Thompson, 2009). Low CXCL12 expression restrained glycolytic reprogramming and indirectly promoted aerobic glycometabolism might become one of the possible mechanisms for low CXCL12 expression inducing poor AML prognosis. When analyzing the relationship between CXCL12 and immune cell infiltration, we found high CXCL12 expressed groups tended to harbor more memory B cells and plasma cells infiltration while low CXCL12 expressed groups exhibited more eosinophils infiltration. However, the pathological role of CXCL12 in AML is still largely unknown and needs to be elucidated in future studies.
Although we had been committing ourselves to make the research as comprehensive and credible as possible, there were still several drawbacks that couldn’t be ignored. Firstly, the collections were entirely acquired from the public database due to the quantity of clinical data was too limited to conduct such a large-scale analysis. We attempted to mend it by analyzing multi-group independent datasets to guarantee our results convincing. And secondly, we did not carry out subsequent experiments to authenticate our results, so more laboratory proofs such as protein level verification are required to be offered for our research.
Conclusions
In summary, we carry out a large-scale data analysis of the potential relationship between CXCL12 and AML for the first time. CXCL12 is significantly down-regulated in AML and low CXCL12 expression is an independent and poor predictor of clinical outcome of AML. The gene could provide additional prognostic value in FLT3-ITD absent or NPM1 mutated AML patients. Furthermore, our research replenishes the understanding of the immune and clinical association between CXCL12 and AML, which could help clinicians to explore new targeted drugs and immunotherapy for AML. Finally, further experiments are warranted to support our findings.
Supplemental Information
The expression pattern of CXCL12 during differentiation and maturation of hematopoietic stem cells (HSCs) in GSE42519.
The dashed line outlines the average expression level of the entire hematopoietic cells.
CXCL12 and CXCR4 expression in the single-cell data sequenced by Van Galen et al.
(A) CXCL12 expression in several hematological cells including hematopoietic stem cells (HSCs), multipotent progenitor cells (MPPs), granulo-monocyte progenitor cells (GMPs), common myeloid progenitor cells (CMPs), megakaryocyte-erythroid progenitor cells (MEPs), Monocytes, and Erythrocytes. The dot diameter represents the expression percentage, and the color represents the average expression level. (B) Uniform manifold approximation and projection (UMAP) dimension 1 and 2 plots display CXCL12 (left) and CXCR4 (right) expression overlay onto UMAP space in single cells including HSCs, MPPs, GMPs, CMPs, MEPs, Monocytes, and Erythrocytes.
Validation of the prognostic significance of CXCL12 in the GSE6891 cohort.
(A, D) Kaplan-Meier estimate for OS (A) and EFS (D) of whole-AML. (B, E) Kaplan-Meier estimate for OS (B) and EFS (E) of non-M3-AML. (C, F) Kaplan-Meier estimate for OS (C) and EFS (F) of CN-AML.
Validation of the prognostic significance of CXCL12 in the GSE10358 cohort.
(A, D) Kaplan-Meier estimate for OS (A) and EFS (D) of whole-AML. (B, E) Kaplan-Meier estimate for OS (B) and EFS (E) of non-M3-AML. (C, F) Kaplan-Meier estimate for OS (C) and EFS (F) of CN-AML.
Correlation of CXCL12 expression with infiltration levels of cell types as indicated in TCGA dataset.
Multiple deconvolution methods including TIMER, quanTIseq, xCell, MCP-counter, and EPIC are adopted. Each dot represents a single AML patient, and a regression line was delineated to fit the dot plot.
261 cytokine and cytokine receptor genes.
A total of 261 cytokine and cytokine receptor genes are listed.
Genes differently expressed between AML patients and normal controls in GSE30029.
All genes were screened with the difference considered significant if adjusted p-value < 0.05 and |logFC| > 0.
Genes differentially expressed between AML patients and normal controls in GSE63270.
All genes were screened with the difference considered significant if adjusted p-value < 0.05 and |logFC| > 0.