
Genome-wide identification of MAXs genes for strigolactones synthesis/signaling in solanaceous plants and analysis of their potential functions in tobacco
- Published
- Accepted
- Received
- Academic Editor
- Brenda Oppert
- Subject Areas
- Agricultural Science, Bioinformatics, Biotechnology, Genomics, Plant Science
- Keywords
- Strigolactone biosynthesis, Strigolactone signal transduction, Cis-elements, MAXs gene family, Shoot development, Abiotic stress
- Copyright
- © 2023 Wang et al.
- Licence
- This is an open access article distributed under the terms of the Creative Commons Attribution License, which permits unrestricted use, distribution, reproduction and adaptation in any medium and for any purpose provided that it is properly attributed. For attribution, the original author(s), title, publication source (PeerJ) and either DOI or URL of the article must be cited.
- Cite this article
- 2023. Genome-wide identification of MAXs genes for strigolactones synthesis/signaling in solanaceous plants and analysis of their potential functions in tobacco. PeerJ 11:e14669 https://doi.org/10.7717/peerj.14669
Abstract
The more axillary growth (MAX) gene family is a group of key genes involved in the synthesis and signal transduction of strigolactones (SLs) in plants. Although MAX genes play vital roles in plant growth and development, characterization of the MAX gene family has been limited in solanaceous crops, especially in tobacco. In this study, 74 members of the MAX family were identified in representative Solanaceae crops and classified into four groups. The physicochemical properties, gene structure, conserved protein structural domains, cis-acting elements, and expression patterns could be clearly distinguished between the biosynthetic and signal transduction subfamilies; furthermore, MAX genes in tobacco were found to be actively involved in the regulation of meristem development by responding to hormones. MAX genes involved in SL biosynthesis were more responsive to abiotic stresses than genes involved in SL signaling. Tobacco MAX genes may play an active role in stress resistance. The results of this study provide a basis for future in-depth analysis of the molecular mechanisms of MAX genes in tobacco meristem development and stress resistance.
Background
Strigolactone (SL) is a novel phytohormone produced in plant roots. Studies have shown that SLs inhibit plant branching, shape root morphology, promote leaf senescence, regulate secondary plant growth, and participate in abiotic stress responses and photomorphogenesis (Tang & Chu, 2020). Genes that have been identified as components of the strigolactone biosynthetic pathway include the cytochrome P450 monooxygenase-encoding MORE AXILLARY GROWTH 1 (MAX1) (Zhang et al., 2018), CAROTENOID CLEAVAGE DIOXYGENASE 7 (CCD7/MAX3), and CAROTENOID CLEAVAGE DIOXYGENASE 8 (CCD8/MAX4) (Decker et al., 2017). In addition, the gene MAX2 is involved in strigolactone signal transduction; MAX2 is an F-box protein that acts as a central regulator in strigolactone signaling.
Strigolactone is mainly synthesized in the root tip (Kohlen et al., 2011). The synthesis process from carotenoid to biologically active SL requires the involvement of at least five enzymes in the following order: β-carotenoid isomerase DWARF27 (D27) (Lin et al., 2009); carotenoid cleavage dioxygenase 7 (CCD7) encoded by the MAX3/DAD3/RMS5/D17 gene (Zou et al., 2006); MAX4/ DAD1/RMS1/D10 gene encoding carotenoid cleavage dioxygenase 8 (CCD8) (Sorefan et al., 2003); MAX1 (MORE AXILLARY GROWTH 1) encoding cytochrome P450 monooxygenase (Booker et al., 2005); LATERAL BRANCHING OXIDOREDUCTASE (LBO), which acts on the CYP711A1 product in non-canonical SLs (Brewer et al., 2016), and CYP722C plays a key role in synthesizing both strigol- and ORO-type canonical SLs for canonical SLs (Wang et al., 2022; Wakabayashi et al., 2020). Mutants of these genes all produce a more-branching phenotype (Lin et al., 2009; Sorefan et al., 2003; Stirnberg, van de Sande & Leyser, 2002; Snowden et al., 2005; Lazar & Goodman, 2005; Arite et al., 2007; Drummond et al., 2009; Waters et al., 2012).
MAX1 acts downstream of MAX3 and MAX4, of which there is only one copy in Arabidopsis, two of the five MAX1 homologous genes in rice have been confirmed to be involved in the synthesis of strigolactone (Abe et al., 2014; Seto et al., 2014; Zhang et al., 2014). MAX1 also has one homologue in tomato, SlMAX1/CYP711A21, the tomato Slmax1 mutant has a higher number of branches (Zhang et al., 2018). Knockdown of two MAX1 homologs in rapeseed using CRISPR/Cas9 can significantly reduce plant height and increase yield (Zheng et al., 2020). MAX2 can promote a variety of hormones that affect the establishment of plant photomorphogenesis, such as its involvement in the regulation of branching by the BES1 pathway; in addition, MAX2 has important roles in responses to abiotic stresses, drought and pathogenic microbes (Chevalier et al., 2014; Wang et al., 2013). Research on MAX2-mediated plant growth and development pathways still requires further study.
MAX3-encoded CCD7 acts in chloroplasts. Sequence analysis of homologous genes encoding CCD7 in Arabidopsis, pea, petunia and rice demonstrated that the regulation mechanism of MAX3 in plant branching is conserved in monocotyledons and dicotyledons (Zou et al., 2006), MAX4-encoded CCD8 may not only involve in the biosynthesis of SLs, but also affect plant reproductive development in other pathways (Kohlen et al., 2012).
Double mutant analysis and reciprocal grafting experiments using max1, max2, max3 and max4 mutants in Arabidopsis demonstrated that the MAX1–MAX4 genes act in the same pathway (Booker et al., 2005), as four key genes in the synthesis and signaling of SLs, knockout mutants exhibit increased tiller number and dwarf phenotypes, although phenotypic differences exist between different MAXs genes. Until recently, distribution of MAX gene family members in solanaceous species (especially tobacco) had not been reported (Challis et al., 2013).
In the present study, we analyzed the physicochemical properties, conserved regions, phylogeny, cis-acting elements, and expression patterns of the MAX gene family. This was accomplished by comparing the genomes of different representative solanaceous crop species including tobacco, tomato, potato, petunia, and pepper. MAX gene expression was explored before and after topping treatment in combination with hormone or stress treatments. The results serve as a reference for future in-depth study of MAX gene functions in tobacco.
Materials and Methods
Identification of MAX genes
Genomic information, chromosome locations, protein sequences, and coding sequences (CDSs) of Nicotiana tabacum TN90, Nicotiana tabacum BX, Nicotiana tabacum K326, Nicotiana sylvestris, Nicotiana tomentosiformis, Nicotiana benthamiana, Solanum lycopersicoides, Solanum tuberosum, Petunia hybrida, Capsicum annuum, Arabidopsis thaliana, and Oryza sativa were downloaded from The Sol Genomics Network (https://solgenomics.net). Two methods were used to identify members of the MAX gene family. First, the conserved domains of MAX1–MAX4 were downloaded from the Pfam database (http://pfam.xfam.org/; MAX1: PF00067, MAX2: PF18511, MAX3 and MAX4: PF03055) (Czarnecki et al., 2014). These were used as template sequences to identify candidate family members using HMM3.0 (http://hmmer.org/download.html) with an E-value cutoff of 1.0. S, the amino acid sequences of the Arabidopsis MAX1–MAX4 members (AT2G26170.1, AT2G42620.1, AT2G44990.1, AT4G32810.1) were compared within the whole genome using the BLASTP method (threshold E≤1e−10) to obtain candidate members. Candidate family members were manually filtered using SMART (http://smart.embl-heidelberg.de) (PFAM domains) and NCBI (https://www.ncbi.nlm.nih.gov) to obtain the final set of MAX gene family members.
Evolutionary analysis and classification of MAX genes
The protein sequences of the identified MAX gene family members (Table S1) were compared with known Arabidopsis and rice MAX protein sequences using ClustalW (Larkin et al., 2007). Multiple sequence alignments were displayed with Jalview (Waterhouse et al., 2009). An unrooted phylogenetic tree was constructed using MEGA7.0 (Sudhir, Glen & Koichiro, 2016) with the maximum likelihood method based on the poisson correction model and 1,000 bootstrap replicates, the gap opening penalty was 10.
Sequence and structural characterization of MAX genes
Physicochemical properties such as amino acid number, molecular weight (MW), and theoretical isoelectric point (pI) of MAXs were calculated with ExPASy (https://www.expasy.org/vg/index/Protein). Subcellular localizations were predicted with CELLO v.2.5 (https://mybiosoftware.com/cello-v-2-5-subcellular-localization-predictor.html). Protein sequences of the MAX family were analyzed using MEME (https://meme-suite.org/meme/), and the Gene Structure Display Server (GSDS, v2.0, http://gsds.gao-lab.org/) was used to map MAX gene structure.
Analysis of cis-acting elements of MAX promoters
For each tobacco MAX gene, the 3-kb region upstream of the transcription start site was extracted with TBtools (Chen et al., 2020) and analyzed with the PLACE database (https://www.dna.affrc.go.jp/PLACE/?action=newplace) and the PlantPAN3.0 database (http://plantpan.itps.ncku.edu.tw/promoter.php). This was done to identify potential transcription factor binding sites and cis-acting elements associated with growth, development, hormone responses, and stress responses.
Re-analyzing RNAseq dataset of MAX
The transcriptome data of root, leaf, flower and fruit (six developmental stages) of tomato MAX genes (The Tomato Genome Consortium, 2012), and the transcriptome data of roots (0, 0.5, 1, 3, 5, 8 and 24 h after topping) of tobacco Yunyan 87 (Qin et al., 2020) MAX genes were analyzed separately. The heatmap was constructed by TBtools.
Total RNA extraction and fluorescence quantitative PCR (qPCR)
Nicotiana tabacum L. cv. ‘honghuadajinyuan’ was grown in the greenhouse. The seeds were obtained from the Tobacco Research Institute (TRI) of the Chinese Academy of Agricultural Sciences (CAAS). Total RNA was extracted from the roots, stems, leaves, flowers, apical buds, and axillary buds during the vigorous growth period using the GeneJET™ Plant RNA Purification Mini Kit (MBI Fermentas, Burlington, Canada). Samples were run on 1% agarose gels and purity was assessed with a NanoDrop2000 spectrophotometer. Total RNA was reverse transcribed using the RevertAid™ First-Strand cDNA Synthesis Kit (MBI Fermentas, Burlington, Canada). Quantitative reverse transcription (qRT)-PCR and qPCR were performed with the resulting cDNA and TB Green™ Premix Ex Taq™ II (TliRNaseH Plus) (TaKaRa, Japan) with primers specific to the candidate genes (Table 1). Actin gene was selected as the internal reference gene for normalization. Each sample was analyzed with three replicates. The relative expression levels were calculated using the 2 method (Livak & Schmittgen, 2002).
| Name | Sequence (5′–3′) | |
|---|---|---|
| F | R | |
| NtMAX1 | TGGCTCTTGGAGTTCTTGCT | TCCATAAGGGGAGAGTGTCG |
| NtMAX2 | AGGTGAGGCATCAAGCAACT | AAGCTCACCAACACCAATCC |
| NtMAX3 | TCCTGAAAGGTGGGAAGATG | GGGCTTCAAGATTTGAGCAG |
| NtMAX4 | ACCATTCTTTGTGCCTCGAC | TGCAGTCCATAGGGAAGACC |
| NtActin | CAAGGAAATCACCGCTTTGG | AAGGGATGCGAGGATGGA |
Hormone, topping, and stress treatments
Hormone treatments were applied to N. tabacum L. cv. ‘honghuadajinyuan’ during the vigorous growth period. These treatments comprised 0.1 mmol/l abscisic acid (ABA) (Wang & Qiang, 2012), 0.0001 mol/l indole-3-acetic acid (IAA) (Vehn & Sauer, 2017), 300 mM sucrose, 50 µM of the synthetic strigolactone analog GR24 (Fan et al., 2021), and 200 µM 6-benzylaminopurine (6-BA) (Wang et al., 2017) according to published references. The axillary buds of the first leaf were also sampled before topping and 1, 3, and 5 d after topping according to published references (Wang et al., 2018). Plants were treated with simulated drought stress (260 µmol L-1 mannitol) or low temperature stress (4 °C) then sampled at 1, 2, 4, and 8 d (Zhang et al., 2015) or at 1 and 2 d (Gu et al., 2021), respectively. There were three biological replicates for each treatment. The results were analyzed with TBtools and Sigmaplot 10.0 software.
Subcellular localization analysis of representative MAX proteins in tobacco
CDSs of NtMAX2, NtMAX3, and NtMAX4 were each cloned with the stop codon removed, then inserted into the PYG57 vector using the restriction enzymes SacI and SpeI. The recombinant vectors and empty plasmid were each transformed into Agrobacterium tumefaciens EHA105. Four-day-old leaves of Nicotiana benthamiana were inoculated with transformed Agrobacterium EHA105 via needle prick. Plants were then incubated continuously at 28 °C with a 16/8 h light/dark cycle. Leaves were photographed using a Leica TCS SP8 laser confocal microscope (Leica, Mannheim, Germany).
Results
Identification of MAX genes
A total of 74 non-redundant MAX family proteins were identified in tobacco, tomato, potato, petunia, and pepper. The gene ID, protein length, molecular weight, isoelectric point, and subcellular localization of 89 MAX family members (including in Arabidopsis and rice) are shown in Table 2. PI values of MAX1 homologs were all in the alkaline range, whereas PI values of the MAX2 and MAX4 homologs were all in the acidic range. It is noteworthy that for the selected solanaceous crops, members of the MAX1, MAX2, and MAX3/MAX4 sub-families were mainly localized in the mitochondria, nucleus, and cytoplasm, respectively. This implies that different sub-types of MAX proteins may perform different functions. Table 3 shows the number of MAX sub-family members predicted in different species, as well as the ranges of PI and MW values and protein lengths. The results showed that the MAX family was not large in either monocotyledons or dicotyledons; Nicotiana sylvestris contained the largest MAX4 sub-family, with 16 members, but whether these 16 homologous genes have functional redundancy needs further experimental verification.The distribution of genes within each sub-family was similar between species.
| Protein | MAX1 | |||||
|---|---|---|---|---|---|---|
| Species | Gene ID | Length | MW (k Da) | PI | Subcellular localization | |
| Nicotiana tabacum (K326) | mRNA_49921 | 467 | 53.08 | 8.79 | Mitochondrial | |
| Nicotiana tabacum (TN90) | mRNA_42371 | 559 | 63.55 | 9.02 | PlasmaMembrane/Mitochondrial | |
| Nicotiana tabacum (BX) | mRNA_49611 | 559 | 63.55 | 0.02 | PlasmaMembrane/Mitochondrial | |
| Nicotiana tomentosiformis | / | / | / | / | ||
| Nicotiana sylvestris | mRNA_44016 | 560 | 63.52 | 8.95 | PlasmaMembrane/Mitochondrial | |
| Nicotiana benthamiana | Niben101Scf01777g03001.1 | 515 | 58.52 | 8.91 | Mitochondrial | |
| Solanum lycopersicum | Solyc08g062950.2.1 | 519 | 58.71 | 8.85 | Mitochondrial | |
| Arabidopsis thaliana | AT2G26170.1 | 522 | 59.43 | 9.31 | PlasmaMembrane/Mitochondrial | |
| Oryza sativa | LOC_Os01g50530.1 | 411 | 46.79 | 8.56 | Mitochondrial/Cytoplasmic | |
| LOC_Os01g50580.1 | 385 | 43.2 | 5.66 | Cytoplasmic | ||
| LOC_Os01g50590.1 | 516 | 57.96 | 7.75 | Mitochondrial | ||
| LOC_Os02g12890.1 | 548 | 60.56 | 8.55 | Mitochondrial/PlasmaMembrane | ||
| LOC_Os02g12890.2 | 423 | 46.73 | 7.17 | Cytoplasmic/Mitochondrial | ||
| LOC_Os06g36920.1 | 549 | 60 | 9.63 | Mitochondrial | ||
| Solanum tuberosum | PGSC0003DMT400014456 | 519 | 58.66 | 8.75 | Mitochondrial | |
| Petunia hybrida | Peaxi162Scf00327g00049.1 | 533 | 60.47 | 9.1 | Mitochondrial | |
| Capsicum annuum | CA08g05010 | 534 | 60.11 | 9.23 | PlasmaMembrane/Mitochondrial | |
| Nicotiana tabacum (K326) | mRNA_29422 | 726 | 81.06 | 5.74 | Nuclear/Cytoplasmic | MAX2 |
| mRNA_29423 | 726 | 81.06 | 5.74 | Nuclear/Cytoplasmic | ||
| mRNA_29424 | 726 | 81.06 | 5.74 | Nuclear/Cytoplasmic | ||
| Nicotiana tabacum (TN90) | mRNA_20815 | 726 | 81.06 | 5.74 | Nuclear/Cytoplasmic | |
| mRNA_20816 | 726 | 81.06 | 5.74 | Nuclear/Cytoplasmic | ||
| mRNA_20817 | 726 | 81.06 | 5.74 | Nuclear/Cytoplasmic | ||
| mRNA_20818 | 726 | 81.06 | 5.74 | Nuclear/Cytoplasmic | ||
| Nicotiana tabacum (BX) | / | / | / | / | ||
| Nicotiana tomentosiformis | mRNA_48826 | 352 | 39.51 | 5.52 | Nuclear/Extracellular | |
| Nicotiana sylvestris | mRNA_67458_cds | 727 | 81.03 | 5.74 | Nuclear/Cytoplasmic | |
| mRNA_67459_cds | 727 | 81.03 | 5.74 | Nuclear/Cytoplasmic | ||
| mRNA_67460_cds | 727 | 81.03 | 5.74 | Nuclear/Cytoplasmic | ||
| Nicotiana benthamiana | Niben101Scf00536g02005.1 | 601 | 66.77 | 5.66 | Cytoplasmic/Nuclear | |
| Niben101Scf01068g01004.1 | 683 | 75.85 | 5.94 | Nuclear/Extracellular | ||
| Niben101Scf04933g00008.1 | 683 | 75.74 | 5.53 | Extracellular | ||
| Niben101Scf09559g00005.1 | 726 | 80.89 | 5.7 | Cytoplasmic/Extracellular/Nuclear | ||
| Niben101Scf10248g01017.1 | 561 | 62.33 | 5.85 | Cytoplasmic/Nuclear | ||
| Solanum lycopersicum | Solyc07g055120.2.1 | 676 | 75.74 | 5.55 | Nuclear/Extracellular | |
| Solyc12g010900.1.1 | 722 | 80.74 | 5.94 | Extracellular | ||
| Arabidopsis thaliana | AT2G42620.1 | 693 | 77.42 | 5.36 | Nuclear/PlasmaMembrane | |
| Oryza sativa | LOC_Os06g06050.1 | 720 | 79.23 | 5.33 | Cytoplasmic/PlasmaMembrane | |
| Solanum tuberosum | PGSC0003DMT400013844 | 723 | 80.71 | 5.73 | PlasmaMembrane/Cytoplasmic | |
| PGSC0003DMT400057424 | 711 | 79.42 | 5.4 | Nuclear/Extracellular | ||
| Petunia hybrida | Peaxi162Scf00469g00034.1 | 561 | 62.65 | 6.1 | Cytoplasmic/Nuclear/Extracellular | |
| Peaxi162Scf00384g00211.1 | 695 | 77.77 | 5.85 | Extracellular/Cytoplasmic | ||
| Capsicum annuum | CA09g13650 | 721 | 80.84 | 6.1 | Cytoplasmic/Nuclear | |
| CA00g44080 | 706 | 78.9 | 5.05 | PlasmaMembrane/Nuclear | ||
| Nicotiana tabacum (K326) | mRNA_108065 | 157 | 17.66 | 8.55 | Cytoplasmic/Chloroplast | MAX3 |
| mRNA_108066 | 336 | 37.91 | 6.08 | Extracellular | ||
| mRNA_108067 | 651 | 73.27 | 6.43 | Cytoplasmic | ||
| mRNA_34367 | 256 | 28.88 | 5.59 | Cytoplasmic | ||
| Nicotiana tabacum (TN90) | mRNA_51017 | 651 | 73.27 | 6.43 | Cytoplasmic | |
| mRNA_51018 | 336 | 37.91 | 6.08 | Extracellular | ||
| Nicotiana tabacum (BX) | mRNA_110488 | 295 | 32.97 | 8.75 | Mitochondrial/Cytoplasmic | |
| Nicotiana tomentosiformis | mRNA_68553 | 651 | 73.19 | 6.43 | Cytoplasmic | |
| Nicotiana sylvestris | \ | \ | \ | \ | ||
| Nicotiana benthamiana | Niben101Scf00878g02006.1 | 651 | 73.8 | 6.43 | Cytoplasmic | |
| Solanum lycopersicum | Solyc01g090660.2.1 | 663 | 75.03 | 7.25 | Cytoplasmic | |
| Arabidopsis thaliana | AT2G44990.1 | 629 | 70.86 | 6.3 | Nuclear/Cytoplasmic | |
| Oryza sativa | LOC_Os04g46470.1 | 609 | 68.19 | 9.19 | Mitochondrial | |
| Solanum tuberosum | PGSC0003DMT400045162 | 645 | 72.88 | 6.61 | Cytoplasmic | |
| Petunia hybrida | Peaxi162Scf00377g00829 | 621 | 69.94 | 5.96 | Cytoplasmic | |
| Capsicum annuum | CA00g32540 | 646 | 72.73 | 6.27 | Cytoplasmic | |
| Nicotiana tabacum (K326) | mRNA_112609 | 555 | 62.2 | 6.18 | Cytoplasmic | MAX4 |
| mRNA_141629 | 556 | 62.35 | 5.98 | Cytoplasmic | ||
| Nicotiana tabacum (TN90) | mRNA_89885 | 556 | 62.35 | 5.98 | Cytoplasmic | |
| mRNA_98197 | 555 | 62.2 | 6.18 | Cytoplasmic | ||
| Nicotiana tabacum (BX) | mRNA_104099 | 556 | 62.35 | 5.98 | Cytoplasmic | |
| mRNA_112966 | 555 | 62.2 | 6.18 | Cytoplasmic | ||
| Nicotiana tomentosiformis | mRNA_52451 | 556 | 62.19 | 6.3 | Cytoplasmic | |
| Nicotiana sylvestris | mRNA_11465_cds | 357 | 40.35 | 5.31 | Cytoplasmic | |
| mRNA_11466_cds | 375 | 42.34 | 5.53 | Cytoplasmic | ||
| mRNA_11467_cds | 368 | 41.65 | 5.53 | Cytoplasmic | ||
| mRNA_11468_cds | 557 | 62.5 | 6.34 | Cytoplasmic | ||
| mRNA_11469_cds | 444 | 50.18 | 6.21 | Cytoplasmic | ||
| mRNA_11470_cds | 442 | 49.96 | 6.21 | Cytoplasmic | ||
| mRNA_51723_cds | 601 | 68.13 | 5.99 | Cytoplasmic | ||
| mRNA_51724_cds | 585 | 66.44 | 5.96 | Cytoplasmic | ||
| mRNA_8034_cds | 441 | 49.6 | 6.11 | Cytoplasmic | ||
| mRNA_8035_cds | 547 | 61.15 | 6.02 | Cytoplasmic | ||
| mRNA_8036_cds | 441 | 49.6 | 6.11 | Cytoplasmic | ||
| mRNA_8037_cds | 562 | 62.93 | 5.93 | Cytoplasmic | ||
| mRNA_8038_cds | 441 | 49.6 | 6.11 | Cytoplasmic | ||
| mRNA_8039_cds | 441 | 49.6 | 6.11 | Cytoplasmic | ||
| mRNA_8040_cds | 441 | 49.6 | 6.11 | Cytoplasmic | ||
| mRNA_85696_cds | 601 | 65.7 | 6.62 | Chloroplast | ||
| Nicotiana benthamiana | Niben101Scf01056g05003.1 | 127 | 14.7 | 5 | PlasmaMembrane/Chloroplast | |
| Niben101Scf01611g07010.1 | 555 | 62.36 | 5.98 | Cytoplasmic | ||
| Solanum lycopersicum | Solyc08g066650.2.1 | 557 | 62.08 | 6.37 | Cytoplasmic | |
| Arabidopsis thaliana | AT4G32810.1 | 570 | 63.96 | 6.65 | Cytoplasmic | |
| Oryza sativa | LOC_Os01g38580.1 | 552 | 59.92 | 5.88 | Chloroplast | |
| LOC_Os01g38580.2 | 506 | 54.88 | 6.29 | Chloroplast | ||
| LOC_Os01g54270.1 | 801 | 87.95 | 5.89 | Chloroplast/Mitochondrial | ||
| Solanum tuberosum | \ | \ | \ | |||
| Petunia hybrida | Peaxi162Scf00227g00714.1 | 556 | 62.1 | 6.33 | Cytoplasmic | |
| Capsicum annuum | CA11g14280 | 534 | 56.15 | 6.04 | Cytoplasmic | |
| K326 | TN90 | BX | Ntom | Nsyl | Niben | Tomato | Potato | Petunia | Pepper | Arabidopsis | Rice | Length | MW (k Da) | PI | |
|---|---|---|---|---|---|---|---|---|---|---|---|---|---|---|---|
| MAX1 | 1 | 1 | 1 | / | 1 | 1 | 1 | 1 | 1 | 1 | 1 | 6 | 467–560 | 53.08–63.55 | 8.79–9.23 |
| MAX2 | 3 | 4 | / | 1 | 3 | 5 | 2 | 2 | 2 | 2 | 1 | 1 | 352–727 | 39.51–81.06 | 5.05–6.1 |
| MAX3 | 4 | 2 | 1 | 1 | / | 1 | 1 | 1 | 1 | 1 | 1 | 1 | 157–663 | 17.66–75.03 | 5.59–8.75 |
| MAX4 | 2 | 2 | 2 | 1 | 16 | 2 | 1 | / | 1 | 1 | 1 | 3 | 127–601 | 14.7–68.13 | 5–6.62 |
Phylogenetic and structural analysis of MAX genes
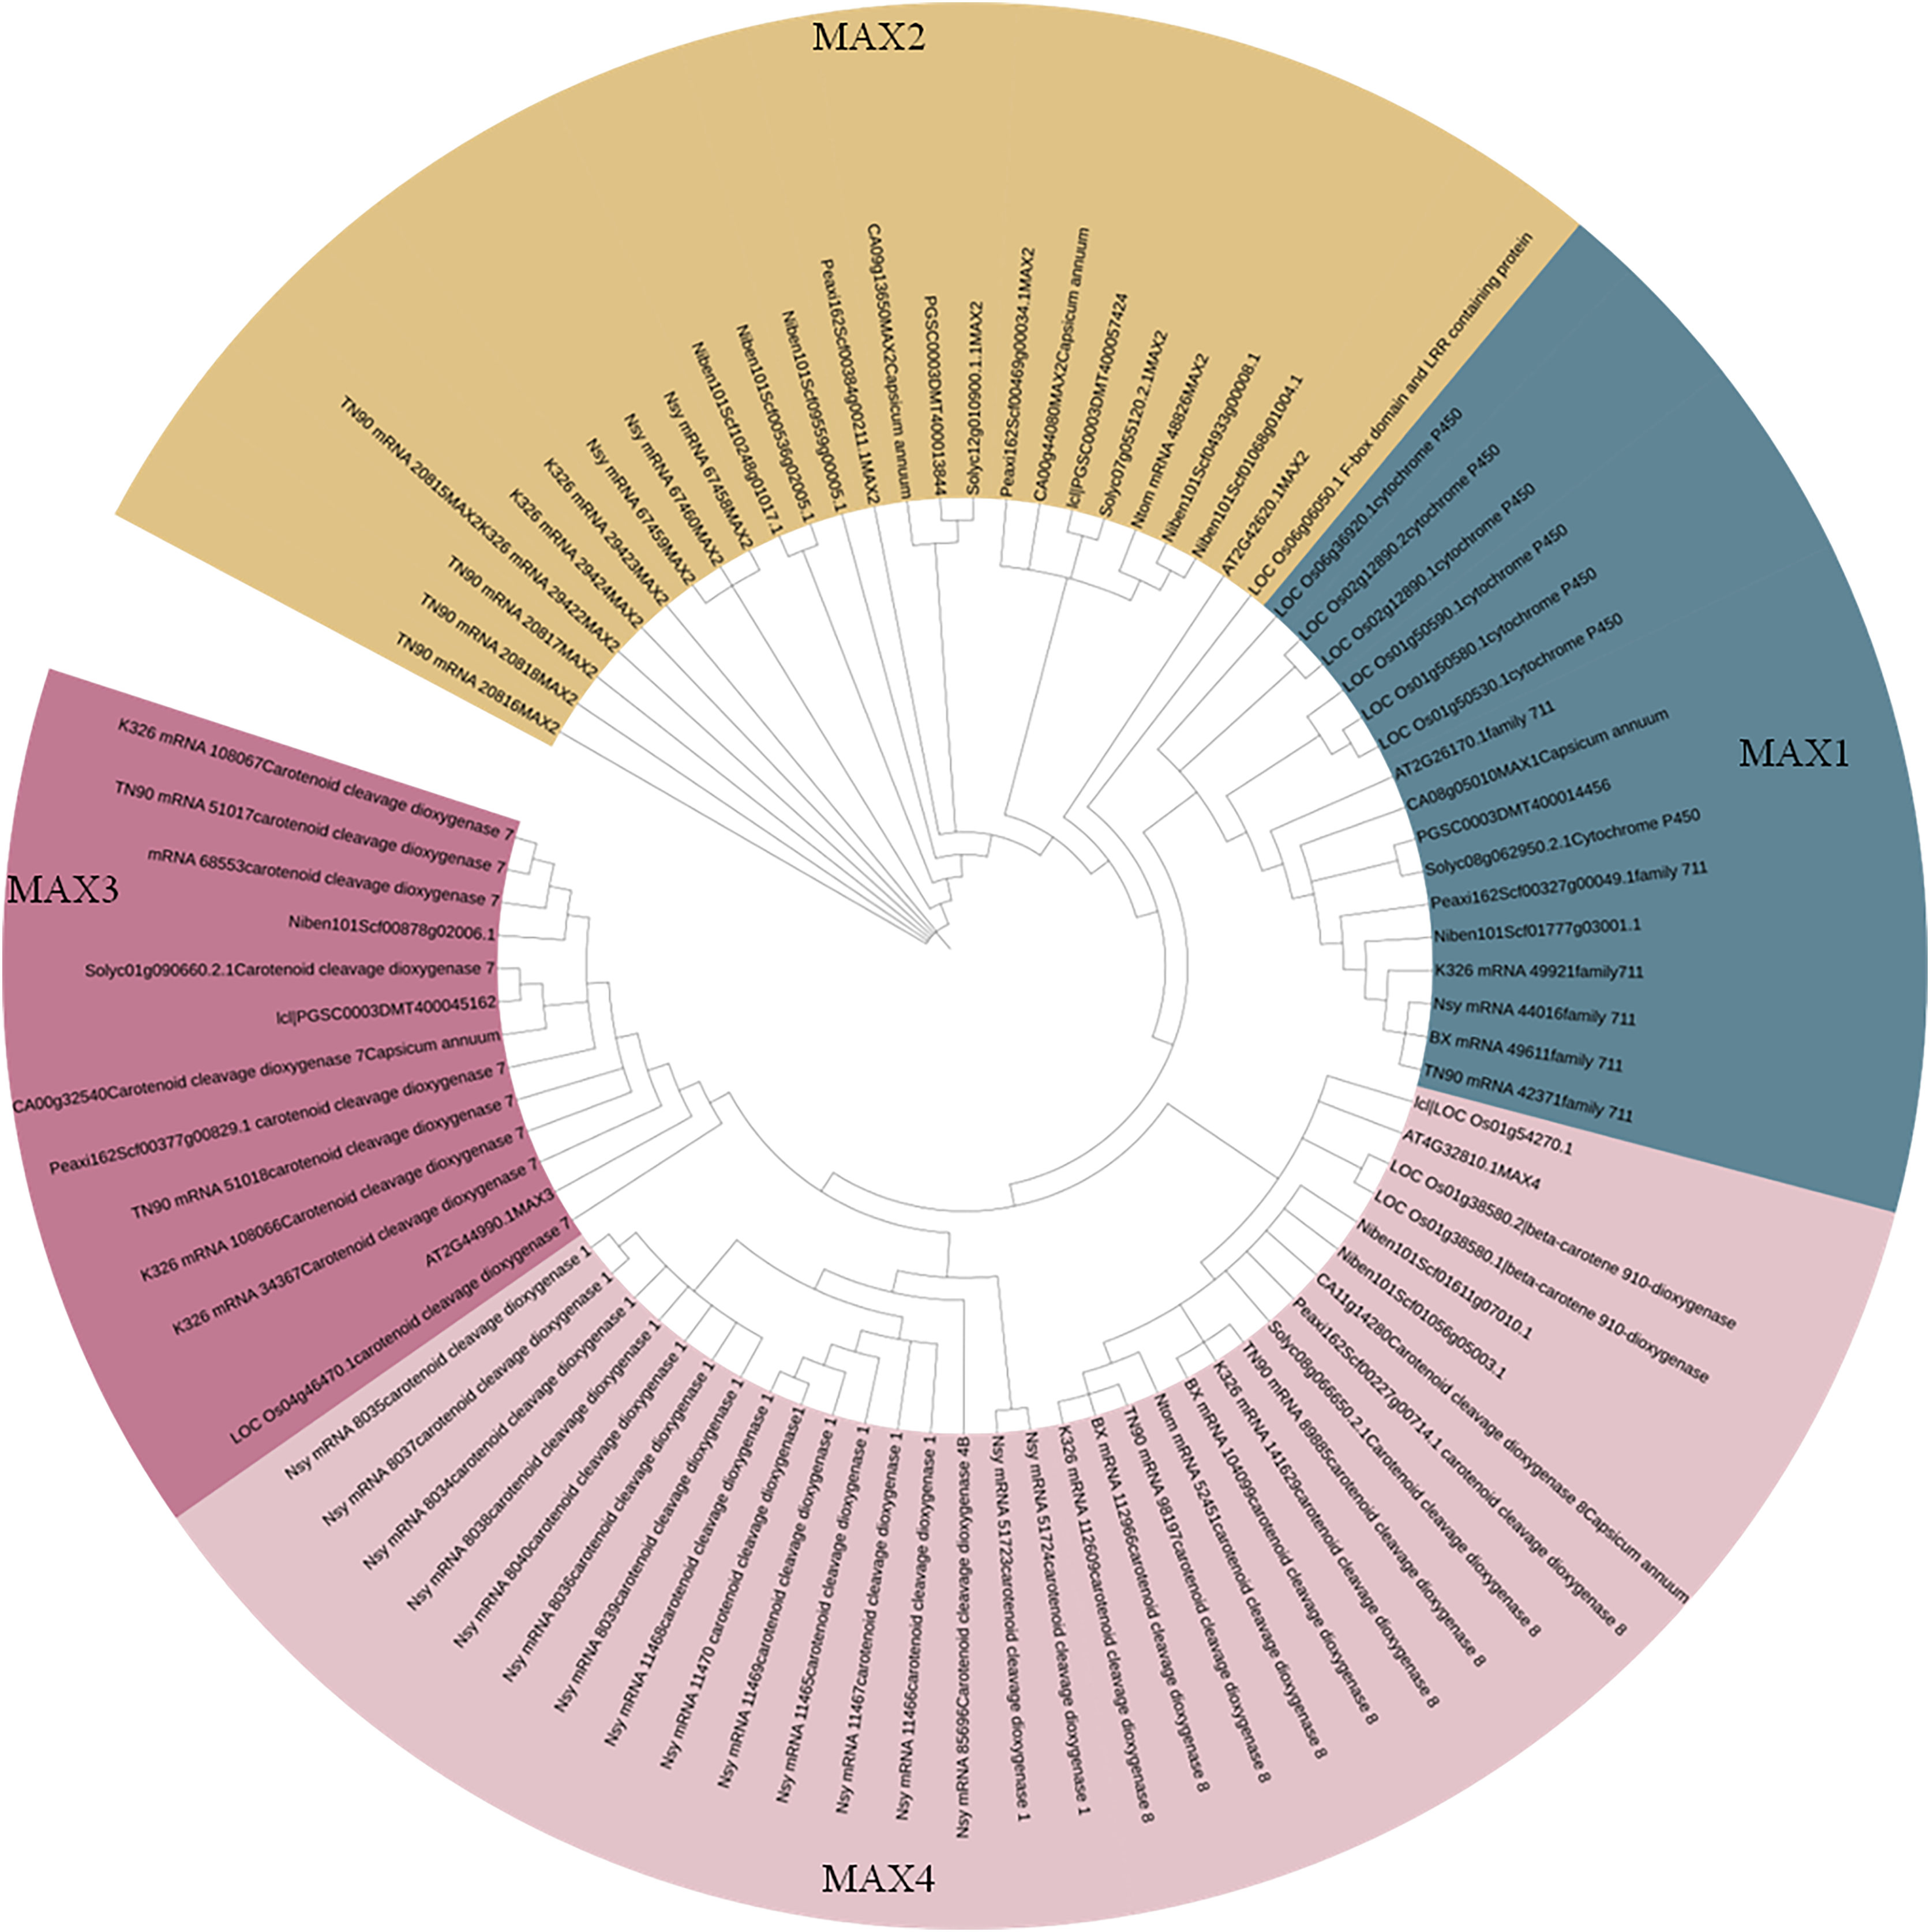
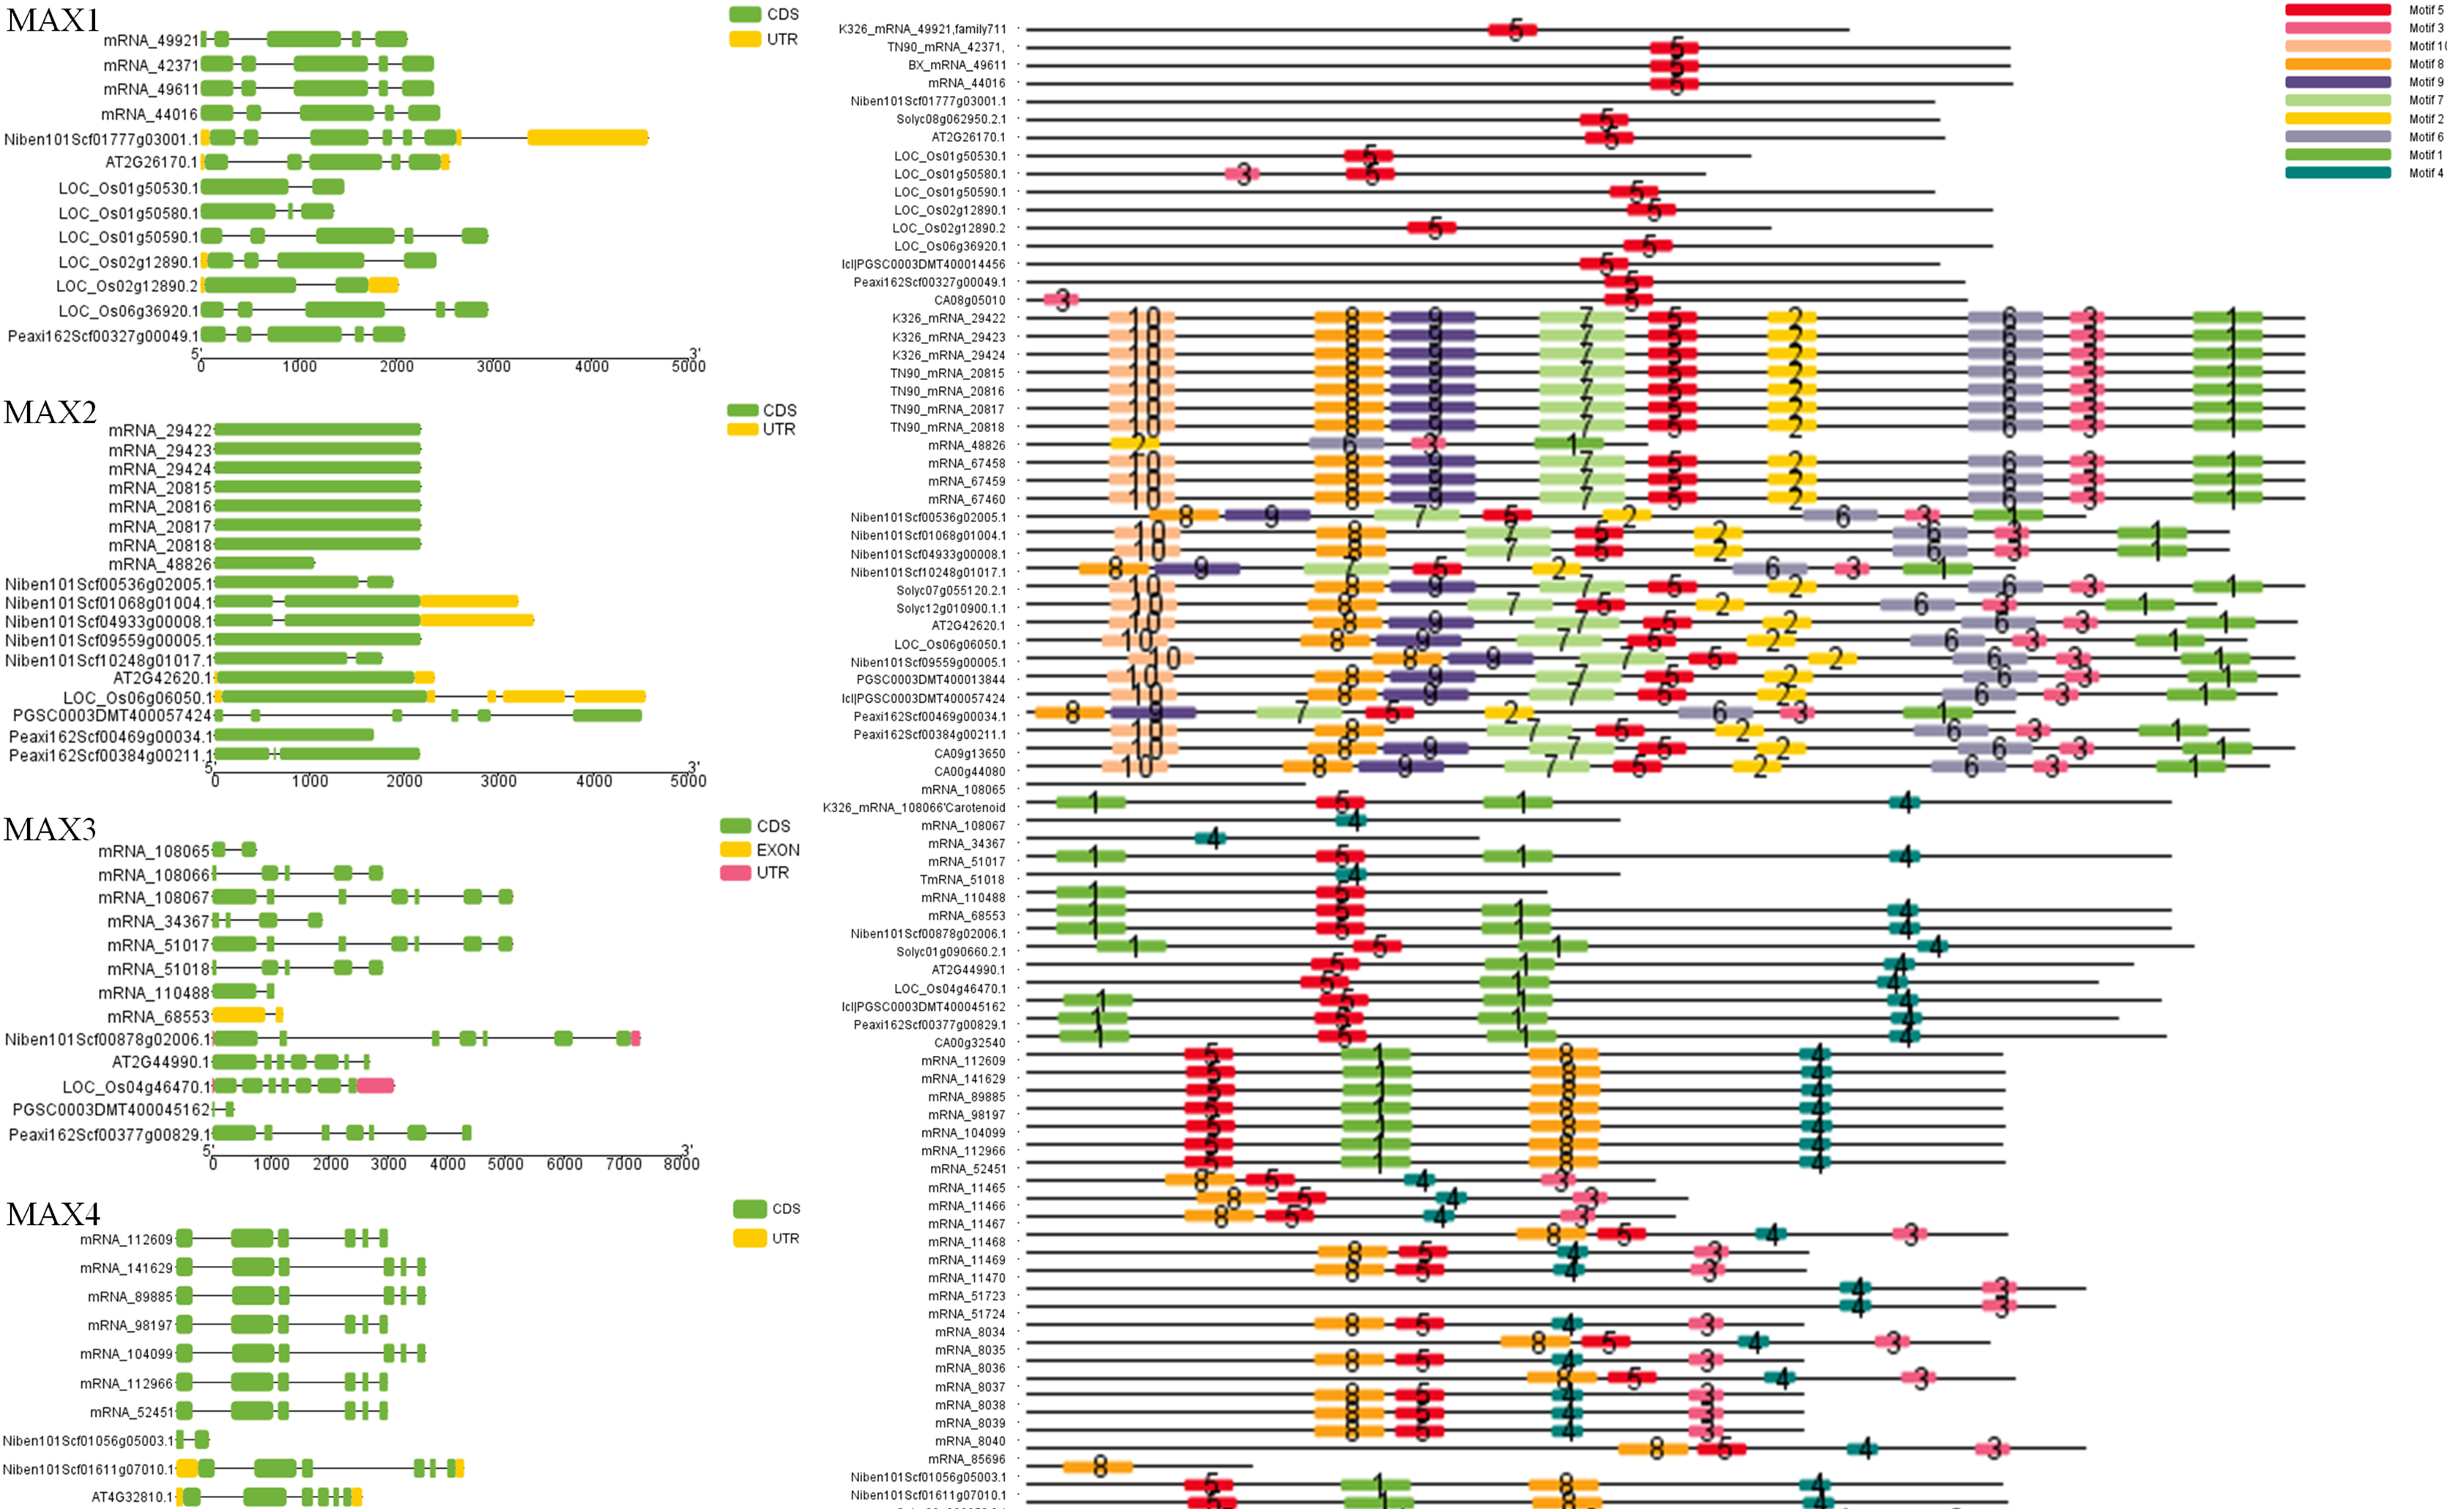
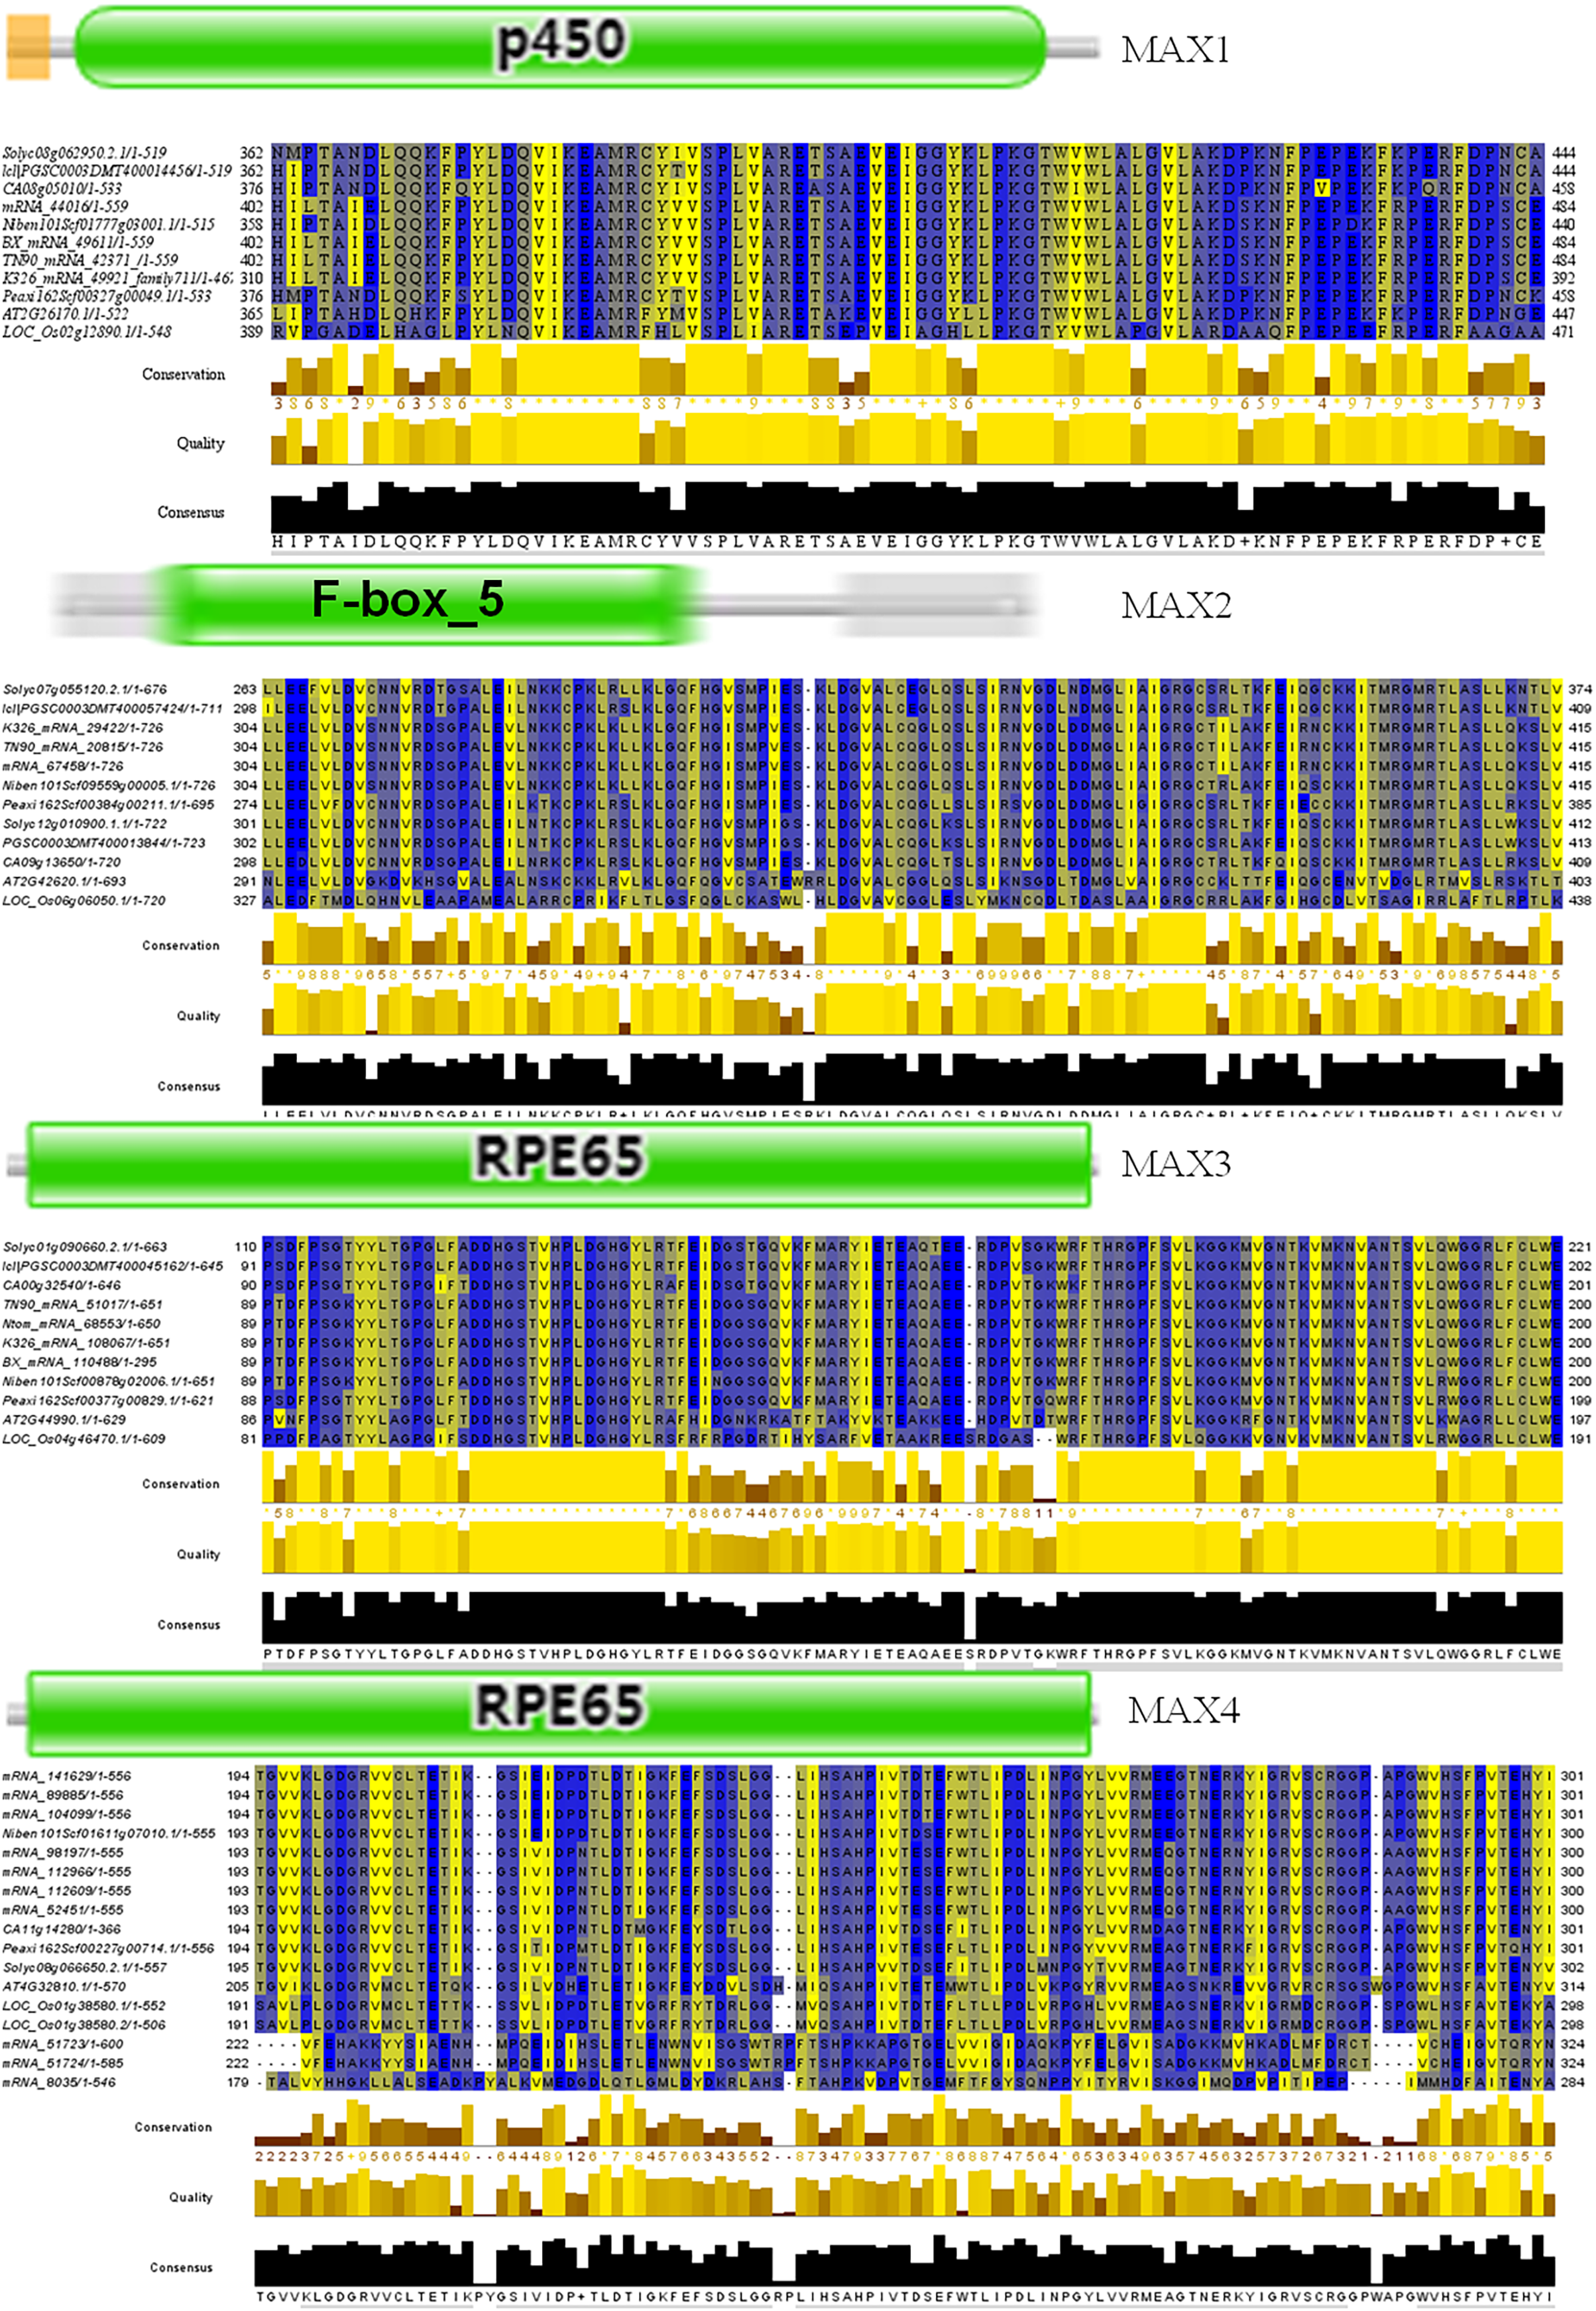
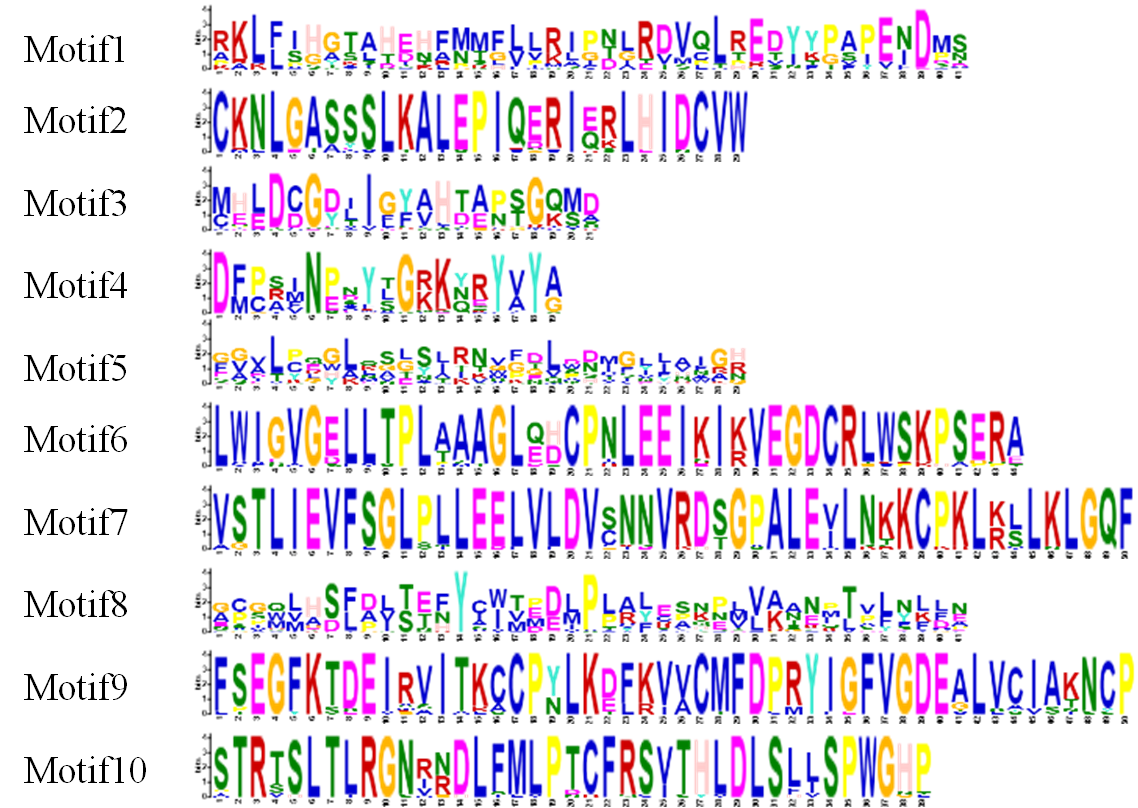
To better understand the evolutionary relationships between MAX family members, an unrooted phylogenetic tree was constructed using the full-length sequences of 87 MAX1–MAX4 proteins (Fig. 1); two sequences (mRNA_108065 and mRNA_110488) were removed during construction of the evolutionary tree due to their relatively long distances from other sequences. Based on maximum likelihood phylogenetic analysis, the MAX1–MAX4 sub-families contained 16, 26, 13, and 32 members, respectively. The sequences of the MAX family members are listed in Table S1. The exon–intron structures and conserved motifs of the MAX genes were analyzed (Fig. 2). There were at least two exons in all members of the MAX1, MAX3, and MAX4 sub-families, with maximum exon numbers of five, seven, and nine, respectively. In contrast, members of the MAX2 family contained only one to two exons each, except for PGSC0003DMT400057424, which contained six. MEME analysis of MAX protein sequences revealed the existence of sub-family-specific motifs. For example, motifs 2, 6, 7, 9, and 10 were uniquely found in MAX2 proteins, and motif 4 was specific to MAX3 and MAX4 genes. In contrast, motif 5 was common to the MAX1–MAX4 sub-families. The results showed that each sub-family had a unique and consistent gene structure with conserved motifs. Alignment of representative MAX1–MAX4 proteins showed that they all contained typical conserved domains (Fig. 3 and Fig. S1).
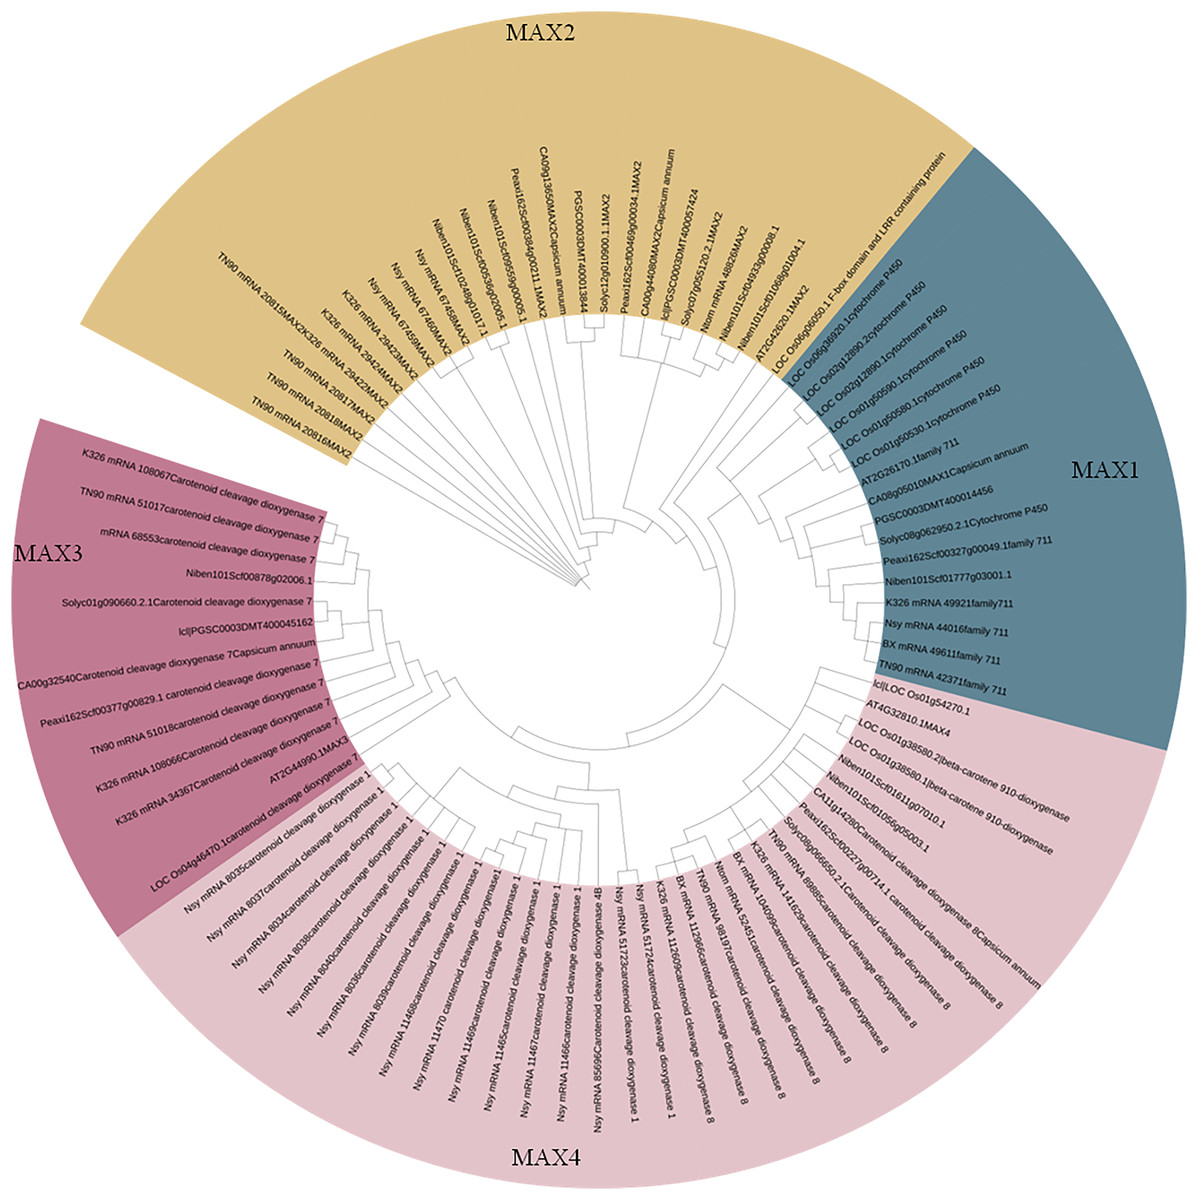
Figure 1: Phylogenetic analysis of MAX family members.
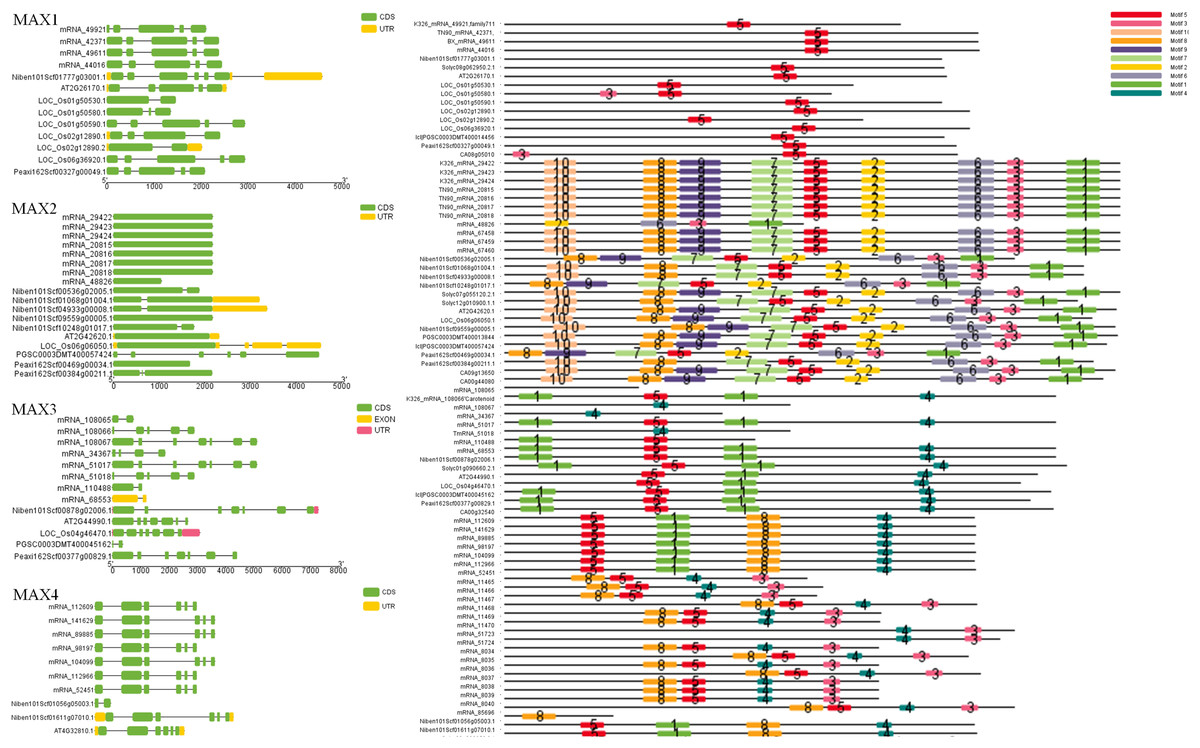
Figure 2: MAX gene exon–intron structures and sequence motifs.
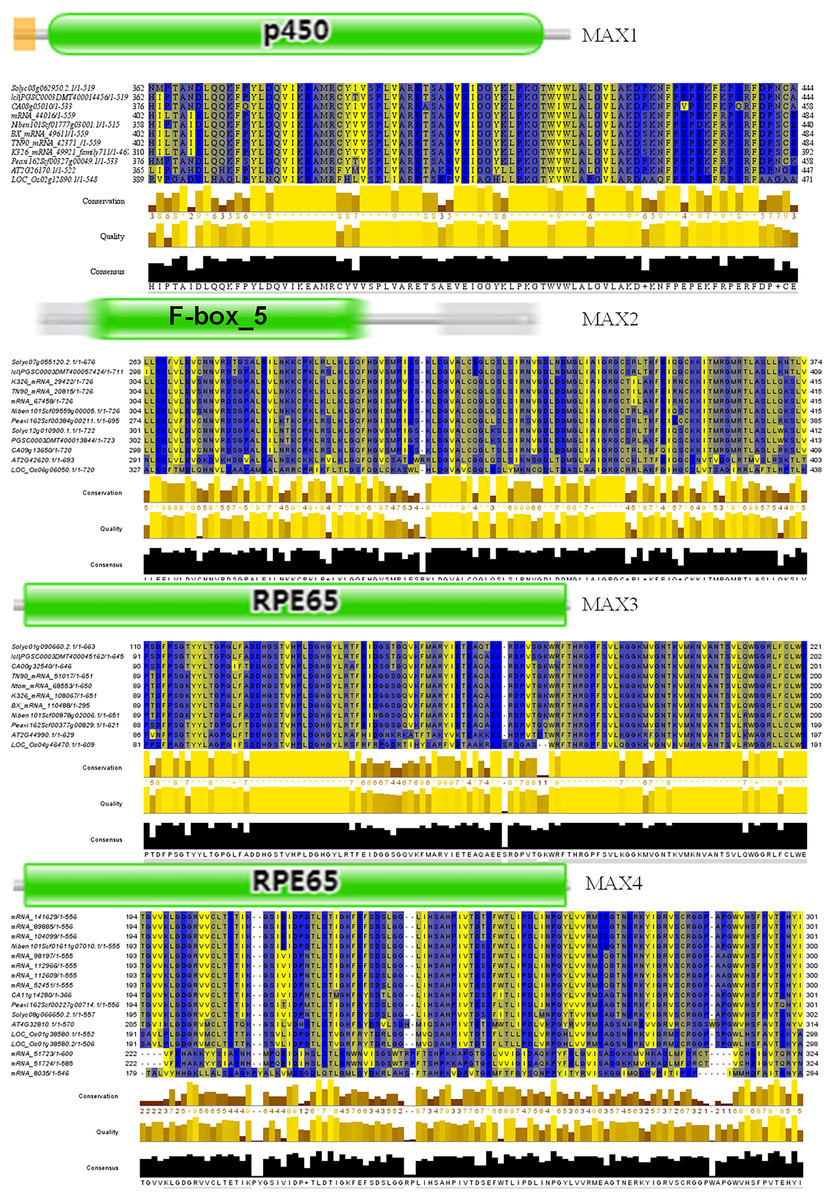
Figure 3: Conserved motifs of representative MAX proteins in solanaceous crops.
Analysis of cis-acting elements and transcription factor binding sites in the promoter region of the tobacco MAX family
To investigate the potential biological functions of MAX genes in tobacco, the 3-kb promoter sequences of MAX1–MAX4 gene family members were analyzed using the PlantCARE database. Cis-acting elements associated with meristem development and responses to hormones, sucrose, light, and stress were screened (Table S2). We found that ASF1MOTIFCAMV, CPBCSPOR, ERELEE4, GAREAT, MYBGAHV, and TATCCAOSAMY (which are closely associated with responses to auxin, cytokinin, ethylene, gibberellin (GA), and sucrose) are widely distributed in the tobacco MAX promoters, consistent with previous observations. It has been demonstrated that strigolactone can inhibit plant branching by inducing cytokinin and auxin to promote axillary bud dormancy, and can inhibit stem elongation by acting on photoreceptors and auxin (Yao, Li & Xie, 2018; Luo et al., 2019; Jia et al., 2014; Xiong, Wang & Li, 2014). Recent discoveries indicate that SL biosynthesis is regulated by GAs (Marek, 2017) and that SLs can induce ethylene to elongate root hairs (Kapulnik et al., 2011). Sucrose can promote shoot branching by suppressing the inhibitory effect of SL (Patil et al., 2021).
In recent years, it has been found that SLs play key roles in response to abiotic stresses such as drought, high salt, and nutrient deficiencies in plants (Visentin et al., 2016). In tomato, strigolactone biosynthesis is induced by heat and cold stresses (Chi et al., 2021). This is consistent with our finding that a large number of cis-elements associated with cold and other stress responses exist in MAX gene promoters. Many cis-acting elements related to pathogenesis and wounding induction were also identified, suggesting that SL may have functions in disease resistance, which is in line with previous research (Torres-Vera et al., 2014). These results imply that the cis-elements in the promoter sequences of MAX1/3/4, which are involved in SL biosynthesis, and MAX2, which is involved in SL signal sensing and transduction, are together able to ensure appropriate SL functioning with respect to plant branching and responding to cues such as light and hormones.
Previous transcriptome analysis revealed that genes responsive to SL include TCP, NAC, WRKY, and MYB transcription factors (Tang & Chu, 2020; Wang et al., 2021). We analyzed and counted potential transcription factor binding sites in MAX family members of three tobacco cultivars (N. tabacum K326, KN90, and BX), two ancestral species of cultivated tobacco (Nicotiana sylvestris and Nicotiana tomentosiformis), and triploid Nicotiana benthamiana (Table 4). We found that the number of transcription factor binding sites varied widely between tobacco species with different ploidy levels. This was especially true of AP2, MYB, TCP, and WRKY transcription factors in MAX1 homologs; AP2, bHLH, bZIP, and TCP in MAX2 homologs; AP2, MYB, and TCP in MAX3 homologs; and AP2, bHLH, bZIP, and MYB in MAX4 homologs. Prior studies have noted the importance of AP2 transcription factors in responding to drought, low temperature, and high salt in plants (Xie et al., 2019). Based on these data, we can infer that MAX family members play important roles in abiotic stress responses.
| K326 | TN90 | BX | Ntom | Nsy | Niben | ||
|---|---|---|---|---|---|---|---|
| AP2 | 194 | 100 | 219 | / | 219 | 209 | MAX1 |
| B3 | 72 | 83 | 75 | / | 74 | 60 | |
| bHLH | 35 | 67 | 133 | / | 134 | 52 | |
| bZIP | 88 | 97 | 121 | / | 123 | 72 | |
| C2H2 | 17 | 15 | 21 | / | 24 | 13 | |
| MYB | 143 | 168 | 157 | / | 151 | 152 | |
| NAC; NAM | 38 | 14 | 11 | / | 12 | 16 | |
| TCP | 174 | 216 | 148 | / | 152 | 99 | |
| WRKY | 123 | 110 | 37 | / | 37 | 41 | |
| Aux/IAA | 0 | 0 | 1 | / | 1 | 0 | |
| AP2 | 130 | 130 | / | 193 | 162 | 161 | MAX2 |
| B3 | 56 | 69 | / | 71 | 75 | 60 | |
| bHLH | 120 | 117 | / | 89 | 145 | 77 | |
| bZIP | 127 | 128 | / | 150 | 146 | 107 | |
| C2H2 | 20 | 15 | / | 18 | 21 | 25 | |
| MYB | 72 | 62 | / | 143 | 75 | 129 | |
| NAC; NAM | 10 | 9 | / | 25 | 10 | 9 | |
| TCP | 184 | 126 | / | 188 | 148 | 121 | |
| WRKY | 32 | 18 | / | 59 | 19 | 51 | |
| Aux/IAA | 1 | 1 | / | 1 | 1 | 1 | |
| AP2 | 220 | 208 | 212 | 172 | / | 63 | MAX3 |
| B3 | 56 | 51 | 48 | 47 | / | 9 | |
| bHLH | 68 | 91 | 131 | 74 | / | 12 | |
| bZIP | 104 | 142 | 145 | 129 | / | 21 | |
| C2H2 | 26 | 29 | 23 | 19 | / | 1 | |
| MYB | 144 | 136 | 130 | 168 | / | 18 | |
| NAC; NAM | 16 | 11 | 18 | 14 | / | 8 | |
| TCP | 112 | 153 | 136 | 179 | / | 37 | |
| WRKY | 54 | 65 | 84 | 122 | / | 10 | |
| Aux/IAA | 1 | 2 | 1 | 2 | / | 0 | |
| AP2 | 125 | 206 | 205 | 195 | 169 | 119 | MAX4 |
| B3 | 38 | 76 | 77 | 82 | 74 | 39 | |
| bHLH | 180 | 234 | 233 | 264 | 128 | 120 | |
| bZIP | 127 | 177 | 177 | 175 | 137 | 117 | |
| C2H2 | 15 | 15 | 15 | 11 | 16 | 9 | |
| MYB | 142 | 154 | 154 | 148 | 155 | 101 | |
| NAC; NAM | 23 | 25 | 25 | 27 | 14 | 12 | |
| TCP | 62 | 168 | 167 | 239 | 133 | 50 | |
| WRKY | 52 | 65 | 65 | 115 | 46 | 44 | |
| Aux/IAA | 1 | 2 | 2 | 1 | 1 | 1 |
Tissue-specific MAX expression analysis in tobacco
To analyze the roles of MAX genes in the growth and development of tobacco, tissue-specific expression analysis was performed for MAX1–MAX4 genes in apical buds, axillary buds, leaves, stems, flowers, and roots of cultivated tobacco (Fig. 4A). All MAX genes were highly expressed in the flowers, with MAX1 and MAX3 specifically expressed in flowers and MAX4 specifically expressed in apical buds and flowers. Expression trends were similar for MAX1/3/4 sub-family members, whereas MAX2 members were expressed in all tissues, which is consistent with Arabidopsis (Stirnberg, Furner & Leyser, 2007). The tomato transcriptome data indicated that MAX1 and MAX4 have the highest expression in tomato roots, while MAX2 has the highest expression in fruits, which indicates that tomato MAX2 may play vital roles in fruit ripening, however MAX3 has very low expression in different tissues (Fig. 4E). All the raw data for fluorescent quantitative PCR is listed in Table S3.
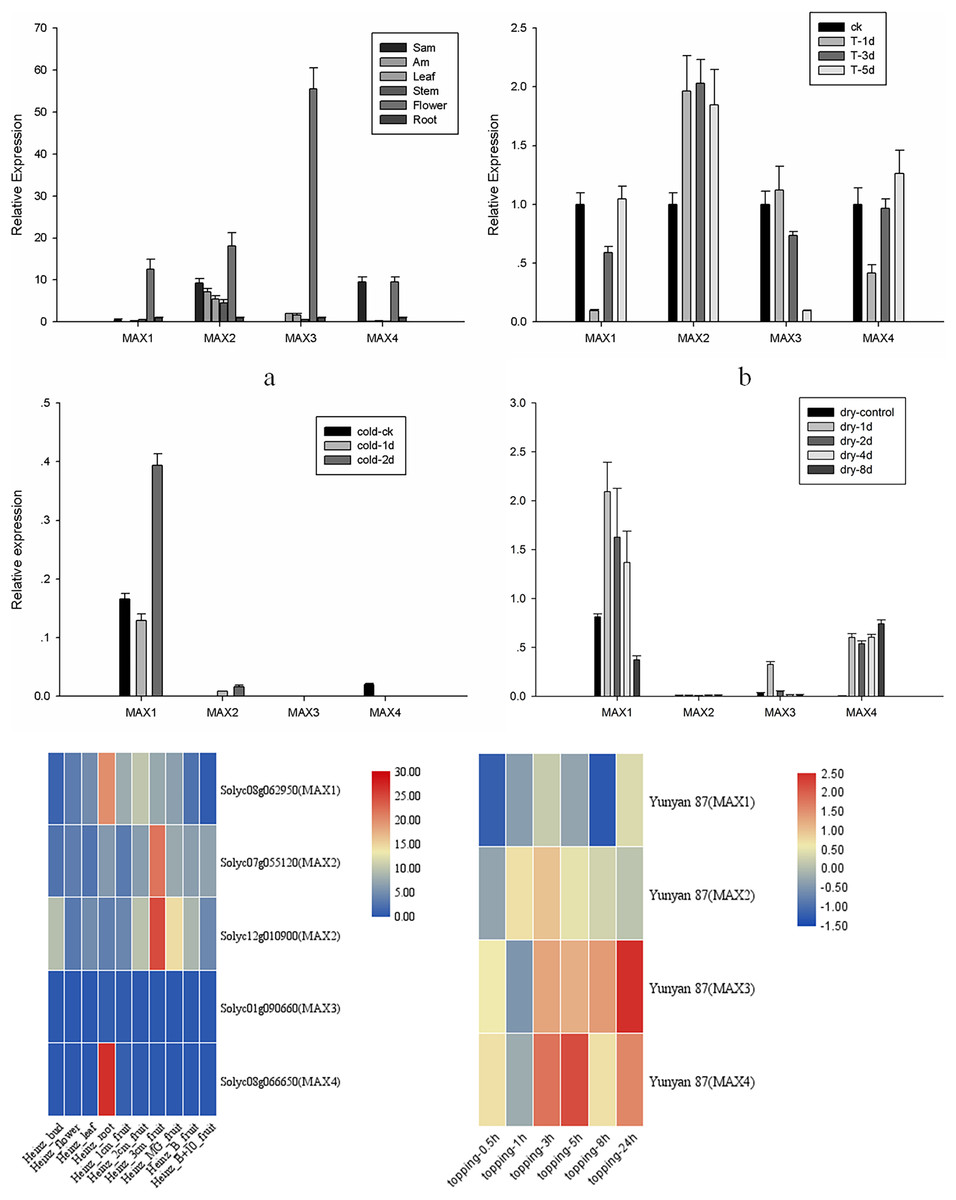
Figure 4: MAX1–MAX4 gene expression in tobacco.
(A) MAX gene expression in different tissues. (B) MAX gene expression in response to topping treatment. (C) MAX gene expression in response to cold treatment. (D) MAX gene expression in response to drought. (E) Heatmap of tomato MAX Members in different tissues. (F) Heatmap of MAX members within 24 h after topping in Yunyan 87.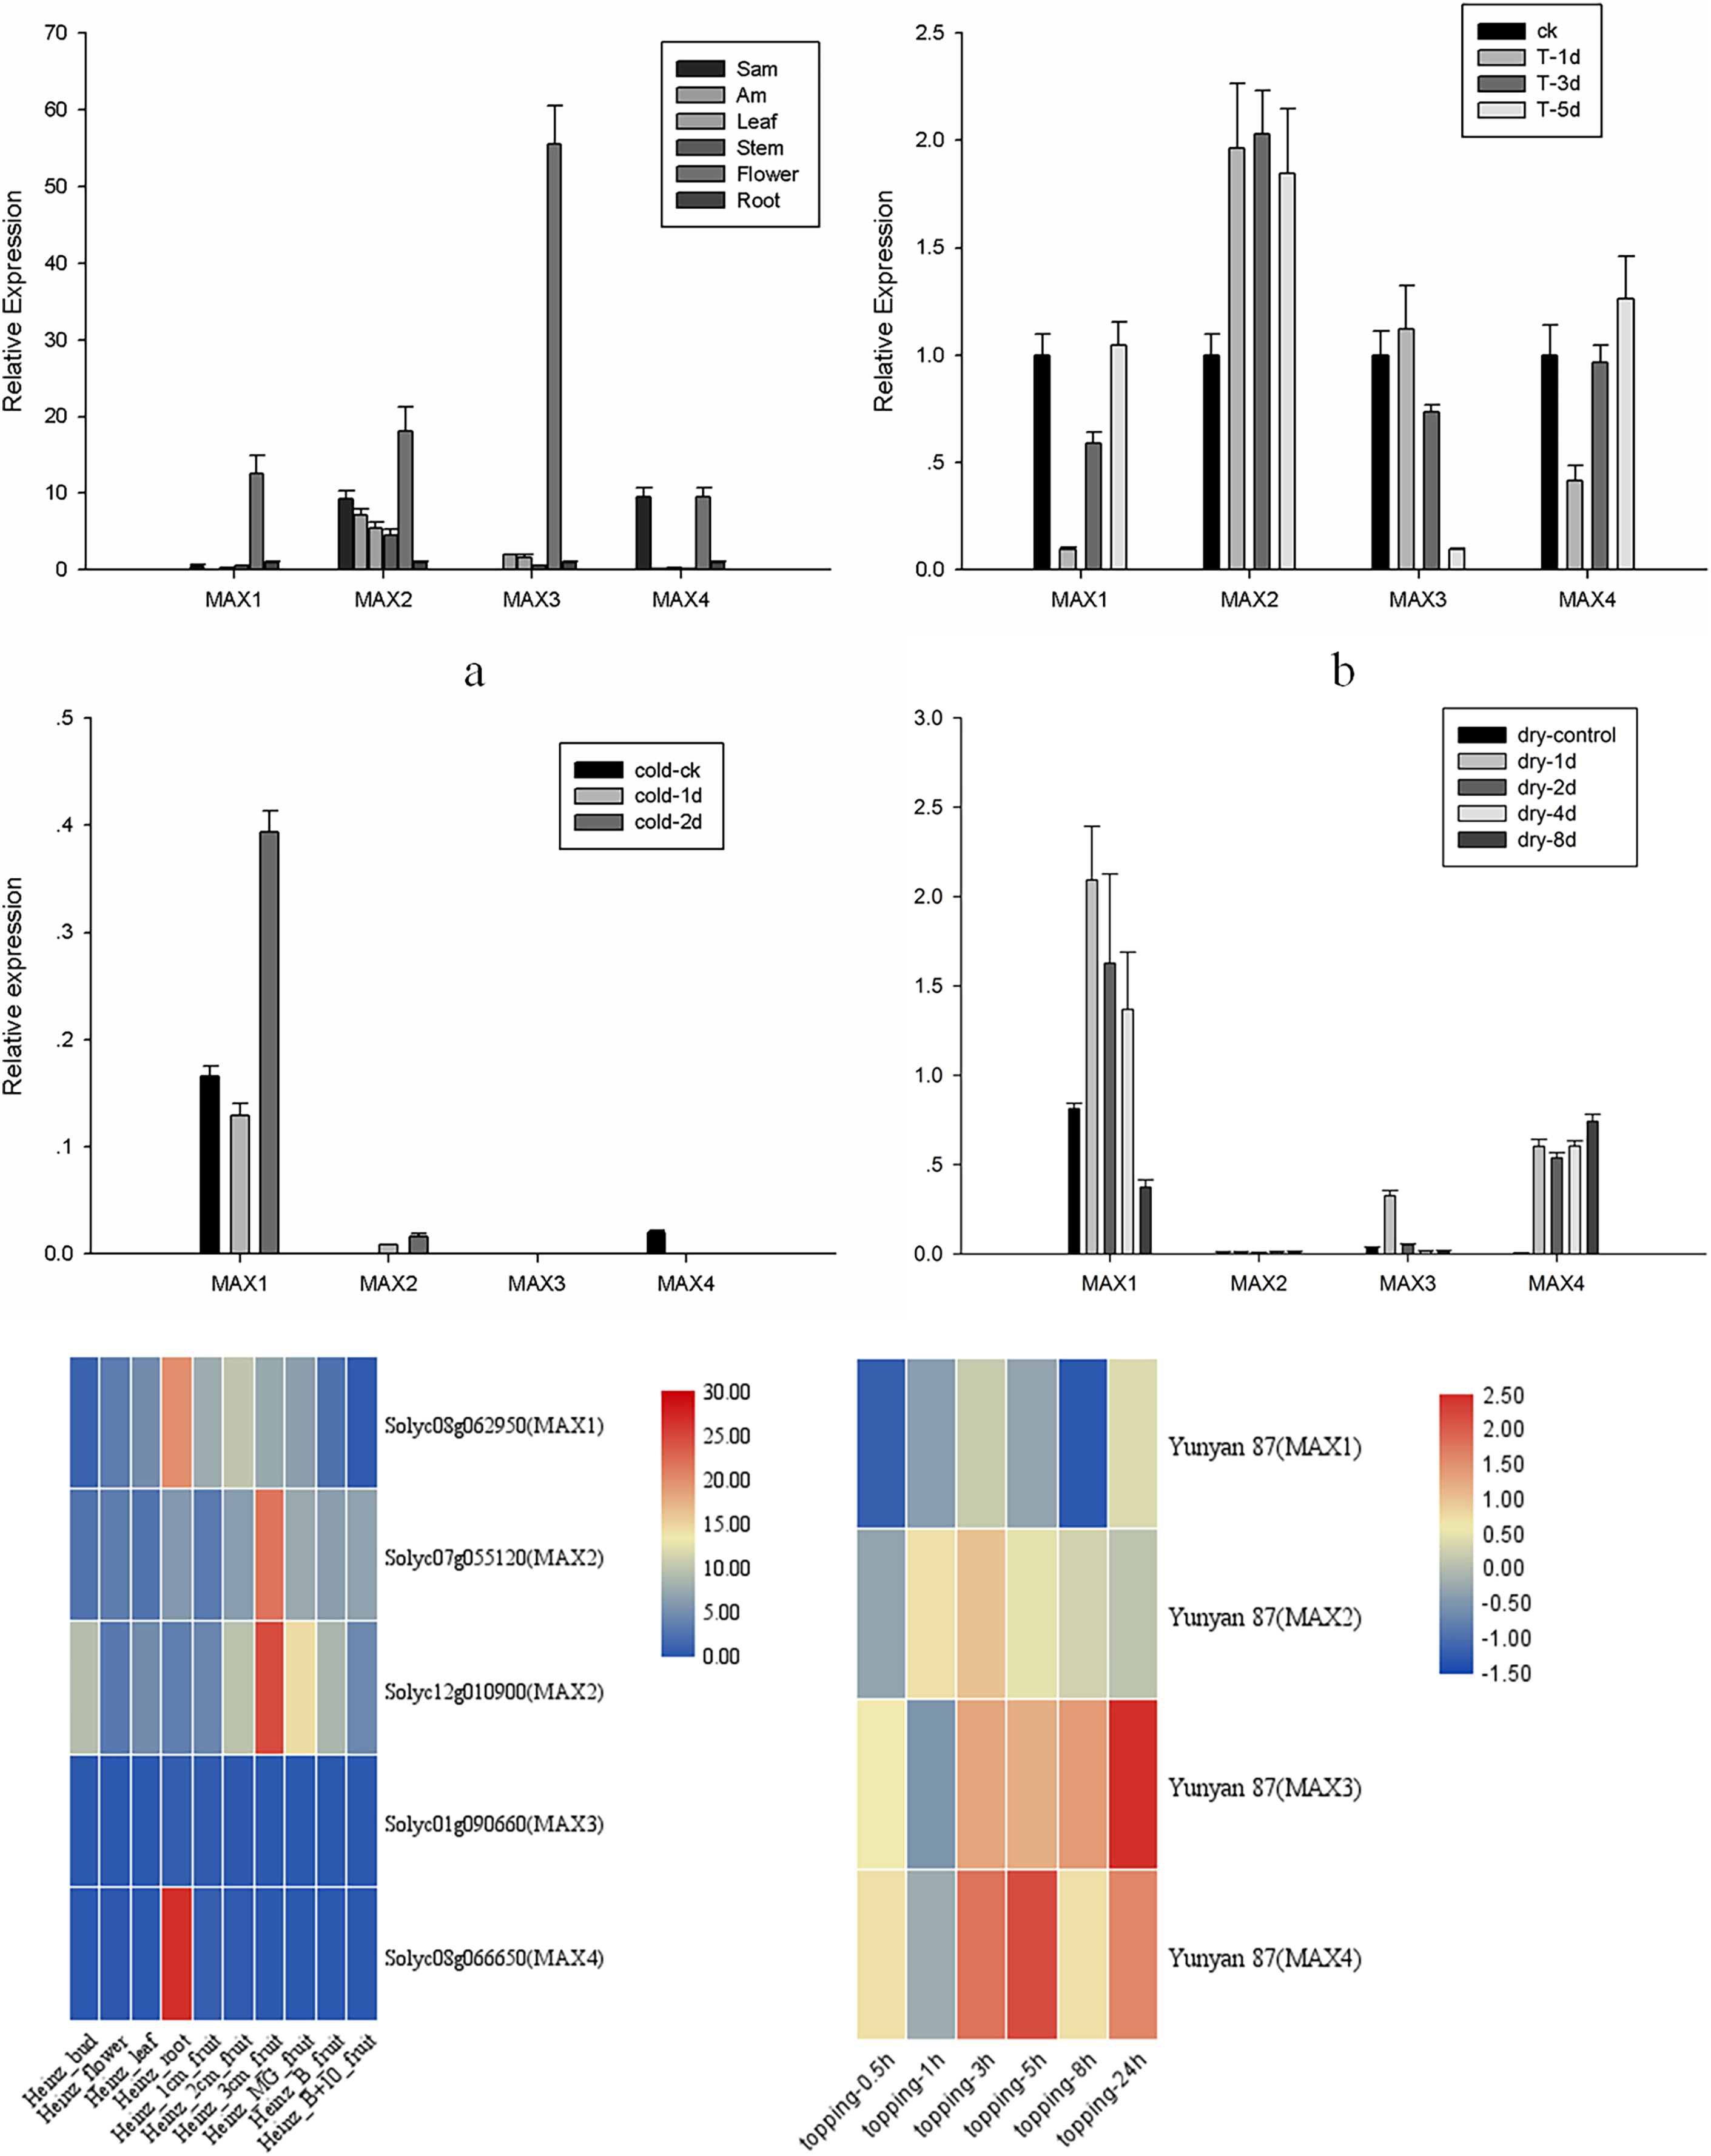
MAX gene expression analysis in response to topping, stress, and hormone treatments
An important physiological role of strigolactone is to regulate branching by interacting with other plant hormones. Tobacco production in the field requires topping treatments, which lead to axillary buds due to the loss of apical dominance. To further analyze the role of MAX genes in the responses of tobacco to topping, stress, and hormone treatments, expression levels of MAX1–MAX4 were analyzed at 1, 3, and 5 d after topping or hormone application, at 1, 2, 4, and 8 d after drought treatment, and at 1 and 2 d after cold treatment. The expression level of MAX2 and MAX3 after topping rises and then falls, in contrast to the expression level of MAX1 and MAX4 after topping, which falls and then rises (Fig. 4B). These results differ from the expression pattern of Yunyan 87, in which within 24 h after topping, MAX1 and MAX2 rise first and then fall, while the expression levels of MAX3 and MAX4 falls and then rise (Fig. 4E), indicating that MAX genes differentially respond to topping in different tobacco varieties.
MAX family members were more sensitive to drought than to cold treatment in cultivated tobacco, with a significant increase in expression of MAX1/3/4 after drought treatment (Figs. 4C and 4D). Despite the low expression, MAX2 expression level changed after drought treatment, a finding that is similar to the results of previous studies, suggesting that the max2 mutant in Arabidopsis was sensitive to drought stress (Bu et al., 2014). However, the sensitivity of max2 was significantly lower under drought treatment compared to max3 and max4 mutant plants (Chien et al., 2014), and the sensitivity of MAX2 to drought was further reduced in tobacco compared to Arabidopsis. Unraveling the molecular evolutionary mechanisms behind this interesting phenomenon will be a future focus of our research. The data suggest that SLs may have varying regulatory mechanisms in response to drought stress in different species, nonetheless, a number of questions remain to be answered regarding the diversity and function of SLs.
Detailed analysis was conducted to measure the expression levels of MAX1–MAX4 genes in response to ABA, 6-BA, IAA, sucrose, GR24, and topping treatments (Figs. 5A–5D). From these data, we reached several general conclusions. First, MAX1–MAX4 genes in cultivated tobacco all responded positively to GR24 and topping treatments. Second, MAX1, MAX3, and MAX4, which are involved in SL biosynthesis, did not have consistent responses to each treatment; only MAX4 responded to sucrose, whereas both MAX3 and MAX4 responded to IAA, and MAX2–MAX4 responded to both 6-BA and drought treatment (Fig. 5E).
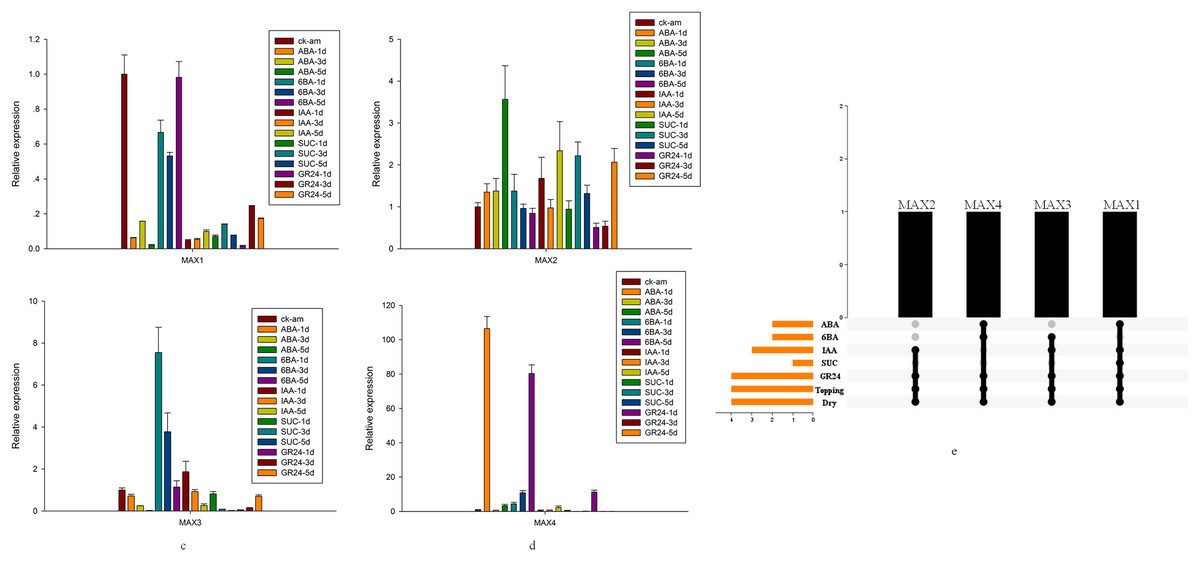
Figure 5: MAX gene expression patterns in response to several treatments.
(A) Expression levels of MAX1in response to hormone treatment. (B) Expression levels of MAX2in response to hormone treatment. (C) Expression levels of MAX3 in response to hormone treatment. (D) Expression levels of MAX4 in response to hormone treatment. (E) Summary of hormone/stress-induced MAX genes. Black dots indicate MAX genes that are responsive to hormone/stress treatments, and gray dots indicate MAX genes that did not respond to the treatments.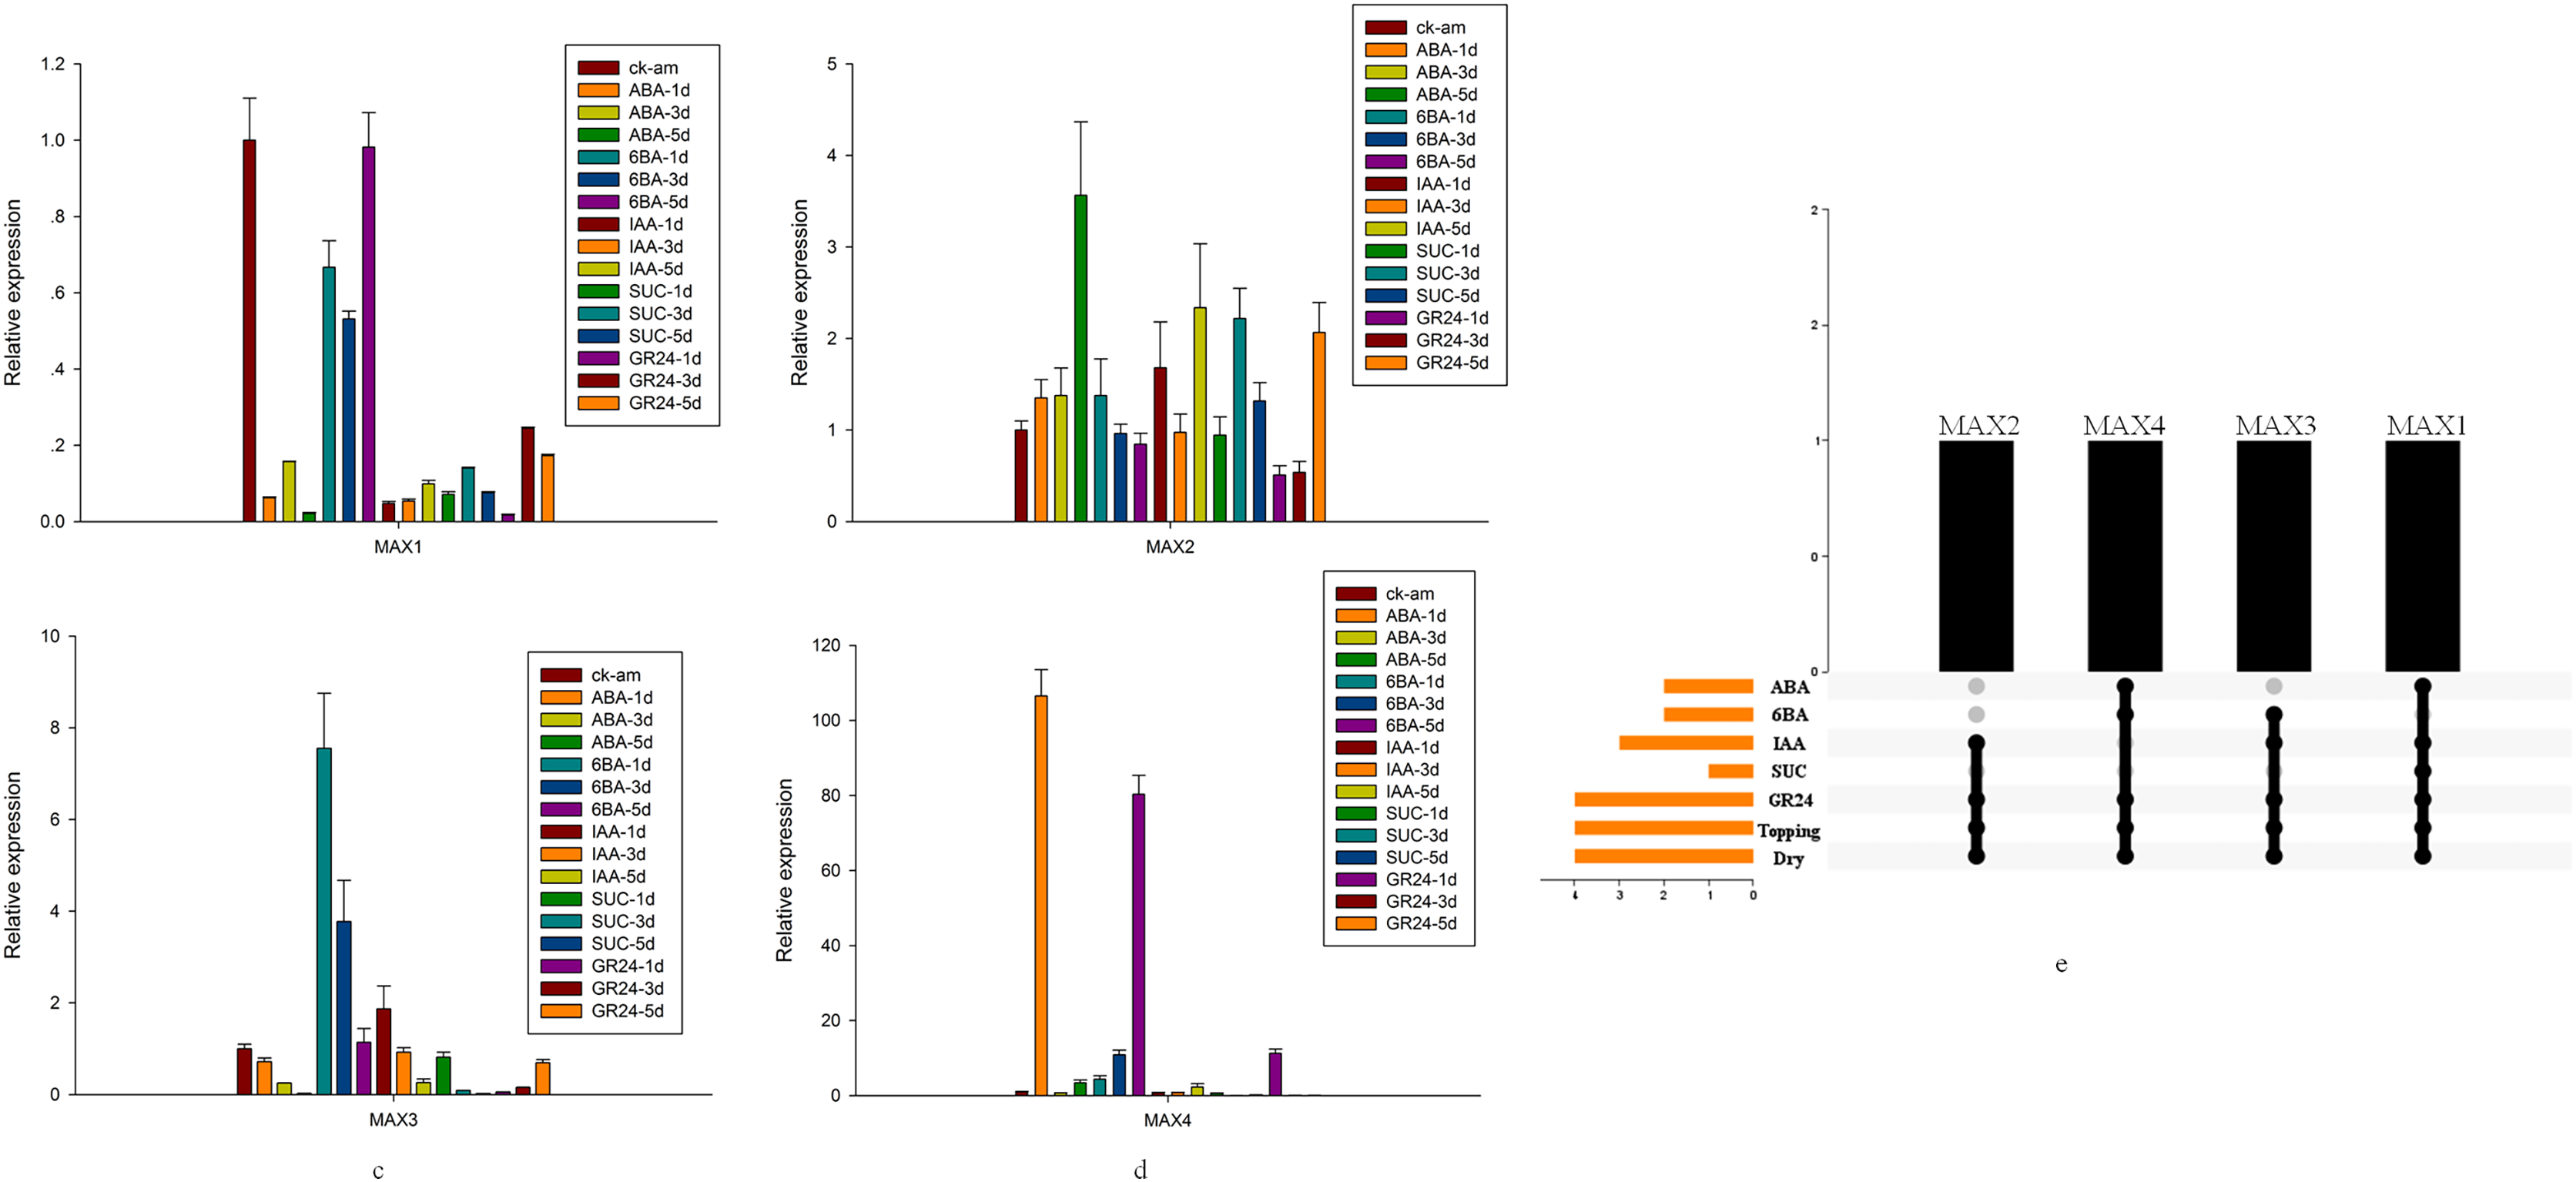
Subcellular localization of MAX proteins in tobacco
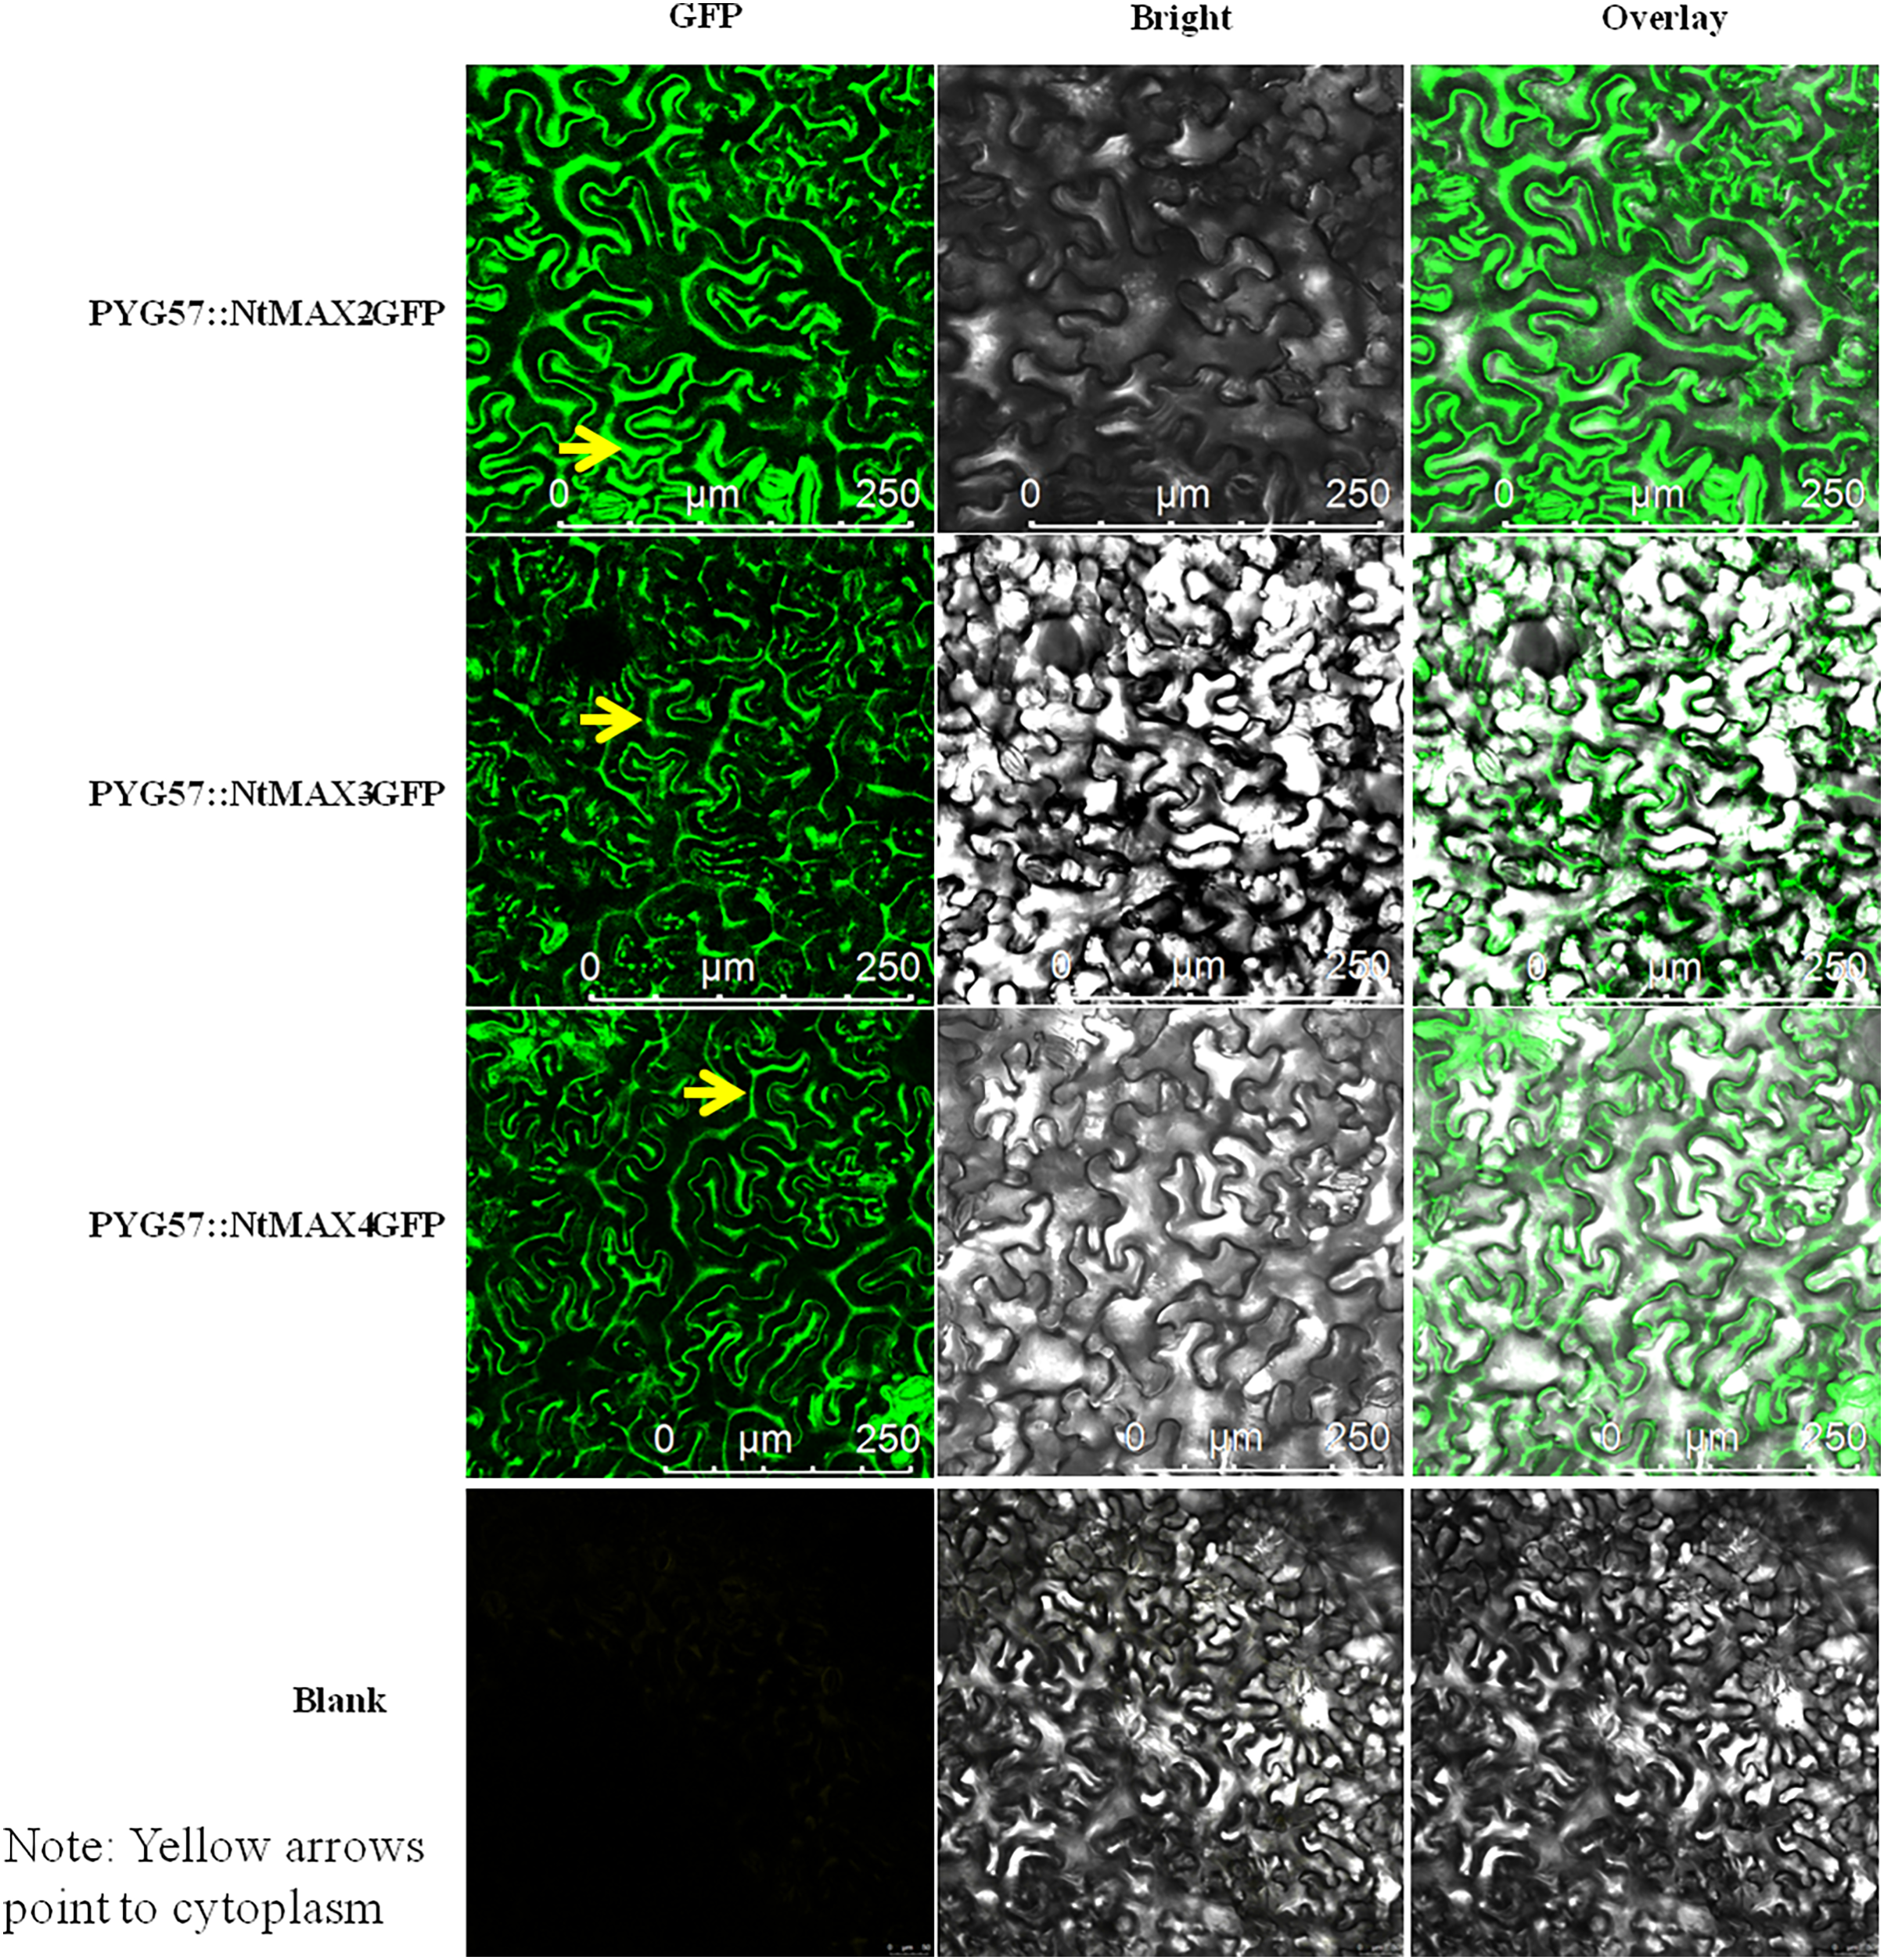
The fusion vectors PYG57::NtMAX2-GFP, PYG57::NtMAX3-GFP, and PYG57::NtMAX4-GFP were constructed and co-cultured in tobacco leaves using an Agrobacterium tumefaciens EHA105-mediated transformation method. The subcellular localization of each target protein was indicated by green fluorescence of the fusion protein (Fig. 6). There was no green fluorescence in the plasma membrane, cytoplasm, or nucleus of leaves injected with the control vector. MAX2 was localized to the cytoplasm, which was inconsistent with the result predicted by CELLO. MAX3 and MAX4 were also localized to the cytoplasm, which was consistent with the predicted results.
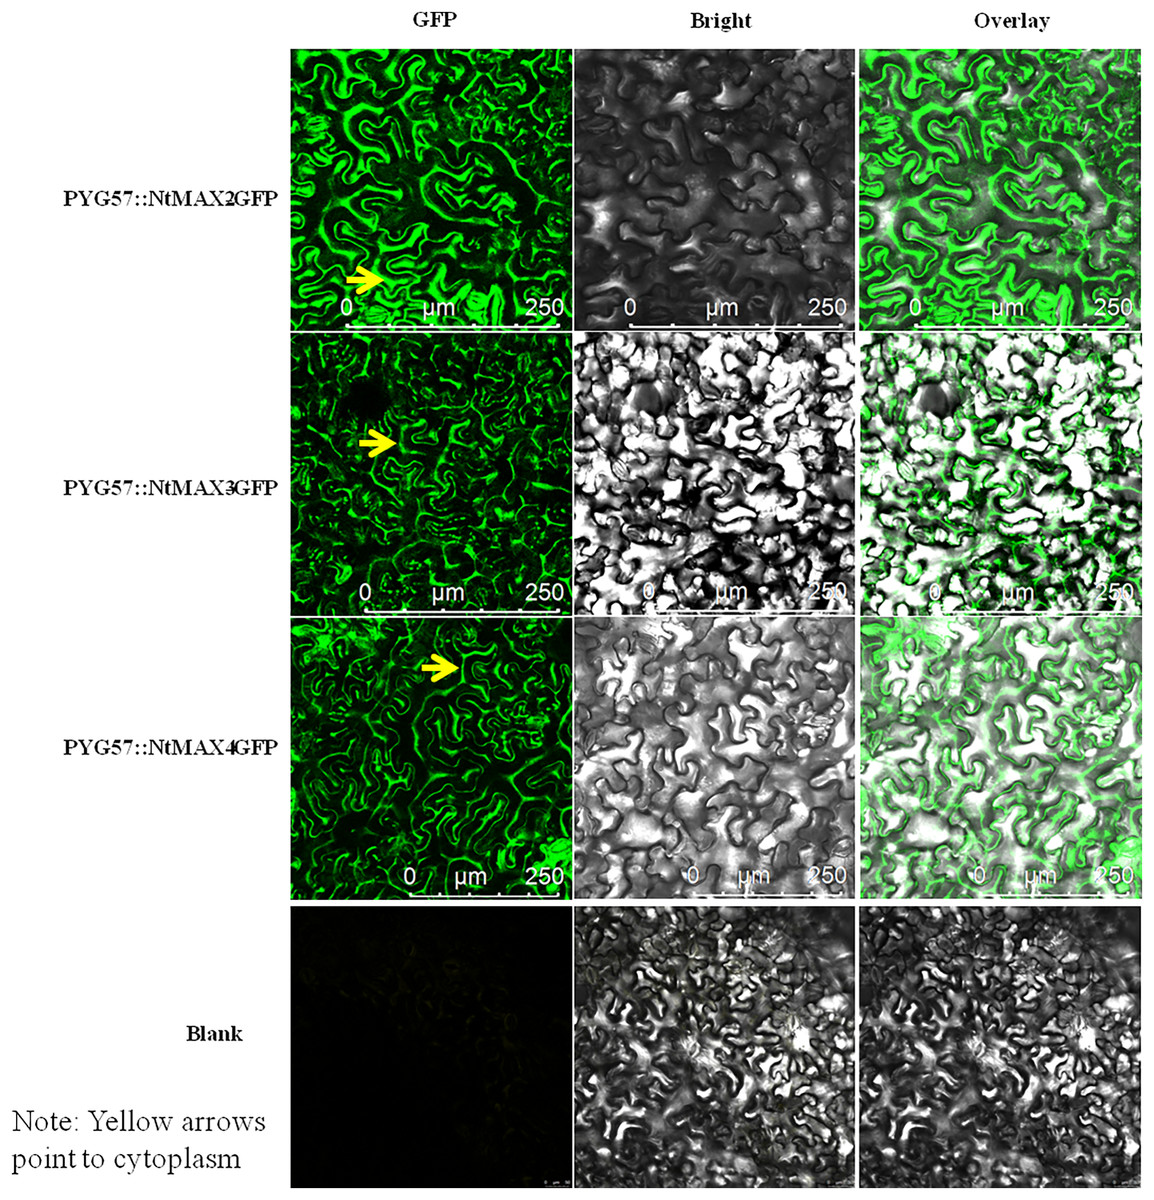
Figure 6: Subcellular localization of NtMAX2/3/4 in tobacco.
Discussion
In this study, a total of 74 MAX gene family members, including 9 MAX1, 24 MAX2, 13 MAX13 and 28 MAX4, were identified in the whole genome of a representative solanaceous crop by bioinformatics and genomics. The copy numbers and amino acid length of MAX in different species is consistent with previous reports (Cheng et al., 2018; Dong et al., 2013). In terms of the distribution of introns, the number of introns in the MAX gene differs markedly between monocots and dicots, with MAX1 having 4–5 introns in dicots and 1–4 in monocots; MAX2 having 0–5 introns in dicots and 0–3 in monocots; MAX3 having 1–6 introns in dicots and 6 in monocots; and MAX4 having 1–5 introns in dicots and 5–8 introns in monocots. In monocotyledonous rice, intron-rich genes are usually expressed at higher levels (Deshmukh, Sonah & Singh, 2016), so for MAX3 and MAX4, the higher number of introns in monocotyledonous plants may lead to higher MAX3/4 expression levels, However for most eukaryotes, the loss of introns is a common phenomenon in evolution (Lin et al., 2006; Hooks, Delneri & Griffiths, 2014), and whether this variability in intron distribution is related to the different evolutionary pathways of MAX in mono- and dicotyledons requires further validation.
A 3,000 bp sequence from the upstream of the MAX gene start codon was selected from the published tobacco genome sequence and used for cis-acting element prediction. Based on the results, a large proportion of the cis-acting elements were the meristem development response elements, the hormone (sucrose) response elements, the stress response elements and the light response elements (Table S2). Based on the predicted transcription factor binding sites (Table 4), the large number of TCP, WRKY, and AP2 also suggests that tobacco MAX genes play an vital role in the regulation of meristem development and stress resistance, Wang et al. (2020) identified 401 SLs-responsive genes in A. thaliana using synthetic SLs, confirming that they regulate plant branching, leaf shape, drought adaptation and anthocyanin accumulation mainly through transcription factors such as BRC1, TCP1 and PAP1. Their data is consistent with our predicted results for transcription factors that bind the MAX promoter in tobacco. The fluorescent quantitative PCR results confirmed that various subclasses of tobacco MAX do respond differently to drought, cold treatment, hormone/sucrose treatment and topping treatment. The diversity of plant promoter cis-elements and the variety of transcription factors that bind to promoters make the mechanism of the promoter a complex process, and provides the questions as to: How do the various elements of the tobacco MAX promoter perform their functions? What is the evolutionary role of the specific cis-elements of the promoter? These questions need to be further explored.
SLs implement functions in plants mainly through complex interactions with other hormones, and previous studies have shown that SLs and auxins can co-regulate branching (Shen et al., 2012). In rice, pea and Arabidopsis, transcript levels of MAX3 and MAX4 are significantly up-regulated by IAA (Hayward et al., 2009), which is consistent with our results in tobacco. SLs influence root development through the cytokinin signaling network pathway or by interacting with ethylene, auxin and gibberellin (Jiang et al., 2016). Similar to tobacco, MAX1 in rice and Arabidopsis can also respond to abscisic acid (Marzec & Muszynska, 2015), while unlike rose, where RwMAX1 and RwMAX2 can both respond to sucrose, but only MAX1 in tobacco responds to sucrose treatment (Azri et al., 2015). Further analysis and comparison of the response patterns of tobacco MAX family members to other stresses such as light, pests and diseases, and hormones such as brassinolide is still needed.
Conclusion
This study presents the phylogeny, gene structure, expression levels, and cis-acting elements of the MAX gene family in representative solanaceous crops using bioinformatics approaches. There were 74 non-redundant MAX family proteins identified in tobacco, tomato, potato, petunia, and pepper. These MAX genes showed tissue-specific expression. Furthermore, cis-acting element analysis showed that the identified MAX genes contained cis-elements that are predicted to respond to hormones, stress, light, and shoot development. MAX1–MAX4 were all upregulated in respond response to GR24 and topping treatments. Our identification and analysis of the MAX gene family in solanaceous crops provides insights for further research into the role of tobacco MAX genes in axillary development and stress resistance.