
Novel diagnostic biomarkers related to necroptosis and immune infiltration landscape in acute myocardial infarction
- Published
- Accepted
- Received
- Academic Editor
- Shobana Navaneethabalakrishnan
- Subject Areas
- Bioinformatics, Molecular Biology, Cardiology, Data Mining and Machine Learning
- Keywords
- AMI, Necroptosis, Immune infiltration, Biomarkers, Bioinformatics analysis
- Copyright
- © 2024 Wu et al.
- Licence
- This is an open access article distributed under the terms of the Creative Commons Attribution License, which permits using, remixing, and building upon the work non-commercially, as long as it is properly attributed. For attribution, the original author(s), title, publication source (PeerJ) and either DOI or URL of the article must be cited.
- Cite this article
- 2024. Novel diagnostic biomarkers related to necroptosis and immune infiltration landscape in acute myocardial infarction. PeerJ 12:e17044 https://doi.org/10.7717/peerj.17044
Abstract
Background
Acute myocardial infarction (AMI) can occur suddenly, which may induce deadly outcomes, and the population suffering from AMI presents a younger trend. Necroptosis, the new cell necrosis type, is associated with the pathogenic mechanisms of diverse cardiovascular diseases (CVDs). Its diagnostic value and molecular mechanisms in AMI are still unclear. Objective: This study focused on determining key necroptosis-related genes as well as immune infiltration in AMI.
Methods
We first examined the GSE66360 dataset for identifying necroptosis-related differentially expressed genes (NRDEGs). Thereafter, GO and functional annotation were performed, then a PPI network was built. In addition, “CIBERSORT” in R was applied in comparing different immune infiltration degrees in AMI compared with control groups. The receiver operating characteristic (ROC) curve was plotted to evaluate whether hub NRDEGs could be used in AMI diagnosis. Associations of immune cells with candidate NRDEGs biomarkers were examined by Spearman analysis. Finally, hub NRDEGs were validated by cell qPCR assays and another two datasets.
Results
A total of 15 NRDEGs were identified and multiple enrichment terms associated with necroptosis were discovered through GO and KEGG analysis. Upon module analysis, 10 hub NRDEGs were filtered out, and the top six hub NRDEGs were identified after ROC analysis. These top six NRDEGs might have a certain effect on modulating immune infiltrating cells, especially for mast cells activated, NK cells activated and neutrophils. Finally, two AMI datasets and qPCR assay came to identical findings.
Conclusion
Our results offer the reliable molecular biomarkers and new perspectives for necroptosis in AMI, which lay a certain foundation for developing novel anti-AMI therapeutic targets.
Introduction
Acute myocardial infarction (AMI), a major factor leading to mortality and disability globally, is characterized by the presence of tissue necrosis due to prolonged ischemia (Agewall et al., 2011; Westermann et al., 2017). Regardless of the considerable advances in its prevention, diagnosis and treatment, there are still many AMI patients who eventually develop into chronic heart failure (Timmis et al., 2020; Virani et al., 2020). What’s worse, the AMI hospitalization rate, mainly consisting of young people, shows a growing trend, which imposes a heavy economic burden on society (Arora et al., 2019; Gupta et al., 2014; Timmis et al., 2020). Although great progress has been made in detecting AMI early, including the standard of diagnosis, the cardiac troponin T (cTnT) assay, it still has some drawbacks in identifying early AMI, stable coronary artery disease (CAD) and mild myocardial injury (Braunwald, 2012). Consequently, identifying novel AMI biomarkers and exploring molecular mechanisms are urgent and significant problems to be solved before diagnosing AMI early and improving patient prognosis.
As recently highlighted in numerous studies, immune cell infiltration has a critical effect on genesis and progression of many diseases, including cancers (Gajewski, Schreiber & Fu, 2013), central nervous system disease (Borst, Dumas & Prinz, 2021), endocrine diseases (Koenen et al., 2021) and cardiovascular disease (Hansson & Hermansson, 2011). Several studies demonstrated that T cells, macrophages, together with many inflammatory factors and pathways are related to the development of atherosclerosis (Libby, 2002; Rocha & Libby, 2009). Except for type 2 cytokines, recruiting and activating mast cells, eosinophils and M2 macrophages have a certain effect on the heart function during myocardial infarction (MI) development by different mechanisms. It suggests that immunomodulation is important for infarcted heart diseases (Xu et al., 2019). Nonetheless, there is little research exploring the correlation and specific molecular mechanism between immune cell infiltration and AMI.
Necroptosis represents the programmed necrotic cell death form, and is a key factor for many inflammatory diseases, including stroke (Yang et al., 2018), neurodegenerative diseases (Caccamo et al., 2017), liver and pancreatic diseases (He et al., 2009; Saeed et al., 2017), and MI (Luedde et al., 2014; Oerlemans et al., 2012). Luedde et al. (2014) revealed that, after RIP3 adenoviral overexpression within newborn rat cardiomyocytes and TNF-α treatment, a complex comprised by RIP1 and RIP3, the proteins necessary for causing necrosis, was formed. Additionally, RIP3 overexpression alone was able to promote cardiomyocyte necrosis (Luedde et al., 2014). As a small molecule that can inhibit an important regulatory factor for programmed necrosis (RIP1), necrostatin-1 (Nec-1) can reduce the infarct size while preserving cardiac function (Oerlemans et al., 2012). Based on the above results, necroptosis is important for MI generation. Therefore, exploring its role in AMI is of great significance. In addition, necroptosis plays a vital role in immune response and also is one of the forms of cell death in a variety of immune cells (Pasparakis & Vandenabeele, 2015). However, an integrated analysis of necroptosis and immunity in the pathogenesis and development of AMI has not yet been empirically confirmed in human samples.
The present work downloaded three datasets from GEO database (Barrett et al., 2013), then identified differentially expressed genes (DEGs) as well as necroptosis-related genes (NRDEGs) as the training dataset, whereas GSE97320 and GSE61144 as the validation datasets. Aiming to NRDEGs, the comprehensive bioinformatics analysis was performed for outlining the landscape of immune infiltration, later, necroptosis was combined for determining genes applicable for AMI diagnosis. Moreover, this work explored the relations of necroptosis with immune cell infiltration for shedding more lights on the possible molecular mechanism in AMI.
Materials and Methods
Dataset screening
We downloaded one gene expression microarray based on Gene Expression Omnibus (GEO) database (http://www.ncbi.nlm.nih.gov/geo), with data being acquired in GPL570 (accession number GSE66360) (Muse et al., 2017). GSE66360 contained 99 circulating endothelial cells samples collected from 49 AMI cases and 50 normal subjects. The microarray dataset GSE61144 and GSE97320 served as validation datasets used for external validation. The above data can be obtained in public databases, without further ethical approval.
Selection of DEGs and NRDEGs
DEGs were detected in GSE60993 by adopting the Limma R package on the basis of the normalized count data in R software, with the following thresholds for adjustment: |log2(FC)| > 0.5 & p. adj < 0.05 (FC: Fold change). Volcano plots and heatmaps of DEGs were generated using the ggplot2 R package (https://ggplot2.tidyverse.org) and the heatmap R package, respectively. Thereafter, profiles regarding 159 necroptosis-related genes (Supplemental Materials 1) were obtained based on Kyoto Encyclopedia of Genes and Genomes (KEGG) database (https://www.genome.jp/dbget-bin/www_bget?pathway+hsa04217). Venn diagram package was employed for identifying NRDEGs.
Functional correlation analysis
For investigating potential biological activities related to DEGs, the Database for Annotation, Visualization, and Integrated Discovery version (DAVID) (https://david.ncifcrf.gov/) (da Huang, Sherman & Lempicki, 2009) was adopted in Gene Oncology (GO) (Ashburner et al., 2000) together with KEGG enrichment (Kanehisa & Goto, 2000). Gene functions were classified as three types, including BP (biological process), CC (cellular component) along with MF (molecular function). The significance levels were set at adj. p < 0.05 and false discovery rate (FDR) <0.25.
Establishment of protein–protein interaction (PPI) network and detection of hub genes
The Search Tool for the Retrieval of Interacting Genes (STRING) database (http://string-db.org/) (Szklarczyk et al., 2019) has been developed for PPI network analysis. To explore potential protein–protein interaction networks, STRING was used with a minimum required interaction score of 0.4. Cytoscape is a free platform for complex network visualization and data integration. In this study, Cytoscape was utilized to visualize the PPI network, while cytoHubba plugin was applied in identifying sub-networks and hub objects. Then, we chose the top 10 protein nodes as candidate hub genes.
Receiver operating characteristic (ROC) curve and expression analyses
ROC curve analysis was conducted with “pROC” package on the GSE60993 dataset for verifying the accuracy of the selected hub genes. Hub genes satisfying AUC > 0.7 were selected for diagnosing disease. Hub gene levels in AMI vs. control groups were presented in the form of boxplots with “ggplot2” in R package. Besides, diagnostic value and expression of hub NRDEGs were also verified based on the GSE97320 dataset, with p < 0.05 indicating statistical significance.
Immune infiltration analysis and correlations between NRDEGs and immune cells
For evaluating immune infiltrate abundances, gene expression matrix data were imported into CIBERSORT (https://cibersort.stanford.edu/) (Corces et al., 2016). Thereafter, an immune cell infiltration matrix was acquired. The algorithm is capable of transforming normalized gene expression matrix into infiltrating immune cell composition. In CIBERSORT, we analyzed p-values together with root mean squared errors. Only data satisfying CIBERSORT p < 0.05 were selected and preserved for later analyses. The eventual CIBERSORT output estimates of samples were normalized into one value and later explained as cell fractions to compare diverse datasets and immune cells directly. Afterwards, the output was combined for generating the whole immune cell fraction matrix. R package “corrplot” (https://CRAN.R-project.org/package=corrplot) was employed for visualizing the correlations of 22 infiltrating immune cell types with NRDEGs.
Culture and processing of cardiomyocyte cell line
Human myocardial AC16 cells (Tongpai, Shanghai, China) were cultivated in Dulbecco’s modified Eagle’s medium (DMEM) that contained 1% antibiotics as well as 10% FBS (ExCell Bio, Shanghai, China) under 37 °C and 5% CO2 conditions. Thereafter, the hypoxia model was built through 24 h exposure of cells to the hypoxic environment (94% N2, 1% O2 and 5% CO2). Meanwhile, control AC16 cells were treated with normoxic condition (21% O2, 5% CO2, together with 74% N2).
Real-time quantitative polymerase chain reaction (RT-qPCR)
High Pure RNA Isolation Kit (Roche, Basel, Switzerland) was utilized for extracting and purifying total cellular RNAs. Later, cDNA was prepared from 500 ng RNAs with Verso cDNA Synthesis Kit (Thermo Fisher Scientific, Waltham, MA, USA). Afterwards, the Fast SYBR Green Master Mix (Applied Biosystems, Foster City, CA, USA) was employed for determining hub gene levels. The 2−ΔΔCT approach was applied in determining target gene levels. Sequences of all RT-qPCR primers can be found from Table S1.
Results
Screening of DEGs and NRDEGs between AMI and normal groups
Normalization of the sample data on the AMI group and the normal group in GSE66360 was done before differential analysis and it was noted that the data in the two groups were comparable (Fig. 1A). DEGs detected in the GSE66360 dataset and screened after the chip results were normalized. Figure 1B exhibits the expression profiles the top 50 DEGs by visualizing the heatmap, and these genes were well clustered between AMI and control groups. Altogether 1486 DEGs were detected in AMI vs. normal groups, including 676 up- whereas 810 down-regulate genes (Fig. 1C). In addition, DEGs were overlapped with necroptosis-related genes in GSE66360, and 15 overlapped NRDEGs were selected for subsequent analyses. Figure 1D displays those 15 NRDEGs by the Venn diagram. Figure 1E presents a heatmap plot for visualizing 15 NRDEGs levels.
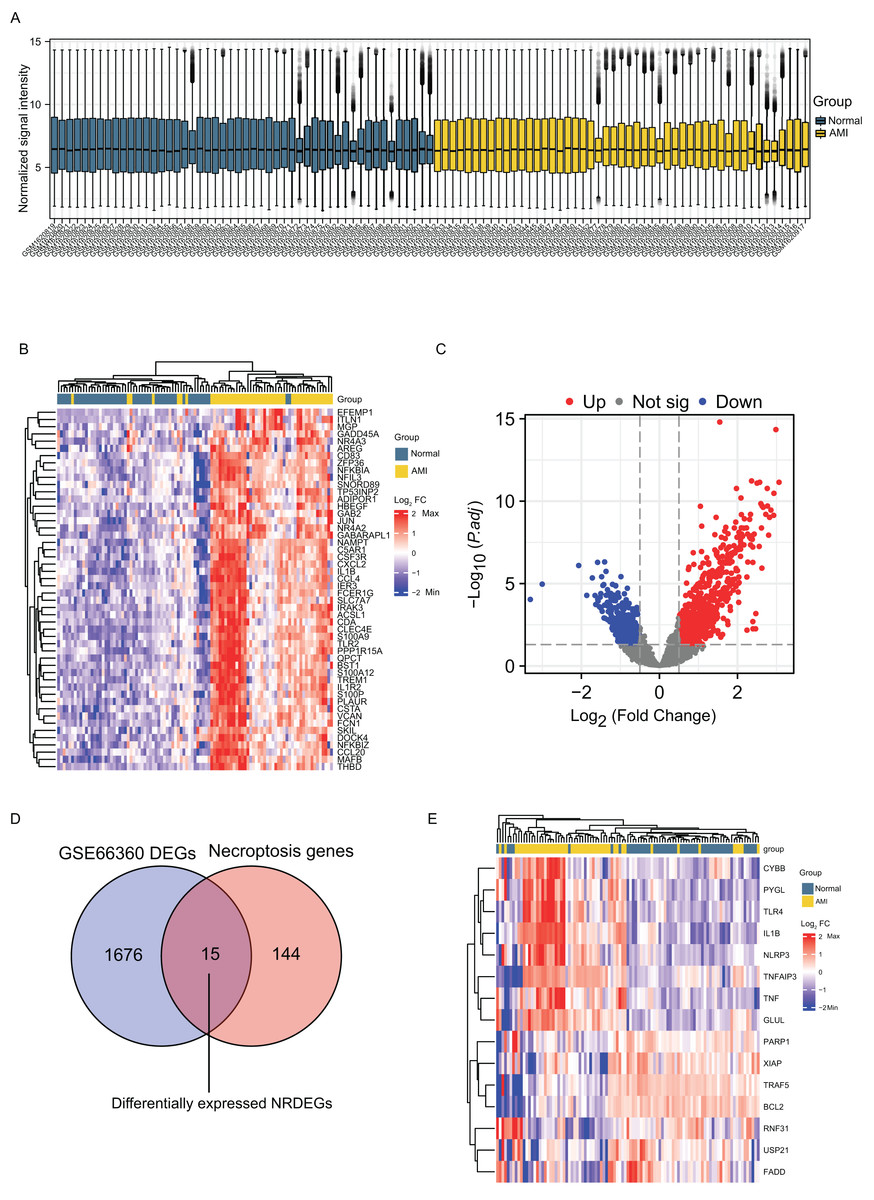
Figure 1: Identification of DEGs and NRDEGs in AMI.
(A) Normalization of the sample data demonstrated by box plots after processing; (B) the heatmap of top 50 DEGs from differential analysis of the GSE66360 dataset based on the values of |log2FC|; (C) the volcano plot of expression of DEGs in GSE66360 dataset; (D) Venn diagram showing intersection genes between DEGs in GSE66360 and necroptosis-related genes in the KEGG Pathways Database; (E) the heat map of 15 NRDEGs in GSE66360. FC, fold change.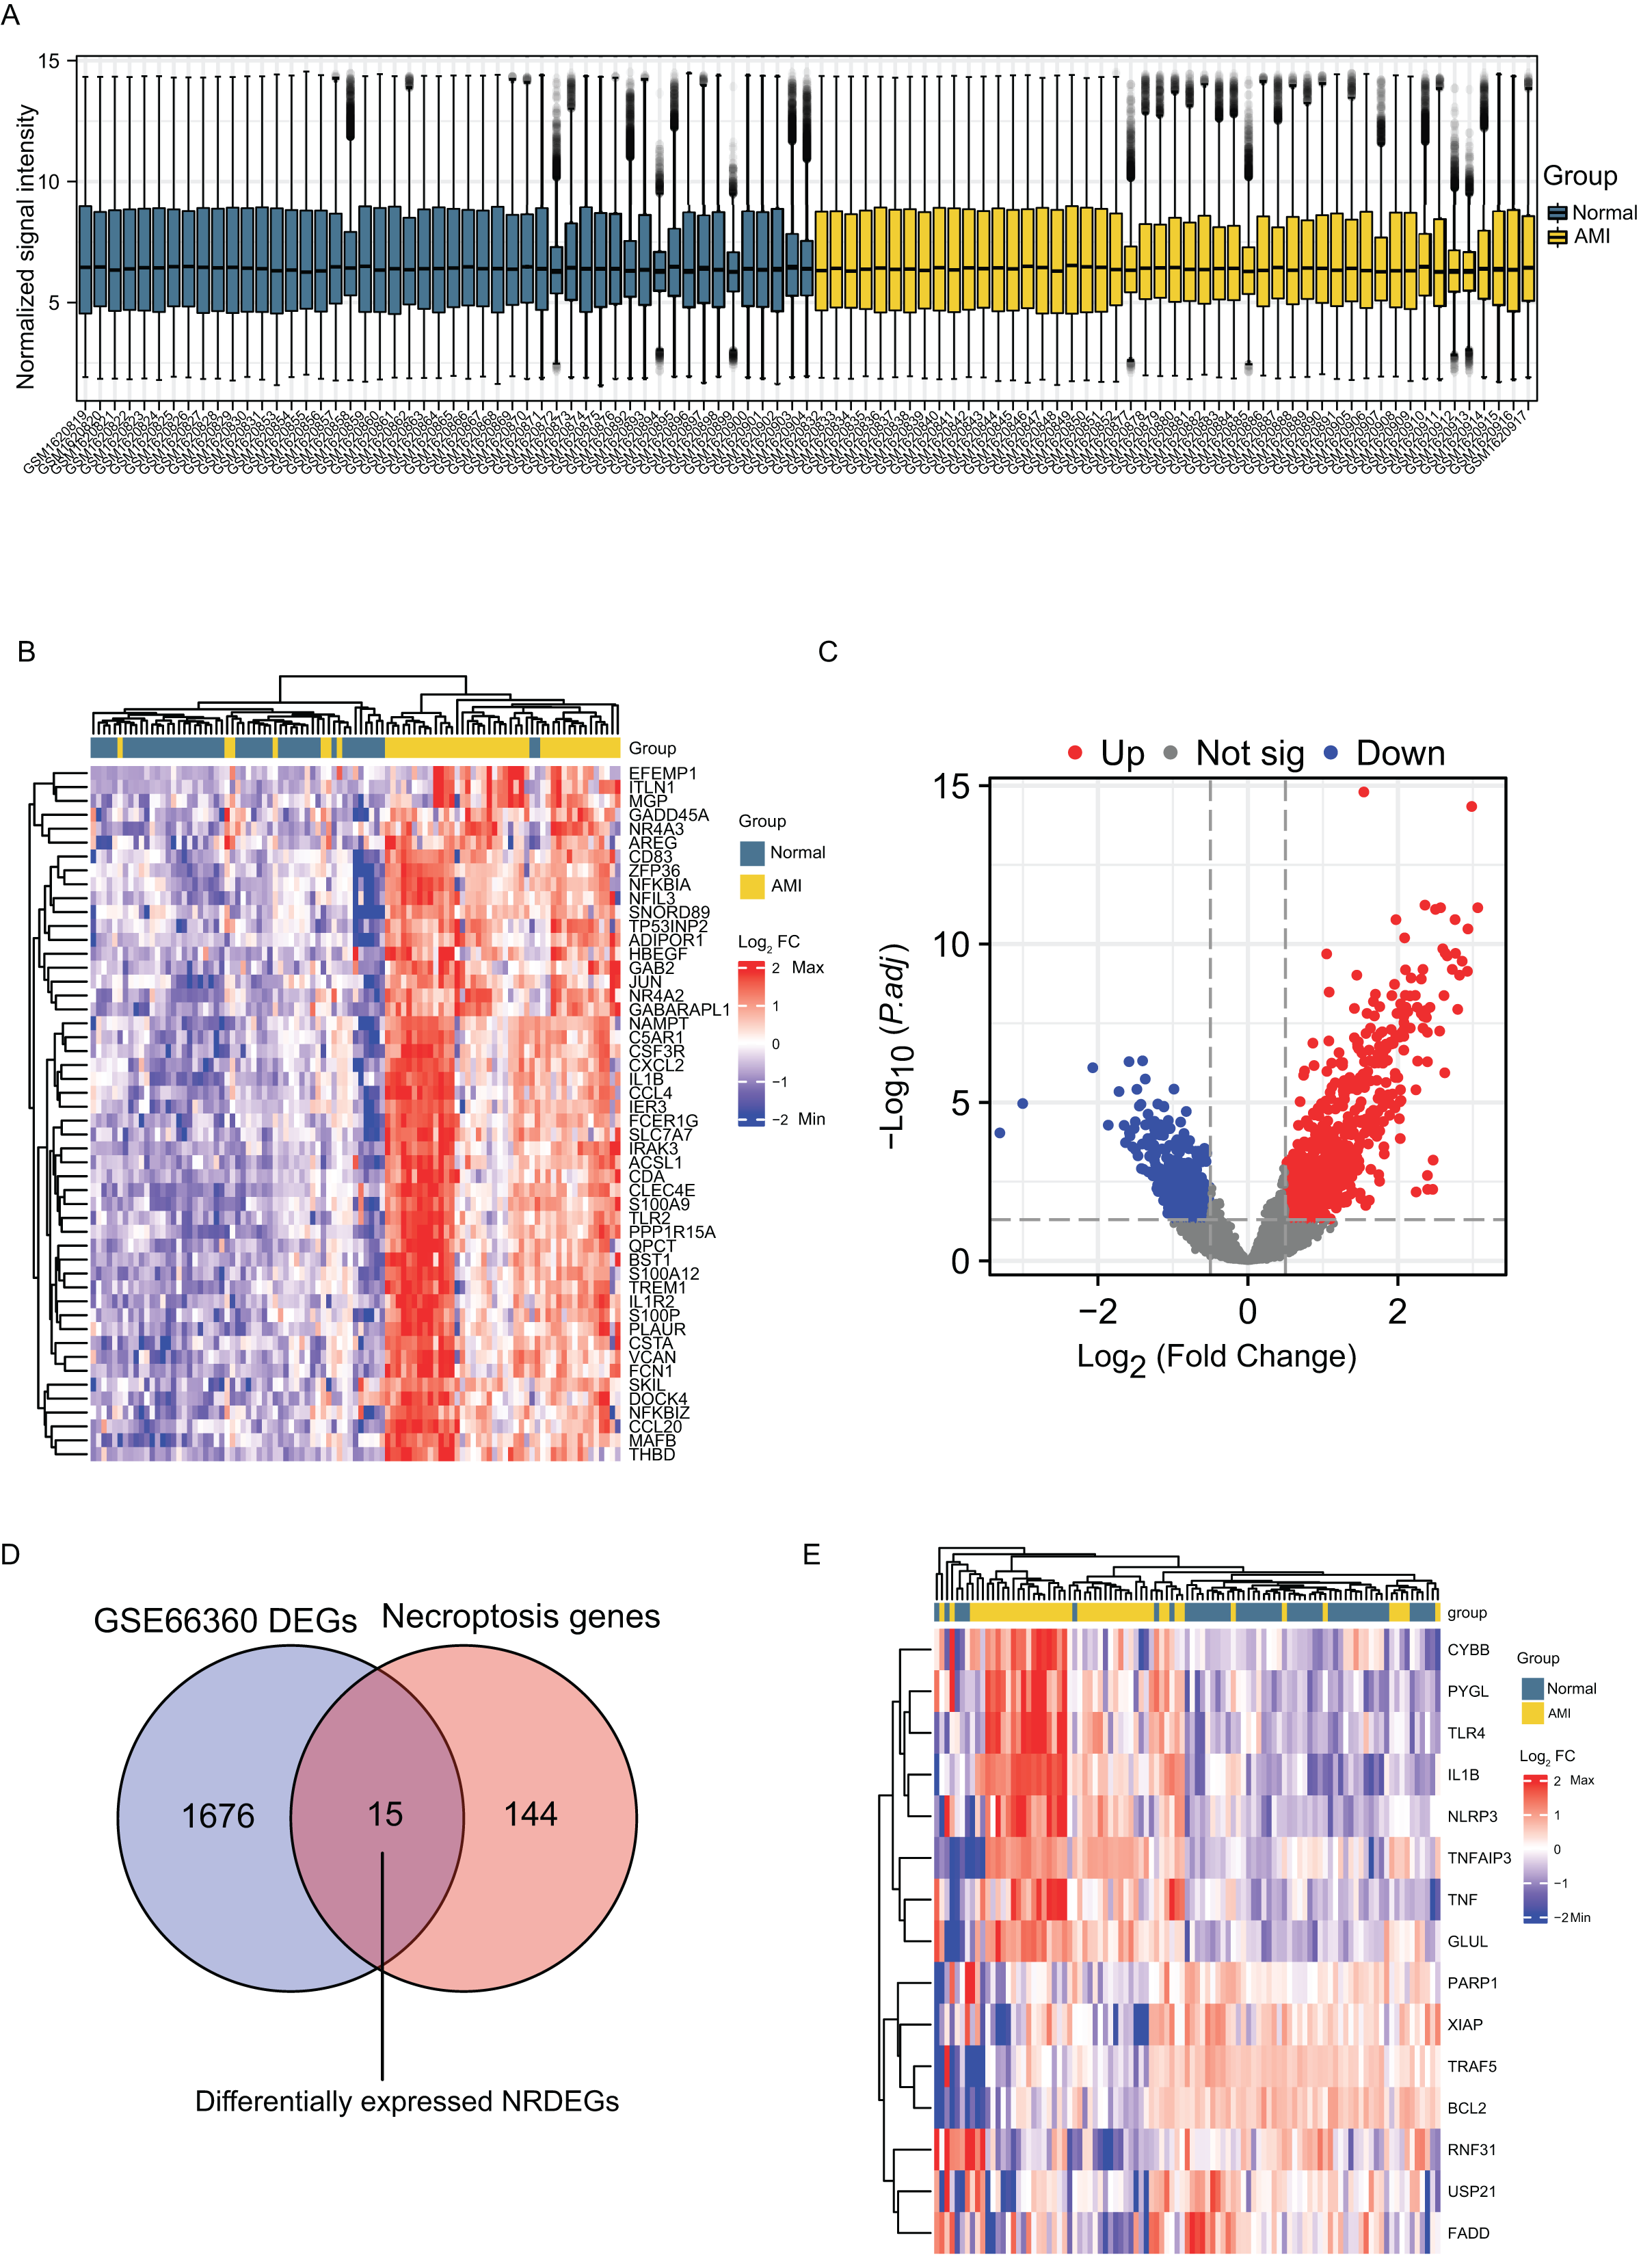
GO and KEGG pathway enrichment
Go annotation and KEGG analysis indicated that DEGs were significantly involved in the immune receptor activity, pattern recognition receptor activity, cytokine−cytokine receptor interaction, osteoclast differentiation, the TNF signaling pathway and the NF−kappa B signaling pathway (Figs. 2A and 2B). To analyze the functional terms and mechanisms enriched by the selected NRDEGs, GO along with KEGG enrichment were conducted using an online approach. As a result, there were 46 KEGG pathways and 887 GO terms related to the above NRDEGs (FDR < 0.25, adj. p < 0.05), including 850 BPs, 4 CCs and 33 MFs (Table S2). Based on GO functional annotation, regulation of DNA-binding transcription factor activity, regulation of positive regulation of establishment of protein localization, necroptotic process, regulation of I-kappaB kinase/NF-kappaB signaling, and I-kappaB kinase/NF-kappaB signaling were enriched into BP category (Fig. 2C). Furthermore, the enriched CC terms were nuclear envelope and cytoplasmic side of membrane and cytoplasmic side of plasma membrane (Fig. 2C). Those MFs enriched included cytokine receptor binding, tumor necrosis factor receptor binding, and protease binding (Fig. 2C). Meanwhile, those KEGG pathways enriched included NOD-like receptor pathway, necroptosis, shigellosis, the NF-kappa B pathway, and the TNF pathway (Fig. 2C) (Table S3).
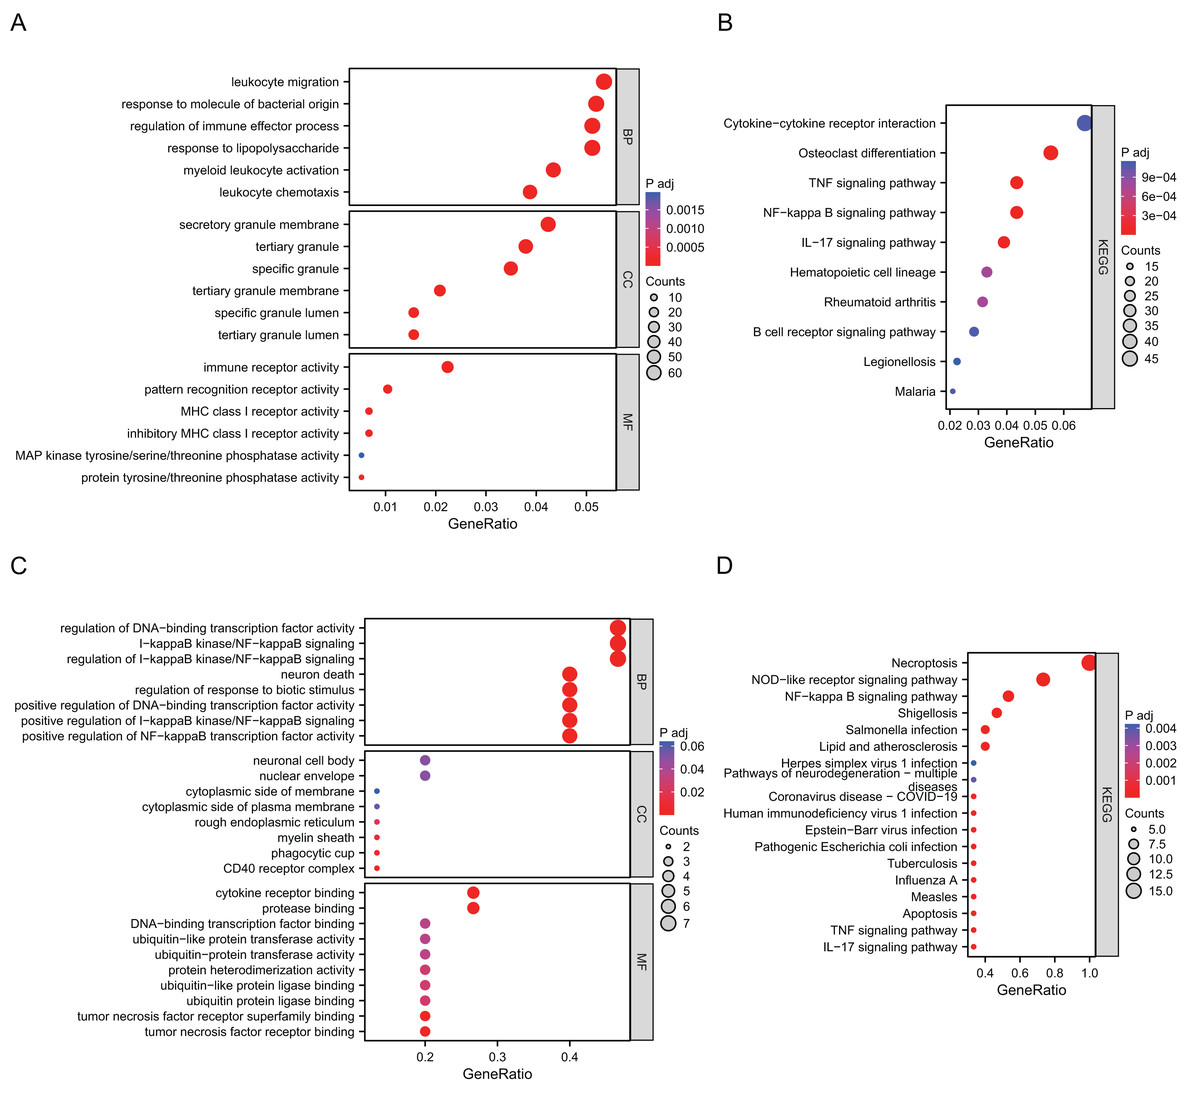
Figure 2: Results of GO and KEGG enrichment analysis using DEGs and NRDEGs.
(A) The significant enrichment analyses of biological processes, cellular component and molecular function analysis using 1691 DEGs; (B) KEGG analysis of 1691 DEGs. (C) The significant enrichment GO enrichment analyses of 15 NRDEGs. (D) KEGG analysis of 15 NRDEGs.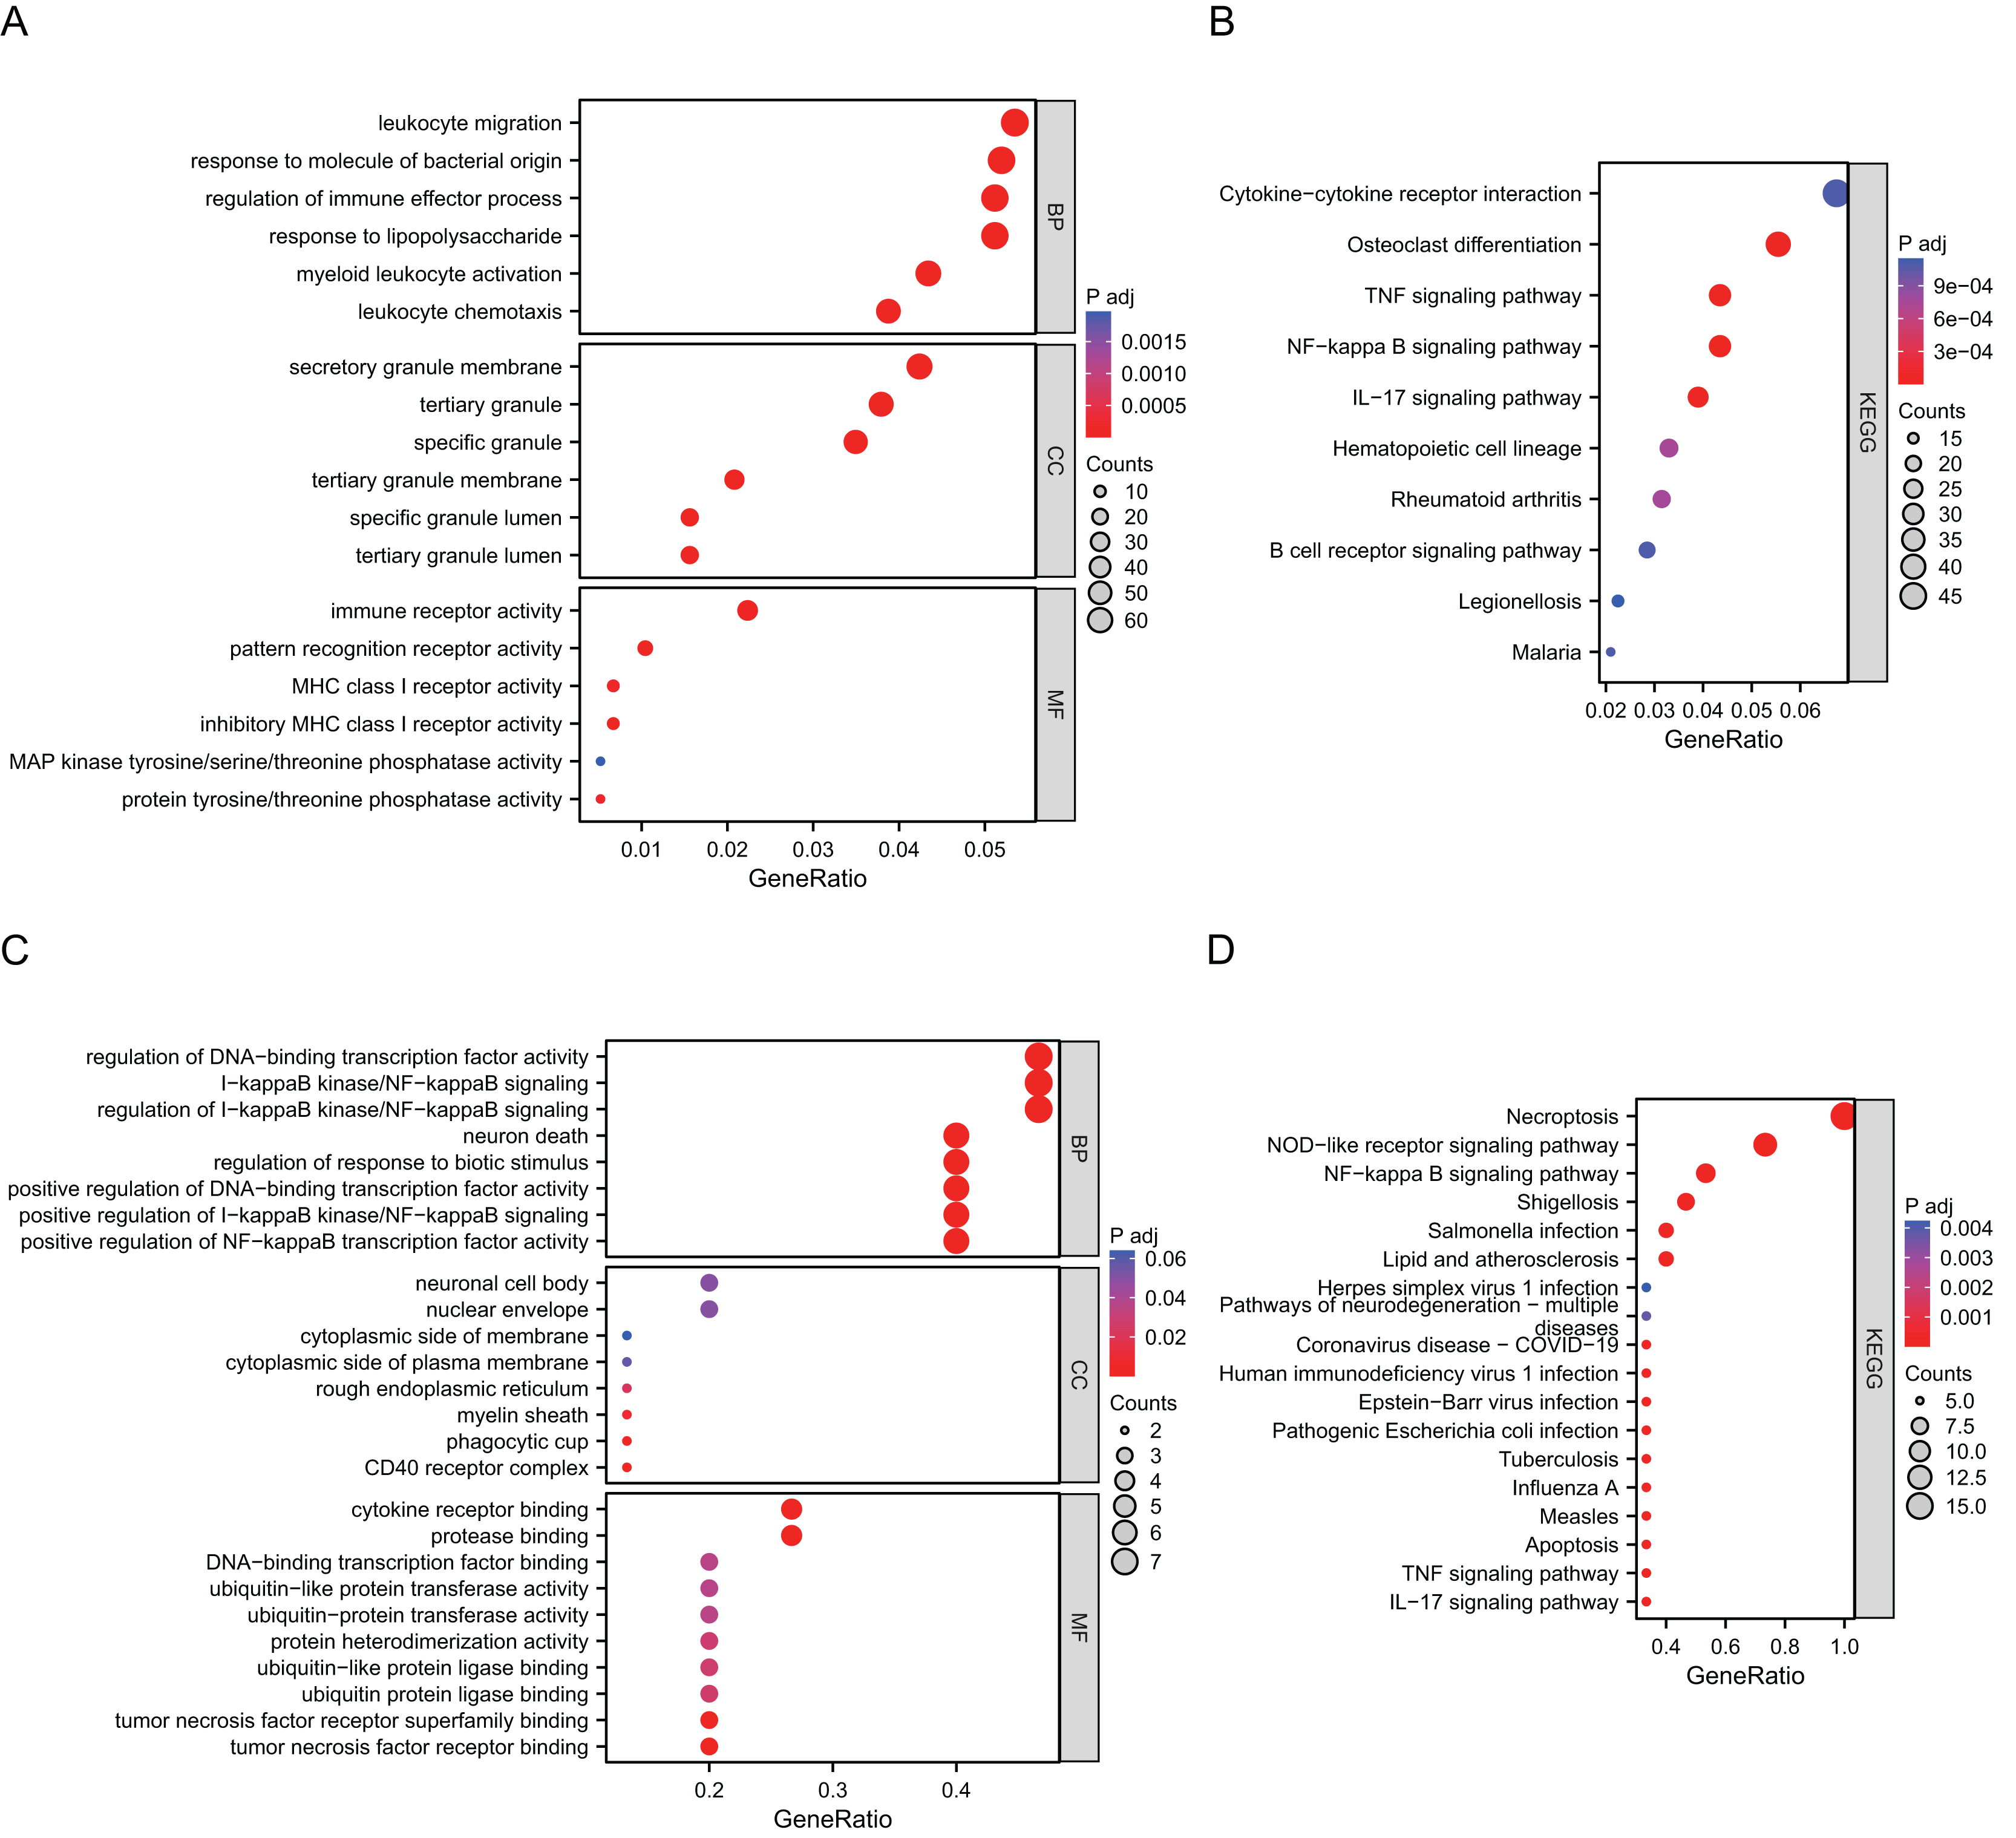
PPI network analysis and screening of hub NRDEGs
Using STRING database, the present study constructed the PPI network of those hub NRDEGs with Cytoscape software, aiming to explore potential correlations and the mechanisms underlying AMI and necroptosis. According to Fig. 3A, the built PPI network included 15 nodes and 45 edges.
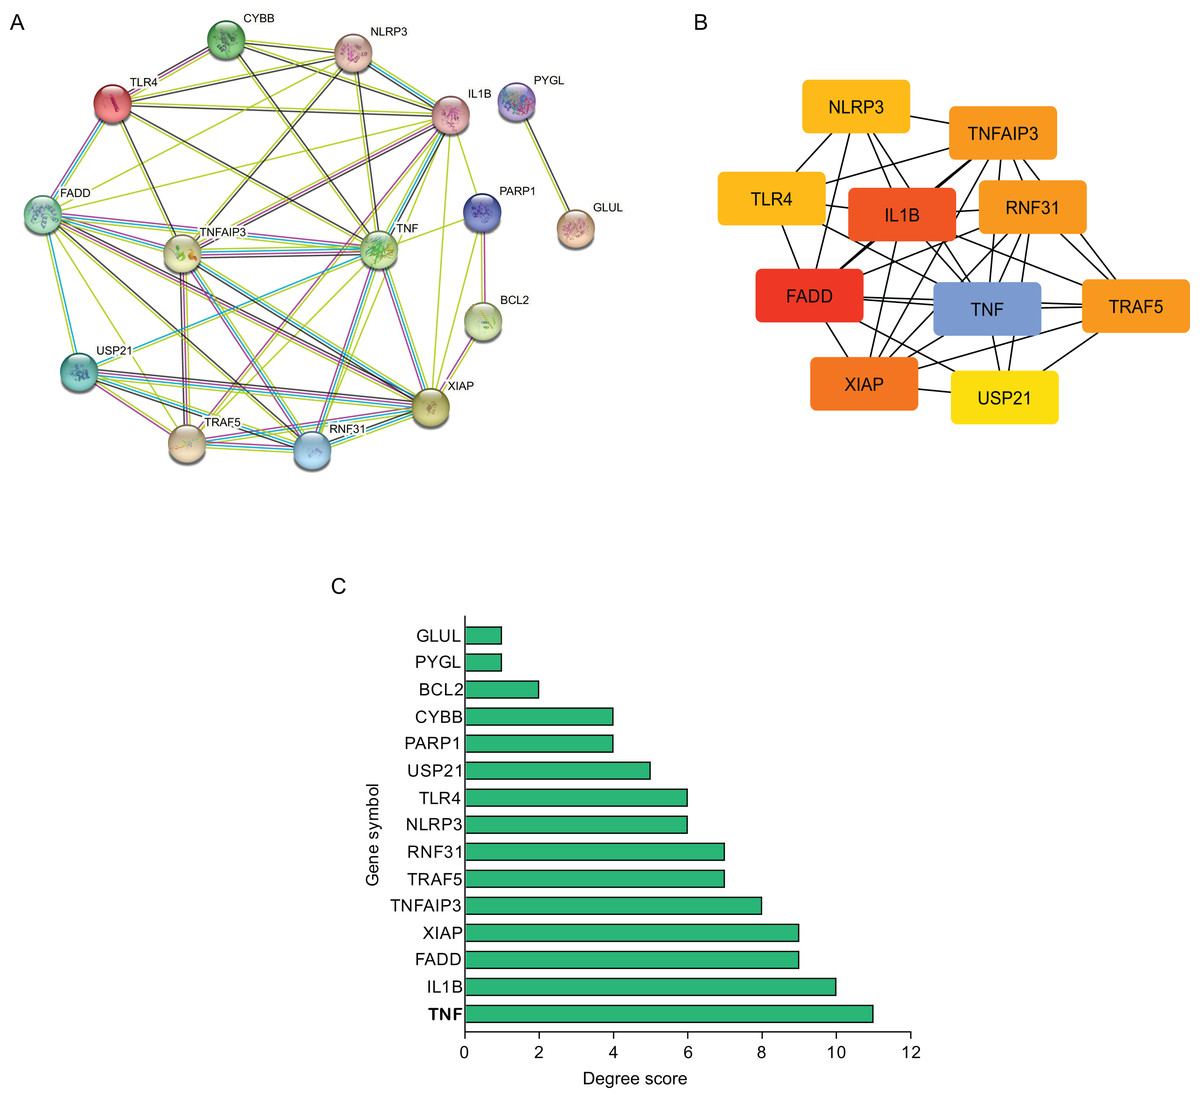
Figure 3: Establishment of modules and identified of hub NRDEGs in AMI.
(A) A NRDEG PPI network constructed using the STRING database; (B) PPI network of the most significant module; (C) 15 NRDEGs in the PPI network ranked by degree method.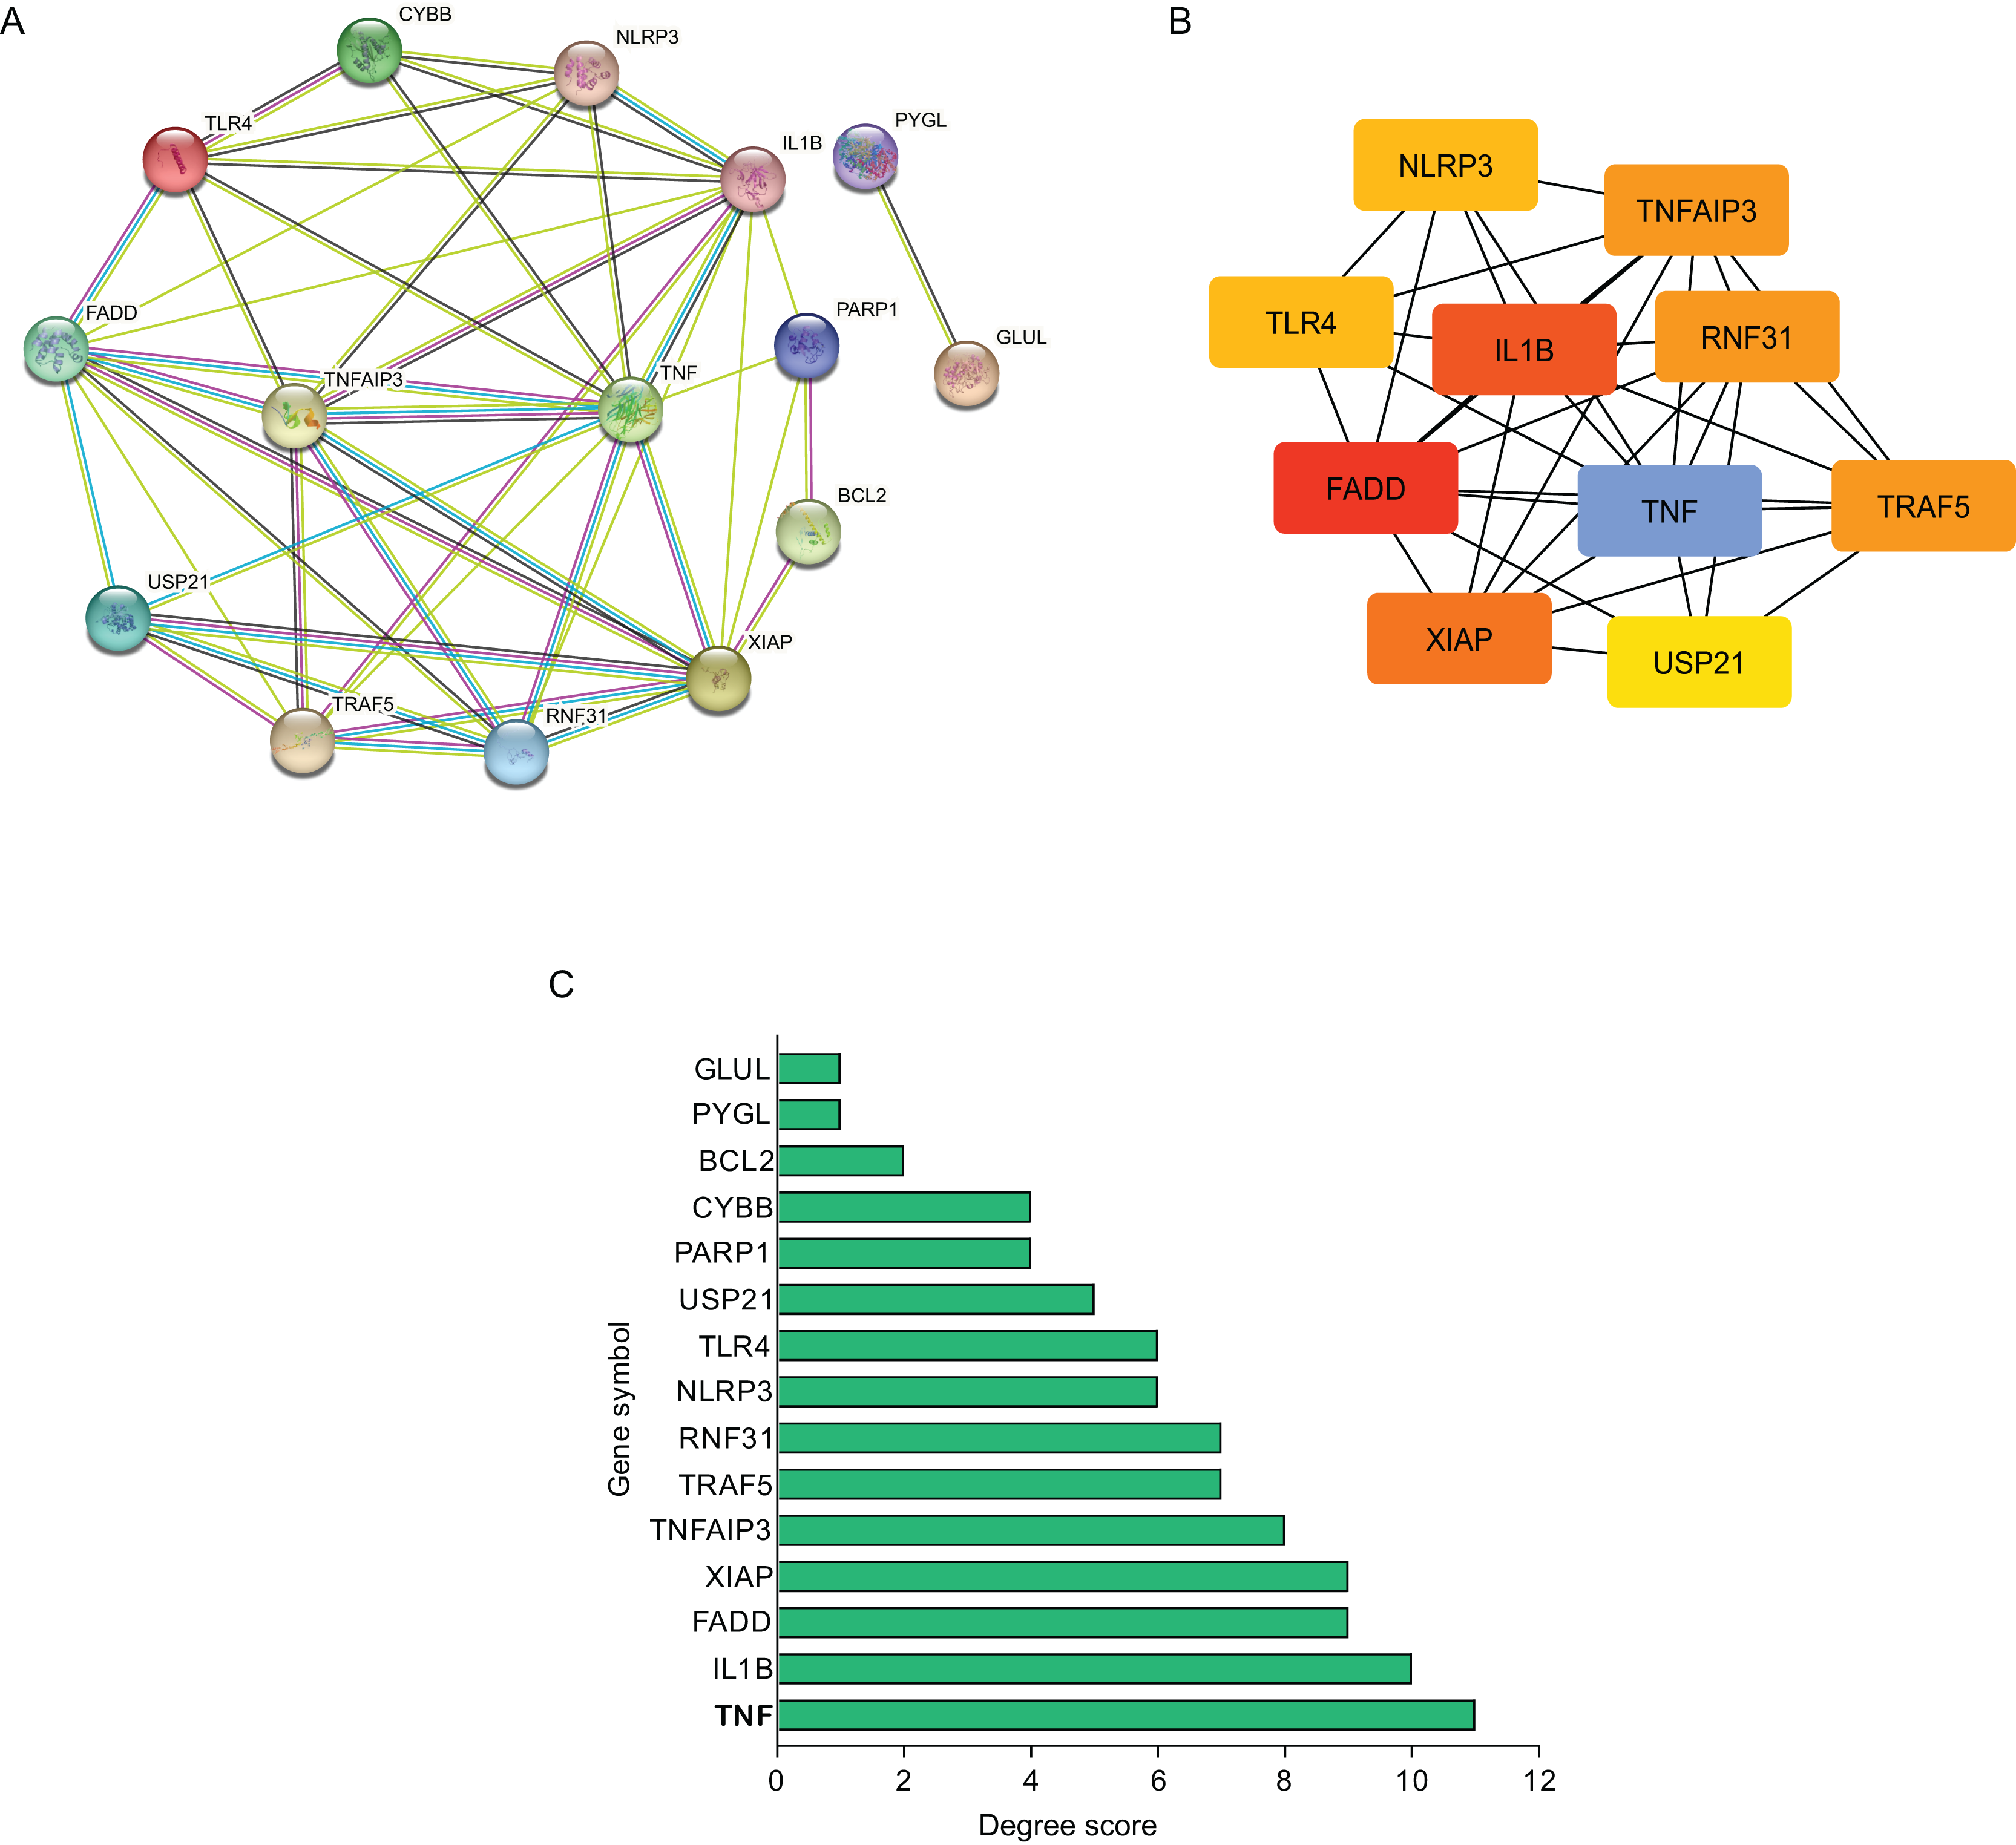
Further, those 10 most significant hub genes were identified with an algorithm in CytoHubba MCC, which including TNF, IL1B, FADD, XIAP, TNF AIP3, TRAF5, RNF31, NLRP3, TLR4 and USP21 (Fig. 3B). The degree scores are shown in Fig. 3C.
Verification of diagnostic significance of hub NRDEGs
For verifying whether those selected 10 most significant NRDEGs could be used in diagnosis, ROC curve analysis was conducted, then AUC values were calculated for determining their performances in differentiating AMI from normal groups. Our results showed that TNF, IL1B, TNFAIP3, TRAF5, NLRP3 and TLR4 achieved the AUC values>0.7. This suggested that the above 6 NRDEGs were highly sensitive and specific for AMI, revealing their feasibility as diagnostic biomarkers for AMI (Figs. 4A, 4B). Gene levels in both groups of the GSE66360 dataset were analyzed, which indicated that TNF, IL1B, TNFAIP3, NLRP3 and TLR4 expression in AMI group was up-regulated (Figs. 4C, 4D). Collectively, TNF, IL1B, TNFAIP3, TRAF5, NLRP3 and TLR4 were identified as the potential hub NRDEGs.
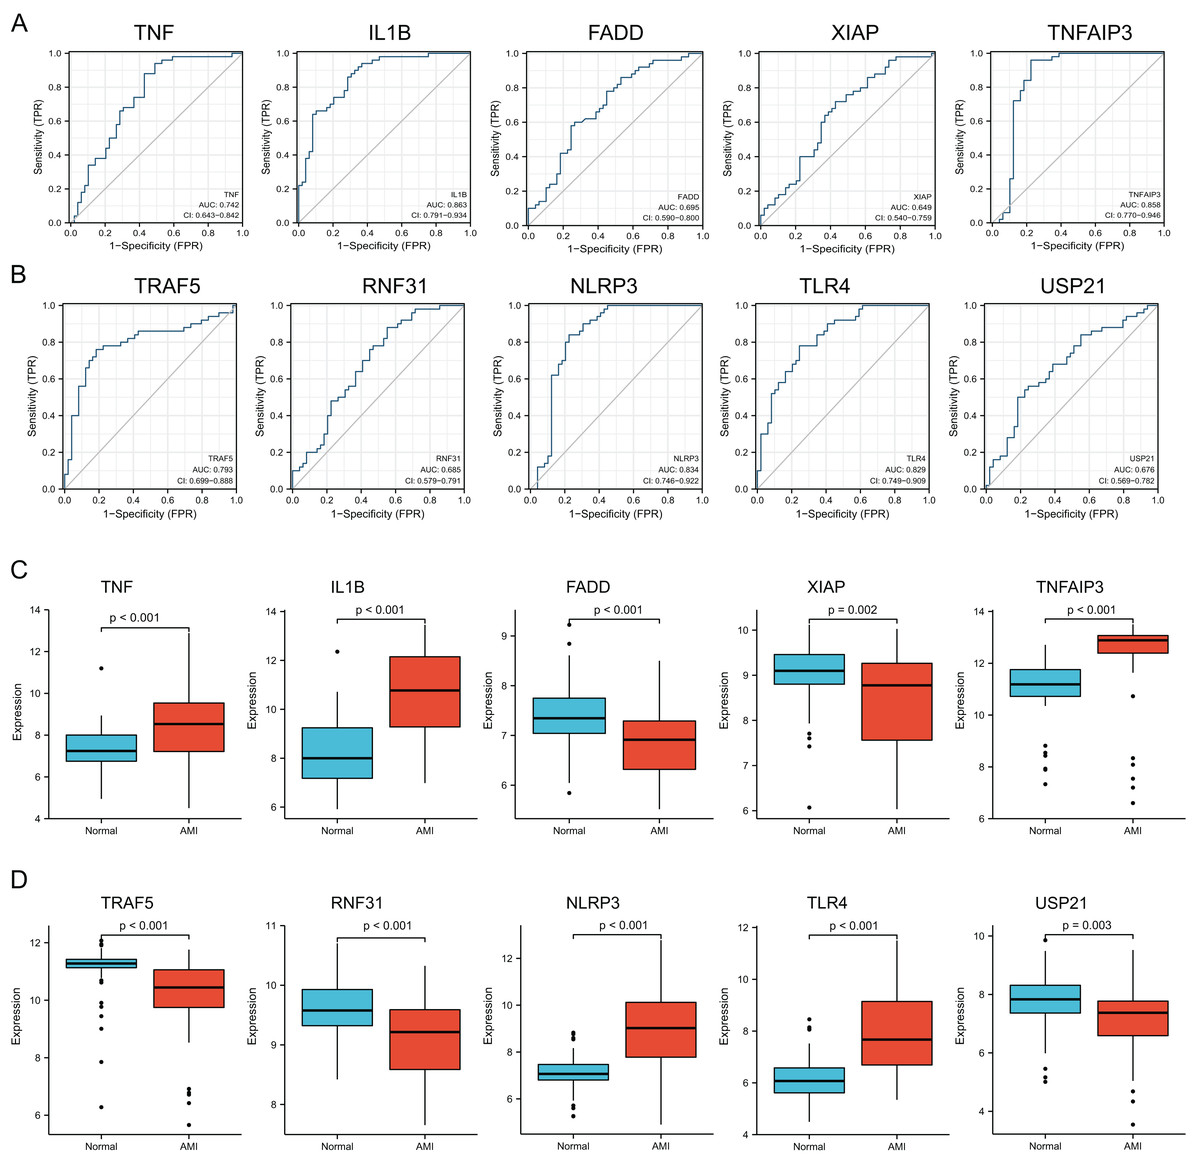
Figure 4: Identification and evaluation of candidate hub NRDEGs.
(A and B) The diagnostic performance of the calculated based on the 10 NRDEGs expression in AMI diagnosis in training dataset (GSE66360); (C and D) the expression of top 10 NRDEGs in training dataset (GSE66360). AUC > 0.7 indicated that the model had a good fitting effect. ROC, receiver operating characteristic; AUC, area under the ROC curve. p < 0.05 was considered statistically significant.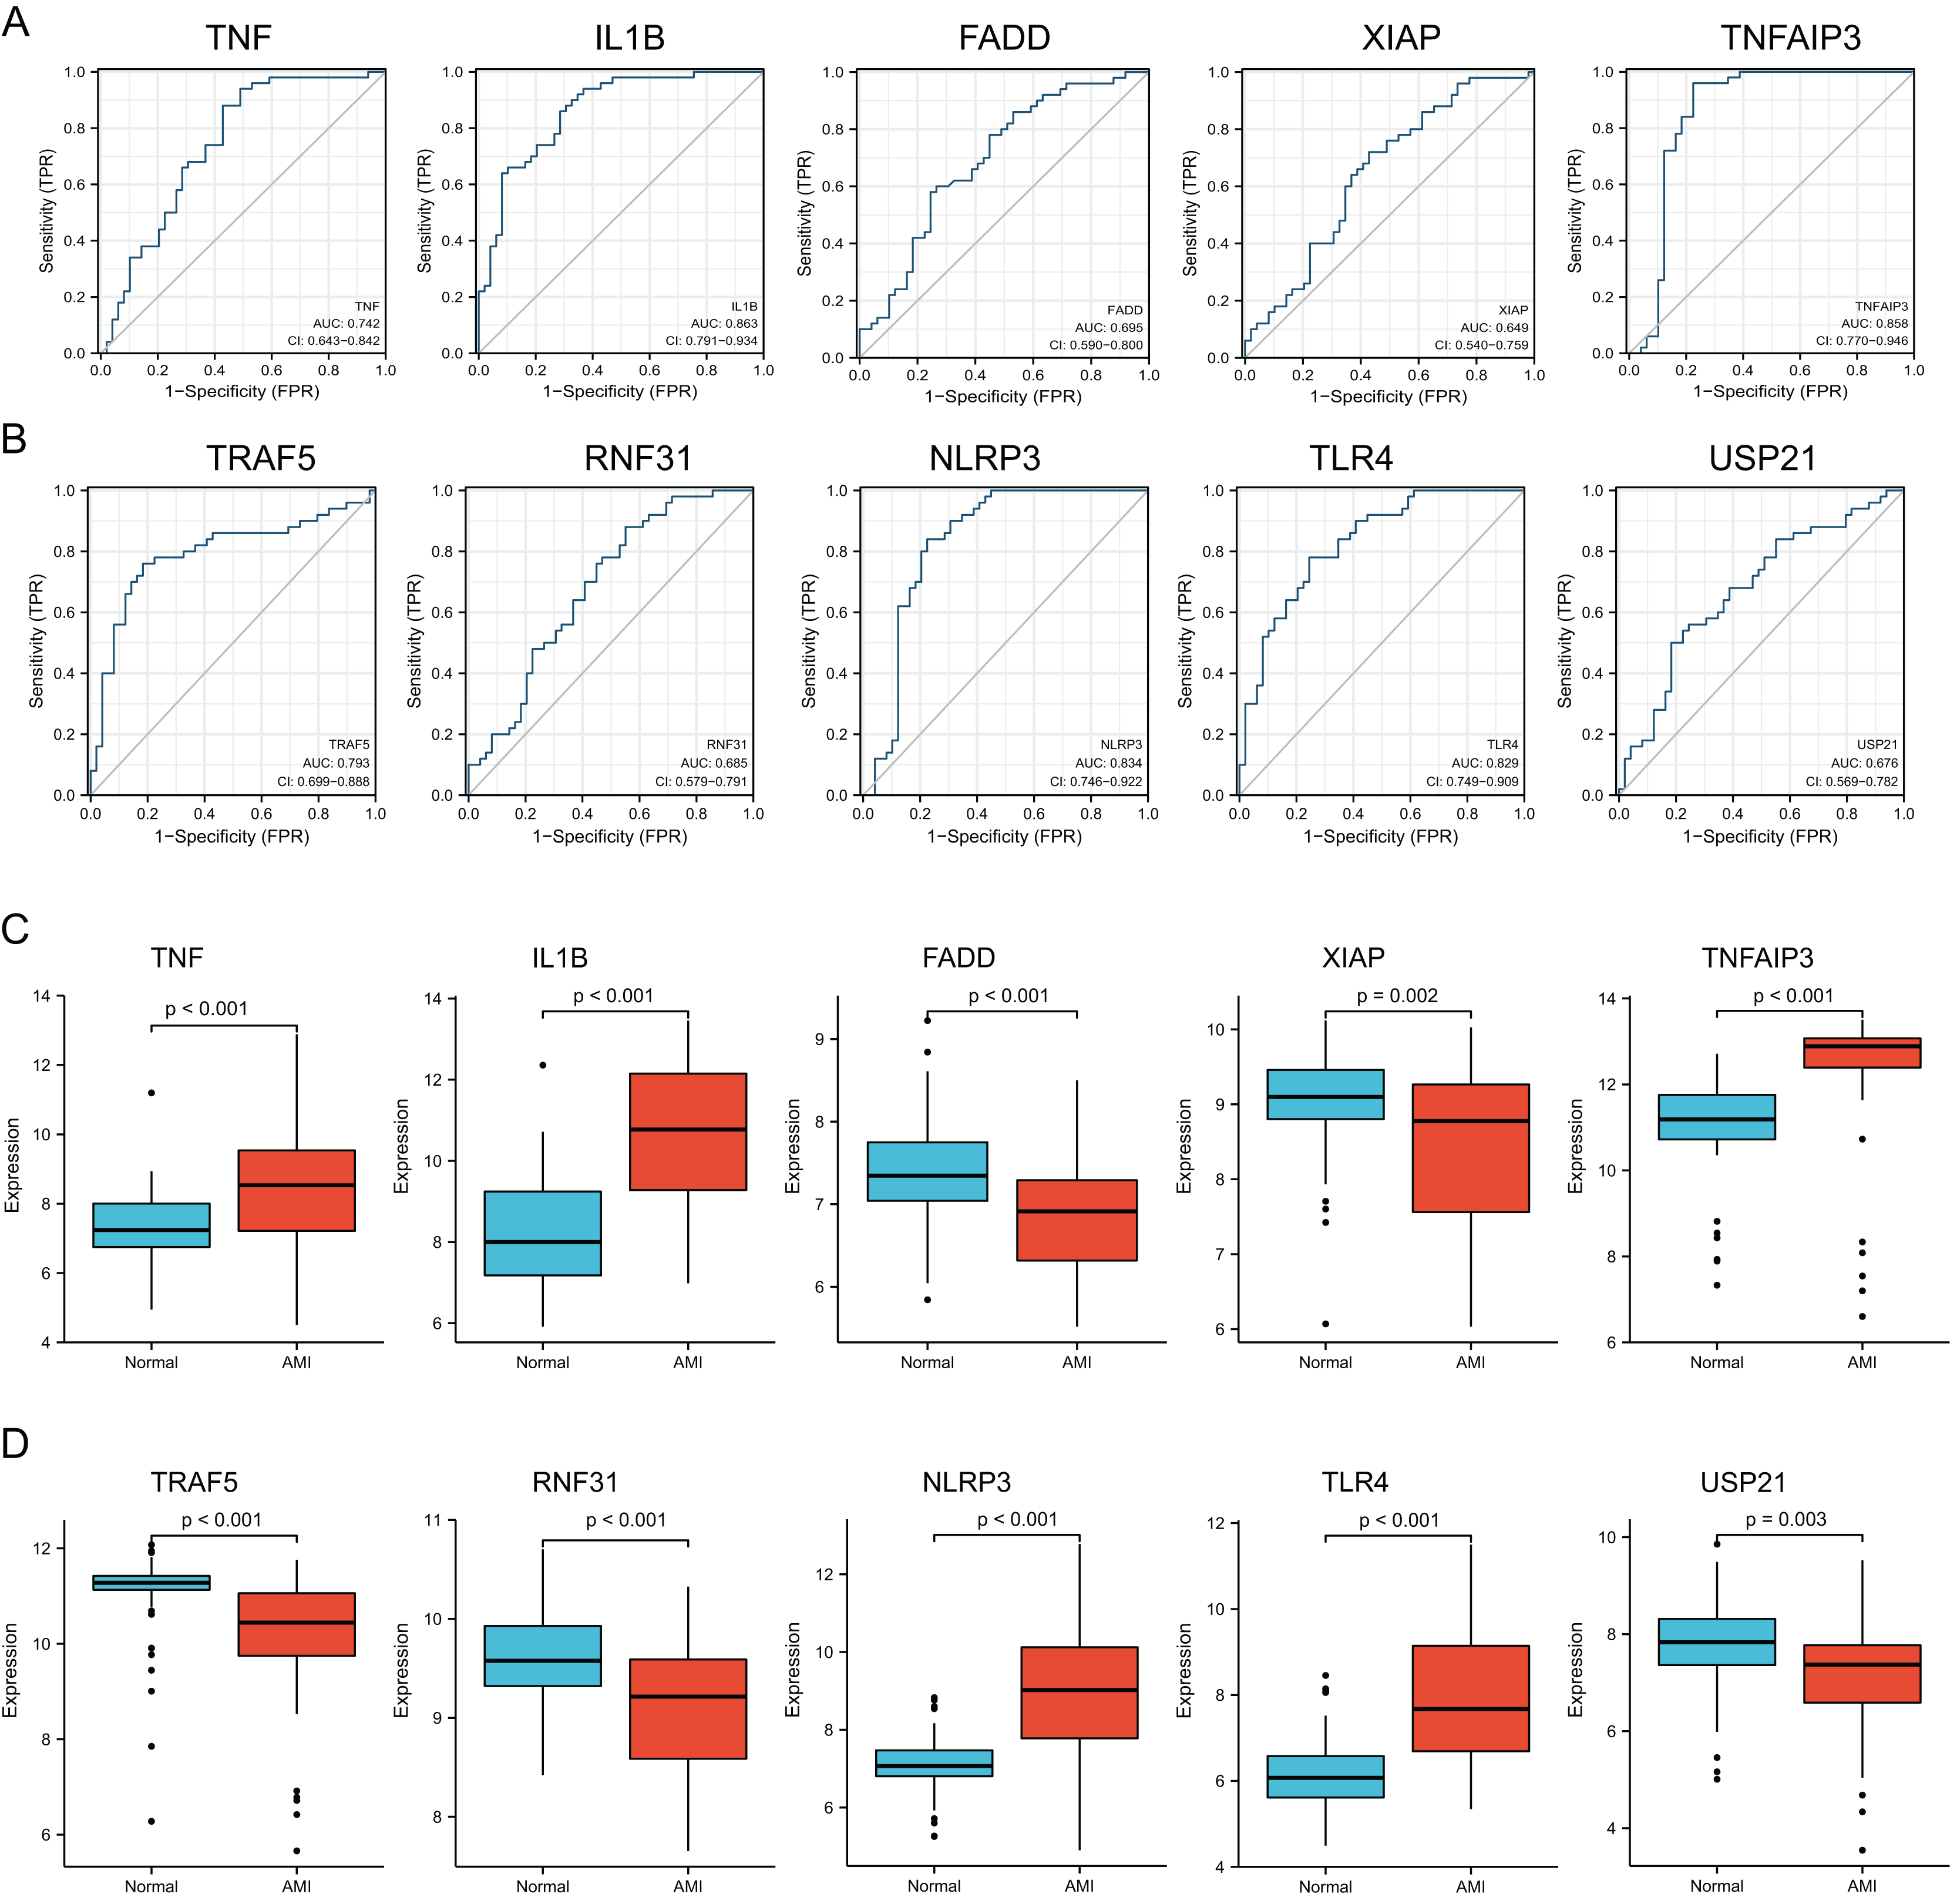
Immune cell infiltration
Immune cell compositions in AMI and normal circulating endothelial cells were analyzed. According to Fig. 5A, immune cell composition showed significant change in both groups. In Fig. 5B, 13 immune cell types exhibited obvious differences between two groups (p < 0.05). The proportion of dendritic cells activated, mast cells activated, mast cells resting, mast cells resting, monocytes, NK cells activated, NK cells resting and T cells follicular helper were markedly greater in AMI group than normal group, whereas dendritic cells resting, T cells CD4 memory resting, T cells CD8 T cells regulatory (Tregs), and T cells gamma delta were markedly less than normal group. During the first few hours of AMI, neutrophils increased and initiated local inflammation and tissue destruction.
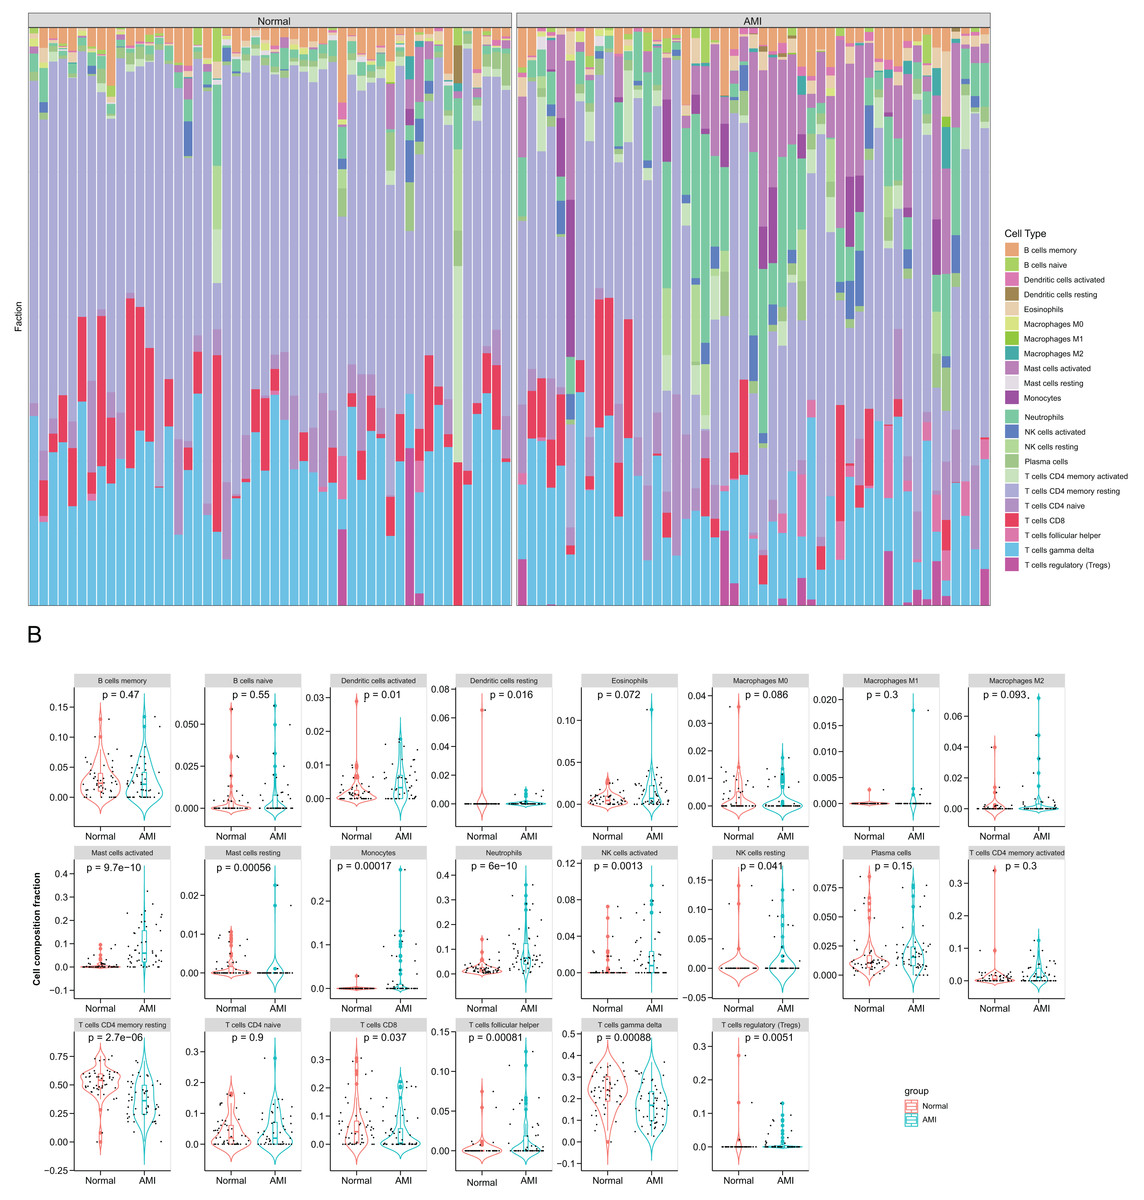
Figure 5: Immune infiltration analysis based on the CIBERSORT algorithm.
(A) The enrichment fraction of 22 types of immune infiltrating cells in the AMI and normal samples; (B) violin plots of 22 types of immune infiltrating cells in the AMI and normal samples. p < 0.05 was considered statistically significant.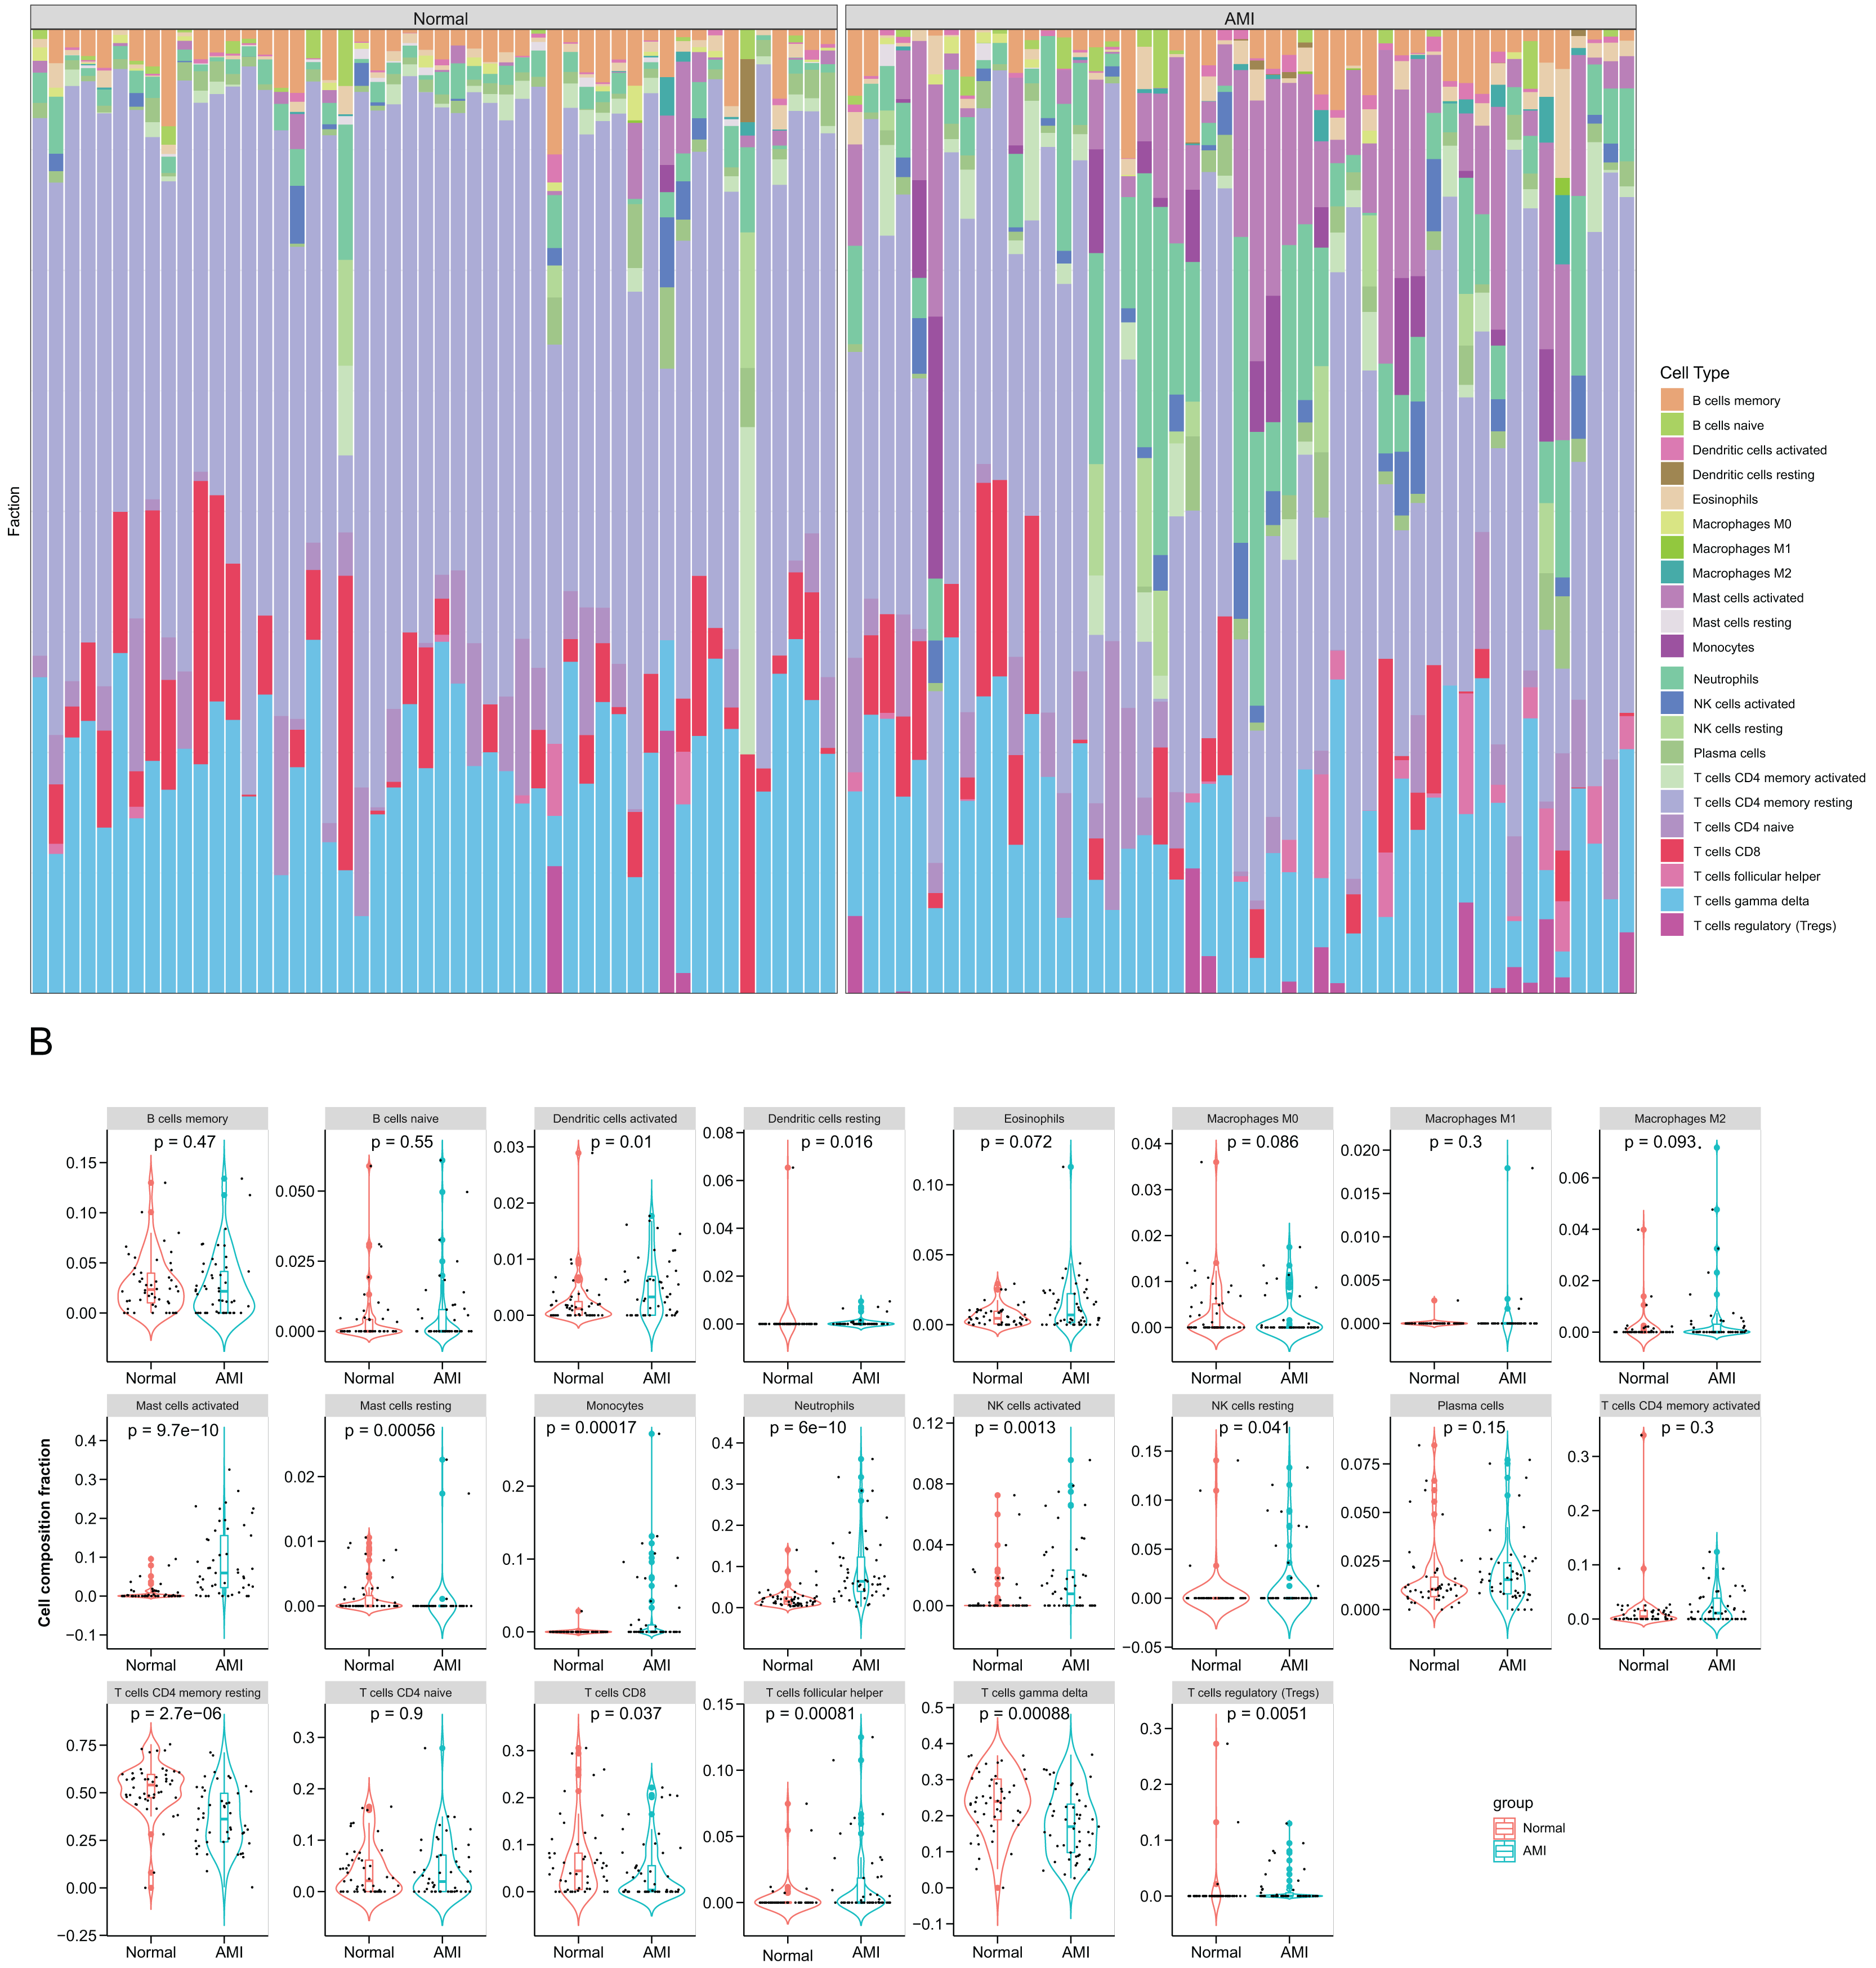
Correlations between six hub NRDEGs with immune infiltrating cells
To understanding functions of the above hub NRDEGs in immune infiltration, this work employed Spearman correlation analysis for determining their relations with immune cell infiltration. As shown in Fig. 6, TNF displayed positive relation to NK cells activated, monocytes, mast cells activated and neutrophils, whereas negative relation to T cells CD4 memory resting and plasma cells (Fig. 6A). IL1B exhibited positive relation to mast cells activated, neutrophils, NK cells activated and monocytes, whereas negative relation to T cells CD4 memory resting, T cells gamma delta, plasma cells, and mast cells resting (Fig. 6B). TNFAIP3 displayed positive relation to NK cells activated, T cells gamma delta, mast cells activated, and neutrophils, whereas negative relation to plasma cells, T cells regulatory (Tregs), macrophages M2, B cells memory, T cells follicular helper, macrophages M1 and NK cells resting (Fig. 6C). TRAF5 demonstrated positive relation to T cells CD4 naïve, T cells CD4 memory resting, and T cells gamma delta, while negative relation to plasma cells, T cells regulatory (Tregs), mast cells activated, T cells follicular helper, macrophages M2, dendritic cells activated, monocytes, eosinophils, neutrophils, B cells memory and NK cells activated (Fig. 6D). NLRP3 showed positive relation to NK cells activated, mast cells activated, monocytes, neutrophils, dendritic cells activated and eosinophils, whereas negative relation to T cells gamma delta and T cells CD4 memory resting (Fig. 6E). TLR4 demonstrated positive relation to neutrophils mast cells activated, monocytes, NK cells activated, NK cells resting, and B cells naive, whereas negative relation to T cells gamma delta and T cells CD4 memory resting (Fig. 6F).
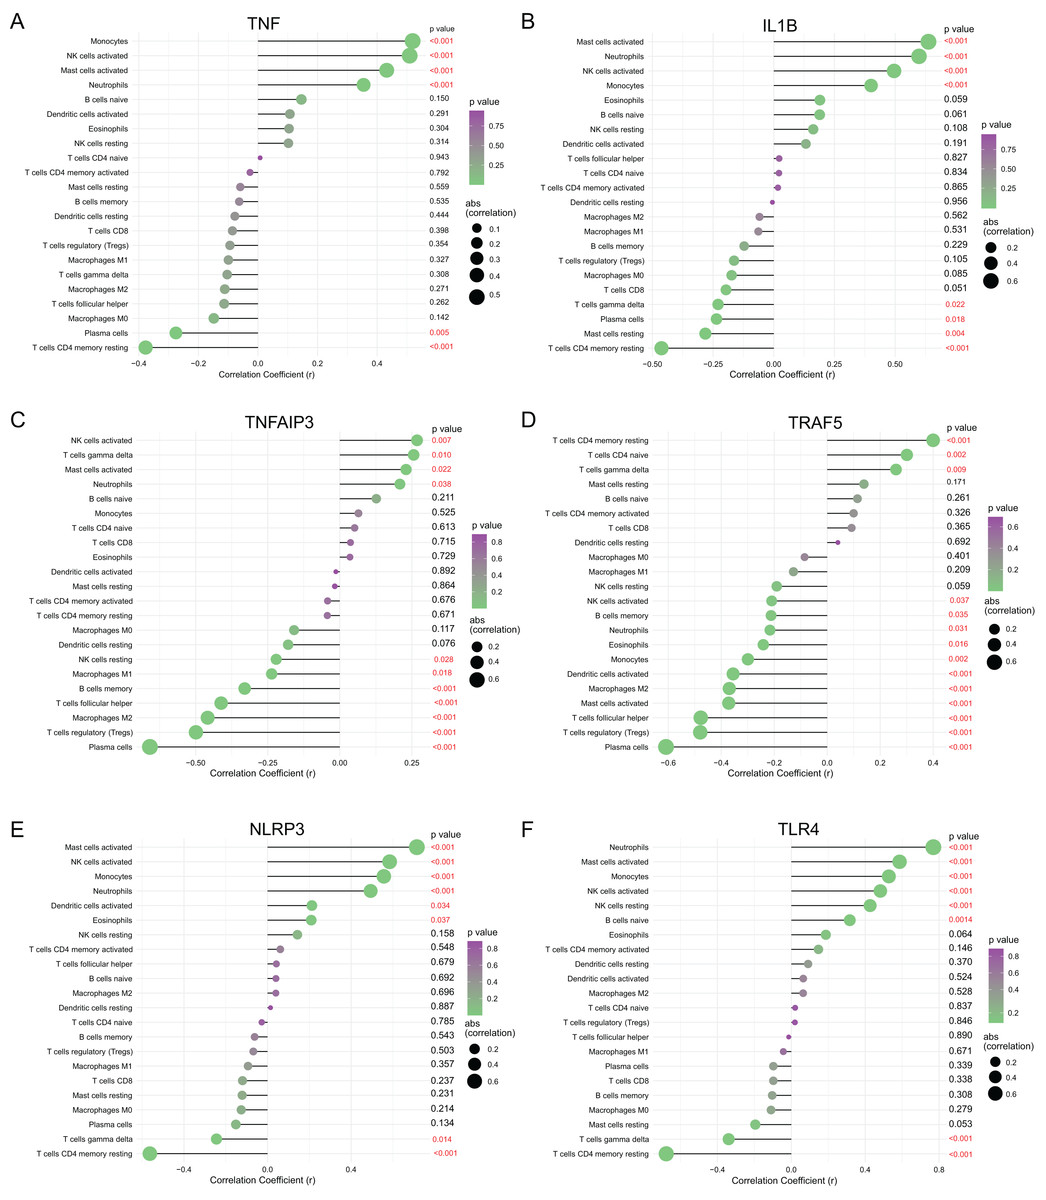
Figure 6: Correlation between (A) TNF, (B) IL1B, (C) TNFAIP3, (D) TRAF5, (E) NLRP3 and (F) TLR4 with immune infiltrating immune cells.
The size of the dots represents the strength of the correlation between genes and immune cells; the larger dots represent the stronger correlation; the smaller dots represent the weaker correlation. The color of dots represents the p-value. p < 0.05 was considered statistically significant.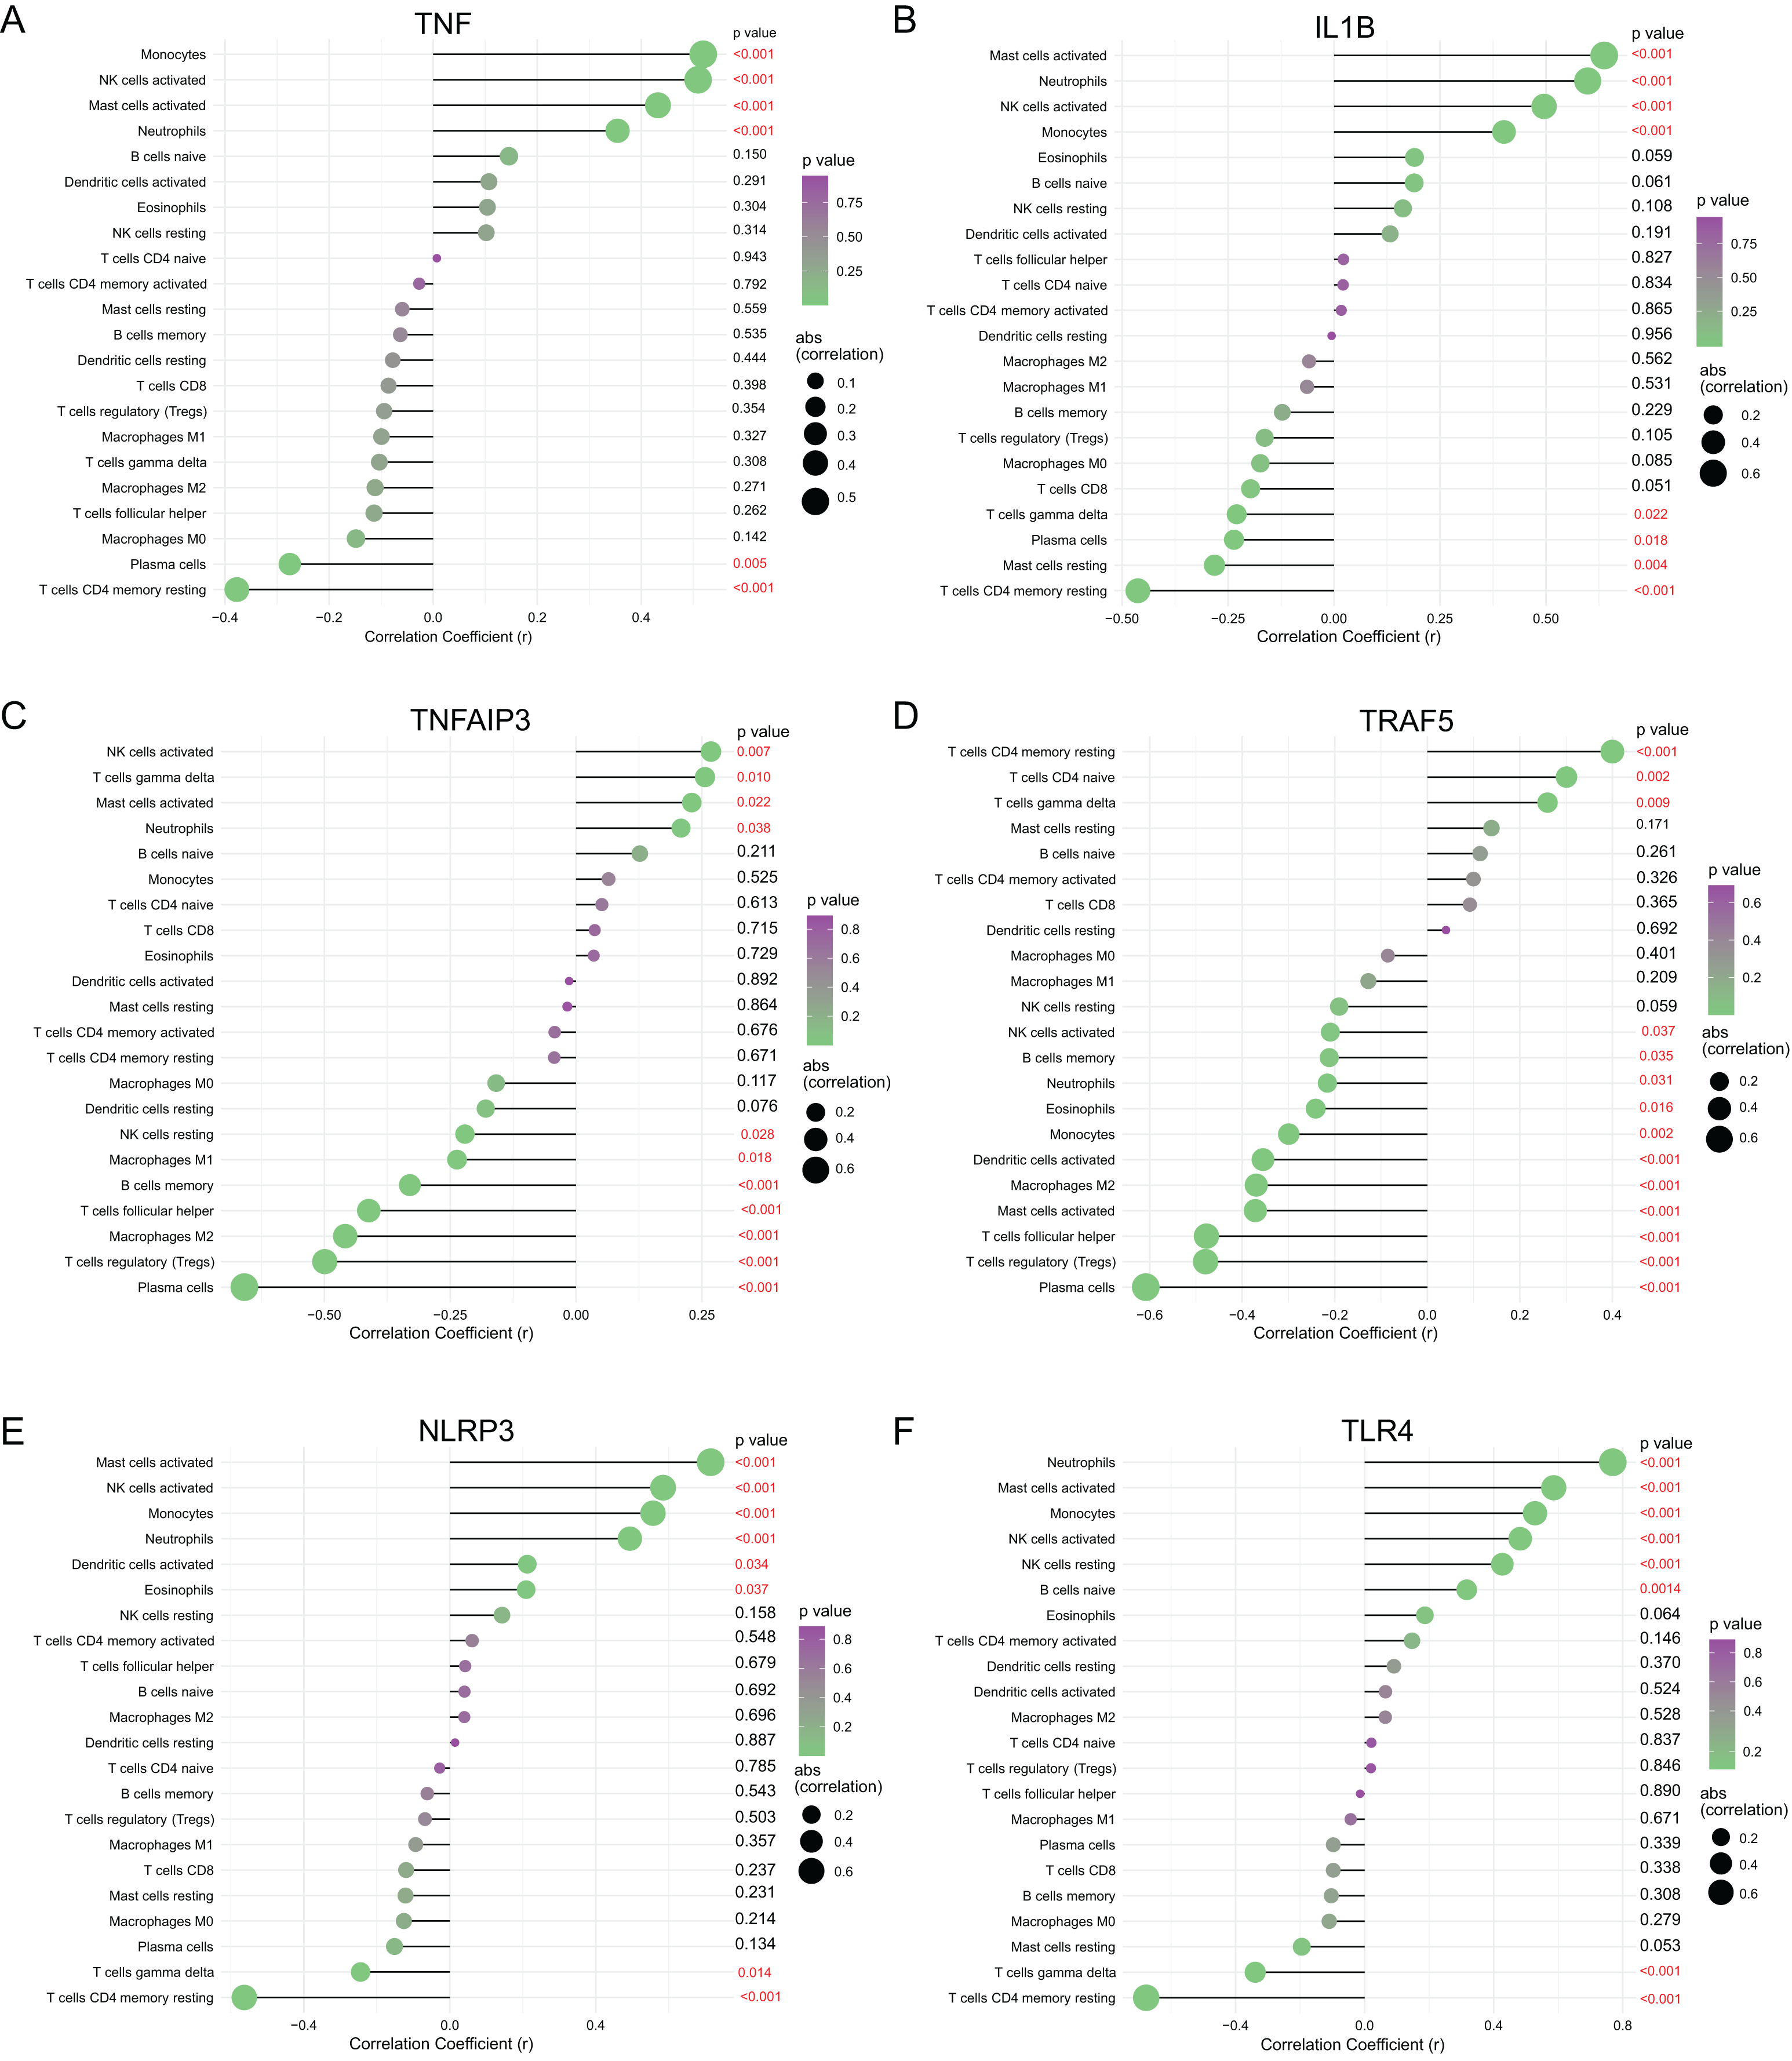
Validation of diagnostic value and expression of hub NRDEGs
The diagnostic power of six top NRDEGs was confirmed in GSE97320 (including three peripheral blood sample from three AMI patients and three healthy samples) and GSE61144 datasets (10 normal and seven AMI samples). On the whole, our validation analysis of GSE97320 and GSE61144 basically conformed to GSE66360. As shown in Figs. 7A–7F, except for IL1B and TNFAIP3, the AUC values of all the other NRDEGs, including TNF, TRAF5, NLRP3 and TLR4, were >0.7, suggesting that these four hub NRDEGs might be biomarkers for diagnosing AMI. Furthermore, expression of six NRDEGs was analyzed (Fig. 7G). Based on our results, the expression trends of six NRDEGs were consistent with those in GSE66360, including TNF, IL1B, TNFAIP3, TRAF5, NLRP3 and TLR4. Besides, in the validation dataset of GSE61144, six NRDEGs were in accordance with the tendency in GSE66360 (Figs. 6H–6N).
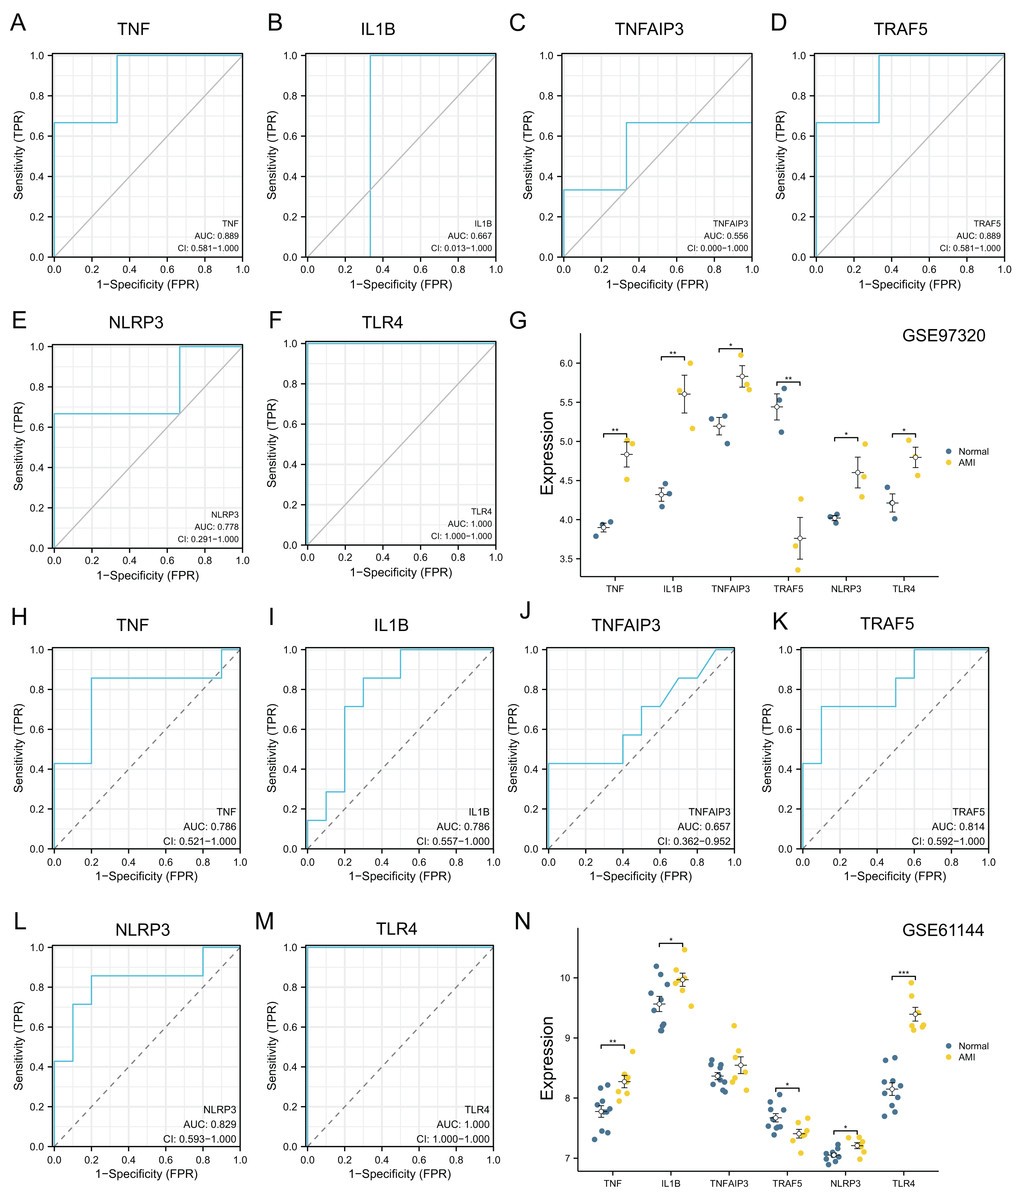
Figure 7: External dataset validation of six hub NRDEGs in the GSE97320 dataset and GSE61144.
Validation of the diagnostic value of (A) TNF, (B) IL1B, (C) TNFAIP3, (D) TRAF5, (E) NLRP3 and (F) TLR4 in the GSE97320 dataset. (G) Expression of six hub NRDEGs in GSE97320 datasets; Validation of the diagnostic value of (H) TNF, (I) IL1B, (J) TNFAIP3, (K) TRAF5, (L) NLRP3 and (M) TLR4 in the GSE61144 dataset. (N) Expression of six hub NRDEGs in GSE61144 datasets. Asterisks: * represents p < 0.05, ** represents p < 0.001, *** represents p < 0.0001.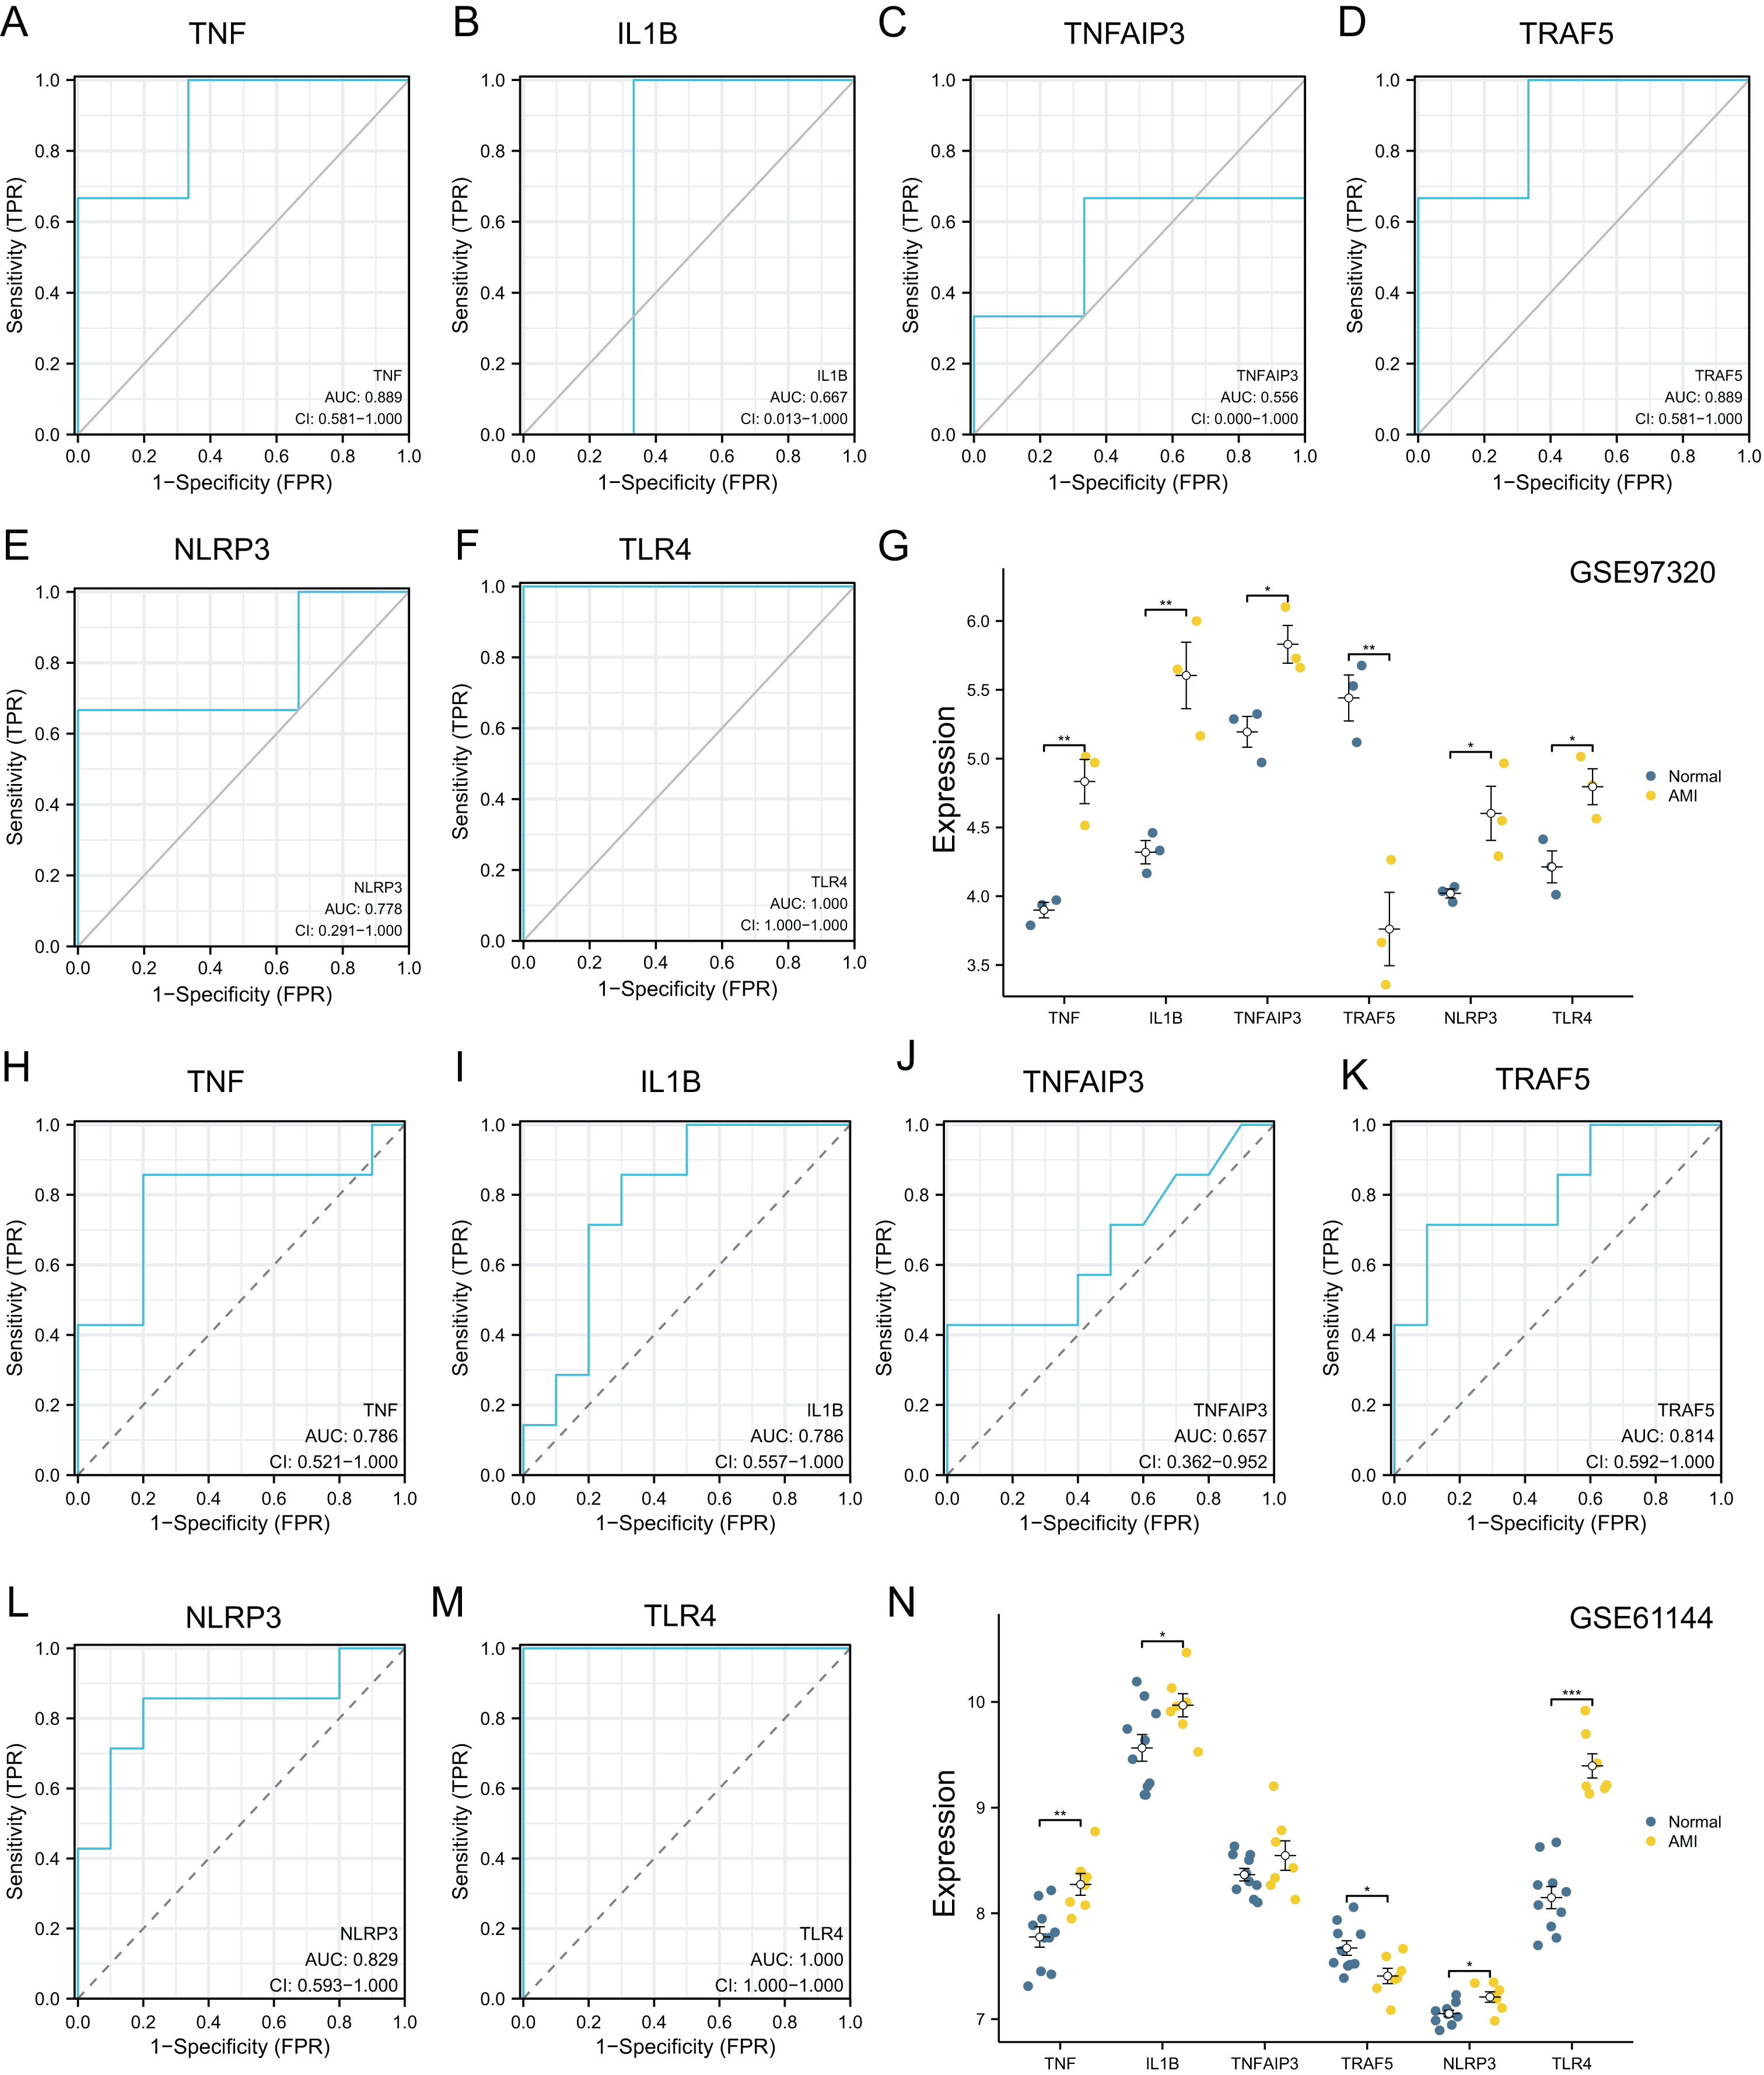
RT-qPCR validation of necroptosis-related genes based on the AC16 hypoxia model
RT-qPCR was carried out to quantify the expression of those top NRDEGs within H9C2 cells exposed to 24-h hypoxia, aiming to verify the bioinformatic analysis results (Fig. 8). TNF (p < 0.001), IL1B (p = 0.01), TNFAIP3 (p < 0.001), NLRP3 (p < 0.001) and TLR4 (p = 0.003) expression increased, whereas TRAF5 (p = 0.02) expression declined within hypoxia-exposed cells relative to controls. All results were consistent with the predicted results.
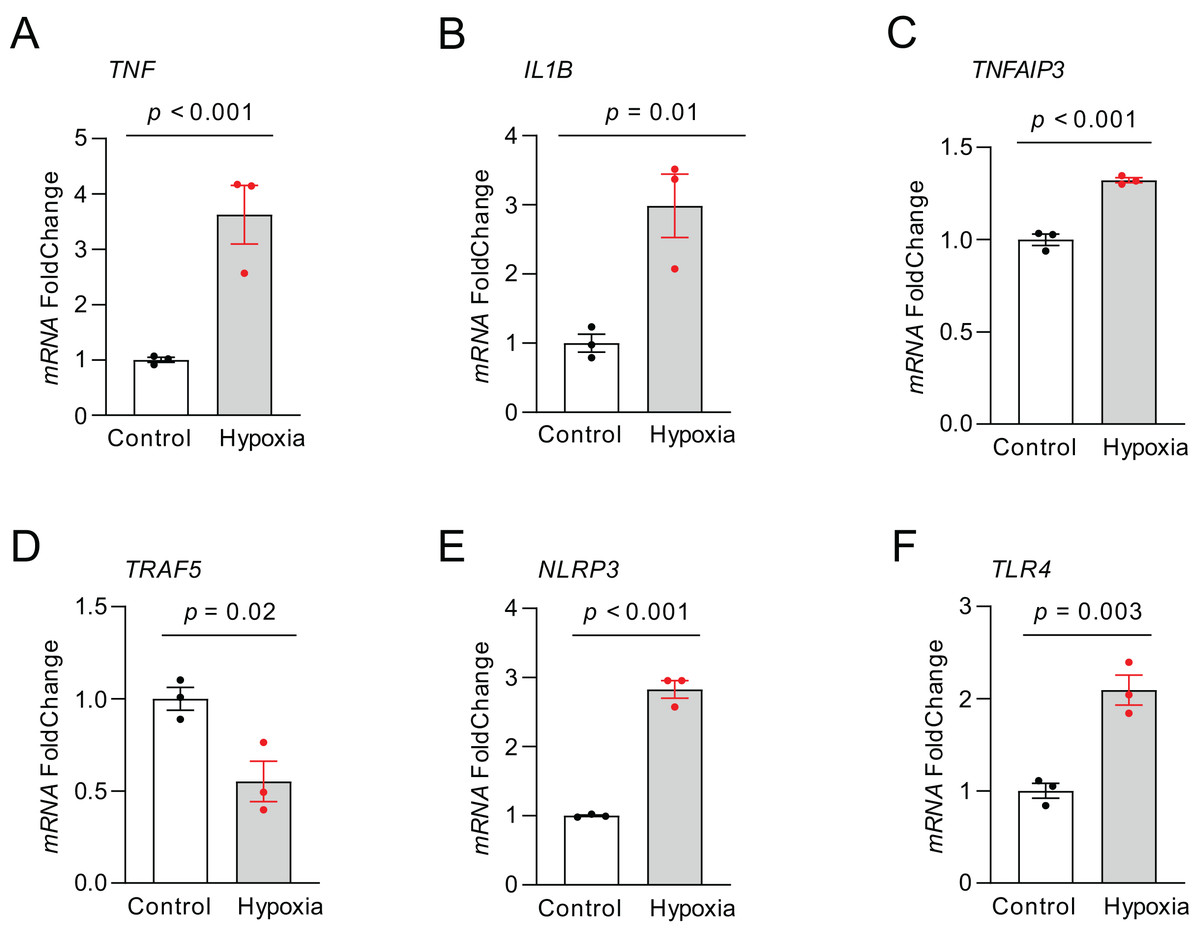
Figure 8: The relative expression of differentially expressed top NRDEGs in H9C2.
(A) TNF; (B) IL1B; (C) TNFAIP3; (D) TRAF5; (E) NLRP3; (F) TLR4. The data were presented as the mean ± standard error of measurement from at least three experiments. The control group respects normal H9C2.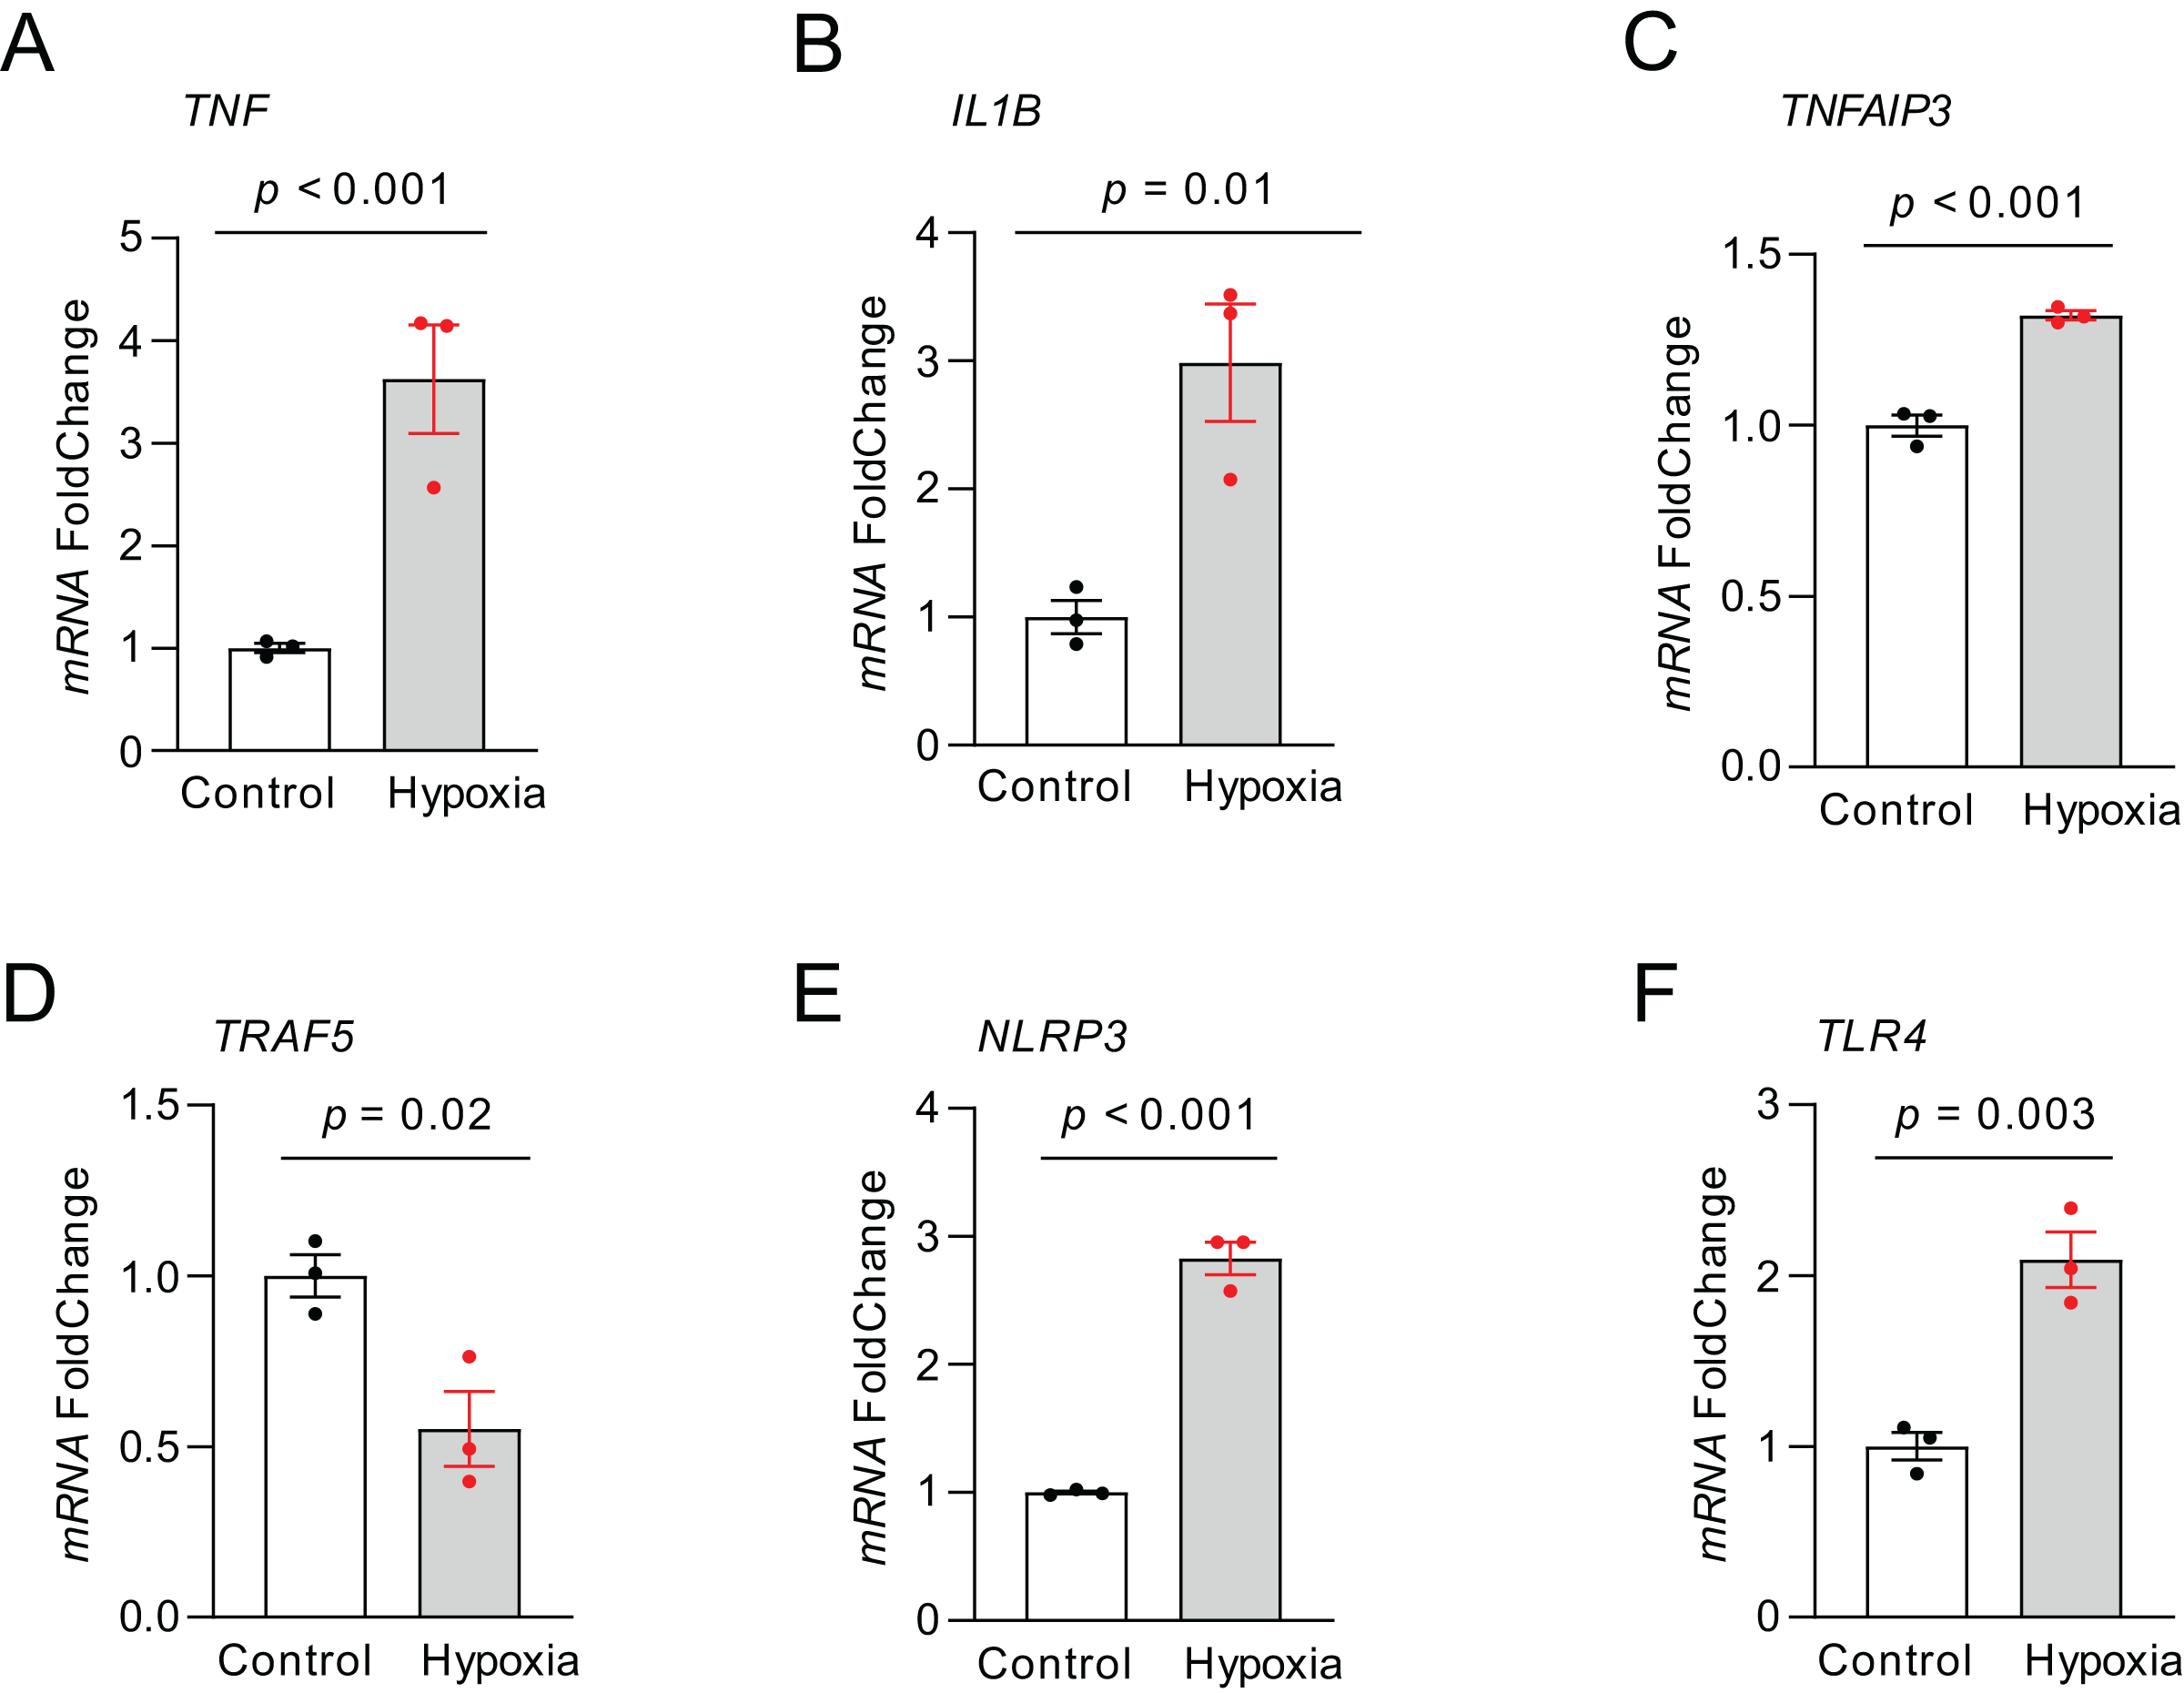
Discussion
Necroptosis has an important effect on the pathophysiology of cardiovascular diseases (CVDs), such as atherosclerosis (Karunakaran et al., 2016), ischemic/reperfusion injury of the heart (Maslov et al., 2022) and myocardial infarction (Piamsiri et al., 2021). Necroptosis regulated through the autophagy flux dysfunction may induce cardiomyocyte death, unfavorable ventricular remodeling and post-MI progressive heart failure (Zhang et al., 2020).
Here, 15 NRDEGs in AMI, including IL1B, PYGL, NLRP3, TLR4, TNF, TNFAIP3, CYBB, TRAF5, BCL2, GLUL, USP21, XIAP, FADD, PARP1 and RNF31, were identified using integrated bioinformatics analysis. Furthermore, based on these 15 NRDEGs, functional analysis was performed, and it was discovered that these NRDEGs were mainly involved in inflammation response and immune defense. According to KEGG pathway enrichment, NRDEGs were primarily related to necroptosis (Gong et al., 2019), NF−kappa B and NOD−like receptor pathways, which were all the immune inflammatory response pathways (Arbibe et al., 2000; Caruso et al., 2014). Research has suggested that nuclear factor E2-related factor-2 (Nrf2) shows negative regulation on NOD-like receptor family pyrin domain-containing 3 (NLRP3) inflammasome during necroptosis (Chen et al., 2022). Notably, the analysis results demonstrated the enrichment of necroptosis pathway in functional annotation, suggesting the role of necroptosis in AMI pathogenesis. NF-κB, a heterodimeric transcription factor, has a critical effect on immune responses, inflammation, infections, oncogenesis as well as cell death (Karin & Lin, 2002; Siebenlist, Franzoso & Brown, 1994). In this study, we examined the above feature genes along with their associated pathways, which shed more lights on the AMI mechanisms. These activated pathways may together contribute to the pathogenesis of AMI development. These findings support that it is a promising direction to regulate necroptosis as the candidate anti-AMI therapeutic target.
For further investigating the hub NRDEGs in AMI, we constructed a PPI network and performed ROC analysis to identify six top NRDEGs, including TNF, IL1B, TNFAIP3, TRAF5, NLRP3 and TLR4 (AUC > 0.7). TNFα accounts for a key pro-inflammatory factor, and its mediated TNFR1 (TNF receptor 1) activation can promote necroptosis by the activation of RIPK1 kinase activity (Shan et al., 2018). Previous study has revealed that MI is related to the coordinated activation of various cytokines and adhesion molecules; notably, two essential cytokines, TNF-α and IL-1B, can activate NF-κB, while NF-κB can block the activation of inflammatory genes and reduce MI extent post-reperfusion (Frangogiannis, Smith & Entman, 2002; Morishita et al., 1997). Interleukin-1B (IL-1B), one of the cytokines, has a vital role in regulating inflammatory response and promoting further proinflammatory cytokine biosynthesis, which thus activates profibrotic pathways and promotes the apoptosis of cardiomyocytes (Hwang et al., 2001). TNFAIP3 is an important factor negatively regulating NF-kappaB pathway, which also suppresses the generation of pro-necroptotic RIPK1-RIPK3 complexes containing phosphorylated RIPK3 (Onizawa et al., 2015; Voelkl et al., 2018). TNF receptor-associated factor 5 (TRAF5) can improve the 5-FU-induced necroptosis of colon cancer cells (Wu et al., 2021). In our study, TRAF5 was down-regulated in AMI samples, suggesting that it potentially suppressed necroptosis in AMI. TRAF5, which interacts with the lymphotoxin β receptor (LTβR) to mediate NF-κB activation (Nakano et al., 1996), protects against myocardial ischemia reperfusion injury via the activation of the AKT signaling pathway (Xu et al., 2020). NLRP3 inflammasome represents the cytosolic multiprotein complex, and necroptosis effectors contribute to its activation (Huang, Xu & Zhou, 2021). Together, hub genes are related to AMI progression and immune inflammation responses, and thus they may be the candidate anti-AMI therapeutic targets. Consequently, this work further investigated immune cell infiltration and their correlations with NRDEGs in AMI.
Increasing evidence has indicated that immunity-related cell types, including M2 macrophages, eosinophils, mast cells and cytokines, are related to different post-MI pathophysiological processes (Xu et al., 2019). Liu et al. (2018) revealed that NLRP3 modulated the M2 polarization of macrophages by up-regulating IL-4. TNF is the regulatory factor for IL-4 generation and protease activated receptor (PAR) level, and is also linked to mast cell-associated inflammation (Zhang, Yang & He, 2010). The assembly of NLRP3 inflammasome can activate caspase-1, thus promoting inflammatory cytokine (IL-1β, IL-18) maturation and production, and inflammatory cell death (Sharma & Kanneganti, 2021). We also detected that the immune cells were dramatically different in their levels in AMI vs. normal groups, conforming to prior results (Ong et al., 2018; Wu et al., 2022; Xie et al., 2021; Zheng et al., 2022). Numerous diverse factors are involved in the inflammatory response in AMI, including neutrophils, monocytes, macrophages, B lymphocytes and CD8+ T cells (Ong et al., 2018). Notably, Zheng et al. (2022) suggested that the proportions of CD8 + T cells, gamma delta (γδ) T cells, and resting mast cells were remarkably lower, while those of neutrophils and M0 macrophages were higher in AMI group than those in the control group. Some studies confirm that cDC1- and CD8+ leukocyte-dependent anti-tumor immunity can be enhanced through activating RIPK1 and RIPK3, the necroptotic signaling kinases (Snyder et al., 2019). Intriguingly, 13 immune cell types showed significant differences in AMI vs. control groups, including monocytes, T cells CD4 memory resting, T cells CD8, monocytes, neutrophils and NK cells. Although there are increasing studies revealed the correction of immune cell with AMI, and immune infiltration (Wu et al., 2022; Xie et al., 2021), little research shows the potential association between necrosis related genes and immune infiltration in the disease. Therefore, the correlations between the top six NRDEGs and 22 immune infiltrating cells were analyzed in our study. Therefore, neutrophils, mast cells activated, monocytes and NK cells activated showed strong correlations with the top six NRDEGs. Neutrophils represents the primary immune cells infiltrating infarcted myocardium, which are accelerated and accentuated by reperfusion (Prabhu & Frangogiannis, 2016; Yan et al., 2013). Previous study has revealed that, the extended existence of M1 macrophages can prolong pro-inflammatory phase while expanding infarcted area, eventually postponing M2 macrophages-mediated reparative phase as well as scar formation (Ong et al., 2018). These results all conclude that immune cells have critical effects on AMI occurrence. Thus, these novel hub NEDEGs, which were related to infiltrating degrees of immune cells, might be the candidate anti-AMI therapeutic targets. Additionally, we also validated our analysis results by using an external dataset and experiments. Consistently, TNF, IL1B, TNFAIP3, NLRP3 and TLR4 expression elevated, while TRAF5 expression decreased in the AMI group. In general, the present work is the first to explore necroptosis-related genes and those related to various immune cells by multi-bioinformatics analysis and experimental verification. Our results first illustrate that immune cells co-exist with necroptosis in AMI. Due to the limitation, experiments should be further performed to provide direct evidence supporting necroptosis and underlying mechanisms in AMI.
Conclusion
This study provided and validated the new credible molecular biomarkers for diagnosing AMI in necroptosis. TNF, IL1B, TNFAIP3, TRAF5, NLRP3 and TLR4 genes were identified and validated. Immune cells, including M2 macrophages, neutrophils, and monocytes, were possibly associated with AMI occurrence and development. The NRDEGs detected in this work contribute to exploring the mechanisms related to AMI pathophysiology, which can be the new therapeutic targets in medical interventions.