

Flavonoid biosynthesis controls fiber color in naturally colored cotton
- Published
- Accepted
- Received
- Academic Editor
- Yuriy Orlov
- Subject Areas
- Bioinformatics, Genetics, Genomics, Plant Science
- Keywords
- Fiber color, Naturally colored cotton, Flavonoid biosynthesis, Fiber quality, Transcriptome analysis, RNA interference
- Copyright
- © 2018 Liu et al.
- Licence
- This is an open access article distributed under the terms of the Creative Commons Attribution License, which permits unrestricted use, distribution, reproduction and adaptation in any medium and for any purpose provided that it is properly attributed. For attribution, the original author(s), title, publication source (PeerJ) and either DOI or URL of the article must be cited.
- Cite this article
- 2018. Flavonoid biosynthesis controls fiber color in naturally colored cotton. PeerJ 6:e4537 https://doi.org/10.7717/peerj.4537
Abstract
The existence of only natural brown and green cotton fibers (BCF and GCF, respectively), as well as poor fiber quality, limits the use of naturally colored cotton (Gossypium hirsutum L.). A better understanding of fiber pigment regulation is needed to surmount these obstacles. In this work, transcriptome analysis and quantitative reverse transcription PCR revealed that 13 and 9 phenylpropanoid (metabolic) pathway genes were enriched during pigment synthesis, while the differential expression of phenylpropanoid (metabolic) and flavonoid metabolic pathway genes occurred among BCF, GCF, and white cotton fibers (WCF). Silencing the chalcone flavanone isomerase gene in a BCF line resulted in three fiber phenotypes among offspring of the RNAi lines: BCF, almost WCF, and GCF. The lines with almost WCF suppressed chalcone flavanone isomerase, while the lines with GCF highly expressed the glucosyl transferase (3GT) gene. Overexpression of the Gh3GT or Arabidopsis thaliana 3GT gene in BCF lines resulted in GCF. Additionally, the phenylpropanoid and flavonoid metabolites of BCF and GCF were significantly higher than those of WCF as assessed by a metabolomics analysis. Thus, the flavonoid biosynthetic pathway controls both brown and green pigmentation processes. Like natural colored fibers, the transgenic colored fibers were weaker and shorter than WCF. This study shows the potential of flavonoid pathway modifications to alter cotton fibers’ color and quality.
Introduction
Cotton is the largest natural textile material, which is accounting for a large proportion of economy. The increasing use of naturally colored cotton reflects the consumers’ desire to use natural products. Based on fiber color, there are two basic types of cotton, namely brown and green (Du, Zhang & Yuan, 1997). However, the fiber quality of naturally colored cotton is poor, which largely limits the use and development of colored cotton. Lots of effects have been applied to improve the quality of naturally colored cotton, while the results are not good as expected. Traditional breeding methods cannot produce new cultivars of naturally colored cotton because of the lack of germplasm for different colored cottons. Therefore, biotechnology for producing new cultivars of naturally colored cotton is required to address this issue.
The cotton fiber color has been studied in many studies. Previous studies show, that the pigmentations of brown cotton fibers (BCF) and green cotton fibers (GCF) might be affected by the flavonoid biosynthetic pathway (Zhang et al., 2011; Li et al., 2012; Hua et al., 2007; Xiao et al., 2007; Li et al., 2013; Feng et al., 2013; Tan et al., 2013; Xiao et al., 2014). Flavonoids form the largest class of naturally occurring secondary metabolites, with the majority being colored. They are the main components of plant pigments (Winkel-Shirley, 2001; Grayer & Harborne, 1994; Forkmann & Martens, 2001) and have been studied in many plants, such as Arabidopsis thaliana and Petunia hybrida (Buer & Muday, 2004). However, the knowledge is limited in the application of the flavonoid biosynthetic pathway to influence cotton fiber pigment development.
The objectives of this study were to characterize the genetic mechanisms regulating pigment formation in colored cotton fibers and explore the possibility of changing the color of cotton through biotechnological techniques. The methods used are RNA Sequencing, metabolome, RNAi and so on. RNA sequencing (RNA-Seq) is a technique with next-generation sequencing (NGS) to evaluate the presence and quantity of RNA in a biological sample, which is the basis and starting point of gene function and structure research in this research. Differentially-expressed genes from different-colored cottons with RNA-Seq were examined. Metabolomics is a bridge between genes and phenotypes, which can provide a new way for functional genomics research to efficiently and rapidly validate large-scale gene functions. Cultivars with transgenes from RNA-Seq and metabolome were used to confirm that the flavonoid biosynthesis genes not only controlled fiber color but also influenced fiber quality.
Materials and Methods
Plant materials
Brown cotton (Gossypium hirsutum L.) cultivars ‘Zong 1282’ and ‘Xincaimian 5’, and their near-isogenic lines with white cotton fibers (WCF) were grown in two experimental fields at Korla (Xinjiang, China) and Danzhou (Hainan, China) using standard agronomic conditions and practices. Ovules and fibers were collected 0 and 12 d post-anthesis (DPA) and stored at −80 °C before use.
RNA sequencing, mapping, and transcript assembly
In total, 12 libraries were sequenced (samples: BCF, GCF, and WCF, numbered 5, 6, and 24, respectively at two time points, 0 and 12 DPA) using the HiSeq 2000 Sequencing System (Illumina, San Diego, CA, USA) at the Genome Center of WuXi App Tec (Shanghai, China). The raw reads were evaluated with software FsatQC (v0.10.1) for quality control and were trimmed with software Trimmomatic (v0.32) by removing adaptors and low-quality reads to generate clean reads. The clean reads were aligned with the Gossypium raimondii genome sequence (G.raimondii_JGI_221_v2.1) (Wang et al., 2012) using the spliced read aligner Tophat (version 2.0.9) with default parameters. The genome index was generated by bowtie (v2.2.4) (Langmead & Salzberg, 2012). The transcripts were reconstructed using Cufflinks (version 2.2.0) that were annotated in Ensemble, and the transcript expression levels were estimated using reads per kilobase per million mapped reads (Kim et al., 2013). To eliminate poorly reconstructed transcripts, alignment artifacts, and background expression, transcripts with a mean coverage below one read per base were removed from the transcriptome. All the mapped reads were count by HTSeq (0.6.0) (Anders, Pyl & Huber, 2015). DESeq (1.18.0) (Anders & Huber, 2010) was used for differential expression analysis and genes with adjusted p-value less than 0.05 were considered as differentially expressed genes (DEGs).
Quantitative reverse transcription PCR (qRT-PCR)
Total RNA was extracted according to a published method involving guanidine thiocyanate (Liu et al., 2006) and RNA samples were treated with Ambio™ DNaseI (Invitrogen, Carlsbad, CA, USA) and reverse transcribed with oligo (dT) primers (Invitrogen, Carlsbad, CA, USA). The qRT-PCR assay was performed using an ABI 7900HT Real-Time PCR System (Applied Biosystems, Foster City, CA, USA) with the QuantiTect SYBR Green PCR kit (Qiagen, Hilden, Germany). The PCR program was as follows: 2 min at 50 °C; 2 min at 95 °C; 40 cycles of 15 s at 95 °C, and 60 s at 60 °C. This was followed by a standard dissociation protocol to ensure that each amplicon was a single product. All data were normalized against UBQ 7 levels (Shi et al., 2006). We performed the qRT-PCR assay in triplicate for each of the three independent samples.
Construct development
An RNA interference (RNAi) construct was generated using the pANDA-35HK vector with CaMV35S promoter and neomycin phosphotransferase II (NPTII) and hygromycin phosphotransferase (HPT) resistance genes to down-regulate the cotton chalcone flavanone isomerase gene GhCHI-1’s expression in BCF (Miki, Itoh & Shimamoto, 2005). A 224-bp GhCHI-1 cDNA fragment was amplified by PCR (primers: 5′-CACCTGATTTTGAGAAGTTCATACGGGTG-3′ and 5′-AGTCAAGGAACCTT- GGCCTGAAATA-3′) to facilitate directional cloning into the Gateway pENTR vector. The recombinant plasmid was digested with restriction enzyme PvuI and directionally inserted into the RNAi pANDA vector using LR Clonase according to the manufacturer’s instructions (Invitrogen, Carlsbad, CA, USA). Overexpression constructs were also produced using the pANDA vector to independently up-regulate the cotton or Arabidopsis glucosyl transferase (3GT) genes’ expression level in BCF. The At3GT and Gh3GT coding sequences with independently introduced using XbaI and EcoRI, and XbaI and SacI, restriction enzyme sites, respectively, and were amplified by PCR (primers: 5′-GCTCTAGAGCATGACCAAACCCTCCGACC-3′ and 5′-GGAATTCCTCAAATAATGTTTACAACTGCATCC-3′, and primers: 5′-GCTCTAGAGC ATGGAAGGCTACAAGAATGCTT-3′ and 5′-CGAGCTCGTCAA- CTTGGTGGTAAGTGTTG-3′, respectively) to facilitate directional cloning into the pANDA vector, which was digested with the same restriction enzymes.
Agrobacterium-mediated transformation of cotton through pistils
Just prior to anthesis, the flowers that were about to open were tied up using string and unopened petals were clamped to avoid cross-pollination. The cotton pistils were sprayed two or three times with a sucrose inoculation solution containing Agrobacterium tumefaciens GV3101 transformed with the pANDA vector, a binary vector carrying the CaMV35S:GhCHI-1 hairpin, CaMV35S:Gh3GT or CaMV35S:At3GT construct in the afternoon of the first day of flowering using a modified pistil drip pollination method (Chen et al., 2010). After spraying Agrobacterium drops, the treated flowers were immediately clamped for 3 d to facilitate Agrobacterium transformation under humid and dark conditions.
Genomic DNA extraction, PCR, and Southern blot analysis
Genomic DNA from the leaves of wild-type and transgenic cotton plants were isolated using a cetyltrimethylammonium bromide method (Paterson, Brubaker & Wendel, 1993). The positive transformants were identified using PCR amplifications of NPTII and HPT with gene-specific primers. The NPTII forward and reverse primer sequences were 5′-AGACAAGTTCCTCTTCGGGC-3′ and 5′-TGAAGATGAACAAAG- CCCTG-3′, respectively. The HPT forward and reverse primer sequences were 5′-AGGGCGAAGAATCTCGTGCT-3′ and 5′-AACCCGCTCGTCTGGCTAAG-3′, respectively. The expected sizes of the NPTII and HPT PCR products were 251 and 309 bp, respectively.
Positive transgenic plants were selected for Southern blot analysis. Genomic DNA (20 µg) was digested with EcoRI, separated on a 0.8% agarose gel, and blotted onto a Hybond-N+ nylon membrane (Amersham Biosciences, Buckinghamshire, UK). We used digoxigenin-labeled NPTII probes for hybridization, which was completed according to the DIG High Prime DNA Labeling and Detection Starter Kit I (Roche, Basel, Switzerland).
The metabolomics cotton fiber analysis
BCF, GCF, and WCF were naturally dried for 30 d in a laboratory room under a constant temperature. Then, 1.0 g of sieved cotton was transferred to a glass vial (100 ml), 50 ml methanol was added and the samples underwent ultrasonic extraction for 1 h. After the hour, the supernatants were removed. Another 50 ml methanol was added, and the procedure was repeated two more times. The supernatants were combined and concentrated under 38 °C using a BUCHI Rotavapor R-100 (BUCHI Labortechnik AG, Flawil, Switzerland) and BUCHI Vacuum Pump V-100 (BUCHI Labortechnik AG). After concentration, the residue was further dissolved in methanol (25 ml). All samples were acquired by the LC-MS system following machine order. First, all chromatographic separations were performed using an ultra-performance liquid chromatography system (Waters, Milford, MA, USA). An ACQUITY UPLC BEH C18 column (100 mm × 2.1 mm, 1.7 μm; Waters) was used for the reversed phase separation. The column oven was maintained at 50 °C. The flow rate was 0.4 ml/min, and the mobile phase consisted of solvent A (water + 0.1% formic acid) and solvent B (acetonitrile + 0.1% formic acid). Gradient elution conditions were set as follows: 0–2 min, 100% phase A; 2–11 min, 0%–100% B; 11–13 min, 100% B; 13–15 min, 0%–100% A. The injection volume for each sample was 10 μl. A high-resolution tandem mass spectrometer SYNAPT G2 XS QTOF (Waters) was used to detect metabolites eluted from the column. The Q-TOF was operated in both positive and negative ion modes. For positive ion mode, the capillary and sampling cone voltages were set at 2 kV and 40 V, respectively. For negative ion mode, the capillary and sampling cone voltages were set at 0.5 k V and 40 V, respectively. The MS data were acquired in Centroid MSE mode. The TOF mass range was from 50 to 1,200 Da, and the scan time was 0.2 s. For the MS/MS detection, all precursors were fragmented using 20–40 eV, and the scan time was 0.2 s. During the acquisition, the LE signal was acquired every 3 s to calibrate the mass accuracy. Furthermore, to evaluate the stability of the LC-MS during the whole acquisition, a quality control sample (pool of all samples) was acquired after every 10 samples.
All data were processed using Progenesis QI (version 2.2) (Waters) for LC-MS data preprocessing. The pathway analyses of metabolites were performed with KEGG database sources (http://www.genome.jp/kegg/) to help identify the pathways that were most significantly altered.
Fiber quality measurement
Fiber qualities, including fiber length (mm), strength (cN/tex), and micronaire were assessed using 15 g fiber for each sample (Green & Culp, 1990) and the Uster HVI 1000 fiber tester (Uster Technologies, Uster, Switzerland). Fiber length was measured as the upper half mean length (mm), and fiber strength was measured using a scale.
Statistical analyses
All statistical analyses were completed using SPSS 13.0 software (SPSS, Chicago, IL, USA). The data were evaluated using a one-way ANOVA. Data were expressed as the means ± standard errors. ‘a’, ‘b’, ‘c’ means with different letters are significantly different at P < 0.05. Significant differences between results were based on P < 0.05, P < 0.01, and P < 0.001.
Results and Discussion
Flavonoid biosynthetic pathway genes are enriched during naturally colored cotton fiber development
The expression profiles of BCF, GCF, and WCF at 0 and 12 DPA were assessed with RNA-Seq. There were 12 RNA-Seq libraries, each with 10.9–17.6 million raw reads separately. The mapped reads in each library were around 6.5–10.5 million reads. The genes with adjusted p-value less than 0.05 from DESeq were considered as differentially-expressed genes (refer to the ‘Materials and Methods’ section, and Table S1). Some genes involved in pigment synthesis were identified (Figs. 1A and 1B). In total, 13 and 9 genes associated with the phenylpropanoid (metabolic) pathway were up-regulated during pigment synthesis according to differential expression analyses in BCF and GCF, respectively (Fig. 1C). The expression levels were validated using qRT-PCR, which generated results that were consistent with the transcriptomics data (Fig. S1 and Table S2). The overall gene expression patterns were similar between GCF and WCF.
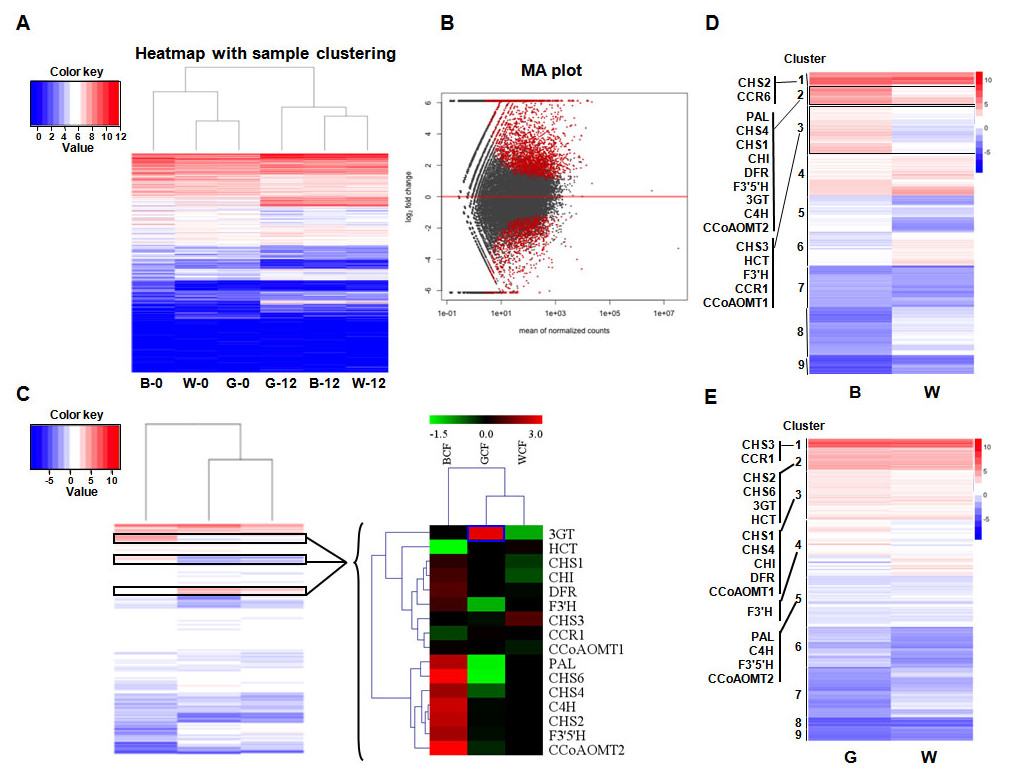
Figure 1: Transcriptome analysis of brown, green, and white fibers at 0 and 12 DPA.
(A) Heatmap with sample clustering showing relative gene expression in six samples. B, brown cotton fiber; W, white cotton fiber; G, green cotton fiber; 0, 0 DPA; 12, 12 DPA. Relative expression levels are presented using a color scale ranging from saturated blue for log ratios ≤0, to saturated red for log ratios ≥12. Each gene is represented by a row of colored boxes. (B) MA plot visualization of the differentially expressed genes. DESeq2 comparisons are presented in the MA plots. We compared brown, green, and white fiber transcripts that were differentially expressed between 0 and 12 DPA. A q-value <0.1 was selected as the cutoff. Each dot represents a gene. Red dots represent significantly differentially expressed genes. (C) Hierarchical clustering analysis of the expression patterns of anthocyanin genes in brown, green, and white fibers. Relative expression levels are log10-transformed and presented using a color scale ranging from saturated blue for log ratios ≤−1.5, to saturated red for log ratios ≥3.0. Each gene is represented by a row of colored boxes. (D) Clustering of the transcripts that are differentially expressed in brown and white fibers between 0 and 12 DPA. Phenylpropanoid (metabolic) pathway genes were grouped into three clusters. (E) Clustering of the transcripts that were differentially expressed in green and white fibers between 0 and 12 DPA. Phenylpropanoid (metabolic) pathway genes were grouped into five clusters.The expression levels of two key lignin biosynthesis enzymes in the phenylpropanoid (metabolic) pathway, HCT and CCR, were low in BCF. In contrast, the 3GT gene was highly expressed in GCF. Genes related to the flavonoid metabolic pathway (Fig. S2 and Table S3), including CHS (CHS1; CHS2; CHS4 and CHS6), CHI, F3′H, F3′5′H, DFR, and 3GT were more highly expressed in BCF than in WCF (Fig. 1C).
In total, 16 genes belonging to the phenylpropanoid (metabolic) pathway that were differentially expressed in BCF and WCF were divided into Clusters 1, 2, or 3 (Fig. 1D and Table S4). A comparison between GCF and WCF indicated that the phenylpropanoid (metabolic) pathway genes were divided into five clusters (Fig. 1E and Table S5).
RNAi-mediated inhibition of GhCHI in a BCF line resulted in three fiber phenotypes
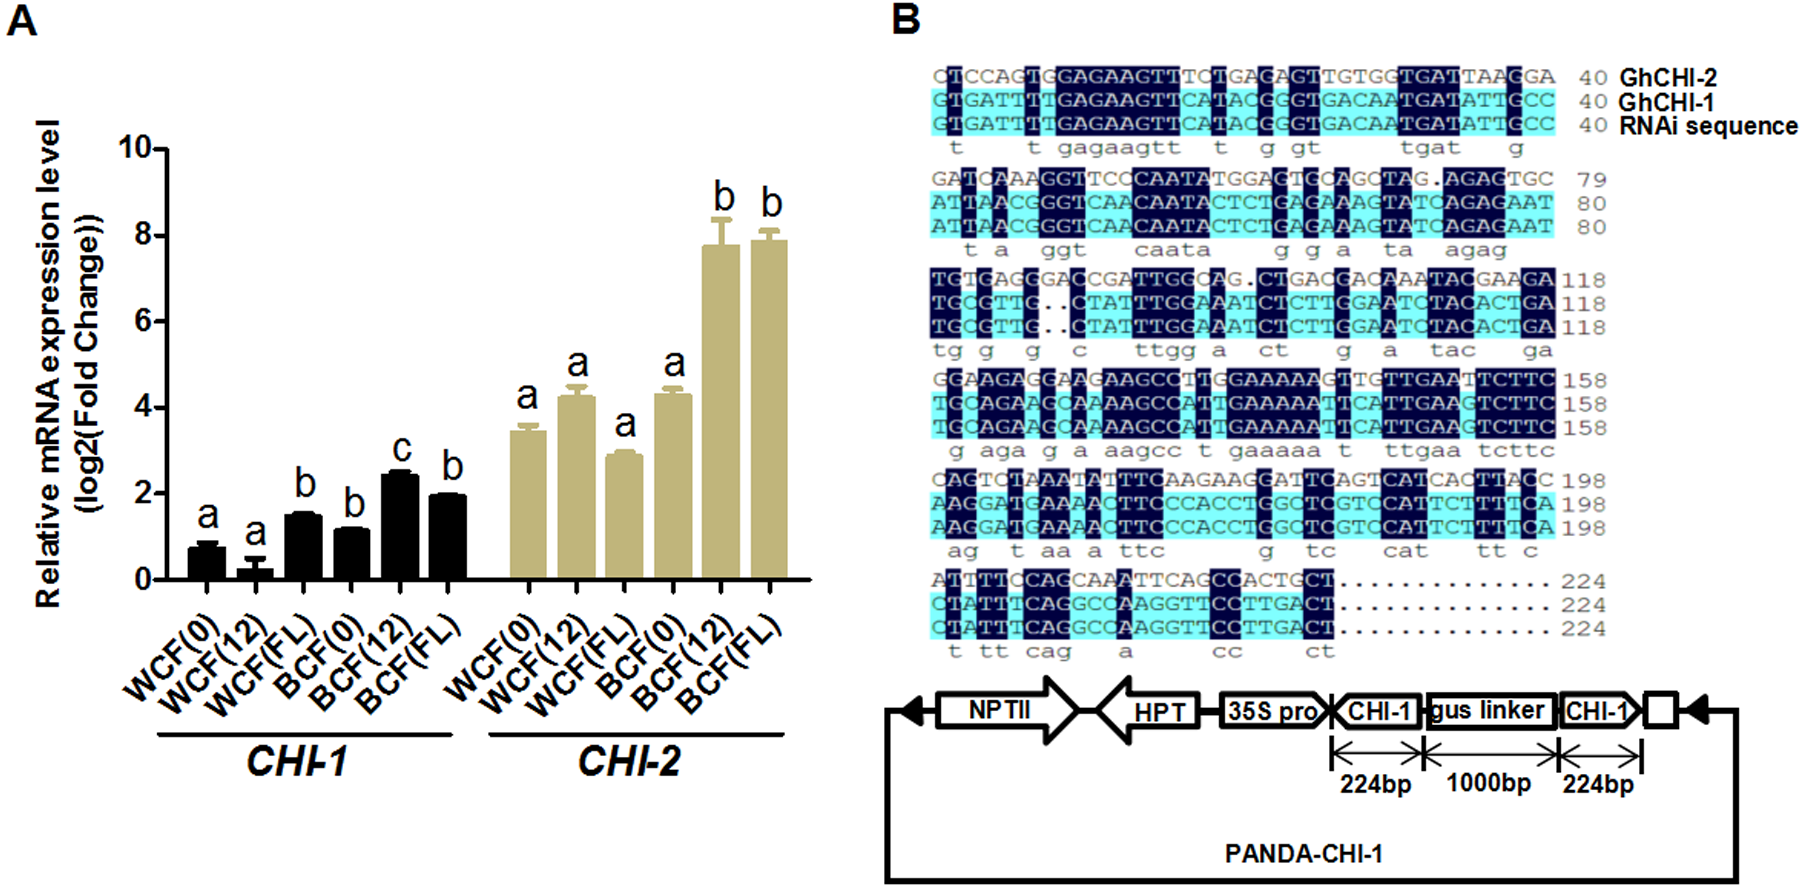
Whether the flavonoid biosynthetic pathway is responsible for the synthesis of brown pigment was examined by conducting RNAi experiments involving CHI, which is the second key gene in this pathway. Whether interfering with key flavonoid pathway genes could affect synthetic fiber pigment development. There are two GhCHI genes in upland cotton, GhCHI-1 (gi|121755800|) and GhCHI-2 (gi|295687228|), which are 29.26% identical at the amino acid level and 37.53% identical at the nucleic acid level (Fig. S3). They were expressed more highly at 12 DPA than at 0 DPA in BCF (Fig. 2A). A 224-bp fragment from the GhCHI-1 gene’s coding region was inserted into the RNAi plant expression vector pANDA-35SHK to generate pANDA-GhCHI-1 (Fig. 2B). Approximately 3,000 brown cotton plant (‘Zong 1282’; BCF) flowers were completed by using Agrobacterium-mediated transformation. Fibers of the original cotton cultivars did not undergo color changes, and they continued to grow after the harvest. We isolated four T1transgenic plants (transgenic cotton #1–4) from ∼3,000 originally transformed bolls, in which the fibers changed from brown to nearly white (Fig. 3A). These transgenic plants were analyzed by PCR amplifying the NPTII and HPT genes (Fig. 4A and Fig. S4). Southern blot analysis of T1 transgenic cotton #1 using an NPTII-specific probe confirmed the presence of three copies of the gene (Fig. 4B).
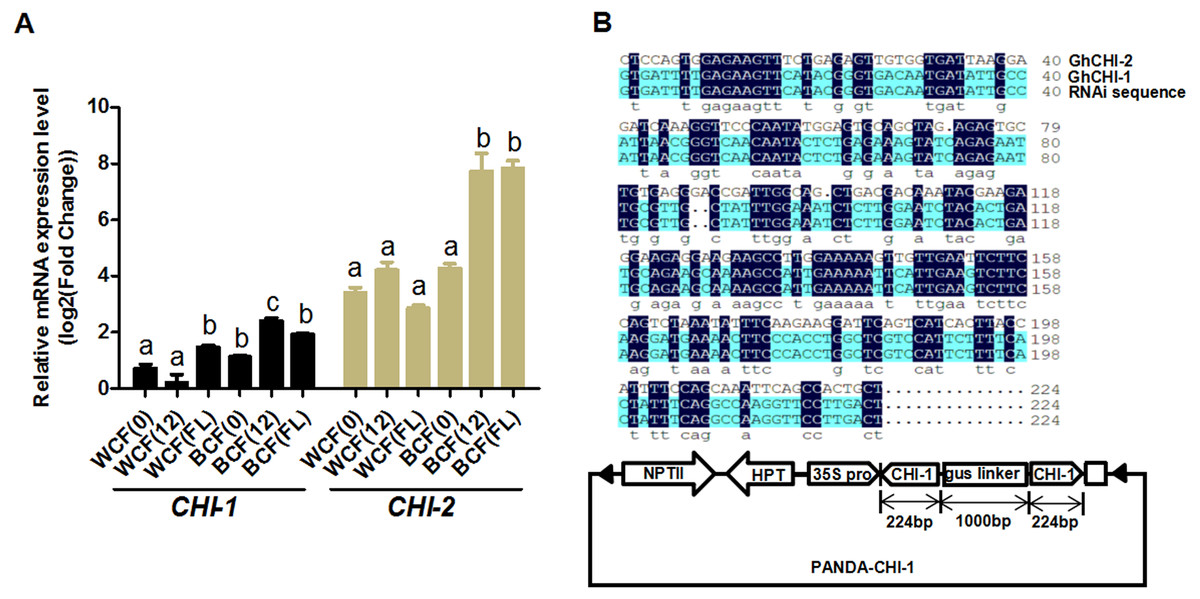
Figure 2: Analysis of GhCHI-1 and GhCHI-2 gene expression in brown cotton.
(A) Expression analysis of GhCHI-1 and GhCHI-2 in brown cotton. 0, 0 DPA; 12, 12 DPA; FL, flower. Results are expressed as the means ± standard errors (n = 3). (B) Comparison of DNA sequences of GhCHI-1, GhCHI-2, and RNAi expression vector. The 224-bp GhCHI-1 coding region was inserted into pANDA-35SHK to generate pANDA- GhCHI-1.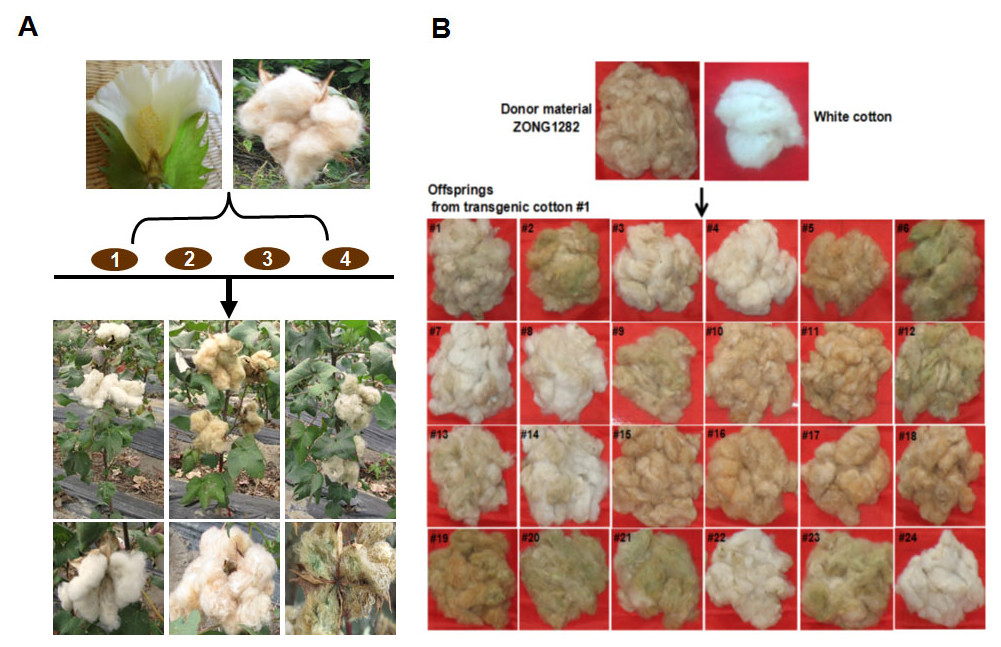
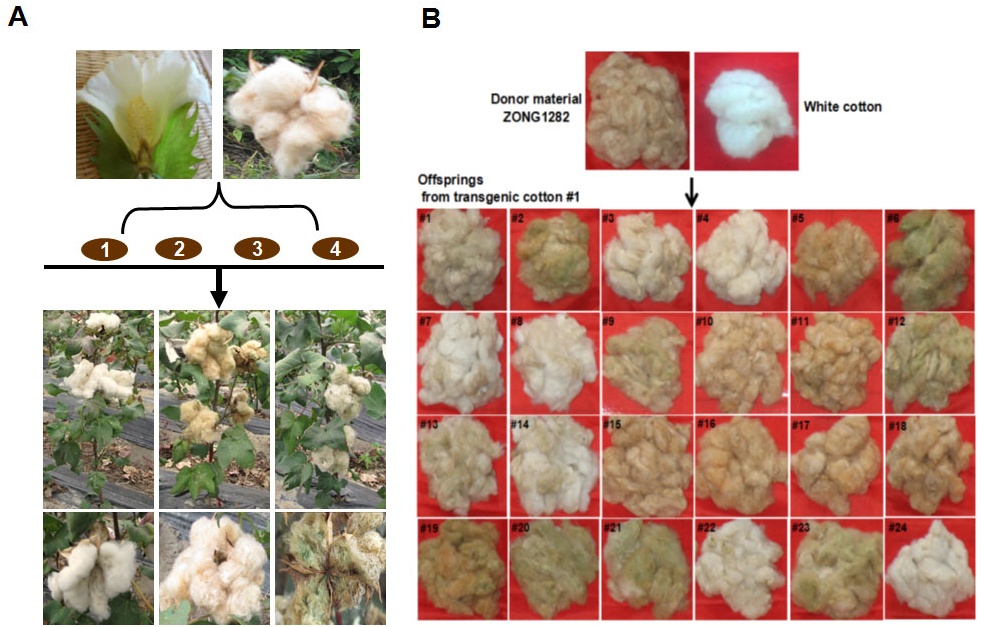
Figure 3: Agrobacterium-mediated transformation of brown cotton for RNAi-mediated inhibition of GhCHI.
(A) Agrobacterium-mediated transformation of brown cotton (‘Zong 1282’). There were three main fiber color phenotypes in the T1 progeny of transgenic cotton. (B) Fiber color phenotypic analysis of 24 transgenic cotton #1 T1 progeny. Photo credit: Hai-Feng Liu.
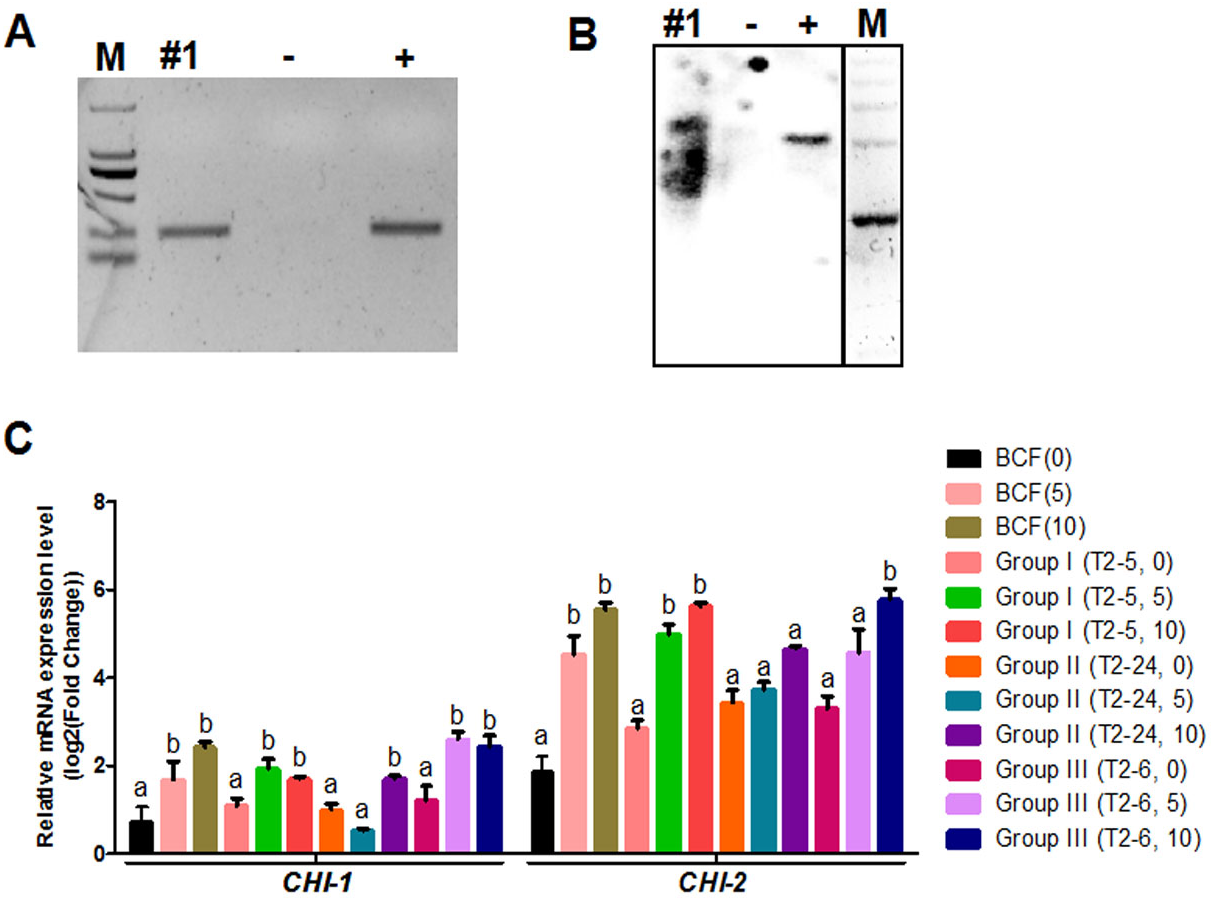
Figure 4: Identification of transgenic cotton and analysis of GhCHI-1 and GhCHI-2 gene expression.
(A and B) PCR and Southern blot analysis of transgenic cotton #1 using primers specific for NPTII. M, DNA marker; +, pANDA vector positive control; −, non-transgenic cotton DNA negative control. (C) GhCHI-1 and GhCHI-2 expression analyses in T1 progeny of transgenic cotton #1. Results are expressed as the means ± standard errors (n = 3). ‘a’, ‘b’ , ‘c’ means with different letters are significantly different at P < 0.05 .The three main fiber color phenotypes were observed in the T1 progeny (24 plants) of transgenic cotton #1 (cotton #2–4 expressed the same phenotype; Fig. S5) The T1 progeny plants were analyzed by PCR amplifying the NPTII gene (Fig. S6) and were categorized into three groups: Group I, unchanged BCF (T2–5, –10, –11, –15, –16, –17, –18, and –19); Group II, nearly WCF (T2–1, –3, –4, –7, –8, –13, –14, –22, and –24); and Group III, dark GCF (T2–2, –6, –9, –12, –20, –21, and –23) (Fig. 3B).
Expression analyses of 0-, 5-, and 10-DPA fibers from the transgenic plants of Groups I (T2–5), II (T2–24), and III (T2–6) revealed that GhCHI-1 was suppressed in Group II at 5- and 10-DPA, but it was only significantly reduced at 10-DPA in Group I. At 5-DPA, the GhCHI-1 expression level in Group I and Group III plants was higher than that in Group II plants. Additionally, the GhCHI-1 expression level in Group I and Group III plants decreased from 5- to 10-DPA, but the GhCHI-2 expression level was not affected. Only at 10-DPA was the GhCHI-2 expression level in Group II plants was lower than in the BCF plants (Fig. 4C). However, GhCHI-1 and GhCHI-2 represent two copies of the GhCHI gene, with GhCHI-2 being functionally redundant.
Formation of green and brown pigments is controlled by the flavonoid biosynthetic pathway
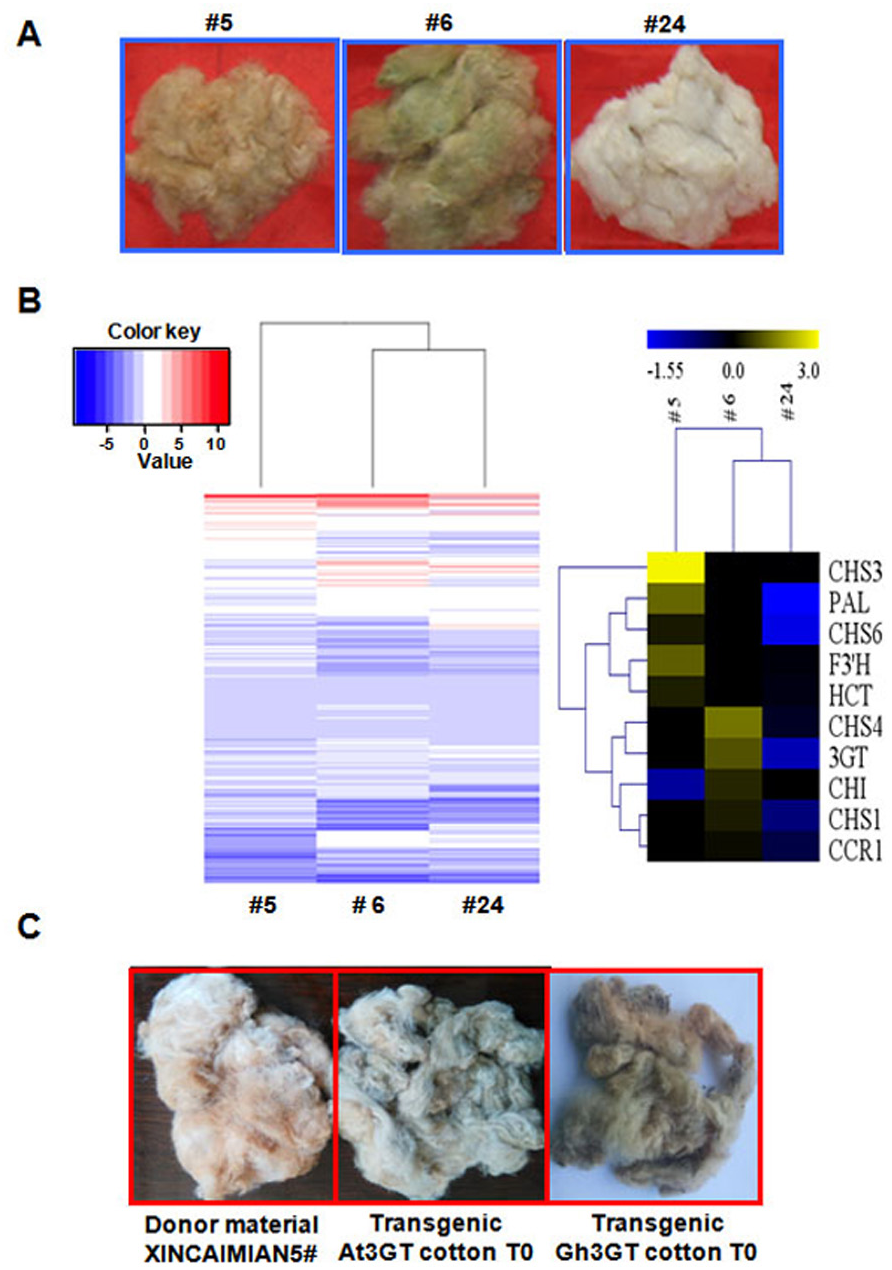
The differences in flavonoid biosynthesis existed were examined in the progeny of the transgenic plants in Groups I–III. The transcriptomes of fibers at 0- and 12-DPA were compared among Groups I (T2–5), II (T2–24), and III (T2–6) (Fig. 5A). The results were consistent with those described earlier. The differentially expressed GCF and WCF genes were clustered together. Seven differentially expressed genes were part of the phenylpropanoid (metabolic) pathway, including five genes involved in the flavonoid biosynthetic pathway. The level of gene expression in the flavonoid pathway was suppressed in the RNAi plants compared with the wild-type plants (Fig. 1C). Gh3GT was also still highly expressed in Group III (T2–6) GhCHI-1 RNAi plants with green fibers (Fig. 5B and Tables S6 and S7).
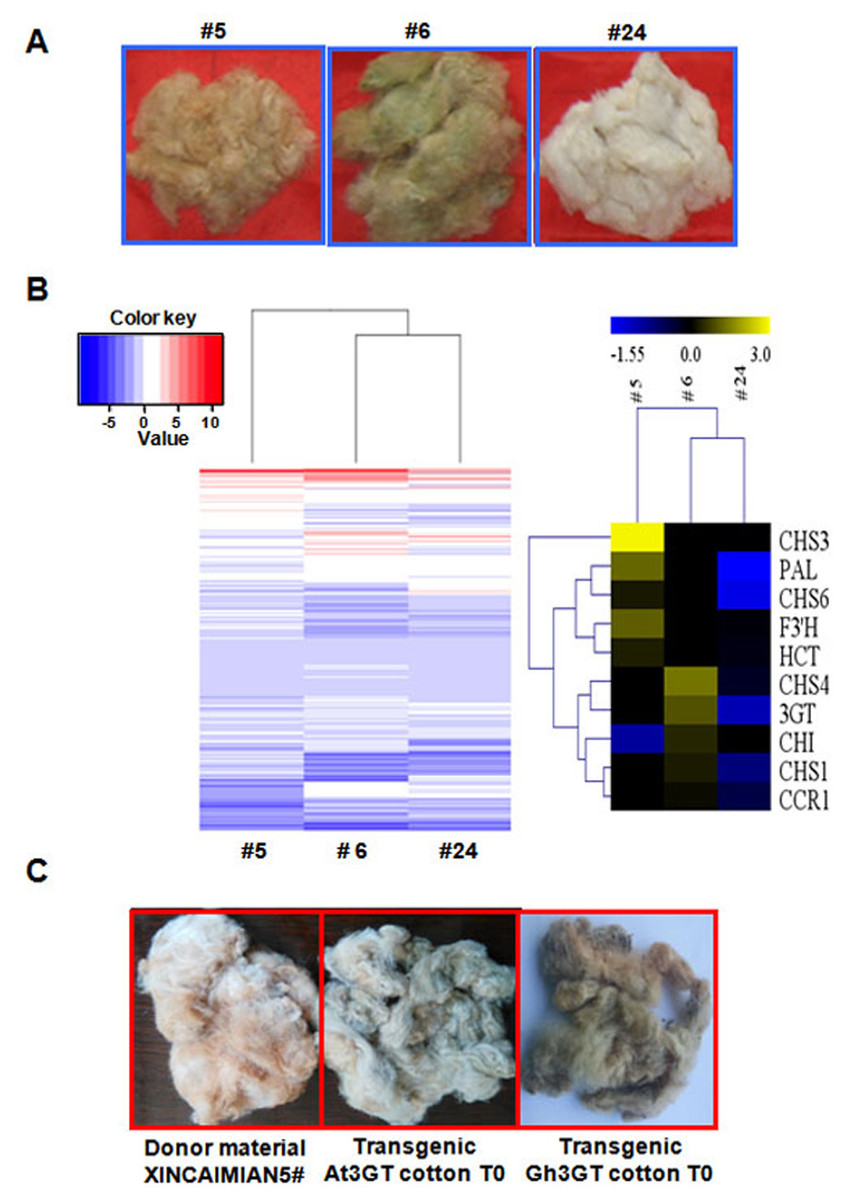
Figure 5: Transcriptome analysis of T1 progenies (#5, #6, and #24) originated from T0 transgenic cotton plant #1.
(A) Three main fiber color phenotypes (#5, #6, and #24 corresponding to brown, dark green, and white, respectively). (B) Hierarchical clustering analysis of the expression patterns of anthocyanin genes in samples #5, #6, and #24. Relative expression levels were lg-transformed and presented using a color scale ranging from saturated blue for log ratios ≤−1.55, to saturated red for log ratios ≥3.0. Each gene is represented by a row of colored boxes. (C) Fiber color phenotypes of transgenic offspring overexpressing Gh 3GT and At3GT. The transgene was originated from ‘Xincaimian 5’ cotton. Photo credit: Hai-Feng Liu.Because Gh3GT is highly expressed in GCF, whether Gh3GT regulates pigment formation in GCF was examined. Two vectors were used to independently overexpress Gh3GT and At3GT (At5g17050) in ‘Xincaimian 5’ cotton (dark BCF). The overexpression of the Gh3GT gene resulted in GCF (Fig. 5C). The seedlings of the T1 generation of these transgenic plants were analyzed by PCR, amplifying the NPTII and (or) HPT genes (Fig. S4). The synthesis of the green pigment may result from the flavonoid biosynthetic pathway involving the 3GT enzyme. Subsequently, the BCF and GCF phenotypes, which are controlled by the flavonoid biosynthetic pathway, were confirmed using metabolomics to analyze BCF, GCF, and WCF (Table S8).
Fiber quality correlated negatively with pigmentation in naturally colored cotton
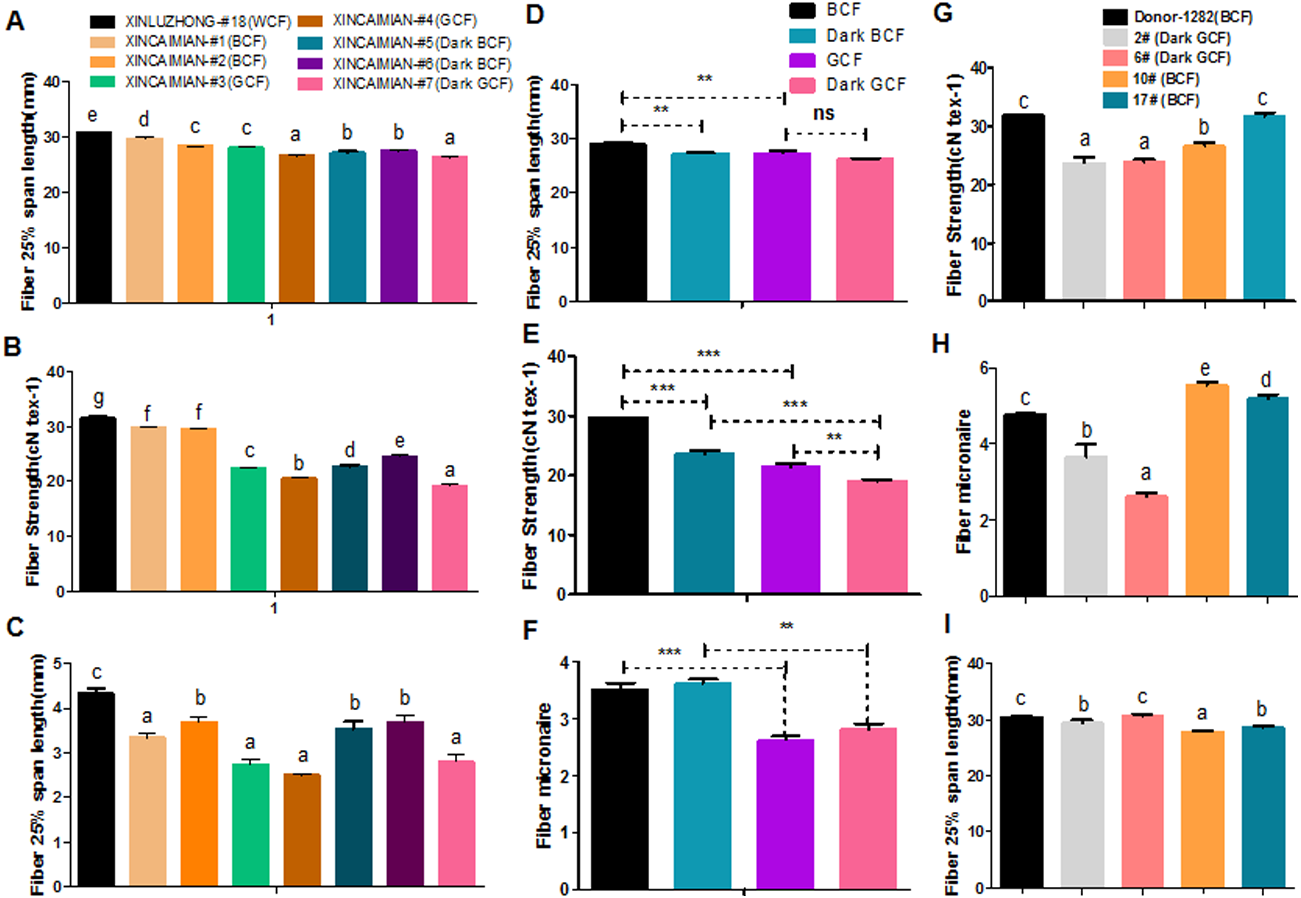
Fiber quality and pigment color appear to be negatively correlated in naturally colored cotton (Upland cotton background) (Hua et al., 2007; Tan et al., 2013; Tu et al., 2014; Gong et al., 2014). For example, characteristics such as fiber length, micronaire, and fiber strength were lower in wild-type BCF and GCF than in WCF (Figs. 6A–6C). Fiber length and strength decreased as the intensity of the brown pigment increased. In wild-type green cotton, only the fiber strength decreased as the color darkened. The wild-type GCF was clearly shorter and weaker than the BCF in lightly colored cotton. The GCF was also considerably weaker than the intensely colored BCF (Figs. 6D–6F). An examination of the fiber quality of GhCHI transgenic offspring revealed that the fiber strength and micronaire of dark green fiber (T2–2 and –6) were the lowest in the same genetic background (Fig. 6G and 6H). Only BCF offspring had shorter fiber lengths than those of the parental genotype and dark green offspring (Fig. 6I).
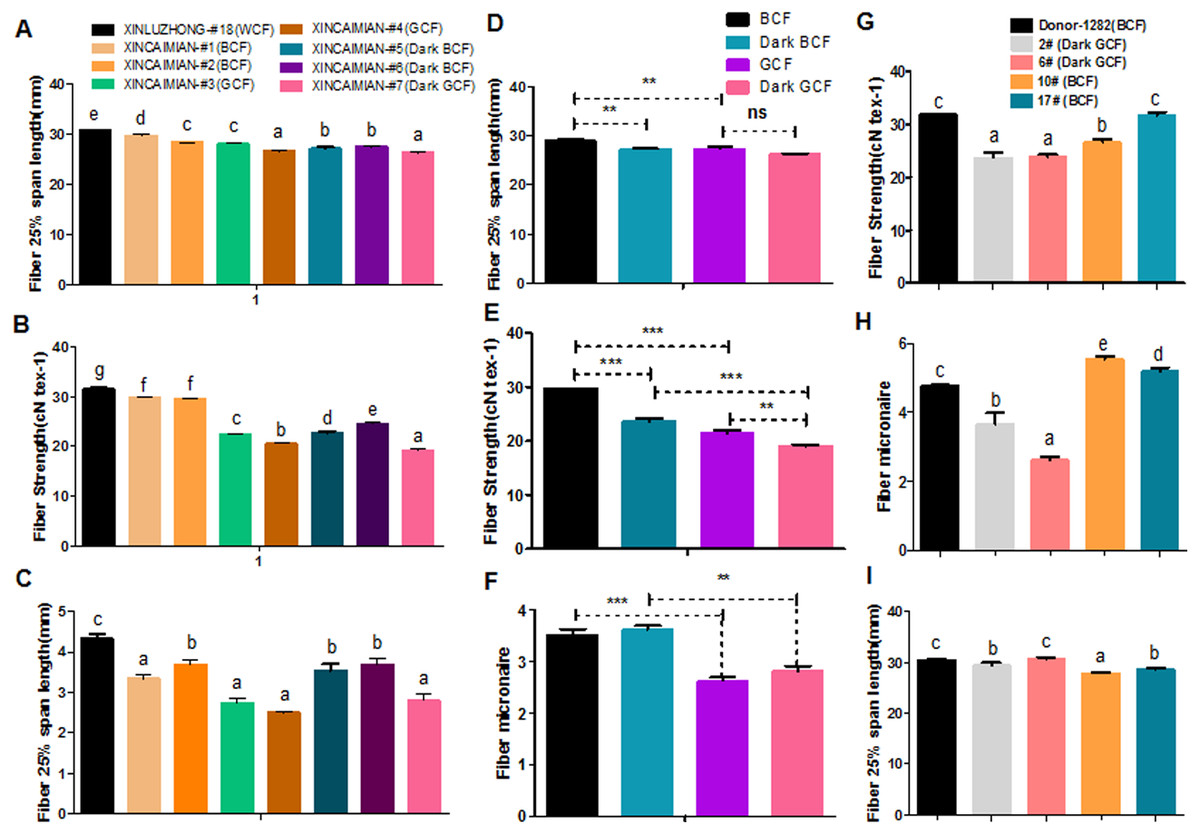
Figure 6: Correlation analysis of fiber color and quality.
(A–C) Fiber quality comparison between naturally colored cotton and white cotton. ‘Xinluzhong’ sample #18: WCF. ‘Xincaimian’ samples #1, #2, #5, and #6: BCF. ‘Xincaimian’ samples #3 and #4: GCF. Results are expressed as the means ± standard errors (n = 3). (D–F) Fiber quality comparison between GCF and BCF. Results are expressed as the means ± standard errors (n = 3). (G–I) Fiber quality comparison among transgenic cotton #1 T1 progenies . Results are expressed as the means ± standard errors (#2; n = 8) and (#6; n = 13): dark green fiber; (#10; n = 36) and (#17; n = 28): brown fiber; (Donor material ‘Zong 1282’; n = 47): brown fiber. (G) Fiber strength. (H) Fiber micronaire. (I) Fiber 25% span length. ‘a’, ‘b’, ‘c’ means with different letters are significantly different at P < 0.05. Means of three replicates ± SE, *, ** , ***-significant differences at P ≤ 0.05, 0.01 and 0.001 respectively.Transcriptome and metabolome analyses revealed that flavonoid biosynthesis pathway genes were enriched during pigment synthesis. Silencing the GhCHI-1 gene in a BCF line resulted in three fiber phenotypes, including GCF, among the RNAi lines’ offspring. Additionally, the overexpression of Gh3GT and At3GT genes demonstrated that the BCF turned green. Thus, the flavonoid biosynthetic pathway is responsible for BCF and GCF formation.
The GCF can be produced by interfering with the expression of GhCHI-1. Blocking the flavonoid biosynthetic pathway resulted in more substrates for the lignin biosynthetic pathway (Fig. S2). Because of the influence of transgene insertion sites, owing to regulation by epigenetic mechanisms, different gene suppression effects can be produced at different times.
Results from a previous study indicated that a defective CHI gene in the primary leaves of barley flavonoid mutants led to the accumulation of chalcone isosalipurposide (Reuber et al., 1997). Isosalipurposide synthesis likely influences the GCF phenotype (Fig. S2). The genomic sequence of the tetrahydroxychalcone 2′-glucosyltransferase gene is currently unknown. A multiple sequence alignment involving its (gi|156138818|) encoded amino acid sequence revealed a 56% identity to two 3GT genes (Si3GT2L, gi|747104433| and Ns3GT2L, gi|698497982|). It also contained a sequence that was highly similar to the C-terminal region of At3GT, which encodes a fragment having an important glycosyltransferase activity ( Fig. S7). The relationship between isosalipurposide and green pigments in cotton fibers should be investigated. In naturally colored cotton, as the color darkened, the fiber quality decreased. Among all transgenic offspring, the quality of GCF was the lowest. As mentioned previously, wild-type GCF is of poorer quality (in terms of strength, length, and micronaire) than most conventional cottons. This may be related to the decreased CHI expression level at early stages, which affects fatty acid metabolism (Ngaki et al., 2012) and influences fiber quality.
Mostly WCF lines are the most important domesticated naturally colored cotton genotypes (Wendel, Flagel & Adams, 2012). Lengthy domestication and directional selection processes resulted in long, strong, and fine white G. hirsutum fibers, as well as a high lint fiber yield per acre, and other economically important morphological traits.
The five stages of cotton fiber development consist of fiber initiation (0–3 DPA), primary cell wall synthesis and elongation (3–15 DPA), transition to secondary cell wall growth (15–20 DPA), secondary cell wall biosynthesis (20–40 DPA), and fiber maturation (40–50 DPA) (Haigler et al., 2012). Compared with domesticated cotton fiber, fibers of wild cotton species undergo a short primary cell wall synthesis and elongation stage (Applequist, Cronn & Wendel, 2001; Hovav et al., 2008; Hu et al., 2013). Transcriptome profiles confirmed this difference in fiber development of improved vs. wild cotton species (Yoo & Wendel, 2014). During the pigment formation stage, the flavonoid biosynthetic pathway is very active. This period is also critical for fiber elongation, and the products of the flavonoid biosynthetic pathway along with the combined activities of the auxin inhibitor naphthylphthalamic acid receptors and PIN-FORMED proteins may affect auxin transport (Jacobs & Rubery, 1988; Faulkner & Rubery, 1992; Mathesius et al., 1998; Murphy, Peer & Taiz, 2000; Peer et al., 2004). Therefore, the specific mechanisms affecting cotton development require further study.
It is unclear whether the flavonoid metabolic pathway beneficial effected cotton fiber development during the domestication process. It is possible that in addition to altering fiber color, fiber quality may be improved by regulating the timing of the expression of key flavonoid biosynthetic pathway genes.
Our research indicates that the formation of brown pigments in cotton fibers is controlled by the flavonoid biosynthetic pathway, and the formation of green pigments in cotton fibers may be controlled by the same pathway because the overexpression of Gh3GT and At3GT in BCF plants resulted in GCF. However, further research involving the transgenic offspring is required to identify flavonoid biosynthetic pathway genes that affect green pigment formation along with Gh3GT. Additionally, more comprehensive investigations of the relationships between flavonoid metabolism and fiber development are warranted.
Conclusions
Taken these results together, our results indicate that the flavonoid biosynthetic pathway controls both brown and green pigmentation processes. Like natural colored fibers, the transgenic colored fibers were weaker and shorter than WCF. This study shows the potential of flavonoid pathway modifications to alter cotton fibers’ color and quality.
Supplemental Information
Hierarchical clustering and quantitative real-time PCR validation of RNA-seq results. Phenylpropanoid pathway and genes involved in the biosynthetic pathways
The differentially expressed anthocyanin genes were clustered using hierarchical clustering with Euclidean distance with complete linkage. The relative expression levels of these genes verified by quantitative real-time PCR were log2-transformed and presented using a color scale ranging from saturated blue for log ratios ≤ −1.5, to saturated red for log ratios ≥ 3.0. Each gene is represented by a row of colored boxes. The phenylpropanoid pathway includes the flavonoid/anthocyanin biosynthetic pathway (metabolites surrounded by a red box) and the lignin biosynthetic pathway (metabolites surrounded by a green box). PAL, phenylpropanoid (metabolic) pathway ; CHS, chalcone synthase; CHI, chalcone isomerase; THC2′GT, tetrahydroxychalcone- 2′-glucosyltransferase; F3H, flavanone 3-hydroxylase; F3′H, flavonoid 3′-hydroxylase; F3′5′H, flavonoid 3′, 5′-hydroxylase; DFR, dihydroflavonol 4-reductase; ANS, anthocyanidin synthase; 3GT, UDP-glucose:flavonoid-3-O-glucosyltransferase; 5GT, UDP-glucose:flavonoid-5-O-glucosyltransferase; MT, anthocyanin O-methyltransferase; AT, anthocyanin acyltransferase; CCR, cinnamoyl-CoA reductase; CAD, cinnamyl alcohol dehydrogenase; HCT, hydroxycinnamoyl CoA shikimate/quinate hydroxycinnamoyl transferase; CCoAOMT , caffeoyl-CoA O-methyltransferase .
The statistics of the 12 (samples: BCF, GCF, and WCF, numbered 5, 6, and 24, respectively at two time points, 0 and 12 DPA) library reads
BCF, GCF, and WCF belong to wild type; numbered 5, 6, and 24 belong to transgenic type. There are two time points, 0 and 12 DPA.
List of real-time PCR primers in this study
It mainly includes gene accession number, primer name, primer sequence, and the PCR product size.
Genes related to the phenylpropanoid (metabolic) pathway
It mainly lists genes in the flavonoid metabolic pathway, including accession number and gene name.
Significantly differentially expressed genes (BCF and WCF)
A comparison between BCF and WCF indicated that the significantly differentially expression genes were divided into nine clusters.
Significantly differentially expressed genes (GCF and WCF)
A comparison between GCF and WCF indicated that the significantly differentially expression genes were divided into nine clusters.
Significantly differentially expressed genes (#5 and #24)
A comparison between #5 and #24 indicated that the significantly differentially expression genes were divided into nine clusters.
Significantly differentially expressed genes (#6 and #24)
A comparison between #6 and #24 indicated that the significantly differentially expression genes were divided into nine clusters.
List of pathways for significantly differentially metabolites
The metabolomics of cotton fiber were analyzed by using the Q-TOF, and it was operated in both positive and negative ion modes. The pathway analyses of metabolites were performed with KEGG database sources to help identify the pathways that were most significantly altered.
