
Integrated bioinformatic changes and analysis of retina with time in diabetic rats
- Published
- Accepted
- Received
- Academic Editor
- Yuriy Orlov
- Subject Areas
- Bioinformatics, Ophthalmology
- Keywords
- Differentially expressed genes, Gene ontology terms, Protein–protein interaction, Diabetic retinopathy, Bioinformatics
- Copyright
- © 2018 Cui et al.
- Licence
- This is an open access article distributed under the terms of the Creative Commons Attribution License, which permits unrestricted use, distribution, reproduction and adaptation in any medium and for any purpose provided that it is properly attributed. For attribution, the original author(s), title, publication source (PeerJ) and either DOI or URL of the article must be cited.
- Cite this article
- 2018. Integrated bioinformatic changes and analysis of retina with time in diabetic rats. PeerJ 6:e4762 https://doi.org/10.7717/peerj.4762
Abstract
Diabetic retinopathy (DR) is the most common chronic complication of diabetes. It can cause impaired vision and even blindness. However, the pathological mechanism of DR is still unknown. In the present study, we use bioinformatic analysis to reveal the pathological changes of early DR in a streptozotocin (STZ) induced diabetes rat model. The dataset GSE28831 was downloaded from the Gene Expression Omnibus (GEO) database. To clarify the pathological mechanism of early DR, genes which were up-regulated (UP group) or down-regulated (DOWN group) over time were identified. One hundred eighty six genes in the UP group and 85 genes in the DOWN group were defined. There were in total 28 Gene ontology (GO) terms with a P value lower than 0.05 in UP group, including astrocyte development, neutrophil chemotaxis, neutrophil aggregation, mesenchymal cell proliferation and so on. In the DOWN group, there were totally 14 GO terms with a P value lower than 0.05, including visual perception, lens development in camera-type eye, camera-type eye development, bicellular tight junction and so on. Signaling pathways were analyzed with all genes in the UP and DOWN groups, and leukocyte transendothelial migration and tight junction were selected. Protein–protein interaction (PPI) network was constructed and six hub genes Diras3, Actn1, Tssk6, Cnot6l, Tek and Fgf4 were selected with connection degree ≥5. S100a8, S100a9 and Tek may be potential targets for DR diagnosis and treatment. This study provides the basis for the diagnosis and treatment of DR in the future.
Introduction
The number of diabetic patients in the world reached 366 million in 2011. There were 92.4 million diabetic patients in China, ranking first in the world (Yang et al., 2010). The main hazard of diabetes is chronic complications of diabetes. Diabetic retinopathy (DR) is the most common chronic complication of diabetes and is the first blinding eye disease in the working population (Kobrin Klein, 2007). In the American diabetic population, the prevalence of DR was 98% and 78%, respectively, in patients with type 1 and type 2 (Kempen et al., 2004). In the Chinese diabetic population, the prevalence of DR was 37%. Ten to 19 years later, the prevalence of DR increased to 54% (Xie et al., 2009). The Wisconsin Epidemiology Survey of Diabetic Retinopathy (WESDR) found that the blindness rates in patients with type 1 and type 2 diabetes were 3.6% and 1.6%, respectively (Fong et al., 2004). The main causes of visual impairment of DR are diabetic macular edema (DME) and proliferative diabetic retinopathy (PDR), the incidences of which are 23% and 14%, respectively in type 1 and type 2 diabetic patients (Kempen et al., 2004; Porta, Maldari & Mazzaglia, 2011).
The basic pathological process of DR is microcirculatory disturbance. Long-term hyperglycemia leads to vascular endothelial injury, activation of cell adhesion molecules, leukocyte accumulation and activation of a series of cytokines. These changes are followed by the expression of hypoxia regulated growth factors and an increase in cytokines resulting in microcirculatory disturbances, such as intraretinal microvascular abnormalities(IRMA), leakage, obstruction, microaneurysms (Chibber et al., 2007; Kern, 2007). Multiple factor interactions play a key role in the development and progression of DR (Brownlee, 2005).
Streptozotocin (STZ) is particularly toxic to mammalian pancreatic beta cells. Due to its high toxicity to beta cells, streptozotocin has been used in scientific studies to induce insulitis and diabetes in experimental animals (Rossini et al., 1977). Kirwin et al. (2011) used microarrays to evaluate early changes (up to 3 months) in STZ-induced diabetic rats. They found that the expression of visual cyclin proteins was significantly down-regulated post STZ treatment. This microarray dataset (GSE28831) has been uploaded to the Gene Expression Omnibus database. Using this dataset, Zhao et al. (2017) further analyzed differentially expressed genes (DEGs), Gene Ontology (GO) enrichment and signaling pathways on days 7, 28 and 84 in STZ-induced diabetic rats. However, they only analyzed DEGs at this three time points without analyzing the tendency of gene expression over time. The molecule mechanism and pathological process from day 7 to day 84 was still unclear. As a matter of fact, DR is associated with apoptosis, oxidative stress, inflammation and so on. Therefore, the analysis of the integrated bioinformatic changes with time in DR is important.
In previous studies, GSE28831 has been analyzed by two research groups. Kirwin et al. (2011) produced the pathological model and performed microarray analysis. Zhao et al. (2017) also analyzed the dataset, listed Gene Ontology (GO) enrichment terms and pathway analysis at three time points in detail, and analyzed the protein–protein interaction (PPI) of DEGs. To investigate the pathological changes of early stages of DR over time, further analysis was performed with new bioinformatic approach. In this study, we divide the genes in GSE28831 into two groups depending on the increase in expression (UP group) or the decrease in expression (DOWN group) over time. We then analyzed GO enrichment, signaling pathway and protein–protein interaction (PPI) for both groups by comparing DEGs between the respective groups. From these results, the new molecular mechanism and pathological process of early DR are discovered.
Materials and Methods
Affymetrix microarray data of the retina in diabetic rats
The data set GSE28831 provided by Kirwin et al. (2011) was downloaded from Gene Expression Omnibus (GEO) (https://www.ncbi.nlm.nih.gov/geo/query/acc.cgi?acc=GSE28831). The preparation of samples is described in their study. They extracted the retinas of Evans rats on days 7, 28 and 84 after STZ induced diabetes. Microarray experiment was performed. Agilent-014879 Whole Rat Genome Microarray 4 × 44 K G4131F was used as the platform.
Analysis of DEGs over time
The dataset was analyzed with GEO2R. The expression of STZ group was compared with control group. Then, fold-change (FC) was calculated. DEGs in each time point were screened with |log2FC| > 1 and P value <0.05. In this study, we divided the genes into two groups. If the FC of a gene on day 84 was greater than the FC on day 28 and the FC on day 28 was also greater than the FC on day 7 [FC(7d) <FC(28d) <FC(84d)] and the P value of the three time points is at least one less than 0.05, we defined it as a UP gene. Similarly, if the FC on day 84 was less than the FC on day 28 and the FC on day 28 was less than the FC on day 7 [FC(7d) >FC(28d) >FC(84d)], and the P value of the three time points was at least one less than 0.05, we defined it as a DOWN gene.
The heatmaps of UP group and DOWN group were designed according to average FC. The data was transformed with log2.
Functional enrichment analysis
Genes in UP group and DOWN group were submitted to the Database for Annotation, Visualization and Integrated Discovery (DAVID, version 6.8; https://david.ncifcrf.gov/; Huang, Sherman & Lempicki, 2009). Gene ontology (GO) terms and Kyoto Encyclopedia of Genes and Genomes (KEGG) pathways were screened with P value <0.05. We selected DEGs of glucose homeostasis, astrocyte development, neutrophil chemotaxis, eye development and bicellular tight junction from GO enrichment results and plotted heatmaps with fold change.
Protein–protein interaction (PPI) network
The protein–protein interaction (PPI) analysis is necessary to illustrate the molecular mechanisms. In this study, Search Tool for the Retrieval of Interacting Genes (STRING; http://string-db.org/) database was used to construct PPI network. Genes in the UP group and DOWN group were submitted to the database. Interaction score of 0.4 was defined as the screened threshold. Hub genes were selected with connection degree ≥5.
Results
Changes of expression in DEGs
According to the grouping method mentioned above, 186 genes in UP group and 85 genes in DOWN group were defined. We plotted heatmaps of UP group and DOWN group based on FC of genes (Fig. 1).
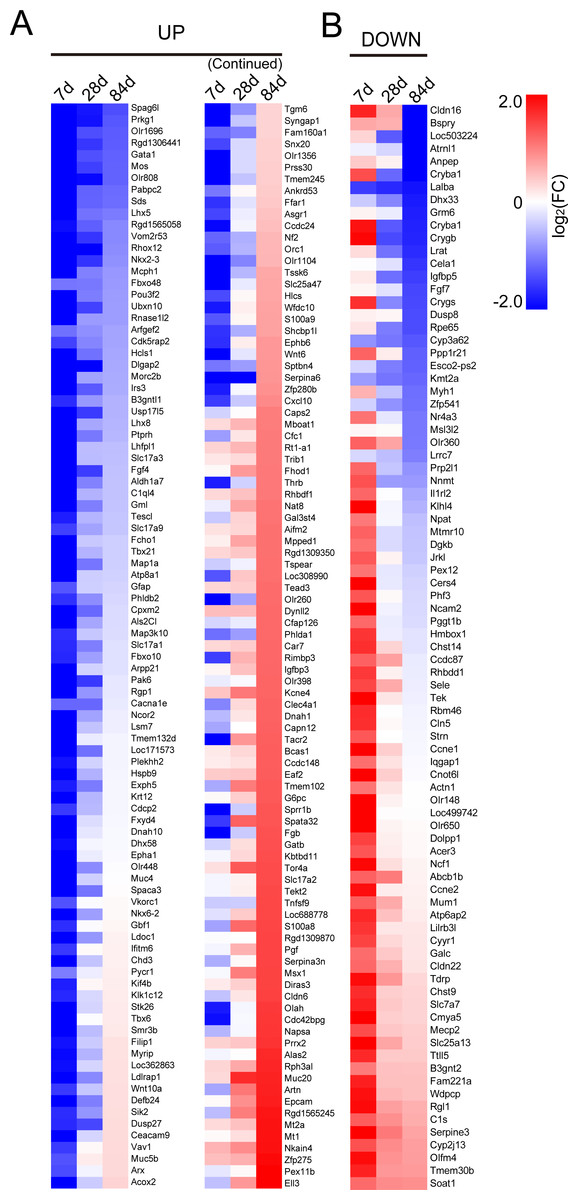
Figure 1: Heatmaps of genes in UP group (A) and DOWN group (B).
Red represents up-regulation. Blue represents down-regulation. Each group from left to right are day 7, day 28 and day 84, respectively. Bar unit: log2FC.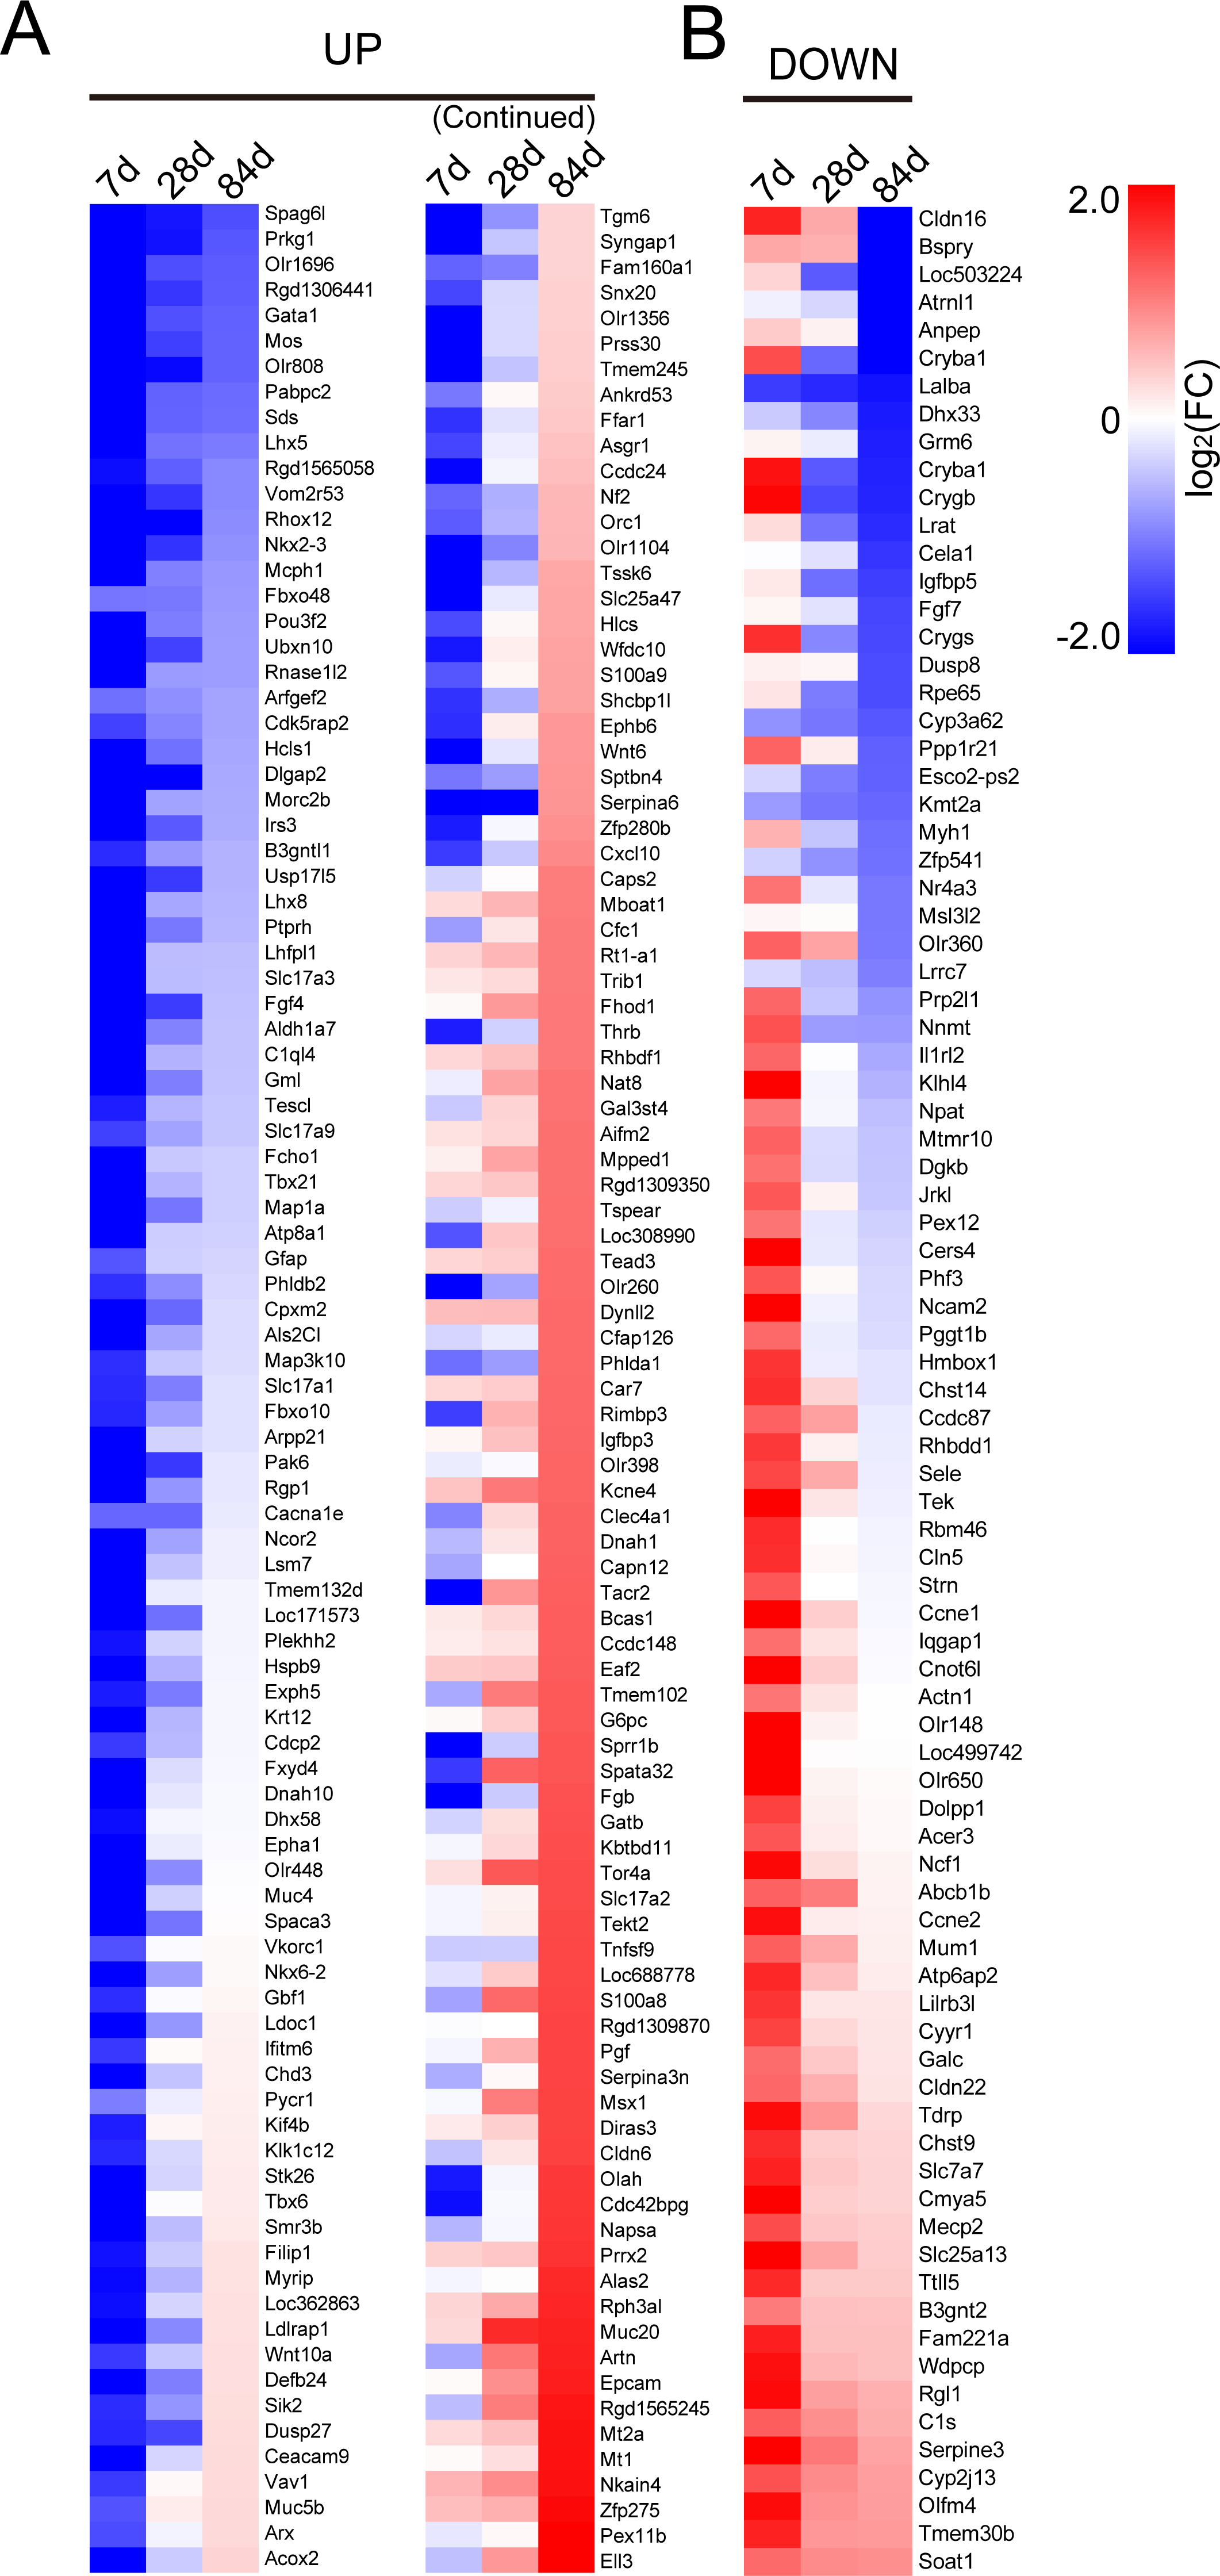
GO terms enrichment and signaling pathways analysis
The genes in UP group and DOWN group were submitted to DAVID to analyze GO term enrichment and KEGG signaling pathway. GO terms consist of Biological Process (BP), Cellular Component (CC) and Molecular Function (MF). There were totally 28 GO terms with a P value lower than 0.05 in UP group, including astrocyte development, neutrophil chemotaxis, neutrophil aggregation, mesenchymal cell proliferation and so on (Table 1). In DOWN group, there were totally 14 GO terms with a P value lower than 0.05, including visual perception, lens development in camera-type eye, camera-type eye development, bicellular tight junction and so on (Table 2). KEGG signaling pathways were analyzed with all genes in UP group and DOWN group. The screening threshold was set to P value <0.05. Only two pathways (leukocyte transendothelial migration and tight junction) were selected (Table 3). We selected DEGs of glucose homeostasis, astrocyte development, neutrophil chemotaxis, eye development and bicellular tight junction from GO enrichment results and plotted heatmaps with fold change (Fig. 2).
| Category | Term | Count | % | P-Value | Genes |
|---|---|---|---|---|---|
| GO TERM_BP | GO:0042475∼odontogenesis of dentin-containing tooth | 6 | 3.23 | 0.0003 | Msx1, Nf2, Wnt6, Lhx8, Nkx2-3, Fgf4 |
| GO TERM_BP | GO:0014002∼astrocyte development | 4 | 2.15 | 0.0004 | Gfap, S100a8, S100a9, Pou3f2 |
| GO TERM_BP | GO:0044341∼sodium-dependent phosphate transport | 3 | 1.61 | 0.0021 | Slc17a3, Slc17a1, Slc17a2 |
| GO TERM_BP | GO:0046415∼urate metabolic process | 3 | 1.61 | 0.0027 | G6pc, Slc17a3, Slc17a1 |
| GO TERM_BP | GO:0021879∼forebrain neuron differentiation | 3 | 1.61 | 0.0057 | Lhx5, Lhx8, Phlda1 |
| GO TERM_BP | GO:0021846∼cell proliferation in forebrain | 3 | 1.61 | 0.0086 | Arx, Lhx5, Ncor2 |
| GO TERM_BP | GO:0014912∼negative regulation of smooth muscle cell migration | 3 | 1.61 | 0.0097 | Prkg1, Igfbp3, Trib1 |
| GO TERM_BP | GO:0035435∼phosphate ion transmembrane transport | 3 | 1.61 | 0.0108 | Slc17a3, Slc17a1, Slc17a2 |
| GO TERM_BP | GO:0030593∼neutrophil chemotaxis | 4 | 2.15 | 0.0147 | Gbf1, S100a8, S100a9, Vav1 |
| GO TERM_BP | GO:0023019∼signal transduction involved in regulation of gene expression | 3 | 1.61 | 0.0174 | Epcam, Tbx6, Msx1 |
| GO TERM_BP | GO:0070488∼neutrophil aggregation | 2 | 1.08 | 0.0176 | S100a8, S100a9 |
| GO TERM_BP | GO:0030317∼sperm motility | 4 | 2.15 | 0.0207 | Spag6l, Tekt2, Dnah1, Cacna1e |
| GO TERM_BP | GO:0042593∼glucose homeostasis | 5 | 2.69 | 0.0237 | G6pc, Ffar1, Rph3al, Cacna1e, Ncor2 |
| GO TERM_BP | GO:0010273∼detoxification of copper ion | 2 | 1.08 | 0.0349 | Mt2a, Mt1 |
| GO TERM_BP | GO:0048863∼stem cell differentiation | 3 | 1.61 | 0.0362 | Epcam, Msx1, Ell3 |
| GO TERM_BP | GO:0002793∼positive regulation of peptide secretion | 2 | 1.08 | 0.0434 | S100a8, S100a9 |
| GO TERM_BP | GO:0035106∼operant conditioning | 2 | 1.08 | 0.0434 | Tacr2, Aldh1a7 |
| GO TERM_BP | GO:0010463∼mesenchymal cell proliferation | 2 | 1.08 | 0.0434 | Msx1, Fgf4 |
| GO TERM_BP | GO:0050714∼positive regulation of protein secretion | 3 | 1.61 | 0.0487 | Fgb, Rph3al, Exph5 |
| GO TERM_CC | GO:0005615∼extracellular space | 19 | 10.22 | 0.0318 | Wnt10a, Spaca3, Aifm2, S100a8, Pgf, S100a9, Cpxm2, Artn, Napsa, Tnfsf9, Muc4, Cxcl10, Serpina3n, Serpina6, Fgb, C1ql4, Wnt6, Igfbp3, Muc5b |
| GO TERM_MF | GO:0005436∼sodium: phosphate symporter activity | 3 | 1.61 | 0.0016 | Slc17a3, Slc17a1, Slc17a2 |
| GO TERM_MF | GO:0015321∼sodium-dependent phosphate transmembrane transporter activity | 3 | 1.61 | 0.0021 | Slc17a3, Slc17a1, Slc17a2 |
| GO TERM_MF | GO:0001085∼RNA polymerase II transcription factor binding | 4 | 2.15 | 0.0137 | Gata1, Tbx6, Hcls1, Tead3 |
| GO TERM_MF | GO:0003779∼actin binding | 7 | 3.76 | 0.0226 | Spata32, Myrip, Nf2, Plekhh2, Map1a, Hcls1, Sptbn4 |
| GO TERM_MF | GO:0017137∼Rab GTPase binding | 5 | 2.69 | 0.0250 | Myrip, Rph3al, Exph5, Rgp1, Als2cl |
| GO TERM_MF | GO:0043565∼sequence-specific DNA binding | 11 | 5.91 | 0.0281 | Arx, Gata1, Msx1, Thrb, Nkx6-2, Lhx5, Pou3f2, Prrx2, Lhx8, Ncor2, Nkx2-3 |
| GO TERM_MF | GO:0035662∼Toll-like receptor 4 binding | 2 | 1.08 | 0.0346 | S100a8, S100a9 |
| GO TERM_MF | GO:0004672∼protein kinase activity | 7 | 3.76 | 0.0359 | Stk26, Mos, Map3k10, Prkg1, Sik2, Epha1, Trib1 |
| Category | Term | Count | % | P-value | Genes |
|---|---|---|---|---|---|
| GO TERM_BP | GO:0007601∼visual perception | 4 | 4.76 | 0.0098 | Lrat, Rpe65, Cryba1, Cln5 |
| GO TERM_BP | GO:0002088∼lens development in camera-type eye | 3 | 3.57 | 0.0103 | Crygb, Crygs, Cryba1 |
| GO TERM_BP | GO:0070192∼chromosome organization involved in meiotic cell cycle | 2 | 2.38 | 0.0311 | Ccne2, Ccne1 |
| GO TERM_BP | GO:0016051∼carbohydrate biosynthetic process | 2 | 2.38 | 0.0349 | Chst9, Chst14 |
| GO TERM_BP | GO:0043010∼camera-type eye development | 3 | 3.57 | 0.0378 | Wdpcp, Rpe65, Cryba1 |
| GO TERM_BP | GO:0055123∼digestive system development | 2 | 2.38 | 0.0387 | Wdpcp, Cela1 |
| GO TERM_BP | GO:1903827∼regulation of cellular protein localization | 2 | 2.38 | 0.0425 | Ccne2, Ccne1 |
| GO TERM_BP | GO:0031100∼organ regeneration | 3 | 3.57 | 0.0499 | Ccne1, Nr4a3, Nnmt |
| GO TERM_CC | GO:0005923∼bicellular tight junction | 4 | 4.76 | 0.0096 | Cldn16, Strn, Cldn22, Actn1 |
| GO TERM_CC | GO:0031252∼cell leading edge | 3 | 3.57 | 0.0215 | Bspry, Actn1, Iqgap1 |
| GO TERM_CC | GO:0030176∼integral component of endoplasmic reticulum membrane | 3 | 3.57 | 0.0449 | Acer3, Dolpp1, Rhbdd1 |
| GO TERM_MF | GO:0005212∼structural constituent of eye lens | 3 | 3.57 | 0.0034 | Crygb, Crygs, Cryba1 |
| GO TERM_MF | GO:0001537∼N-acetylgalactosamine 4-O-sulfotransferase activity | 2 | 2.38 | 0.0197 | Chst9, Chst14 |
| GO TERM_MF | GO:0045322∼unmethylated CpG binding | 2 | 2.38 | 0.0313 | Kmt2a, Mecp2 |
| Category | Term | Count | % | P-Value | Genes |
|---|---|---|---|---|---|
| KEGG_PATHWAY | rno04670: Leukocyte transendothelial migration | 6 | 2.22 | 0.0228 | Cldn16, Ncf1, Cldn6, Cldn22, Actn1, Vav1 |
| KEGG_PATHWAY | rno04530: Tight junction | 6 | 2.22 | 0.0427 | Cldn16, Myh1, Cldn6, Hcls1, Cldn22, Actn1 |
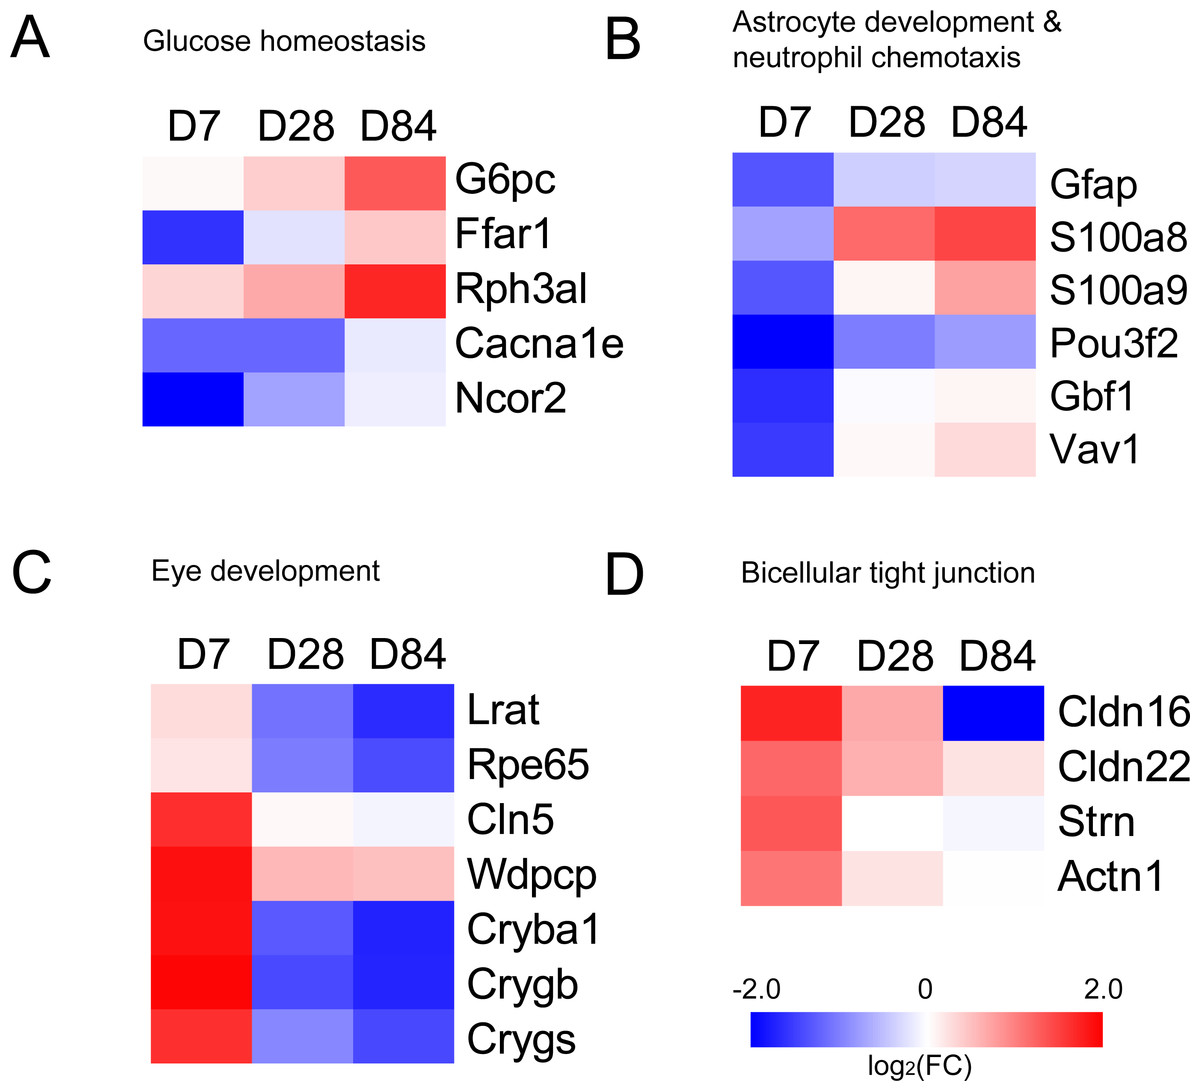
Figure 2: Heatmaps of genes in GO terms (A) glucose homeostasis, (B) astrocyte development & neutrophil chemotaxis, (C) eye development and (D) bicellular tight junction.
Red represents up-regulation. Blue represents down-regulation. Each group from left to right are day 7, day 28 and day 84, respectively. Bar unit: log2FC.

Figure 3: Protein–protein interaction network of UP group and DOWN group.
Nodes represent proteins expressed by genes in UP group (red labels) and DOWN group (blue labels).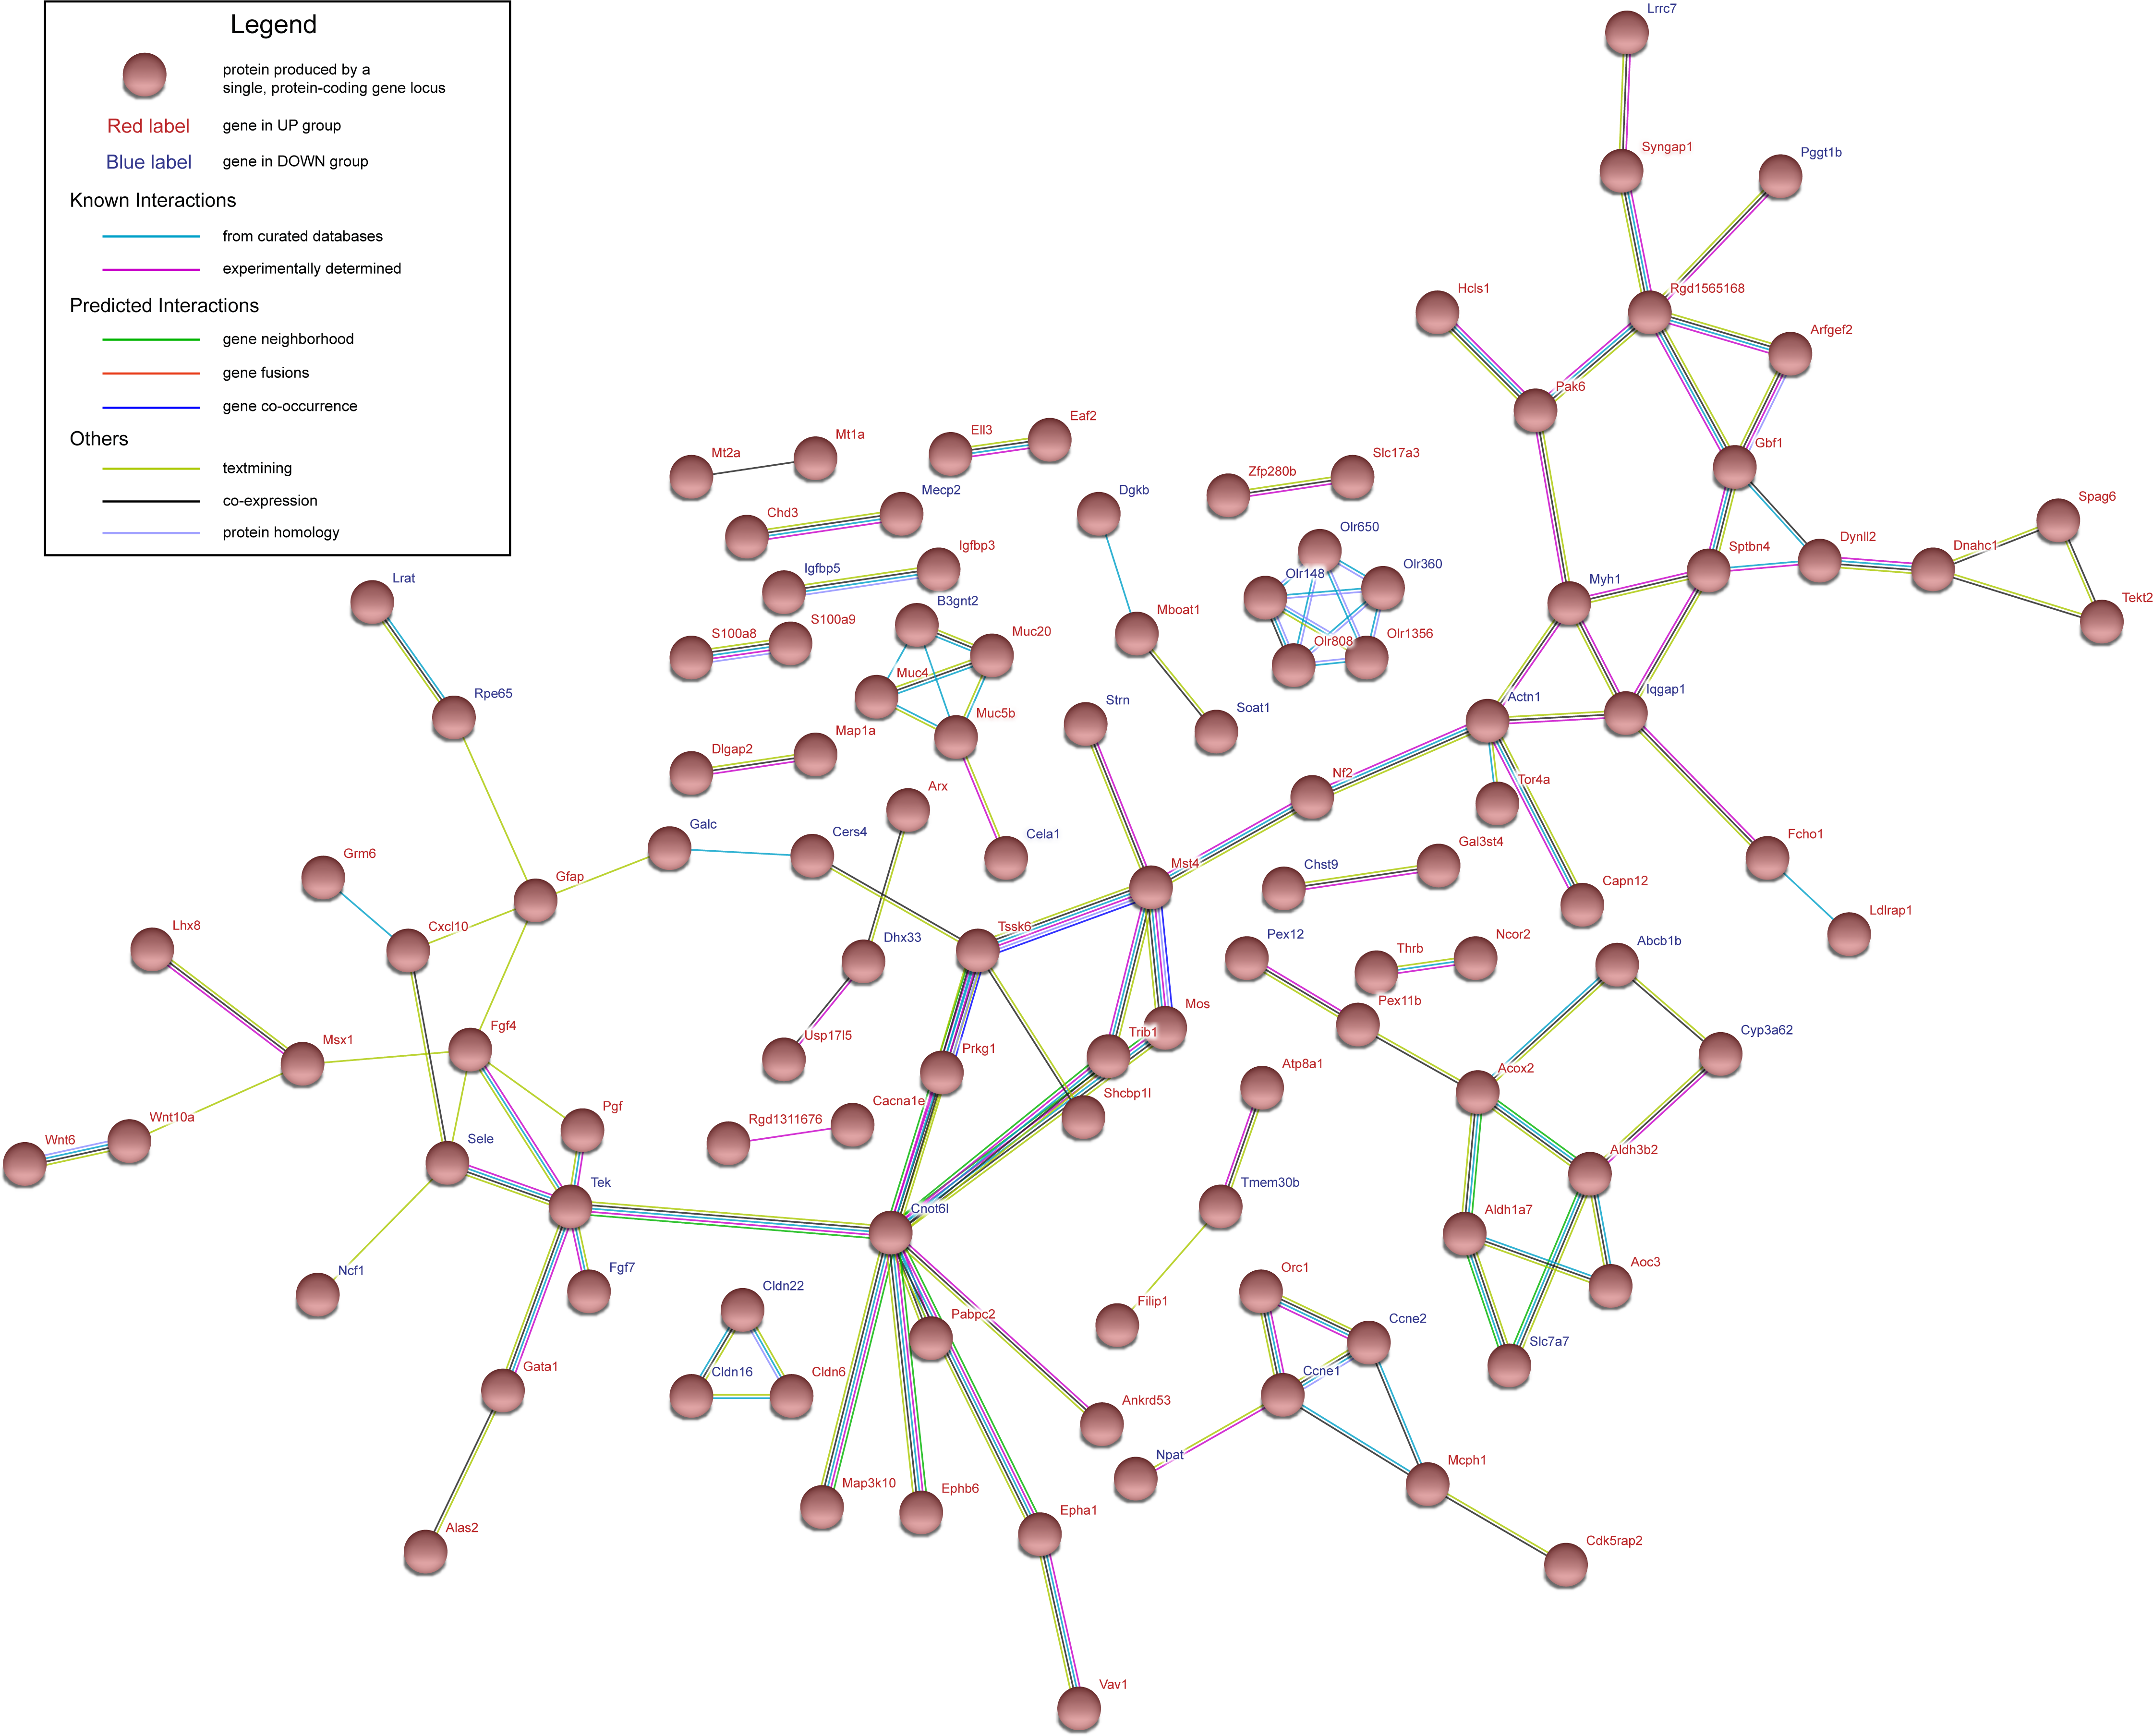
Protein–protein interaction (PPI) network construction and hub gene selection
The genes in UP group and DOWN group were submitted to STRING database to construct PPI network. Interaction score of 0.4 was defined as the screened threshold. The constructed PPI network is shown in Fig. 3. Hub genes were selected with connection degree ≥5. Six hub genes were Diras3, Actn1, Tssk6, Cnot6l, Tek and Fgf4 .
Discussion
Diabetic retinopathy (DR) is the leading cause of blindness and a major microvasculature complication of diabetes mellitus (DM). At present, the pathogenesis of DR has not been fully elucidated. However, some mechanisms are associated with the pathogenesis of DR.
DM patients have a higher concentration of blood glucose. Hyperglycemia increases the thickness of capillary basement membrane in the nerve fiber layer and the outer plexiform layer, which leads to retinal capillary cell apoptosis, reduced activity of retinal dismutase and catalase (Zhang et al., 2015). Recent studies have shown that hyperglycemia-induced retinal pigment epithelial (RPE) cell apoptosis is also thought to be involved in the development of DR (Kim et al., 2014).
In previous studies, Kirwin et al. (2011) analyzed the microarray data, listed the GO enrichment terms, and discussed the DEGs of the visual cycle in DR. Zhao et al. (2017) analyzed the dataset, listed GO enrichment terms, pathway analysis and PPI at three time points in detail. The effects of genes such as CYP2B2, MASP2, LRAT, RPE65, RDH5, MAPK13, LRAT and RPE65 on DR were discussed. To investigate the pathological changes of early stages of DR over time, further analysis was performed with new bioinformatic approach. In this study, we divided these genes into the UP group and DOWN group based on changes in gene expression. GO terms astrocyte development, neutrophil chemotaxis, neutrophil aggregation, mesenchymal cell proliferation, glucose homeostasis and so on are in the UP group. Visual perception, lens development in camera-type eye, camera-type eye development, bicellular tight junction and so on are in the DOWN group. Meanwhile, signaling pathways such as leukocyte transendothelial migration and tight junction have significant changes. From the above results we can conclude that the following factors play an important role in the development of early DR.
The first one is the abnormality of retinal pigment epithelial (RPE) cells. RPE is the outermost layer of the retina 10-layer structure, located between the choroid and retina. It is composed of a single layer of pigment epithelial cells arranged in a very regular manner. The RPE cells are polygonal. The RPE has many functions, including light absorption, epithelial transport, spatial ion buffering, visual cycle, phagocytosis, secretion and immune modulation (Strauss, 2005). In this study, the expression of Cldn16 and Cldn22 was down-regulated over time. Downregulation of claudin, indicated that tight junctions in the retina were damaged. Epithelial-mesenchymal transition (EMT) was occurred. RPE cells undergo EMT and produce fibroblast-like cells, and extracellular matrix (ECM) components, participating in fibrotic sequelae on the detached retina (Saika et al., 2008). In addition, the expression of Myh1 and Wdpcp was down-regulated over time. Myosin II (Myh1) is closely related to cell polarity (Vicente-Manzanares et al., 2007). WD repeat containing planar cell polarity effector (Wdpcp) can directly modulate the actin cytoskeleton to regulate cell polarity (Cui et al., 2013). RPE cells lose their polarity and remain in the shape of mesenchymal cells, showing deviation from the properties of epithelial cells (Lee et al., 2001). Ccne1 and Ccne2 were both expressed highly on day 7 and normally on day 84. Cyclin E is a member of the cyclin family. It can regulate EMT through phosphorylation of Slug, a transcriptional repressor (Wang et al., 2015).
The second is the impairment of visual function. The visual cycle is the sensory transduction of the visual system. This is a process by which light transforms into electrical signals in the rod cells, cone cells and photosensitive ganglion cells of the retina. Rpe65 and Lrat are the key enzymes of visual cycle. In this study, their expression was down-regulated over time. Kirwin et al. (2011) demonstrated that in hyperglycemic state, the expression of visual cycle enzymes is down-regulated.
The third is the inflammation in retina. In the present study, the expression of S100a8 textitand S100a9 was gradually increased. Calprotectin (S100A8/A9), a heterodimer of the two calcium-binding proteins S100A8 and S100A9, was originally discovered as an immunogenic protein expressed and secreted by neutrophils. Subsequently, it has emerged as an important pro-inflammatory mediator in acute and chronic inflammation (Gebhardt et al., 2006). Ryckman et al. (2003) have shown that calprotectin is involved in neutrophil migration to inflammatory sites. Ansari & Ganaie (2014) found that MRP-14 (S100A9) protein was upregulated in the ocular microenvironment in patients with PDR, which indicated that increased MRP-14 levels were associated with inflammation in PDR. It is a potential inflammatory marker in PDR. The expression of Vav1 and Gbf1 were down-regulated on day 7 and returned to normal or even up-regulated on day 84. They promote neutrophil chemotaxis with calprotectin (Mazaki, Nishimura & Sabe, 2012; Phillipson et al., 2009). Gfap was expressed decreasingly on day 7 and returned to normal on day 84. Gfap is not only involved in retinal damage repair (Humphrey et al., 1997), but is also proposed to play a role in astrocyte-neuron interactions as well as cell–cell communication (Weinstein, Shelanski & Liem, 1991).
The last one is early retinal regeneration. When the retina is damaged, tissue repair and regeneration begin. Cryba1, Crygb and Crygs were highly expressed on day 7, and then decreased on day 28 and 84. βB2-crystallin was shown to be highly expressed in regenerating ganglion cells where they have an autocrine effect promoting retinal ganglion cell axon regrowth (Liedtke et al., 2007). This was among the first evidence suggesting that β-crystallin proteins could also be secreted and be neuroprotective through other mechanisms. A subsequent study then demonstrated that this effect was related to increased inflammation and activation of the CNTF-STAT3 pathway. The authors also showed that γ-crystallins had a similar action (Fischer et al., 2008). Lu et al. (2013) found that CRYBB2 was significantly elevated in the retina after 1 month of diabetes in mice. A study also revealed that β-crystallin and γ-crystallin were up-regulated in rat’s retina with DR (Fort et al., 2009). Free fatty acid receptor 1 (FFAR1) is an important nutrient sensor of circulating lipids that controls retinal glucose entry to match mitochondrial metabolism with available fuel substrates. Activation of the Ffar1 impairs glucose entry into photoreceptors (Joyal et al., 2016).
PPI network shows six hub genes Diras3, Actn1, Tssk6, Cnot6l, Tek and Fgf4. Diras3 is an imprinted gene, with monoallelic expression of the paternal allele, which is associated with growth suppression. Thus, this gene appears to be a putative tumor suppressor gene whose function is abrogated in ovarian and breast cancers (Yu et al., 2006). A study found that Diras3 inhibits proliferation and activation of NF-κB in glioblastoma (Rymaszewski et al., 2016).Therefore, this gene may become a target of DR treatment and diagnosis. Actn1 (α-Actinin 1) was found to play roles in the survival, motility, and RhoA signaling of astrocytoma cells (Quick & Skalli, 2010). Cnot6l was expressed increasingly on day 7 and returned to normal on day 84. Mittal et al. (2011) that Ccr4a (Cnot6) and Ccr4b (Cnot6l) deadenylase subunits of the human Ccr4-Not complex contribute to the prevention of cell death and senescence. It shows that the death of retinal cells modulated the expression of Cnot6l up-regulated. Angiopoietin-1 receptor (Tek) is an angiopoietin receptor. In the present study, the expression of Tek was up-regulated on day 7 and returned to normal on day 84. Khalaf & Helmy (2017) found that the angiopoietin/tie system and VEGF are essential features in the commencement and development of PDR. AKB-9778 is a small-molecule that promotes Tie2 activation. In clinical trials, patients with diabetic macular edema (DME) were treated with AKB-9778 for 4 weeks. It reduced macular edema and improved vision in some patients (Campochiaro et al., 2015). In 2016, this research group found that in the clinical trial the combination of Tie2 activator AKB-9778 and vascular endothelial growth factor (VEGF) inhibitor ranibizumab was significantly more effective than suppression of VEGF alone in reducing DME (Campochiaro et al., 2016). So Tie2 (Tek) may be an important factor of DR development.
This rat model is STZ-induced. No literature was found to prove that STZ can directly affect the expression of the above genes. However, the toxicity of STZ can cause DNA damage, chromosome aberrations, and cell death (Bolzán & Bianchi, 2002). STZ also has more or less illimitable effects on nervous system (Biessels et al., 1999), cardiovascular system (Schaan et al., 2004), kidneys (Martin et al., 2004), respiratory system (Samarghandian, Afshari & Sadati, 2014), and reproductive system (Ansari & Ganaie, 2014). These effects may lead to indirect changes in gene expression. It needs further proof of study.
Conclusions
In conclusion, we speculate that the following pathological mechanisms of STZ-induced diabetes rat model with the above microarray analysis and prediction of key genes. On day 7, the retina was firstly damaged and RPE EMT occurred. Then crystallin repaired early damaged ganglion cells. On day 84, the expression of key enzyme of visual cycle was down-regulated. Inflammation occurred and EMT gradually stopped. Neutrophil chemotaxis occurred. Polarity and function of epithelial and endothelial cell were lost. In addition, S100a8, S100a9 and Tek may be potential targets for DR diagnosis and treatment. This provides the basis for the diagnosis and treatment of DR in the future.