
Genome-wide identification and expression profiles of ERF subfamily transcription factors in Zea mays
- Published
- Accepted
- Received
- Academic Editor
- Yuriy Orlov
- Subject Areas
- Agricultural Science, Bioinformatics, Genomics, Plant Science
- Keywords
- Maize, ERF, Genome-wide, Expression profiles, Abiotic stress
- Copyright
- © 2020 Hao et al.
- Licence
- This is an open access article distributed under the terms of the Creative Commons Attribution License, which permits unrestricted use, distribution, reproduction and adaptation in any medium and for any purpose provided that it is properly attributed. For attribution, the original author(s), title, publication source (PeerJ) and either DOI or URL of the article must be cited.
- Cite this article
- 2020. Genome-wide identification and expression profiles of ERF subfamily transcription factors in Zea mays. PeerJ 8:e9551 https://doi.org/10.7717/peerj.9551
Abstract
The Ethylene-Response Factor (ERF) subfamily transcription factors (TFs) belong to the APETALA2/Ethylene-Responsive Factor (AP2/ERF) superfamily and play a vital role in plant growth and development. However, identification and analysis of the ERF subfamily genes in maize have not yet been performed at genome-wide level. In this study, a total of 76 ERF subfamily TFs were identified and were found to be unevenly distributed on the maize chromosomes. These maize ERF (ZmERF) TFs were classified into six groups, namely groups B1 to B6, based on phylogenetic analysis. Synteny analysis showed that 50, 54, and 58 of the ZmERF genes were orthologous to those in rice, Brachypodium, and Sorghum, respectively. Cis-element analysis showed that elements related to plant growth and development, hormones, and abiotic stress were identified in the promoter region of ZmERF genes. Expression profiles suggested that ZmERF genes might participate in plant development and in response to salinity and drought stresses. Our findings lay a foundation and provide clues for understanding the biological functions of ERF TFs in maize.
Introduction
The Ethylene-Response Factor (ERF) subfamily transcription factors (TFs) belong to the APETALA2/Ethylene-Responsive Factor (AP2/ERF) superfamily, one of the largest groups of TFs in plants. Based on of repetitions and the sequence of the AP2 domain, the AP2/ERF TFs are classified into four separate subfamilies namely AP2, ERF, dehydration-responsive element-binding protein (DREB), and related to ABI3/VP1 (RAV) subfamilies (Nakano et al., 2006). The AP2 subfamily has two repeated AP2 domains, the ERF and DREB subfamilies contain a conserved WLG-motif and a single AP2 domain, while the RAV subfamily harbor a single AP2 domain in addition to a B3 DNA binding domain (Nakano et al., 2006). Although the ERF and DREB subfamilies only contain a single AP2 domain, there are some difference between them. DREB subfamily members are major factors involved in plant abiotic stress responses by regulating gene expression via the cis-acting DRE/C-repeat (DRE/CRT) element with a core motif of A/GCCGAC (Yamaguchi-Shinozaki & Shinozaki, 2006), while the ERF subfamily members binding to the ethylene-responsive (ERE) element AGCCGCC (Mizoi, Shinozaki & Yamaguchi-Shinozaki, 2012). The proteins of the ERF subfamily were classified into six groups termed B1 to B6 based on the phylogenetic relationship among them (Nakano et al., 2006).
Many of the ERF subfamily members are implicated in several diverse functions in plant development. For example, overexpression of Arabidopsis ESR1 induces initiation of shoot regeneration (Banno et al., 2001) and Arabidopsis LEP is involved in cell division activity in the marginal meristem (Van der Graaff et al., 2000). The ERF subfamily members are also involved in response to several stress factors. For example, the overexpression of wheat TaERF1 enhanced tolerance to stress induced by abscisic acid (ABA), ethylene, and salicylic acid (SA) (Xu et al., 2007); overexpression of barley ERF2.11 in Arabidopsis enhances plant waterlogging tolerance (Luan et al., 2020); ZmERF1 is activated and in response to drought stress via the ethylene and ABA signaling pathways (Shi et al., 2016); and the tobacco stress-induced gene 1 (Tsi1) is induced by salt and SA and overexpression of Tsi1 improves tolerance to attacks from pathogens and osmotic stress (Park et al., 2001).
Until now, several ERF subfamily TFs have been identified in plants. For example, there are 77 in Oryza sativa (Sharoni et al., 2011), 65 in Arabidopsis thaliana (Sakuma et al., 2002), 91 in Populus trichocarpa (Zhuang et al., 2008), and 62 in Glycine max (Zhang et al., 2008), amongst others. However, no research has been performed on the identification and characterization of the ERF subfamily in maize. Maize (Zea mays) is one of the most important crops in the world. In this study, we conducted genome-wide identification of ERF subfamily TFs in maize and performed a phylogenetic relationship analysis. Exon-intron structures, conserved motifs, and expression patterns were also analyzed. This study establishes a foundation for further analysis of ERF subfamily TFs in maize and other plant species.
Materials and Methods
Identification of ERF TFs in the maize genome
The following steps were performed to identify the ERF TFs in maize. Firstly, the Hidden Markov Model (HMM) profile (PF00847) of the AP2 domain was downloaded from the Pfam v32.0 database (El-Gebali et al., 2019) and used to search against the maize protein sequences using a threshold of E<1e−5. Secondly, the putative maize ERF sequences were analyzed with the SMART program (Ivica & Peer, 2017) to confirm the presence of the AP2 domain. Proteins that contained two repeated AP2 domains and the B3 domain were eliminated. Since both the ERF and DREB subfamilies have only one AP2 domain, we aligned the ERF and DREB members by using the T-COFFEE method to order to differentiate them (Notredame, Higgins & Heringa, 2000). Members that did not contain an amino acid motif, AAEIRD, in the AP2 domains were eliminated (Sakuma et al., 2002). Finally, the putative ERF subfamily members were obtained.
The physicochemical properties, including isoelectric points (pI), molecular weights (WM), and Grand average of hydropathicity (GRAVY) of the ZmERFs were calculated by using the ExPASy (Gasteiger et al., 2003). The subcellular localization was predicted by CELLO v.2.5 software (Yu et al., 2006). The chromosome distribution and sequence information of ZmERFs and other plant species were downloaded from the Ensembl Plants database (Bolser et al., 2017).
Sequence alignment, phylogenetic tree construction, and gene duplication analysis
Neighbor joining (NJ) and maximum likelihood (ML) trees were constructed using MEGA7 software with 1,000 bootstrap replications based on full-length protein sequences alignment (Sudhir, Glen & Koichiro, 2016). The trees were visualized online by using Evolview (https://www.evolgenius.info/evolview/). Segment duplication and tandem duplication pairs were elucidated from the Plant Genome Duplication Database (PGDD) (Lee et al., 2017). The collinear chart of ERF genes was drawn using the Circos program (Krzywinski et al., 2009).
Gene structure, conserved motifs, and cis-elements analyses
The exon-intron structures of the ZmERF genes were constructed by GSDS v2.0 (Guo et al., 2007) using the CDS (coding sequences) and DNA sequences of the ZmERFs. The MEME Suite v5.1.1 (Bailey et al., 2015) was used to identify motifs within ZmERF TFs and the parameter as follows: the optimum motif width: 6-50; the maximum number of motifs: 10. The 2-kb upstream genomic DNA sequences of ZmERF genes were submitted to the PlantCARE database (Magali et al., 2002) to identify the cis-elements.
Expression profiles
High-throughput sequencing data of maize in different plant tissues and under abiotic stresses were obtained from the Expression Atlas datasets of EMBL-EBI (Madeira et al., 2019) under accession number E-MTAB-3826 and the NCBI SRA database (Leinonen, Sugawara & Shumway, 2011) under SRP061276, respectively. These high-throughput data were used to analyze the expression of ZmERF genes in different tissues and under salinity and drought stresses. Based on the source of the high-throughput data, each tissue part had three biological replicates (Lunardon et al., 2016; Wang et al., 2016). The Fragments Per Kilobase Million (FPKM) values were used to calculate expression levels of the ZmERF genes and were visualized by the OmicShare tool online (http://www.omicshare.com/tools).
Plant materials, salt treatment, and qRT-PCR
The maize cultivar “Suiyu 23” was planted in soil with a growth chamber at 24 ± 2 °C (16 h/8 h = light/dark). For salt and drought treatment, two-week seedlings were incubated in a Murashige and Skoog liquid medium containing 200 mM NaCl for salt stress or 20% polyethylene glycol (PEG) 6000 for drought stress for 0 (control), 3, 6, and 12 h, respectively, after which the whole seedlings were collected for RNA isolation. Every sample had two biological replicates and at least 20 whole seedlings were collected for each replicates. RNA extraction and cDNA synthesis were carried out according to the manufacturer instructions (TIANGEN Biotech CO,. LTD, Beijing). The qRT-PCR analyses were performed in triplicate for each of the biological replicates and the reaction mixtures contained 7.5 µl of 2 × Talent qPCR PreMix, 0.5 µl (10 µM) each of the forward and reverse primers, 0.5 µl of cDNA (200 ng/µl), 0.15 µl of 50 × ROX reference dye, and 5.85 µl ddH2O. The qRT-PCR reaction conditions were conducted according to the manufacturer instructions (TIANGEN Biotech CO,. LTD, Beijing). The qRT-PCR data acquisition and analyses were performed using QuantStudio™ Real-Time PCR Software (ThermoFisher Scientific). The relative expression level was computed by using the 2−ΔΔCt analysis method (Livak & Schmittgen, 2000). Data were analyzed, and graphs were drawn using Microsoft Excel 2013. Standard deviations are indicated by error bars and significant differences are indicated with “*” (P < 0.05) or “**” (P < 0.01). Primers were designed by Oligo v7 software (Rychlik, 2007) and are listed in Table S1.
Results
Identification and classification of ZmERF TF subfamily in maize
To identify maize ERF TFs, a Hidden Markov Model (HMM) search was conducted using the HMM profile of the AP2 domain (PF00847) as a query against the maize genome protein sequences. A total of 191 putative ERF TFs were discovered in the maize genome. Subsequently, all putative TFs were determined to check the number of AP2 domains in the encoded proteins using the SMART and NCBI CDD program. Finally, a total of 157 genes contained a single or partial AP2 domains were obtained. To differentiate the DREB and ERF subfamily members, multiple sequence alignment was performed, and the conserved AP2 domains were obtained. As shown in Fig. S1, all DREB and ERF subfamily members were highly conserved in AP2/ERF regions. A pervious study showed that the amino acid motif, AAEIRD, is a clear characteristic of ERF subfamily members (Sakuma et al., 2002). Therefore, after sequence alignment, the putative ERFs that did not contain the AAEIRD motif in the AP2/ERF regions were eliminated. Thus, there were 76 encoded ERF TFs and 81 encoded DREB TFs.
All CDS of ERF subfamily members were verified by Expressed Sequence Tags (ESTs) in the NCBI database (https://blast.ncbi.nlm.nih.gov/Blast.cgi). All predicted ZmERF TFs were named from ZmERF1 to ZmERF76 based on their chromosomal orders. They were unevenly distributed on the 10 chromosomes (Fig. 1). Chromosome (Chr) 4 and Chr 7 were the two largest chromosomes with 10 ZmERFs, while Chr 9 was smaller with 3 ZmERFs. The length of ZmERF proteins ranged from 183 (ZmERF44) to 1,425 amino acids (ZmERF24). The pI s ranged from 4.44 (ZmERF11) to 10.46 (ZmERF46). Subcellular location prediction was predicted online by CELLO and results indicated that most of them (71/76) were located in the nucleus. Detailed information on the 76 ZmERF TFs is listed in Table S2.
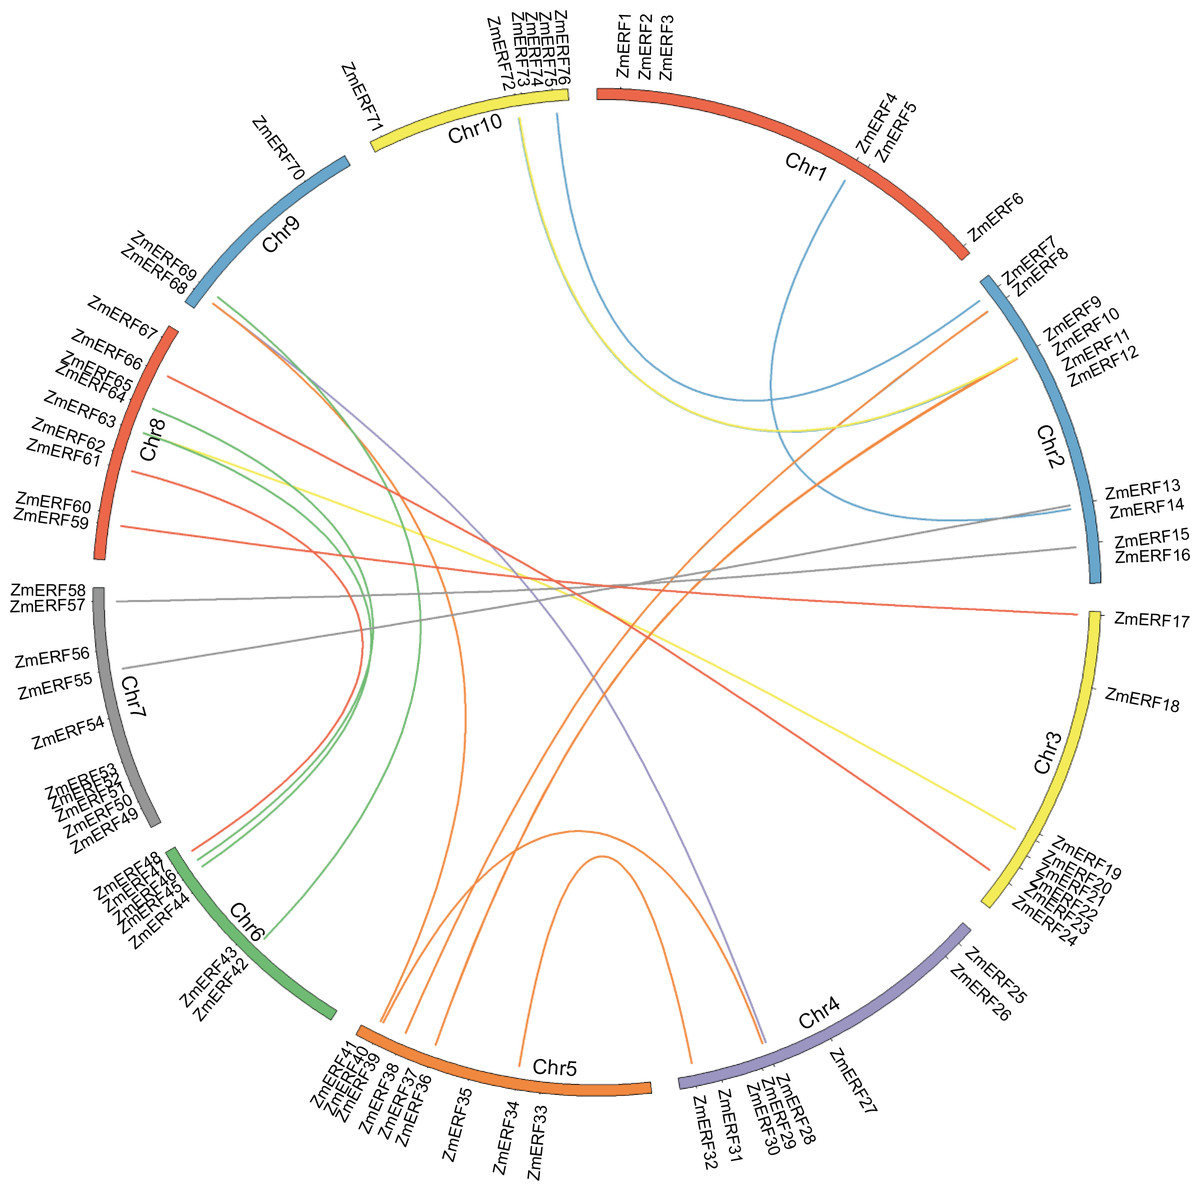
Figure 1: Chromosome location and duplication of ZmERF genes on maize chromosomes.
Chromosomes of maize were colored in different color, and the connecting lines indicate duplicated gene pairs.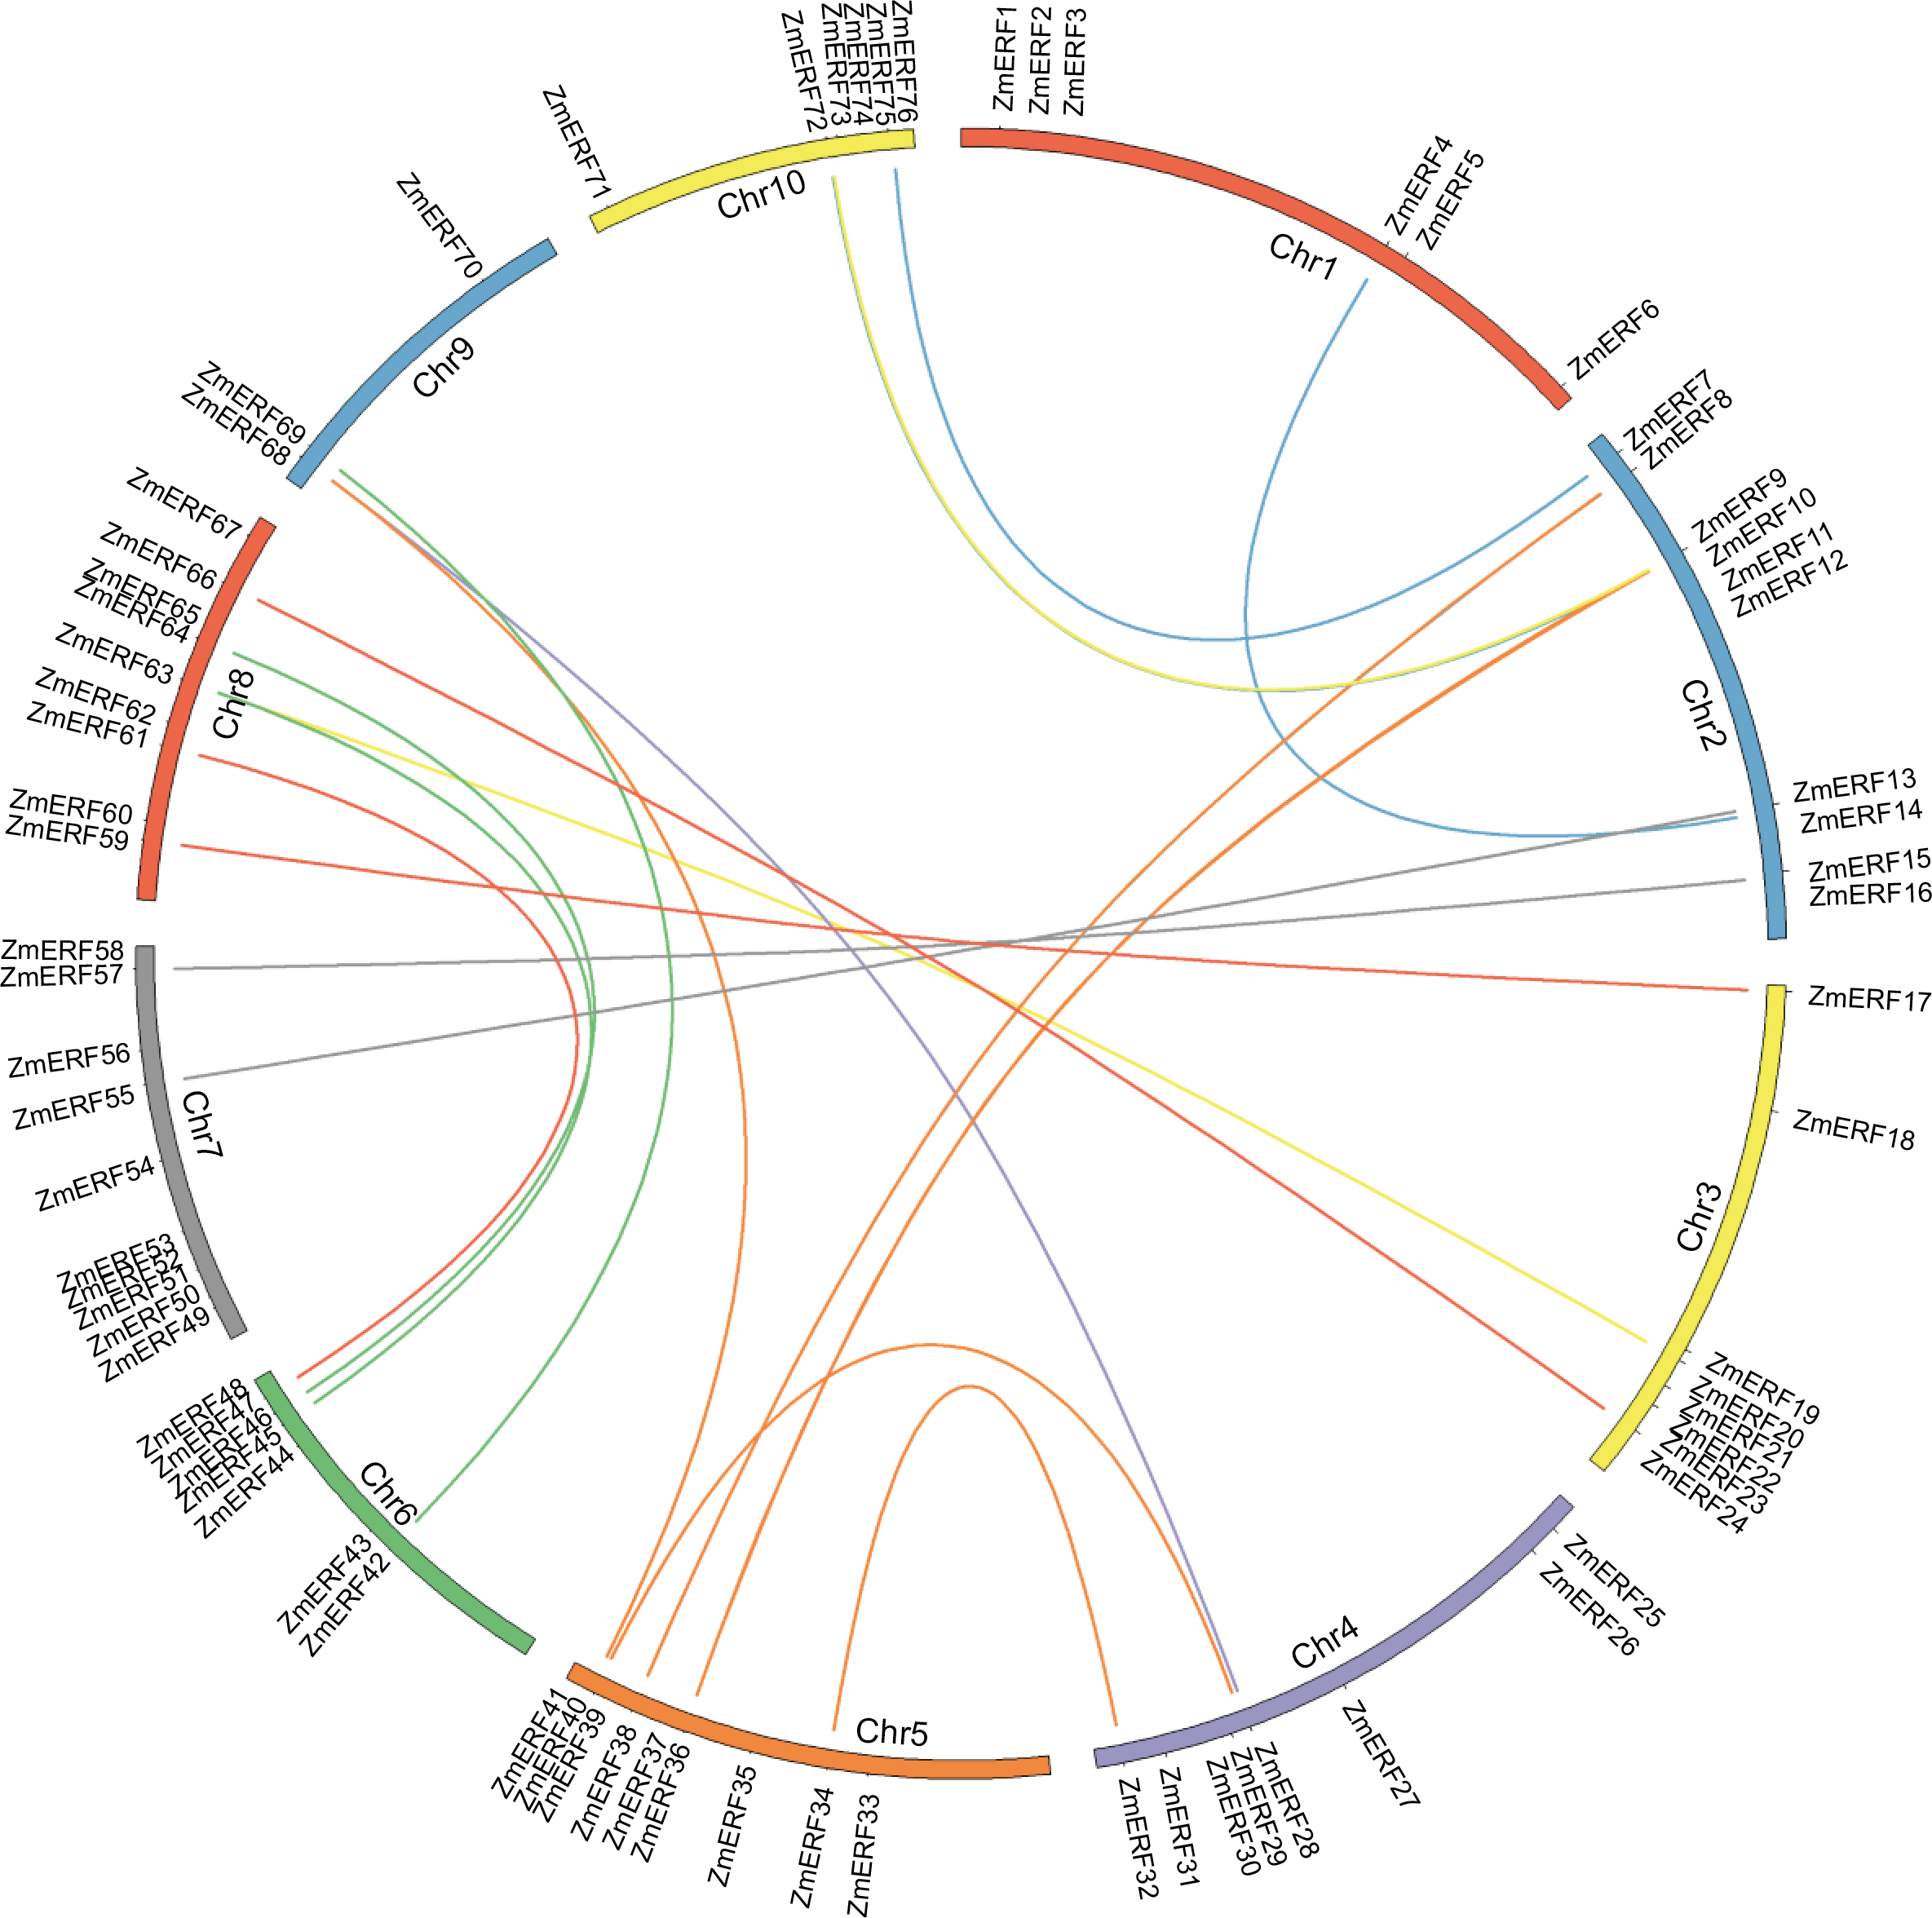
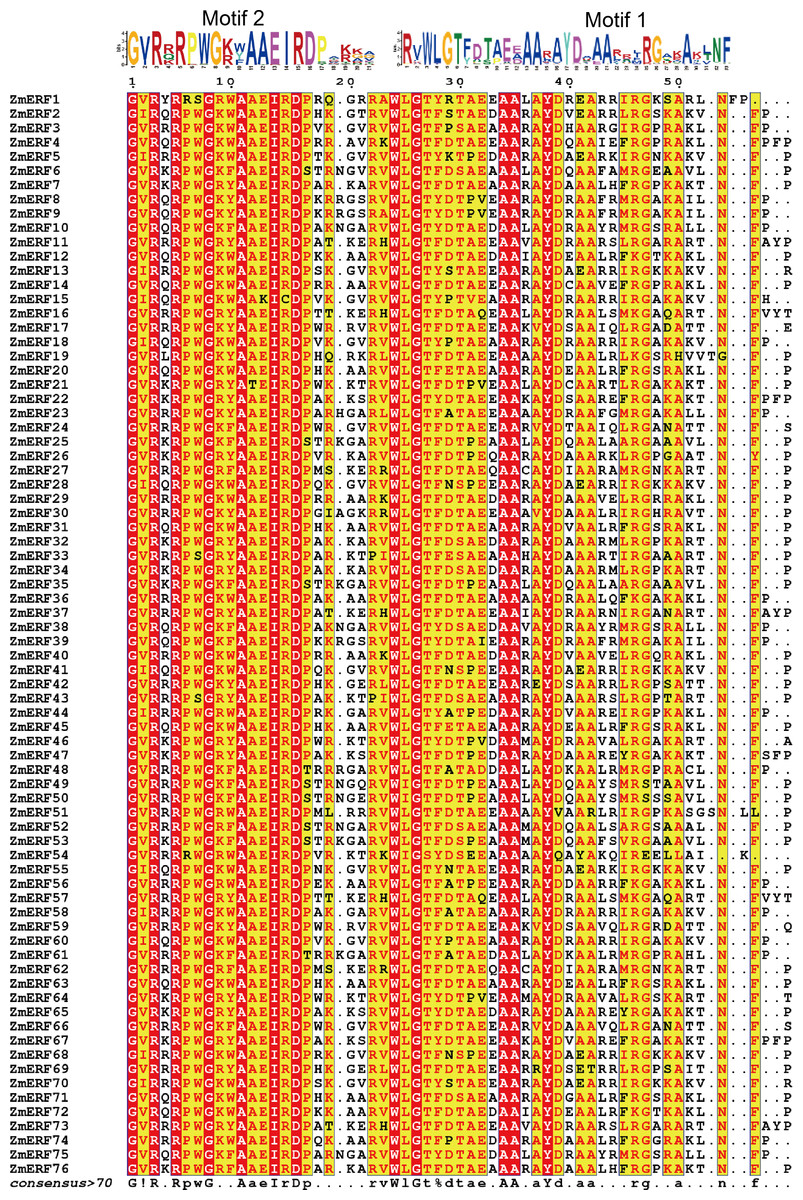
Figure 2: Sequence alignment of the AP2 domains in the 76 ZmERF TFs.
Residues were marked by red indicated 100% conservation; motif 1 and motif 2 constituted the AP2 domain.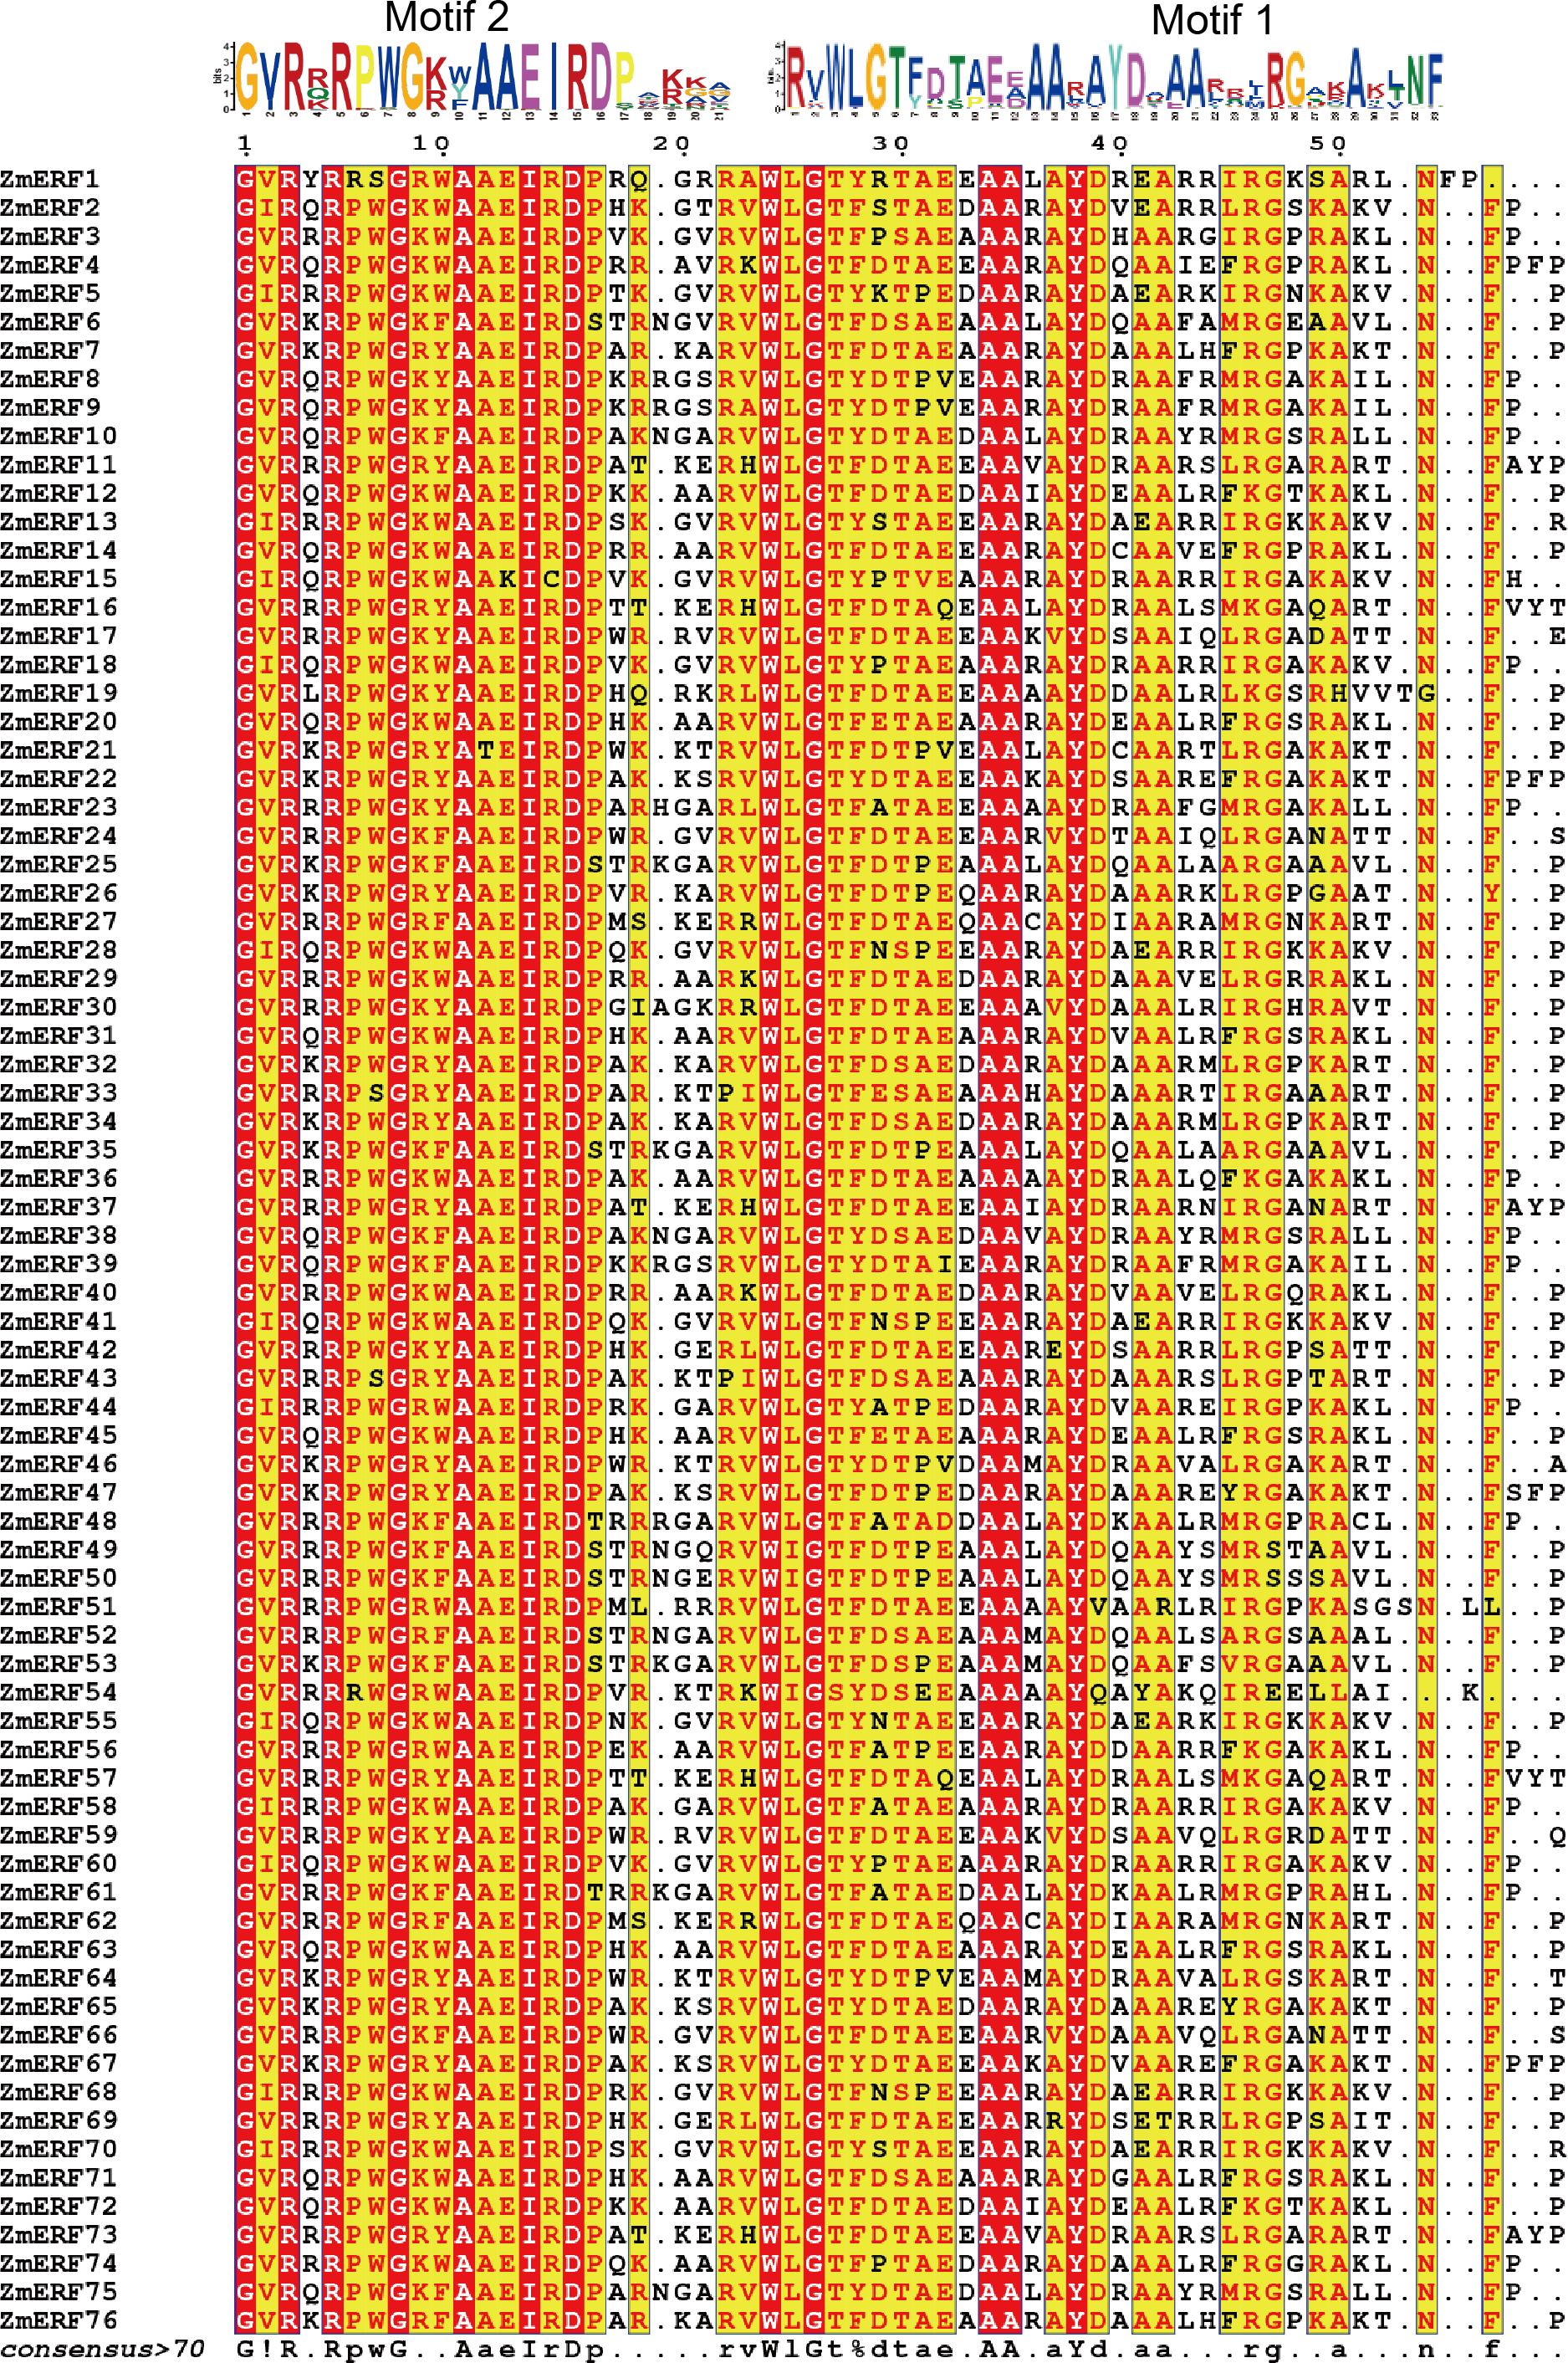
Sequence alignment and phylogenetic relationship of ZmERFs
The AP2 domain is a gene structural feature in plant ERFs and DREBs, and each ERF and DREB member contain a single AP2 domain. To further analyze maize ERF subfamily TFs, the full-length protein sequences of ZmERFs were aligned by using the T-COFFEE method (Notredame, Higgins & Heringa, 2000). Results showed that AP2 domains were highly conserved in the maize ERF subfamily TFs (Fig. 2). There were invariant amino acids in the AP2 domains, including three glycine residues (G), two arginine residues (R), three alanine residues (A), one isoleucine residue (I), one aspartic residue (D), one tryptophan residue (W), and one tyrosine residue (Y), and they were 100% conserved inside the AP2 domains of maize ERF subfamily members. We also aligned the maize ERF and DREB subfamily members. Only three residues (G-26, A-34, and A-35) were 100% conserved in the AP2 domains (Fig. S1). Based on corresponding alignment, a stringent motif (GVR[RQK]RPWG[KR][WYF]AAEIRDPA[KR][KG][AGV]) was recognized in the ZmERF subfamily members. Multiple sequences of 13 known ERF subfamily genes also showed that the AAEIRD motif is highly conserved in the AP2 domains (Fig. S2), further indicated that the AAEIRD motif is the signature of ERF subfamily members. Moreover, sequence alignment showed that there were 14 ZmERF TFs (ZmERF7, -21, -22, -26, -32, -33, -34, -46, -47, -58, -63, -64, -65, and -76) that contained the ERF-associated amphiphilic repression (EAR) motif [(L/F)DLN(L/F)xP], which is essential for ERF TFs to repress ethylene biosynthesis (Zhang et al., 2013).
To understand the evolutionary relationship of ERF TFs in Arabidopsis, rice, and maize, un-rooted NJ and ML phylogenetic trees were constructed based on the alignment of ERFs. The NJ tree (Fig. 3) and the ML tree (Fig. S3) were consistent. We classified these ZmERFs into six groups that were named B1-B6 based on the bootstrap values. Additionally, an un-rooted NJ phylogenetic tree of ZmERF TFs was also constructed (Fig. 4A). Results showed that group B1 was the largest group with 21 members, while group B4 was the smallest with 7 members.

Figure 3: Neighbor-joining (NJ) tree of Arabidopsis, rice, and maize ERF subfamily members.
The blue stars indicate the maize ERF genes.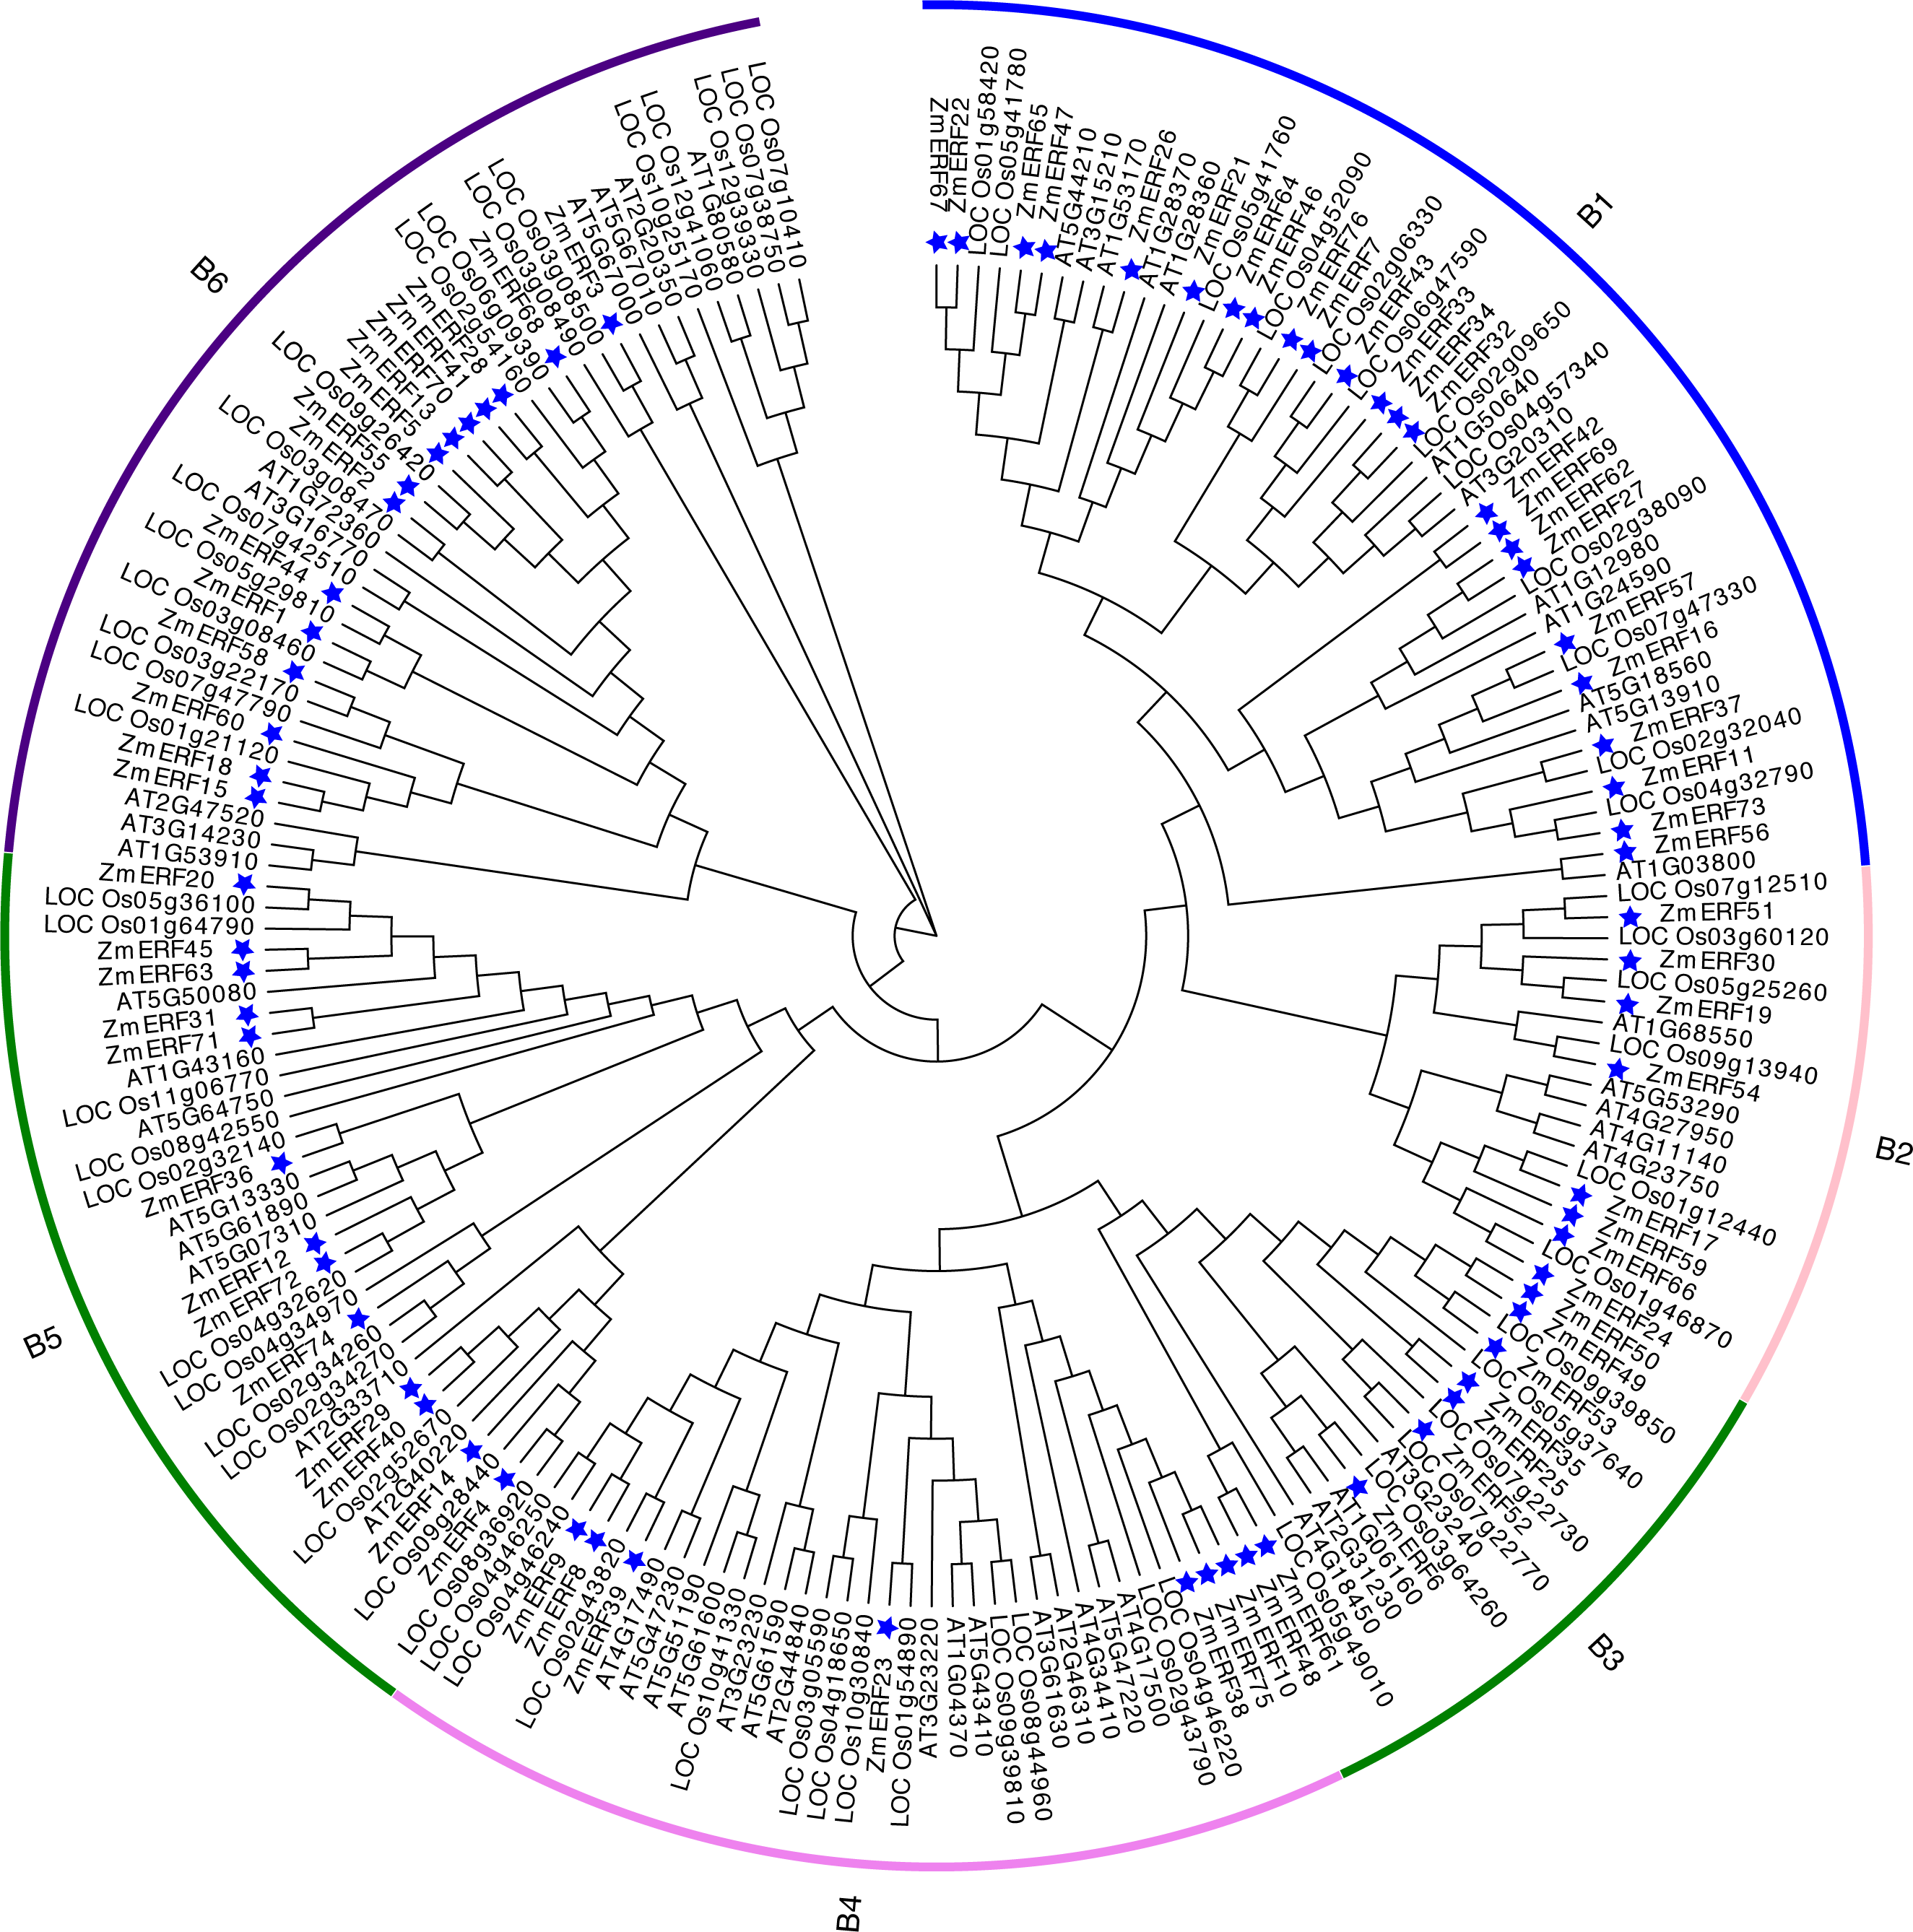

Figure 4: (A) Phylogenetic relationships, (B) gene structures, (C) conserved motifs, and (D) cis-elements of ZmERFs.
In (A) maize ERF subfamily members are classified into six subgroups; (B) exons and introns were indicated by light dark grey boxes and dark grey lines, respectively, and UTRs were indicated by grey boxes; (C) conserved motifs were displayed in different colors; (D) lowecase letters a-i indicate Sp1, G-Box, O2-site, ABRE, as-1, ARE, DRE core, LTR, MBS cis-elements in the promoter of ZmERF genes.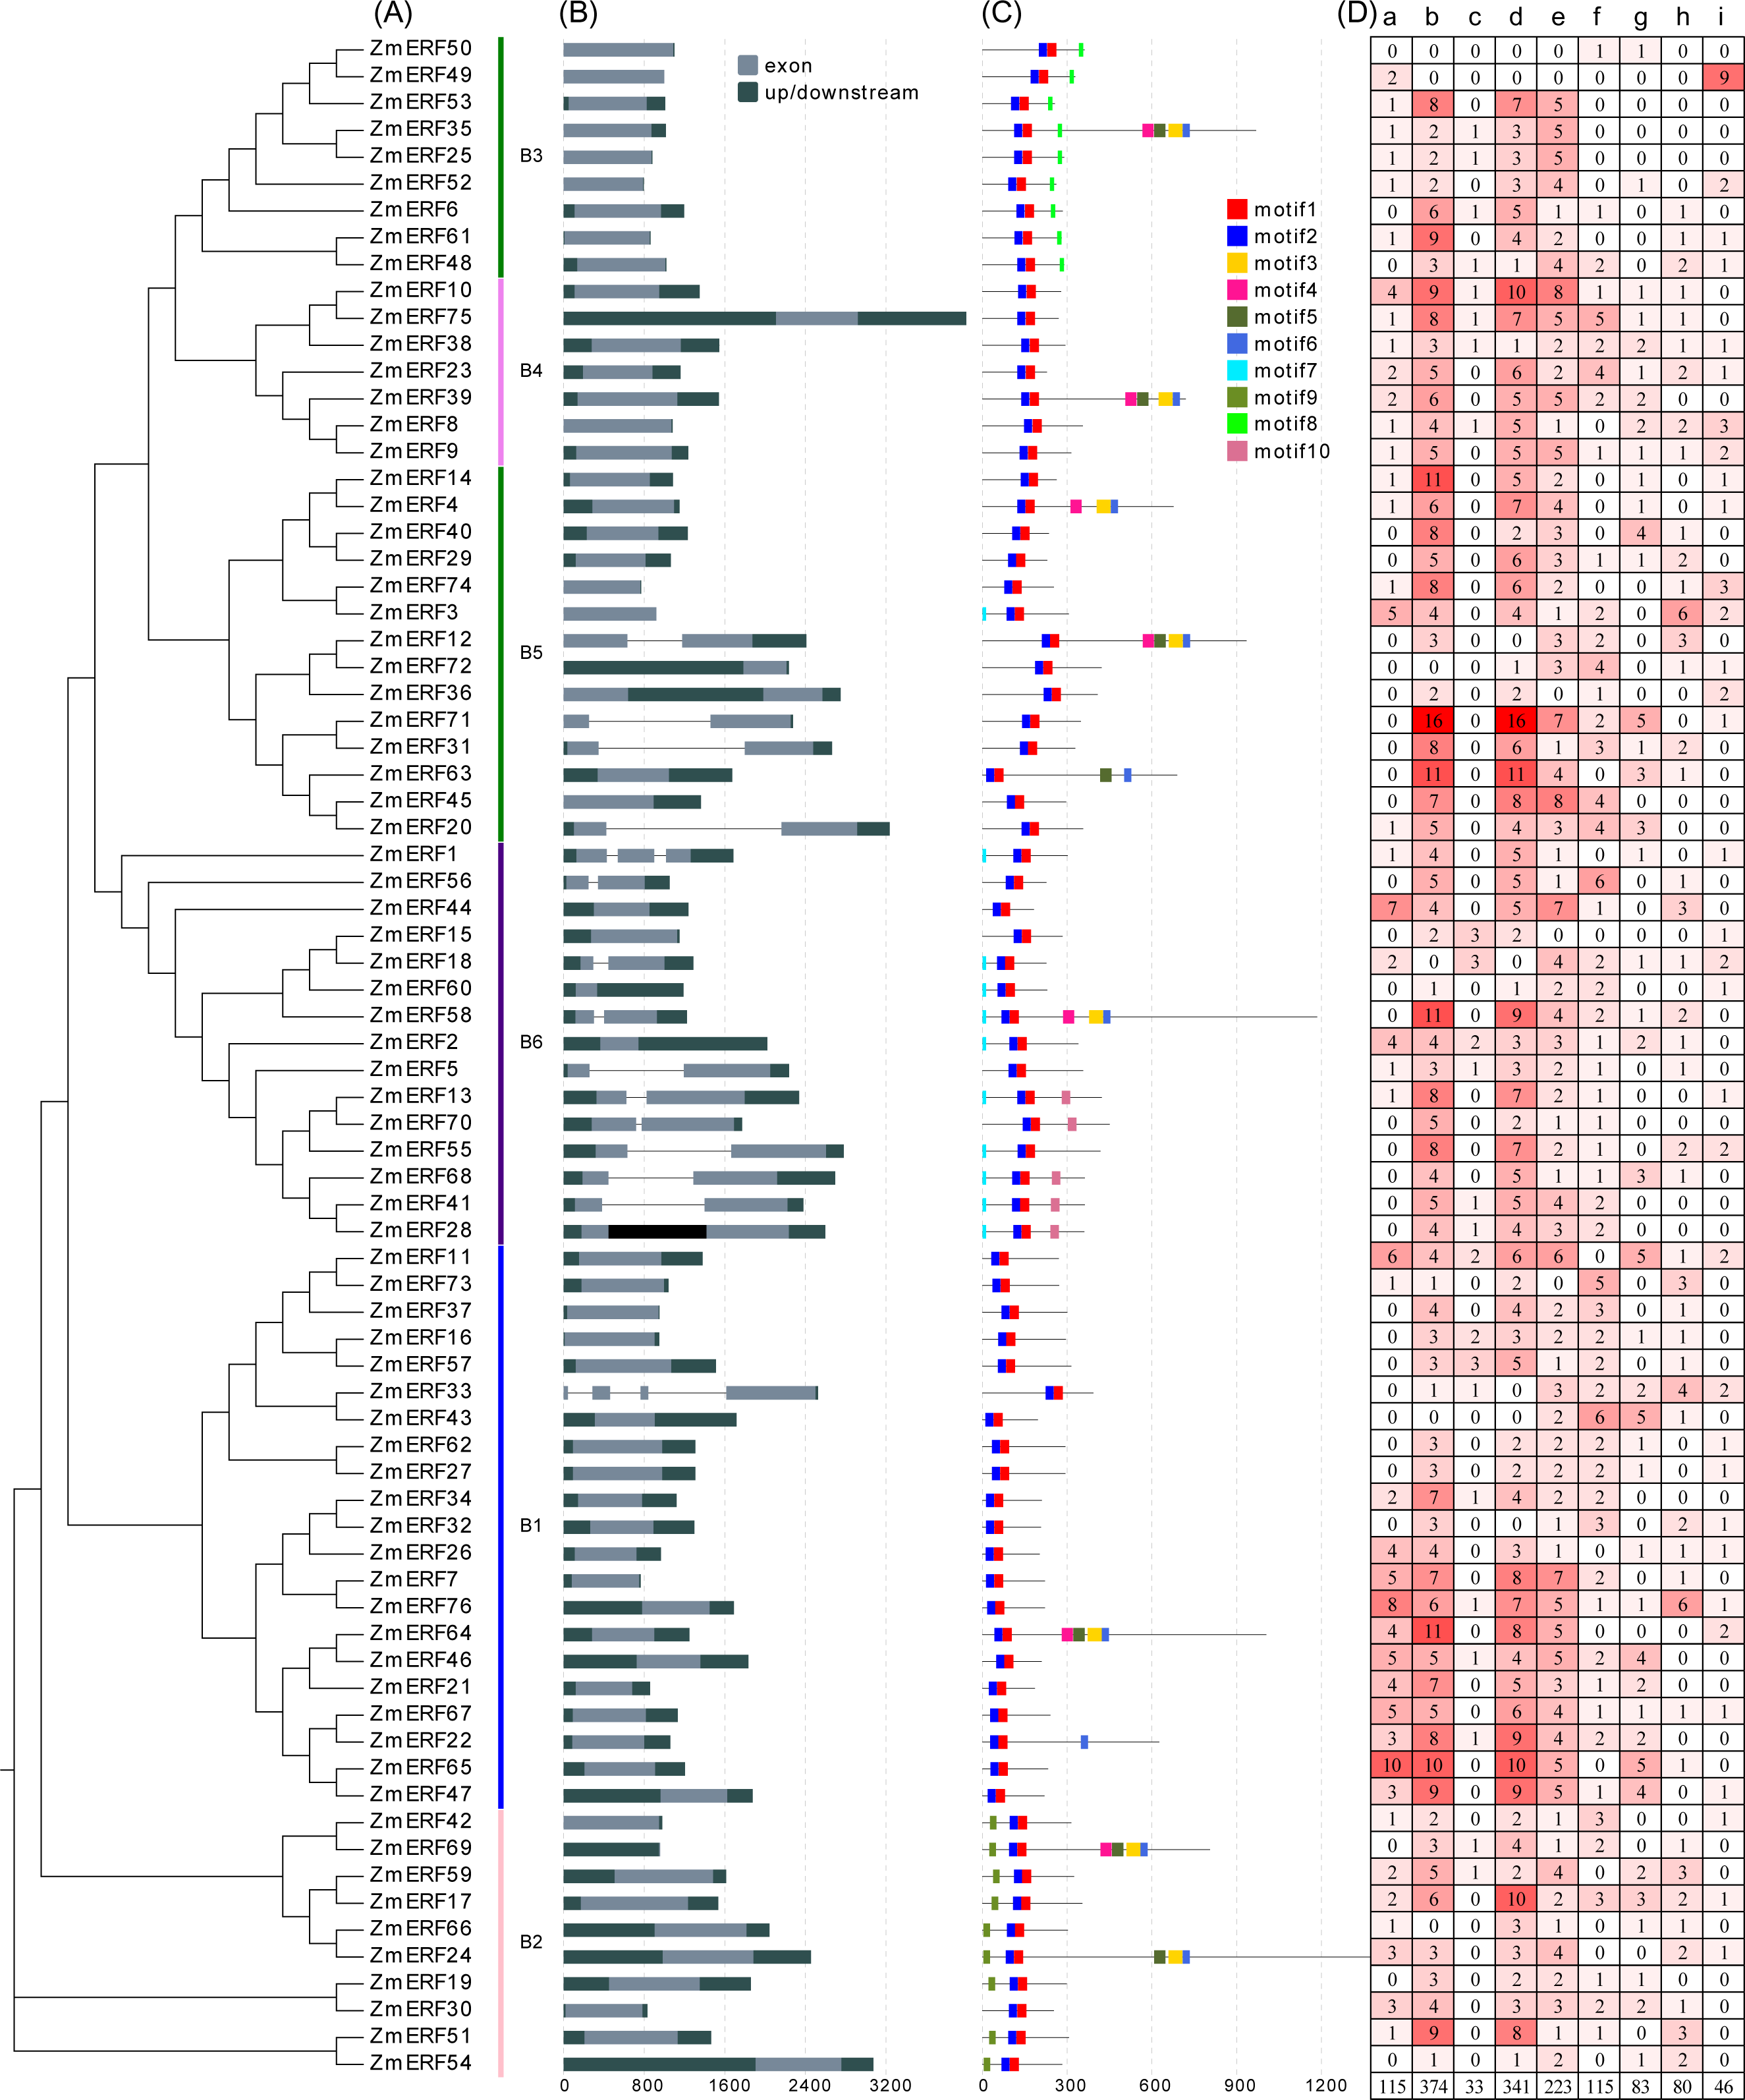
Gene structure and conserved motif analyses
Gene structure can help to understand ERF gene evolution. As shown in Fig. 4B, the number of exons of ZmERF genes varied from one to four. Except for 15 ZmERF genes with 2 or more exons, other members only had one exon. In general, members of the same family might share similar gene structures. For example, all group B2, B3, and B4 members contained only one exon, and most group B6 members had two exons.
We further predicted the conserved motifs of ZmERF proteins. As shown in Fig. 4C, 10 motifs were identified. All ZmERF proteins had motif 1 and motif 2, and these two motifs constituted the AP2 domain (Figs 2 and 4C). Motif 7 and 9 were only found in group B2, while motif 8 was only identified in group B3. The consensus sequences of these motifs are given in: Table S3.
Gene duplication analysis
In terms of gene duplication, no tandem duplication was observed, and 37 ZmERFs (48.68%) formed 21 segmental duplication pairs that were located on 10 chromosomes (Fig. 1 and Table S4). The synteny relationship between ZmERFs and other plant species was also investigated. As shown in Tables S4 and S5, results showed that there were 0, 50, 54, and 58 ZmERF genes that showed a syntenic bias towards particular Arabidopsis, rice, Brachypodium, and Sorghum chromosomes, respectively (Table S5). The substitution rate (non-synonymous/synonymous, Ka/Ks) is an effective index to evaluate the positive selection pressure after duplication, the Ka/Ks value of each gene pair was less than 1, indicated that these genes had undergone purifying selection, which further implied that the ERFs of plants from the gramineae family had strong phylogenetic relationship.
Cis-element analysis
The cis-elements of promoter regions are related to the regulation of the gene expression patterns and functions, and they are recognized by TFs that recruit the transcriptional machinery (Todeschini, Georges & Veitia, 2014). In this study, cis-elements in the 2-kb promoter regions of ZmERF genes were searched by using the PlantCARE web tool (Magali et al., 2002). As results (Fig. 4D), three kinds of cis-elements, plant growth and development-related, and hormones-related, and stresses-related, were identified. The cis-elements related to plant growth and development include the light-responsive element Sp1 (GGGCGG) (Haidar, Dale & Harris, 1991) and G-box (CACGTC) (Giuliano et al., 1988), and metabolism regulation related element O2-site (Carlini et al., 1999). The cis-elements related to hormones and abiotic stress include the drought-inducibility element MBS (CAACTG) (Zhang et al., 2015), the ABA-responsive element ABRE (ACGTG) (Ezcurra et al., 1999), the low-temperature responsiveness element LTR (CCGAAA) (Dunn et al., 1998), and the anaerobic induction element ARE (AAACCA) (Geffers et al., 2001). Among these cis-elements, the G-Box and ABRE were the two most frequently identified cis-elements. In combination with the phylogenetic tree, these results show that the phylogenetically similar genes share identical cis-elements. For example, group B3 members ZmERF25, -35, and -52 had the same proportion of cis-elements, while group B1 members ZmERF27 and ZmERF62 harbored the same proportion of cis-elements.
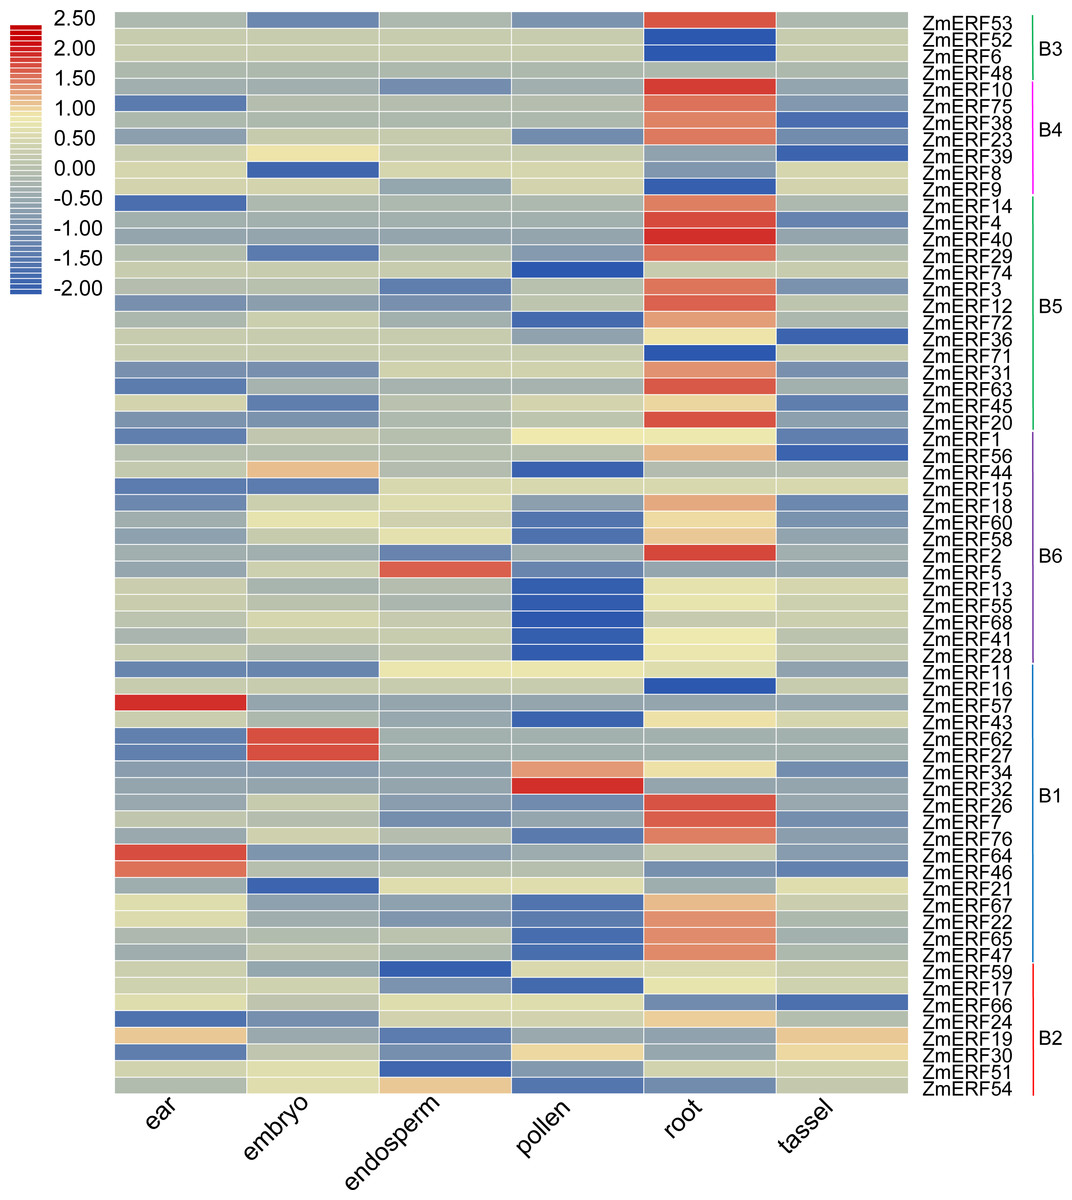
Figure 5: Expression profiles of ZmERFs in six tissues.
Transcriptome data was used to investigate expression profiles of ZmERF genes. The colour scale represents RPKM which were normalized log10 transformed counts. Blue indicates low expression and red indicates high expression.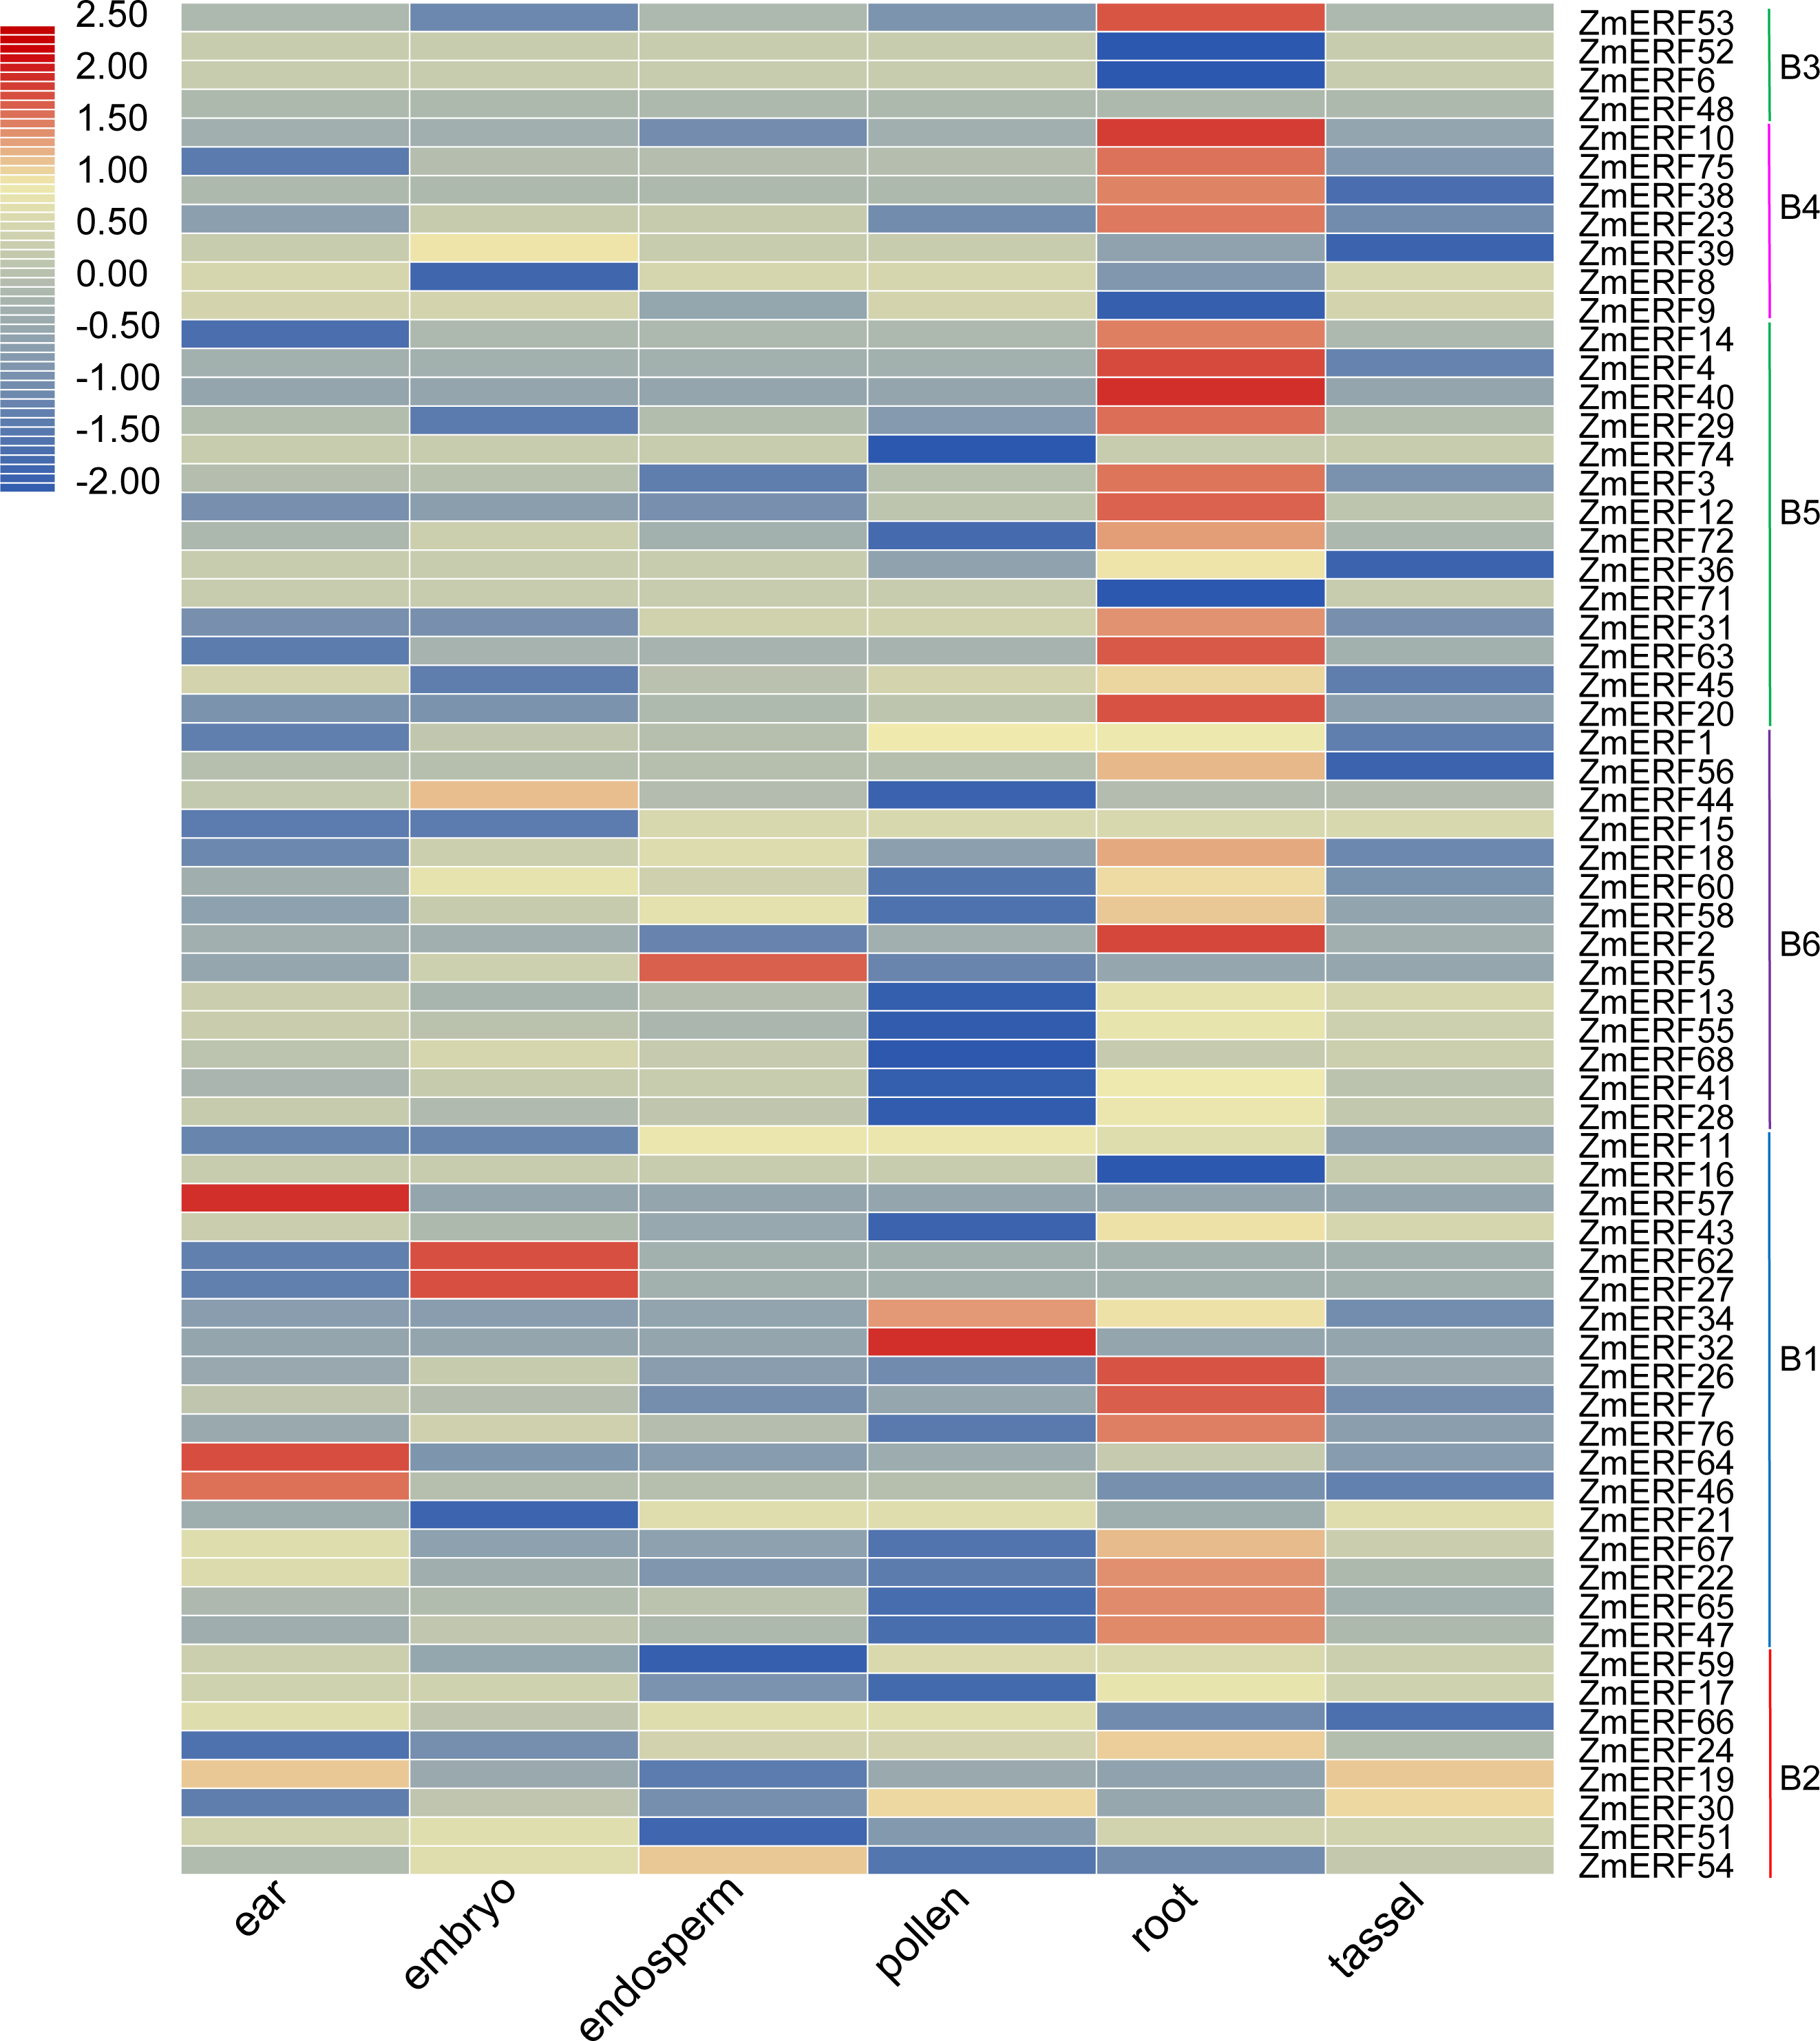
Expression profiles of ZmERF genes
We also investigated the tissue-specific expression levels of ZmERF genes in six different maize tissues based on a previous study (Wang et al., 2016). The RPKM values of ZmERF genes below 1 were considered as not expressed. As shown in Fig. 5, forty-three ZmERF genes were highly expressed in root tissues in comparison to other tissues, implying that they play a particular role in root development. Moreover, five genes (including group B1 members ZmERF19 and -59, group B2 members ZmERF46, -57 , and -64) were highly expressed in ear tissue, eight (ZmERF15, -27, -39, -44, -51, -62, -66, and -68) in embryo tissues, three (ZmERF5, -9, and -54) in endosperm tissue, and five (ZmERF1, -30, -32, -34, and -74) in the pollen. The expression of the same group shared similar expression. For example, most of group B3, B4, and B5 members were found to be specifically expressed in root tissue; many ZmERF genes (12/14) in group B6 had low expression level or not expressed in the pollen tissue. These results suggest that these genes might have important roles in plant growth and development.
We also investigated their expression patterns by using the high-throughput data of maize under drought, salt, and drought and salt combination treatment on the basis of previous study (Lunardon et al., 2016). As a result, all of the ZmERF genes were detected (Fig. 6). Many genes were identified as differentially expressed genes by using the fold change method (log10-bias ratio) with more than two folds as criterion. After 10 days of growth under drought, salt, and drought and salt combination stress (T0), we characterized 22 (21 up-regulated, 1 down-regulated), 11 (4 up-regulated, 7 down-regulated), and 13 (6 up-regulated, 7 down-regulated), differentially expressed ERF genes were characterized, respectively (Table S6). In addition, 9 (7 up-regulated, 2 down-regulated), 31 (16 up-regulated, 15 down-regulated), and 38 (18 up-regulated, 20 down-regulated) genes were identified under drought, salt, and drought and salt combination stress, respectively, after seven days of post-treatment recovery (T7) (Table S6). In total, 56 differentially expressed genes were identified and only one ZmERF gene (ZmERF31) was commonly differentially expressed under all three stress condition for ten days (T0), and five (ZmERF9, -33, -38, -63, and -72) were commonly differentially expressed after seven days of post-treatment recovery (T7). Differentially expressed genes in the same group showed similar expression profiles at some level. For example, 10 of 11 ZmERF genes (except for ZmERF72) in group B5 were up-regulated after 10 days of growth under drought stress (Drought_T0); 3 of 4 genes in group B4 and 5 of 10 genes in group B5 were up-regulated under salt stress after seven days of post-treatment recovery (Salt_T7); majority (7/10) of group B1 genes were down-regulated under drought stress after seven days of post-treatment recovery (drought&salt_T7). However, no simultaneously differentially expressed genes were found under these six treatments, which indicates the complicated influence of drought and salt on plants, and further suggests that the expression levels of ZmERF genes were altered by different stress.
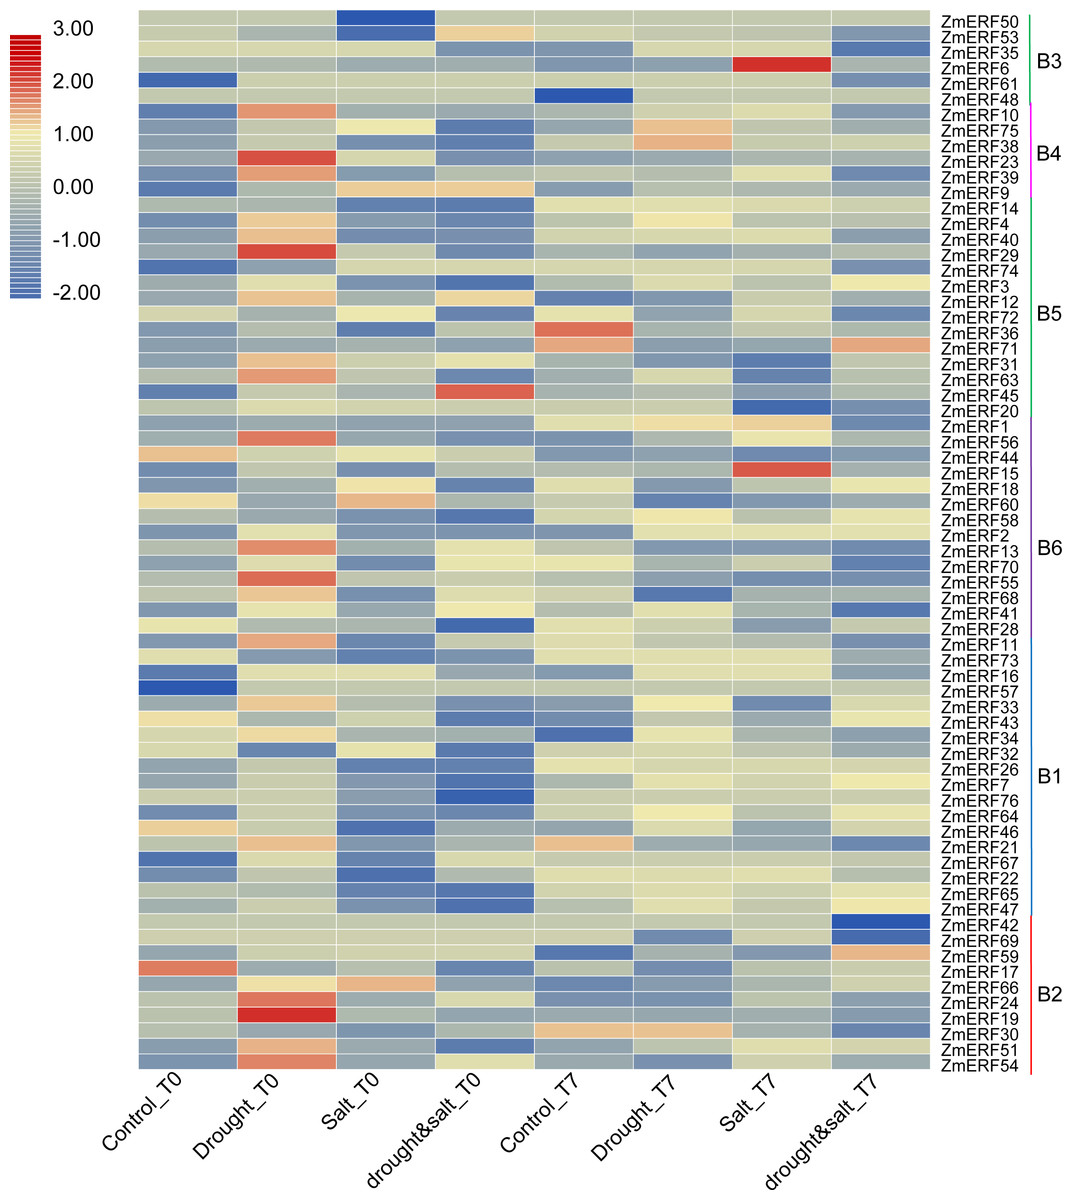
Figure 6: Expression profiles of ZmERFs under drought, salt, drought and salt combination treatments.
Transcriptome data was used to investigate expression profiles of ZmERF genes. The colour scale represents RPKM which were normalized log10 transformed counts. Blue indicates low expression and red indicates high expression. T0 and T7 indicate ten days of treatment and seven days of post-treatment recovery respectively.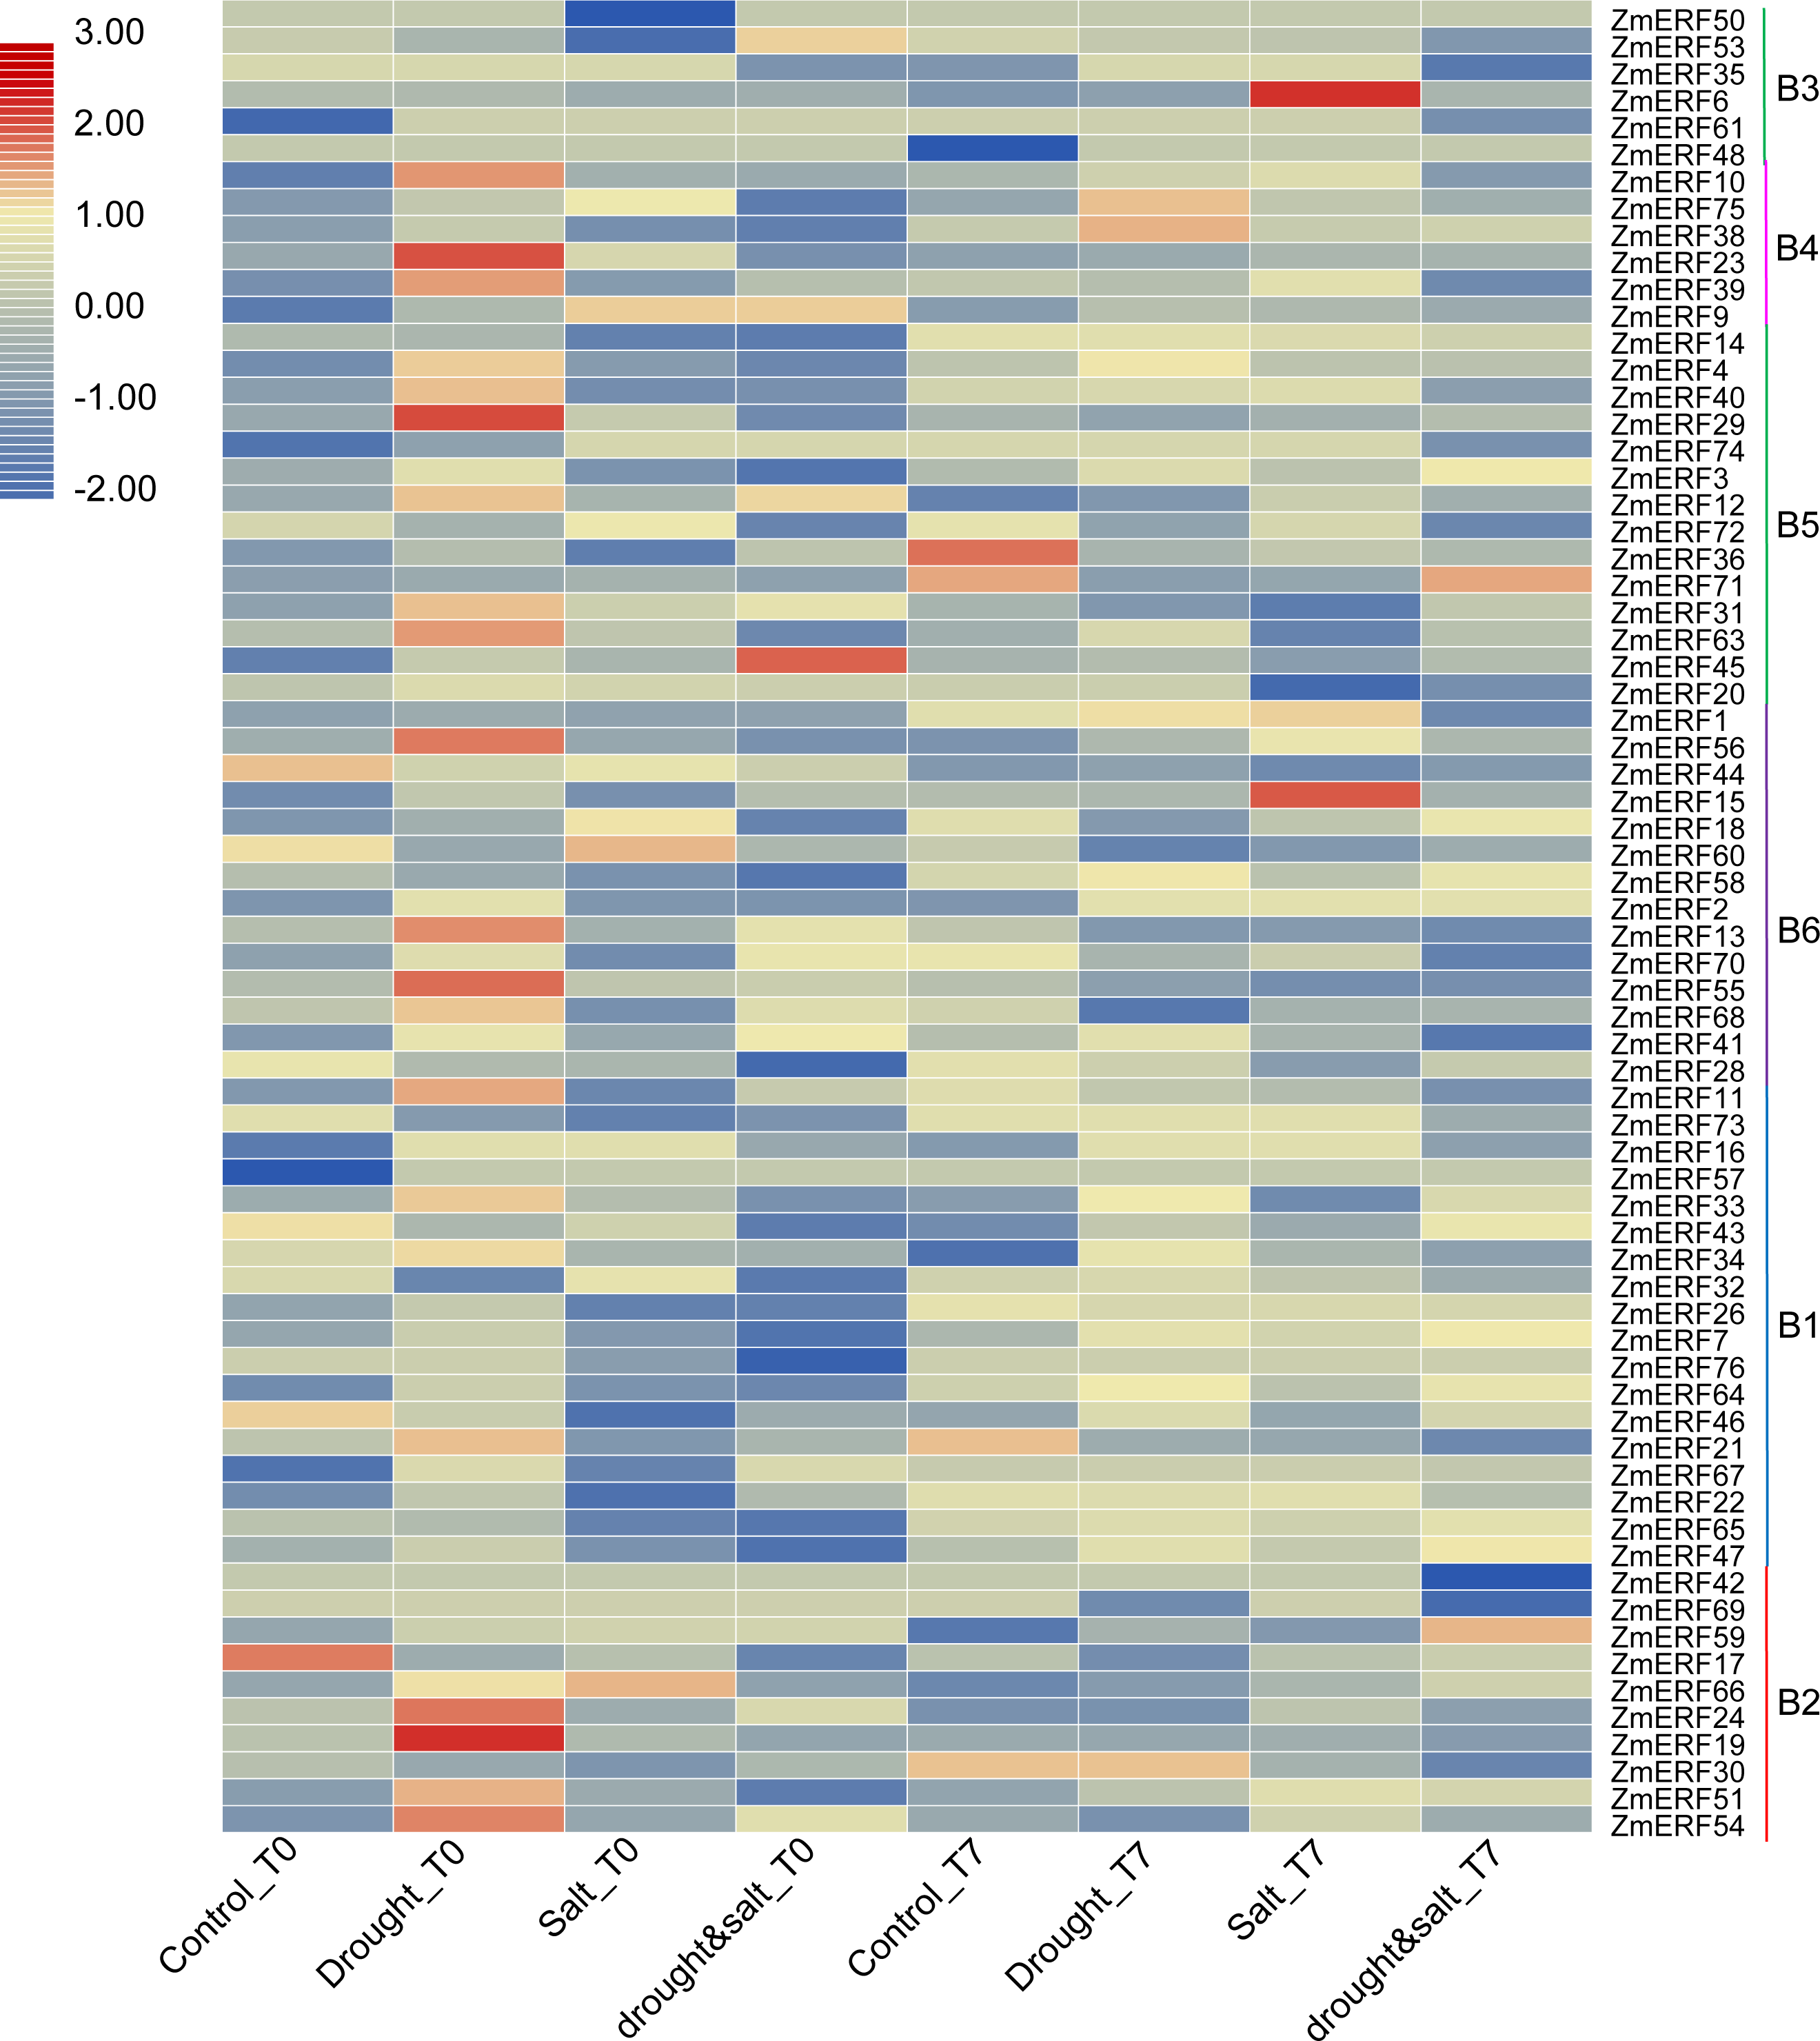
Furthermore, we performed qRT-PCR to analyze the expression patterns of 14 randomly selected ZmERF genes under salt and drought treatment. Results showed that all of them were induced by 200 mM NaCl and 20%PEG6000 (Fig. 7). Under salt treatment (Figs. 7A–7N), the expression levels of ZmERF13, -34, -51 increased after 3 h and then decreased slightly compared to control (0 h); the expression levels of ZmERF19, -32, and -55 were gradually up-regulated and finally decreased at 12 h; and the expression levels of ZmERF20, -63, and -75 were gradually up-regulated and finally peaked at 12 h. However, ZmERF22, -28, and -47 were down-regulated after salinity treatment. Using the fold change method (log10-bias ratio) with more than two folds as criterion, some of the ZmERF genes were differentially expressed. For example, ZmERF10, -13, -20, -34, -47, -63, and -72 under salt stress for 3 h. Under drought treatment (Figs. 7O–7AB), the expression levels of ZmERF10, -13, -19, -20, -55, and -63 increased after 3 h compared to 0 h, and ZmERF75 increased at 6 h. ZmERF47 was gradually up-regulated while ZmERF72 was down-regulated after drought treatment. However, the expression levels of ZmERF28 and -32 were not significantly regulated after drought stress. There were only two genes, ZmERF10 and -63, that were differentially expressed under drought stress for 3 h. Compared to other time-points, the expression levels of 3 h under salt and drought stress were significantly altered.
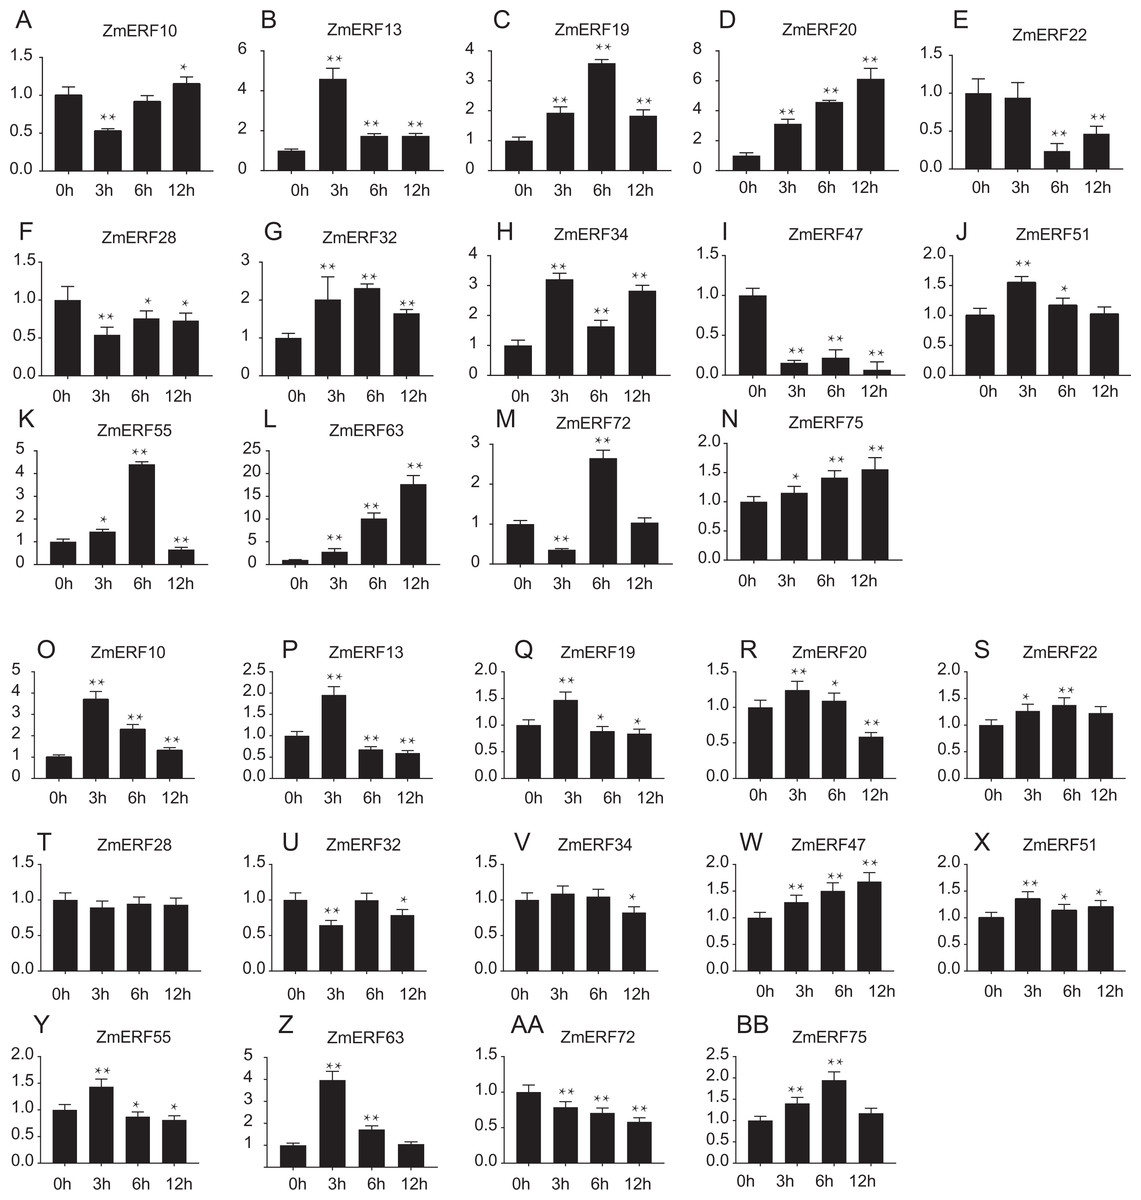
Figure 7: Expression patterns of 14 selected ZmERF genes under (A-N) salt and (O-AB) drought treatment.
The horizontal axe indicates different time points in 0 (control), 3, 6, and 12 h after (A–N) salt or (O–BB) drought treatment, the verticals axe stands for the relative expression level. Error bars represent standard deviations, and statistically significant differences are indicated: *, P < 0.05; **, P < 0.01 (Student’s t-test).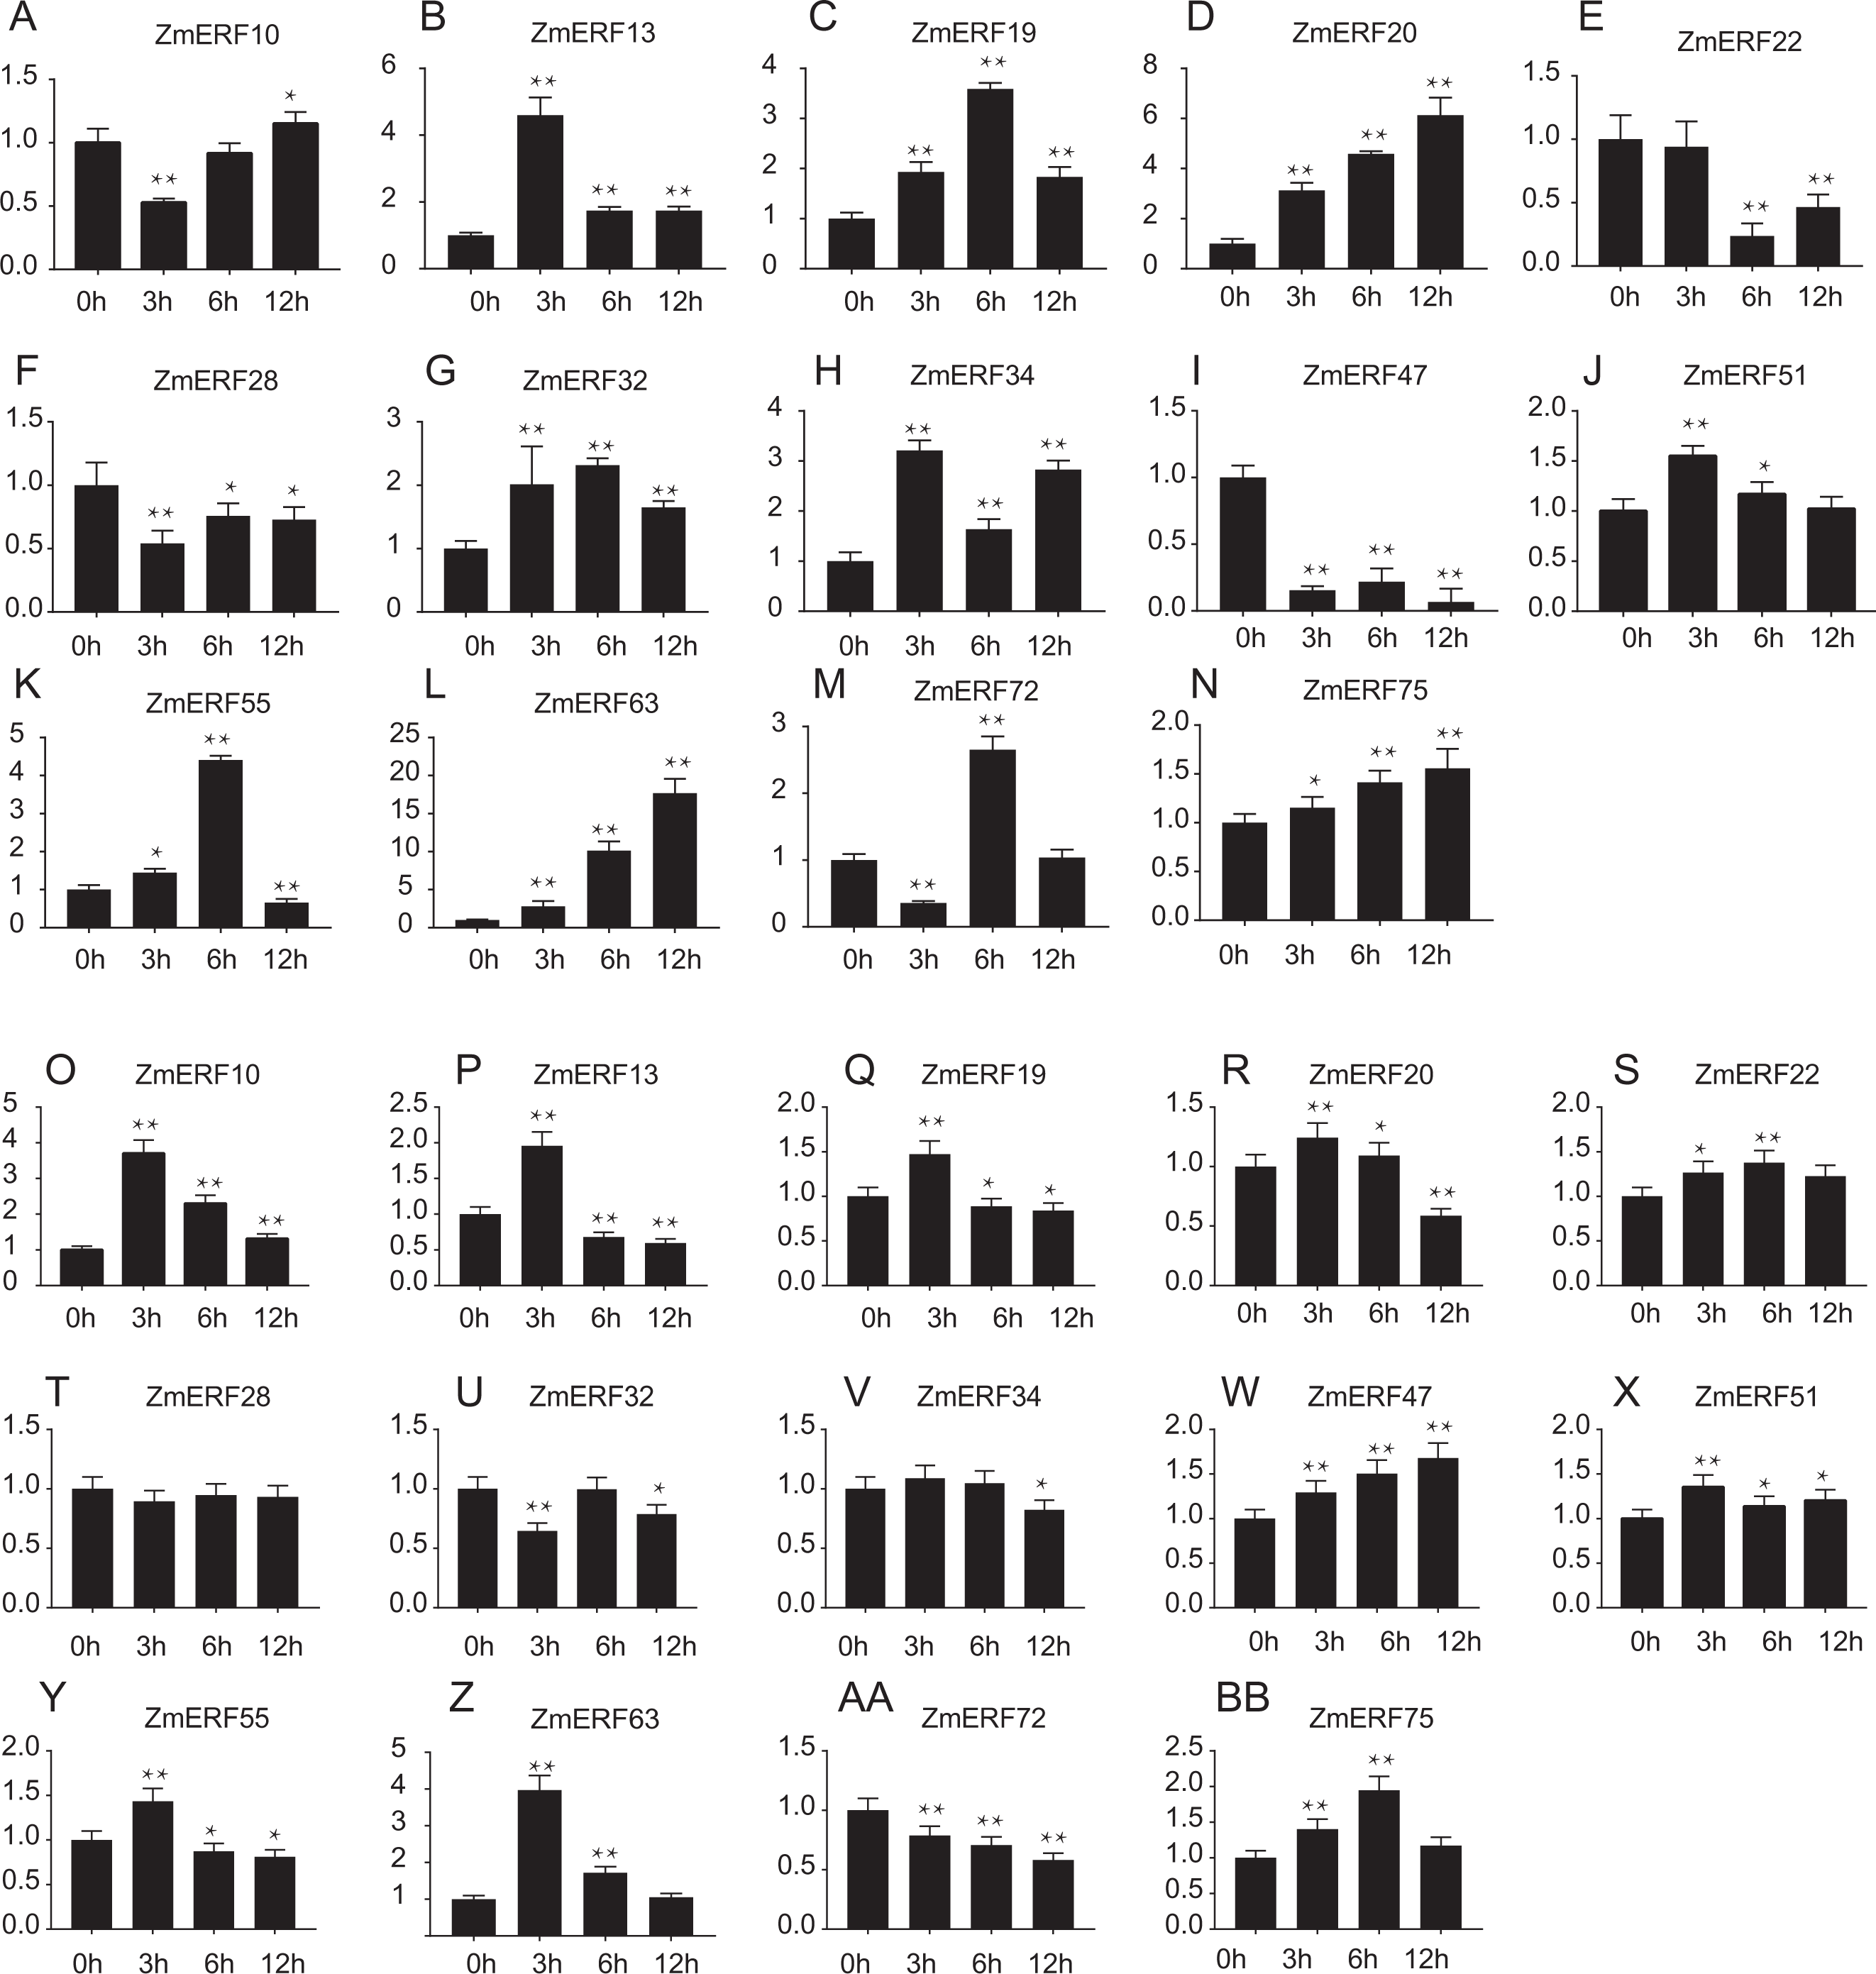
Discussion
The characteristics of ERF subfamily TFs
The ERF and DREB subfamily TFs are characterized by a single AP2 region. However, little research has been conducted on ERF subfamily in maize. In this study, a total of 76 ZmERF TFs were identified after searched against maize genome protein sequences and all of them were validated by ESTs in the NCBI database. Phylogenetic analyses revealed that the ZmERFs were classified into six groups, with group B1 being the largest with 21 members, and group B4 was the smallest with 7 members. In combination with the phylogenetic tree, the phylogenetically similar ZmERF shared similar gene structures, conserved motifs, and cis-elements.
Compared to DREB subfamily members, there is a clear characteristic of maize ERF subfamily members in the region corresponding to the second β-strand, which is an AAEIRD motif. A pervious study has shown that the AAEIRD motif only occurs in the Arabidopsis ERF subfamily members (Sakuma et al., 2002). In this study, all maize ERFs and 13 known plant ERF subfamily members contained a single AP2 domain and all of them contained an AAEIRD motif within the AP2 domain, further confirmed that the AAEIRD motif is conserved in plant ERF subfamily members. The conserved motif analysis showed that the motif pattern (GVR[RQK]RPWG[KR][WYF]AAEIRDPA[KR][KG][AGV]) was the AP2 domain among these 76 ZmERFs.
Gene duplication can lead to generate a large number of novel genes (Li et al., 2013). In this study, no tandem duplication was found and 21 segmental duplication pairs were identified in the maize genome. Also, the Ka/Ks of all gene pairs were less than 1, suggesting that these genes had evolved under strong purifying selection. Synteny analysis also showed that the ERF genes of monocots have strong synteny relationships.
The functions of ERF subfamily members
The EAR motif [(L/F)DLN(L/F)xP] is specifically identified in most plant ERF subfamily members and found to involved in repression function of these TFs (Nakano et al., 2006; Zhao et al., 2019b). In plants, the EAR motif of wheat Q protein and rice OsERF3 protein are found to repress transcriptional activity (Liu et al., 2018; Xie et al., 2018; Zhang et al., 2013). In this study, there were 17 ZmERF TFs that contained the EAR motif, indicating that they might be essential for transcriptional repression activity of target proteins.
Studies also showed that many ERF subfamily TFs bind to the GCC-boxes (GCCGCC) and are involved in hormone responses (Fujimoto et al., 2000; Mantiri et al., 2008; Oñate Sánchez & Singh, 2002). For example, rice OsERF922 binds to the GCC-box and acts as a transcriptional activator in plant cells (Liu et al., 2012). In maize, ERF gene branched silkless1 (ZmERF57 in this study) regulates meristem identity from lateral domains of the spikelet meristem (Chuck et al., 2002) and maize ERF1 (ZmERF60 in this study) in response to hormones via ethylene and ABA signaling pathways (Shi et al., 2016). In this study, genes in the same group shared similar expression. For example, most of the group B3, B4, and B5 members were found to be specifically expressed in root tissue; two group B1 members ZmERF19 and -59 and B2 members ZmERF46, -57, and -64 were highly expressed in ear tissue; group B1 members ZmERF32 and -34 showed high expression level in the pollen tissue, these results implying that they play a particular role in plant development, further indicating that their functions are conservative to some extent. Cis-element analyses demonstrated that cis-elements related to hormone and abiotic stress are found in the promoter of ZmERF genes, further suggesting the probable function of ZmERF genes in response to environmental stress.
Most ERF subfamily TFs facilitate tolerance against environmental stress, such as drought, high salinity, and extreme temperatures (Fujimoto et al., 2000; Park et al., 2001). For example, soybean GmERF135 was extremely up-regulated by drought, overexpression of GmERF135 in Arabidopsis enhanced tolerance to drought condition (Zhao et al., 2019a); and overexpression of rice OsERF922 exhibited decreased tolerance to salt stress (Liu et al., 2012). Consistent with GmERF135 and OsERF922, the homology genes ZmERF39 and ZmERF23 were also up-regulated by drought and salt stress, respectively, indicating that they have a function important role in drought and salt tolerance. Genome-wide expression analysis of AP2/ERF family genes in rice, soybean, tomato, and poplar reveal that many ERF TFs are induced by drought and high salinity (Oñate Sánchez & Singh, 2002; Sharoni et al., 2011; Zhang et al., 2008; Zhuang et al., 2008). In this study, high-throughput data showed that most ZmERF genes were expressed in response to drought and salt stress, 56 differentially expressed genes were identified among these stresses, and differently expressed genes in the same group had similar expression profiles at some level. For example, most ZmERFs in group B5 were up-regulated after 10 days of growth under drought stress (Drought_T0), majority (7/10) genes in the group B1 were down-regulated under drought stress after seven days of post-treatment recovery (drought&salt_T7). In addition, qRT-PCR analysis showed that ZmERF genes were induced by salinity and drought stress, and most of them were significantly regulated. For example, there were seven (ZmERF10, -13, -20, -34, -47, -63, and -72) and 2 (ZmERF10 and -63) genes that were differentially expressed and significantly regulated under salt and drought stress for 3 h, respectively. These results suggest that these genes may play important roles in response to abiotic stress, further suggesting that the expression levels of ZmERF genes were altered by stress.
Conclusions
A total of 76 ZmERF TFs were identified in the maize genome and divided into six groups. The same group members shared similar exon-intron structure and conserved motifs, most genes in the same group had similar expression patterns and shared identical cis-elements. Each ZmERF TF contained a single AP2 domain and this domain was characterized by an amino acid motif AAEIRD. Segmental duplication contributed to the expansion of ZmERFs, and these duplication pair genes had evolved under strong purifying selection. The cis-elements analysis suggested that the expression of ZmERFs was regulated by hormones and various environmental factors. High-throughput data analysis revealed that ZmERF genes were specifically expressed in different tissues and differentially expressed in different abiotic stresses. The expression profiles under salt and drought stresses by qRT-PCR analysis showed that some ZmERFs were significantly regulated, indicated their vital roles in response to salt and drought stresses. Our results provide a reference for further study of maize ERF subfamily genes.
Supplemental Information
Raw data
All plant sequences and RT-PCR raw data used in this study.
Tables S1-S6
Table S1: The primers used in this study Table S2: The detailed information of ZmERF TFs Table S3: Motif patterns of maize ERF subfamily members Table S4: Gene segmental duplication of maize ERFs Table S5: Synteny analysis of ERFs between maize and other plants Table S6: Differentially expressed genes were identified under abiotic stresses (red indicat up-regulated, blue indicates down-regulated).
Multiple sequence alignment of maize ERF and DREB subfamily members
Multiple sequence alignment of 13 known plant ERF subfamily members
There is a clear AAEIRD-motif in the AP2 domain.