
Genetic variability in Ruditapes decussatus clam combined with Perkinsus infection level to support founder population selection for a breeding program
- Published
- Accepted
- Received
- Academic Editor
- Tim Collins
- Subject Areas
- Aquaculture, Fisheries and Fish Science, Genetics
- Keywords
- Ruditapes decussatus, Selective breeding, Perkinsus infection, Genetic diversity, Microsatellites
- Copyright
- © 2020 Cruz et al.
- Licence
- This is an open access article distributed under the terms of the Creative Commons Attribution License, which permits using, remixing, and building upon the work non-commercially, as long as it is properly attributed. For attribution, the original author(s), title, publication source (PeerJ) and either DOI or URL of the article must be cited.
- Cite this article
- 2020. Genetic variability in Ruditapes decussatus clam combined with Perkinsus infection level to support founder population selection for a breeding program. PeerJ 8:e9728 https://doi.org/10.7717/peerj.9728
Abstract
Clam farmers worldwide face several challenges, including irregular seed supply and high mortalities due to pathogenic organisms such as Perkinsus olseni. In Europe, there is a high unmet consumer demand for native clam species such as Ruditapes decussatus. The high market value of R. decussatus makes the culture of this species potentially more attractive than that culture of the alien species Ruditapes philippinarum. Thus, there is a market opportunity in breeding and producing R. decussatus at an industrial scale. A selective breeding program to improve R. decussatus performance will be carried out in Portugal; and the first critical step to develop such a breeding program is the establishment of a founder population. In this study, intra- and interpopulation genetic diversity was assessed using 13 microsatellite markers in eight natural beds located in Portugal, Spain and Italy. Also, allele and genotypic frequencies of each microsatellite locus were assessed discriminating between clams infected and non-infected by P. olseni. All locations showed similar values for several genetic diversity parameters. Analyses of population differentiation (FST, Bayesian clustering and AMOVAs) revealed five genetically differentiated regions: Rías Altas and Rías Baixas (NW Spain), North/Central Coast of Portugal, Gulf of Cadiz and Adriatic Sea. Significant differences in the allelic and genotypic frequency distribution between infected clams and non-infected ones at four microsatellite loci are reported suggesting that resistance to the disease could have a genetic basis. Moreover, a positive or negative relationship between the frequency of certain alleles and the parasite infection was inferred. Further studies should confirm the potential use of those alleles as genetic markers for P. olseni infection. Integrating results of genetic diversity within and between populations and Perkinsus infection levels, a founder population for a R. decussatus breeding program is proposed, composed by individuals from Barallobre (Rías Altas), Pontevedra or Cangas (Rías Baixas), Óbidos (North/Central Coast of Portugal), Algarve (Gulf of Cadiz) and Venice (Adriatic Sea).
Introduction
Shellfish, including clams, are gastronomically much appreciated and sought worldwide, representing a very significant commercial value. In 2017, the global shellfish market (mussels, clams, oysters and scallops) represented €30.1 billion, of which the clam market corresponded to €9.77 billion (FAO, 2018). According to Top10 ranking of world production value, in 2017 the most produced species of clams in aquaculture were Ruditapes philippinarum representing 93.2%, followed by Meretrix lusoria with 3.4%, Mercenaria mercenaria with 1.5% and Ruditapes decussatus with 1.2%. Among these four species, the ones with the lowest and highest price per kg are R. philippinarum (€0.84/kg) and to R. decussatus (€9.82/kg), respectively. The grooved carpet shell, R. decussatus, spreads from southern and western England to the Iberian Peninsula, into the Mediterranean and along the Atlantic coast of Morocco and Senegal (Tebble, 1966). However, only six countries produce R. decussatus, with Italy leading followed by Portugal, Tunisia and Spain (FAO, 2013).
Worldwide, the main problems that clam production faces are the lack of constant seed supply and the drastic annual fluctuations of seed recruitment in wild beds (Da Costa et al., 2020). Moreover, clam production has been greatly affected by anthropogenic actions such as overexploitation (Castilla & Defeo, 2001), habitat loss (FAO, 2009), environmental pollution (Hong et al., 2016), alien species introduction (Moura et al., 2018) and climate change (for instance, ocean warming (Velez et al., 2017), salinity drops (FAO, 2009) and ocean acidification (Timmins-Schiffman et al., 2013; Velez et al., 2016)). Another major problem is the lack of strains resistant to infections by pathogenic organisms such as bacteria, viruses or protists (Carella et al., 2015), leading to extremely high mortality rates that can reach 80–90% (Gosling, 2008). The high prevalence of new diseases such as perkinsosis, caused by the protozoan parasite Perkinsus olseni, associated with adverse environmental conditions, is causing a severe impact in certain clam species (R. decussatus, R. philippinarum and Venerupis corrugata) and has been associated with high mortality rates in different molluskan species worldwide, resulting in severe economic losses (Casas & Villalba, 2012; Matias, 2013; Pretto et al., 2014; Ruano, Batista & Arcangeli, 2015; Waki et al., 2018).
In Europe, the first appearance of Perkinsus was in south Portugal in 1989 after high mortalities of R. decussatus were reported (Azevedo, 1989). The parasite, first named Perkinsus atlanticus, probably arrived in Europe after the introduction of the Manila clam R. philippinarum from Asia (Vilas et al., 2011). Considering the present challenges that R. decussatus production is facing, it is crucial to develop solutions that currently are not available in the aquaculture industry. To address farmers’ challenges, improved bivalve varieties that resist biotic and abiotic stress conditions need to be developed, as has been done for decades in agriculture and in fish production through selective breeding. This approach can produce new combinations of genes that can provide selected stocks with new genotypes and traits of interest (e.g., higher survival rate, higher growth rate, among others). Bivalves are good candidates for selective breeding programs for several reasons, including: their high economic value, the fact that many species are domesticated and have standard culture protocols, high levels of genetic variability, and high fecundity. Disease resistance and growth rates are the most important traits for aquaculture production (Fang & Lin, 2016; Guo, 2009; Xie et al., 2018) and there are several breeding programs in progress, in countries such as the USA, Australia, New Zealand, France and China, mainly involving oysters (Crassostrea gigas, C. virginica and Saccostrea glomerata) (Azéma et al., 2015; Gutierrez et al., 2018; Nell & Hand, 2003; Proestou et al., 2016), mussels (Perna canaliculus) (Powell, Ragg & Dunphy, 2017) and in some cases certain species of clams (R. philippinarum and Sinonovacula constricta) (Huo et al., 2017; Niu et al., 2012).
One key aspect affecting the success of selective breeding programs is the establishment of the founder population. A founder population must harbor a broad genetic diversity to avoid rapid inbreeding and to maximize the likelihood of long-term genetic response (Gjedrem & Baranski, 2009). In the present case, the presence of Perkinsus parasites in the locations of broodstock sampling should also be considered, as Perkinsus resistance it is one of the main traits to be addressed. For a selective breeding program, the choice of broodstock origins subjected to long exposure to the parasite is crucial for the creation of the founding population, because such wild clam stocks may already show reduced disease susceptibility due to natural selection. From a practical point of view, the availability of a regular supply of clams all year round is also desirable in order to avoid costs associated with sampling and transportation. In the present study, natural beds from Spain, Italy and Portugal, a country underrepresented in previous genetic studies (Arias-Pérez et al., 2016; Cordero, Peña & Saavedra, 2014), were sampled to assess both intra- and interpopulation genetic diversity using microsatellite markers. The effect of Perkinsus infection in frequencies of microsatellite alleles was also addressed. This is the first study where genetic characterization and P. olseni infection of R. decussatus natural beds are combined, and where the data obtained is used as a criterion to select the origin of a founder population for a breeding program to be carried out in Portugal.
Materials and Methods
Sample collection and biometric analysis
A sample of 399 adult specimens of R. decussatus was collected from seven different locations distributed along the Atlantic coast of the Iberian Peninsula and one from the Adriatic Sea (Table 1). Samples from the Atlantic coast are distributed in four coastal regions: Rías Altas (El Tesón, Ría de Ribadeo (RB) and Barallobre (BA)), Rías Baixas (Campelo, Ría de Pontevedra (PO) and Cangas, Ría de Vigo (CA)), North coast of Portugal (Ria de Aveiro (AV) and Lagoa de Óbidos (OB)) and Gulf of Cadiz (Ria Formosa, Algarve (AL)). Sample from Adriatic Sea was collected from Venice Lagoon (VE) (Fig. 1). Samples from RB, BA, PO, CA, AV, OB, AL and VE were provided by a third party (authorized depuration centers or authorized growers that guarantee the quality and legal provenance of the samples), namely “Confradia de Ribadeo”, “Confradia de Barallobre”, “Confradia de Pescadores San Andres de Lourizán”, “Mariscos Islas Cies”, “Bivaqua”, “Decomar”, “Cooperativa de viveiristas da Ria Formosa”, and “Societá Agricola Kappa”, respectively. The rationale for the defined sampling regions was based on the following criteria: (i) the presence of Perkinsus in the different localities (Leite, Afonso & Cancela, 2004; Pretto et al., 2014; Ramilo et al., 2016), as Perkinsus resistance it is one of the most important traits for the breeding program and therefore individuals should be already exposed to the parasite; (ii) the convenience of a regular supply of clams all year round (Darriba, 2017; Instituto Nacional de Estatística, 2018; Leite, Afonso & Cancela, 2004; Pellizzato et al., 2011; Leppakoski, Gollasch & Olenin, 2002; Pesca de Galicia, 2017) to avoid costs associated with sampling and transportation during the breeding program implementation, and (iii) a good representation of the most important R. decussatus production regions in Europe (FIGIS, 2020). Samples were collected between October and February, as it is known that seasonality and the respective ecological conditions of the environment can contribute for the incidence of different P. olseni’s infection levels on bivalves (Yang et al., 2012). Also P. olseni infection intensity and prevalence can be high when clams are under physiological stress, that in R. decussatus occur after spawning in October (Matias et al., 2013). All clams were transferred at 4 °C to Oceano Fresco laboratory (Mira, Portugal). The individuals examined had an average length of 41.3 ± 2.1 mm and a visceral condition (VCI) and gonadal condition index (GCI) ranged from 42.1 ± 7.0 to 54.7 ± 5.4 and 8.5 ± 2.0 to 15.1 ± 2.5, respectively. VCI and GCI were evaluated using the following formula: visceral/gonadal index = (viscera/gonad fresh weight (g)/shell fresh weight (g)) × 100 (according to Cerviño-Otero (2012)).
| Code | Locality | Coastal region | Country | Sampling date | Sample size |
|---|---|---|---|---|---|
| RB | El Tesón, Ría de Ribadeo | Rías Altas | Spain | October 2017 | 50 |
| BA | Barallobre | Spain | October 2017 | 50 | |
| PO | Campelo, Ría de Pontevedra | Rías Baixas | Spain | November 2017 | 50 |
| CA | Cangas, Ría de Vigo | Spain | February 2018 | 50 | |
| AV | Ria de Aveiro | North coast of Portugal |
Portugal | November 2017 | 49 |
| OB | Lagoa de Óbidos | Portugal | December 2017 | 50 | |
| AL | Ria Formosa, Algarve | Gulf of Cadiz | Portugal | October 2017 | 50 |
| VE | Venice Lagoon | Adriatic Sea | Italy | December 2017 | 50 |
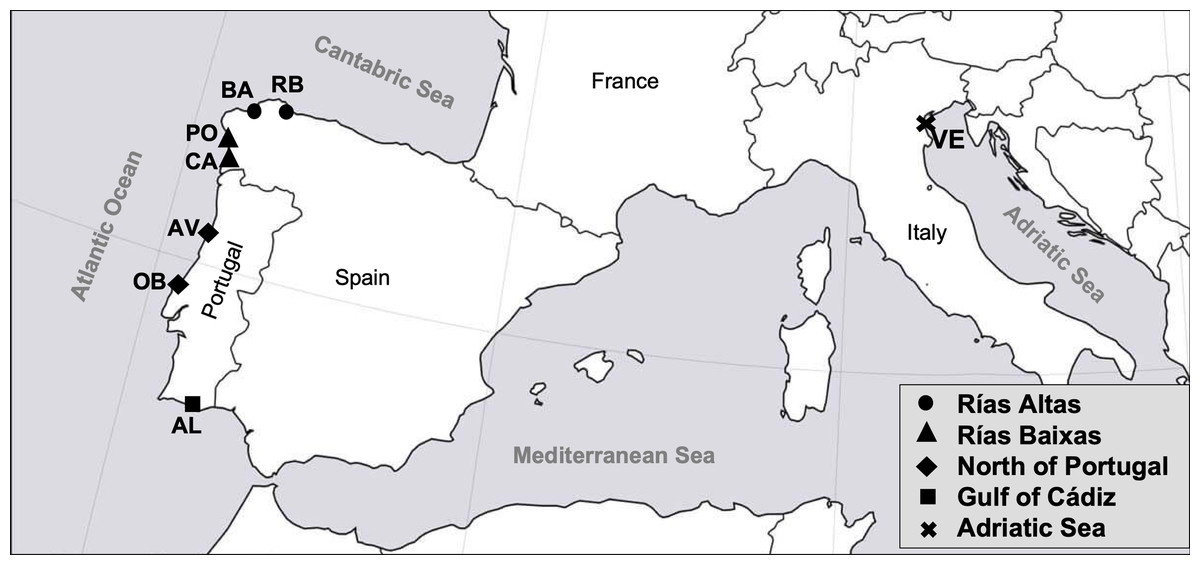
Figure 1: Map of the sampled localities in the study.
RB, Ribadeo; BA, Barallobre; PO, Ría de Pontevedra; CA, Cangas; AV, Aveiro; OB, Óbidos; AL, Algarve (Gulf of Cádiz); VE, Venice Lagoon.
Diagnosis of Perkinsus sp. by Ray’s fluid thioglycollate medium
Hemi-gill from 50 individuals of each location were analyzed for the Perkinsus sp. detection by using the standard Ray’s fluid thioglycollate medium (RFTM) assay (Ray, 1966; Bushek & Allen, 1996). Briefly, a piece of gill (half gills) was placed in fluid thioglycollate medium supplemented with mycostatin and incubated in the dark at room temperature for 5 days. Tissue was stained with a Lugol’s iodine and observed under light microscopy for the presence of hypnospores. The Perkinsus sp. infection intensity was scored using 0–5 Mackin’s infection intensity scale (Ray, 1954), where “0” is “absence of parasite” (0 cell/preparation); “1” is “very slight infection” (from 1 to 10 cells/preparation); “2” is “slight infection” (in 10 random microscopic fields (m.f.) (4×), >1 cell/m.f.); “3” is “moderate infection” (in 10 random m.f. (4×), >10 cells/m.f.); “4” is “intensive infection” (in 10 random m.f. (10×), >50 cells/m.f.); and “5” is “very intensive infection” (in 10 random m.f. (40×), >25 cells/m.f.).
Perkinsus diagnosis by PCR and Perkinsus species confirmation
Clam genomic DNA was obtained from a small piece of adductor muscle using the method described by Walsh, Metzger & Higuchi (1991).
Clams negative for perkinsosis by RFTM from all populations were confirmed to be negative by PCR using the PerkITS 750/85 primers developed by Casas, Villalba & Reece (2002) (F: ACATCAGGCCTTCTAATGATG; R: CCGCTTTGTTTGGATCCCC). Some samples with high infection detected by RFTM were used as positive controls. All PCR reactions were performed using one µL of genomic DNA, one µL of each primer (10 mM), 10 µL of water and 12 µL of NZYTaq Green Master Mix 2x (NZY Tech, Portugal). Cycling parameters were 4 min at 95 °C, 40 cycles (1 min at 95 °C, 1 min at 65 °C, 1 min at 72 °C) and 5 min at 72 °C. Also, positives samples for Perkinsus were used to confirm the Perkinsus species present in each location. After amplification, all samples presenting a 703 bp band were subjected to Perkinsus species identification using the RFLP method developed by Abollo et al. (2006). RsaI and HinfI restriction enzymes were both from NZY Tech (Portugal).
Clam microsatellite genotyping
Clam individual genotypes were determined for 13 microsatellite loci arranged into two multiplex PCRs (RdMTP-1 and RdMTP-2) following Borrell et al. (2014). Since evidence of linkage between RdATC-022 and RdATC-199 loci included in RdMTP-2 multiplex has been shown (Arias-Pérez et al., 2016), the first locus was excluded for the analysis.
Genetic data analysis
Generally, all data were collected by using the same pipeline as previously described in Arias-Pérez et al. (2016) and Nantón et al. (2017). Specifically, GENETIX v.4.03 software (Belkhir et al., 2004) was used to assess allele frequencies, observed number of alleles per locus (NA), observed heterozygosity (Ho), and unbiased expected heterozygosity (He) of Nei (1978). FSTAT v.2.9.3.2 (Goudet, 2001) was used to obtain allelic richness (RS). To compare heterozygosity values and allelic richness between localities, Friedman tests were conducted with the SPSS 16.0 statistical package (SPSS Inc., Chicago, IL, USA). A post analysis based on the Wilcoxon–Nemenyi–McDonald–Thompson procedure (Hollander & Wolfe, 1999) was carried out using an R function (Galili, 2010), when the tests were significant.
GENEPOP v.4.0 (Rousset, 2008) was used to test deviations from Hardy–Weinberg equilibrium (HWE) and linkage disequilibrium between pairs of loci within each locality. The same program was also used to calculate the inbreeding coefficient (Fis) following Weir & Cockerham (1984). A Markov chain method was used to determine the significance by applying 10,000 dememorizations, 5,000 batches and 5,000 iterations per batch. FreeNa software (Chapuis & Estoup, 2007) was used to estimate the frequency of null alleles (i.e., alleles that fail to amplify by PCR).
Weir and Cockerham’s F statistics (1984) computed over all localities, over all loci, and on a pairwise basis between localities were obtained using GENETIX v.4.03 software, which was also used to determine probability of significance of FST values by a nonparametric permutation approach (10,000 permutations). Whenever multiple tests were performed, P values were adjusted using the sequential Bonferroni correction (Rice, 1989).
STRUCTURE v.2.3.1 (Pritchard, Stephens & Donnelly, 2000) was used to perform a Bayesian clustering analysis. The range of possible clusters tested (K) was set from one to the total number of sample sites included in the analysis. Ten independent runs were carried out for each K, using prior location information and assuming an admixture model with correlated allele frequencies. The lengths of the Markov chain Monte Carlo and burn-in were set at 250,000 and 100,000, respectively. The program STRUCTURE HARVESTER (Earl & Von Holdt, 2012) was used to process the results obtained. The most likely value for K was selected considering both the ΔK statistic (the second-order rate of change in the log probability of the data between successive values of K (Evanno, Regnaut & Goudet, 2005)), and the maximum value of the log likelihood [Ln Pr(X|K)] of the posterior probability of the data for a given K (Pritchard, Stephens & Donnelly, 2000). The average permutated individual Q-matrices were obtained by using CLUMPP v.1.1.2 (Jakobson & Rosenberg, 2007) and results were visualized in DISTRUCT (Rosenberg, 2004).
To examine genetic diversity within and among regions, a hierarchical analysis of molecular variance (AMOVA) locus by locus (10,000 permutations) was conducted by using ARLEQUIN v.3.11 (Excoffier, Laval & Schneider, 2005). Linear correlation between genetic differentiation (FST(1-FST)−1) and the geographical distance between samples (measured as the coastline distance (km) between sampling locations) was checked using a Mantel test with 10,000 randomizations, as implemented in IBDWS v.3.16 (Jensen, Bohonak & Kelley, 2005).
For each microsatellite locus, tests for significant differences in allele and genotypic frequencies between infected and non-infected individuals were accomplished in GENEPOP v.4.0. Markers that remained significant after Bonferroni correction were further examined through a correspondence analysis performed in R version 3.5.3. to explore the relationships between individual alleles of each microsatellite locus and infection/non-infection.
Results
Semi-quantification of P. olseni
Different levels of P. olseni infection were observed in the eight localities ranging from low to high levels of infection (Fig. 2). Lower levels of P. olseni infection were found at RB and AV.
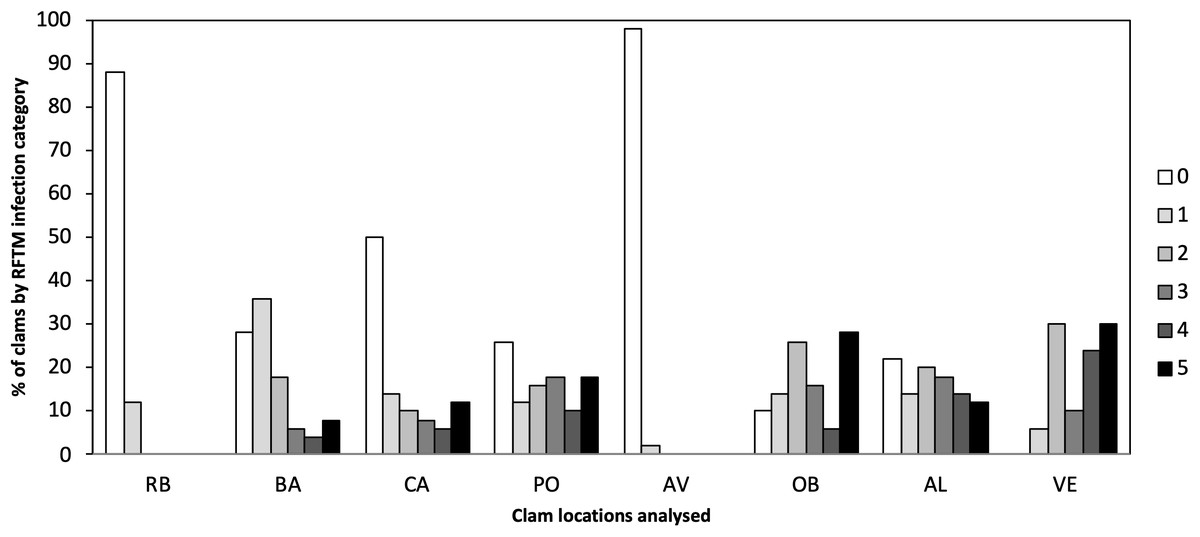
Figure 2: Percentage of P. olseni infection level of the different analyzed clams localities by RFTM method.
RB, Ribadeo; BA, Barallobre; PO, Ría de Pontevedra; CA, Cangas; AV, Aveiro; OB, Óbidos; AL, Algarve (Gulf of Cádiz); VE, Venice Lagoon. Right legend represents P. olseni infection intensity scored using 0–5 Mackin’s infection intensity scale (Ray, 1954).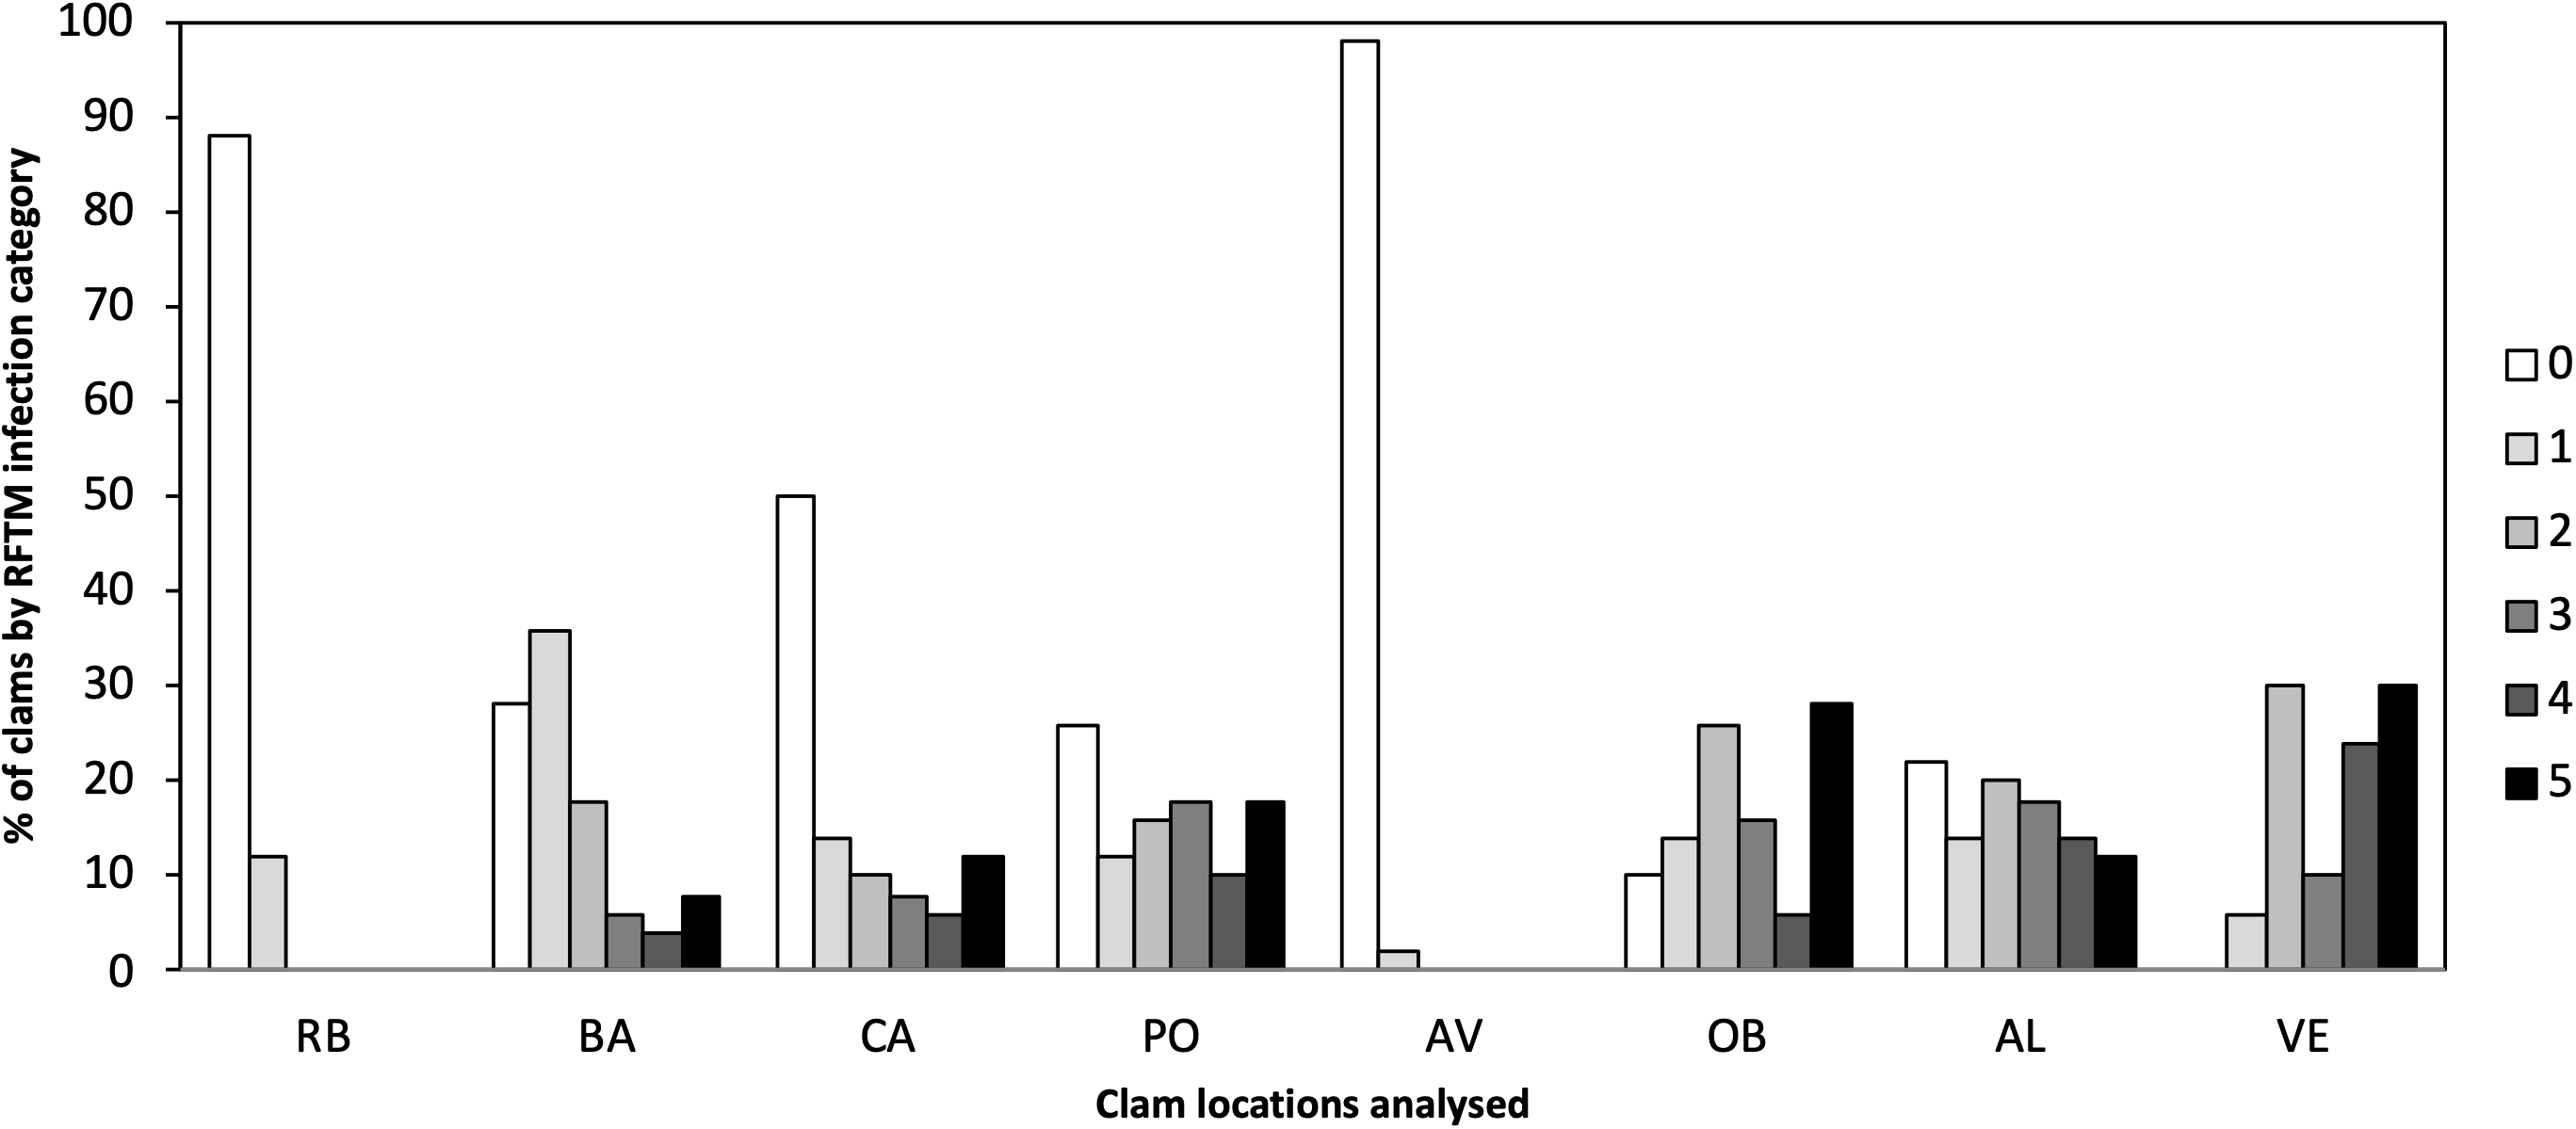
The detection of Perkinsus was also verified by PCR (Fig. 3A), to confirm the Perkinsus infection observed by RFTM. All positive samples observed by RFTM were positive by PCR whereas five negative samples by RFTM were positive by PCR.
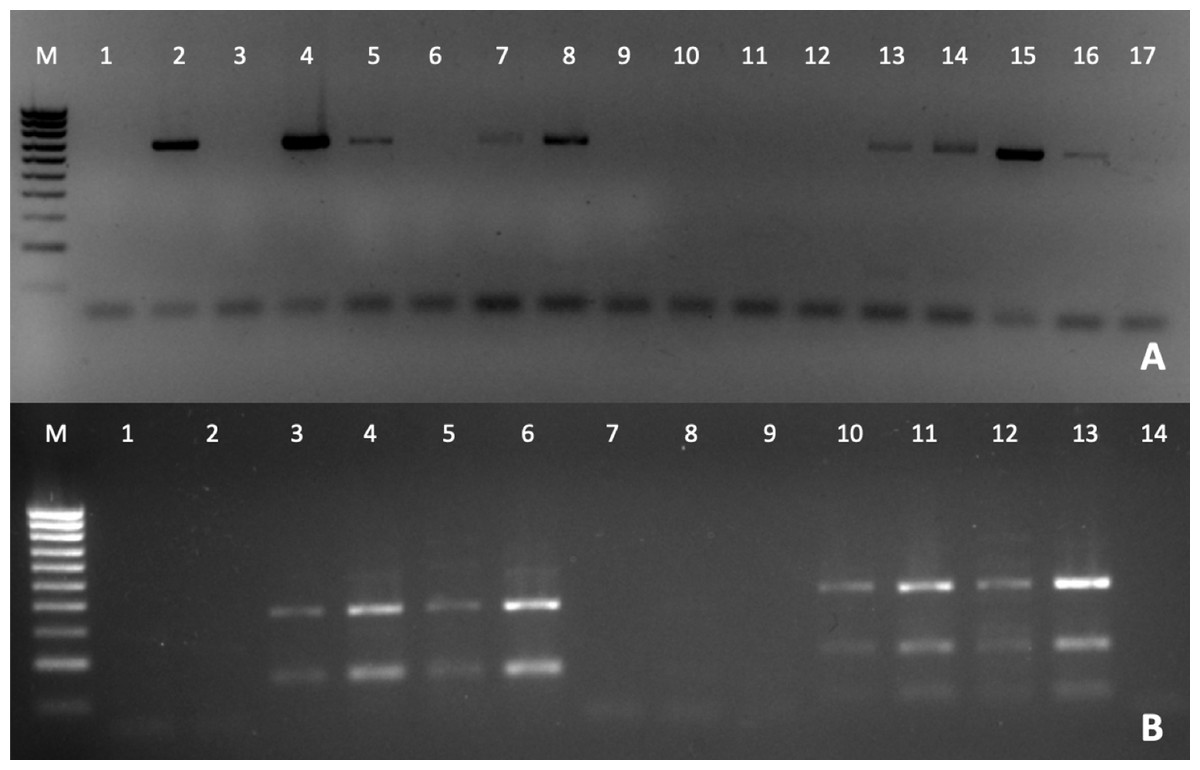
Figure 3: PCR diagnosis of P. olseni infection.
(A) PCR amplification using PerkITS 750/85 primers. Positive results showed a clear band at 703 bp. (B) RFLP pattern produced with HinfI (lines 1–7) and RsaI (lines 8–14). Lines 1, 2 and 8, 9 were done with DNA from P. olseni negative clams; lines 7 and 14 are PCR negative controls (water instead of DNA). All RFLPs showed a clear pattern corresponding to P. olseni species. Line M: 100 bp DNA ladder.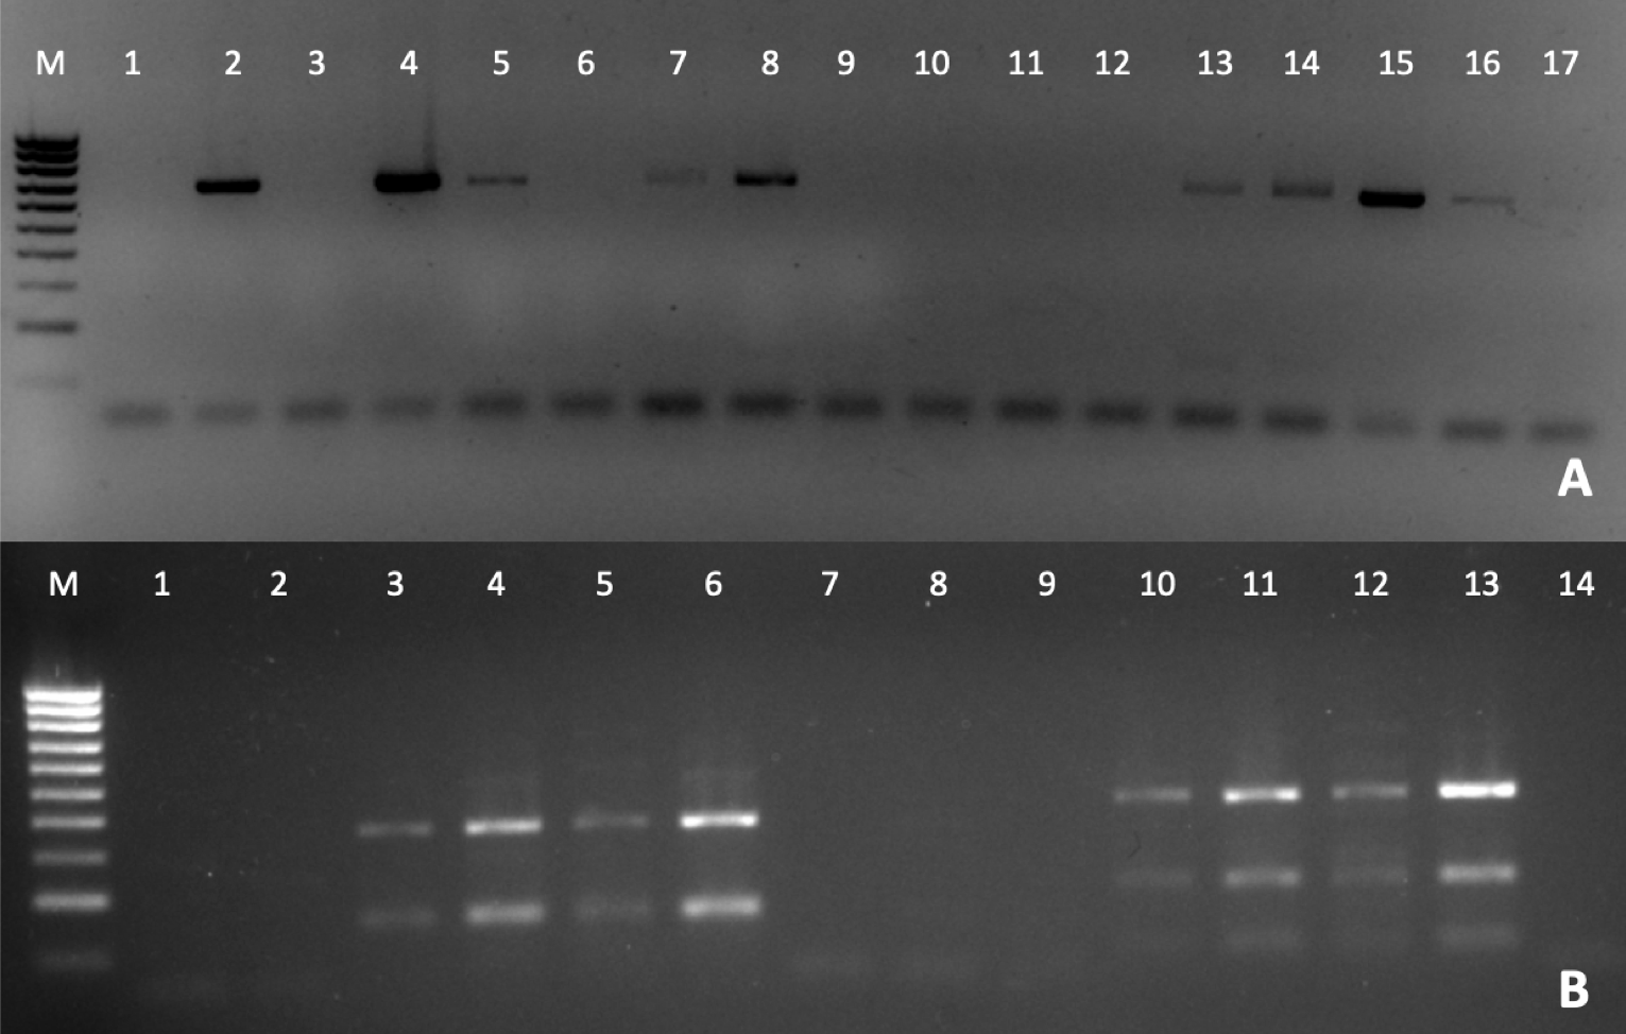
The RFLP technique confirms after RsaI digestion that all positive samples presented three bands of 400, 193 and 74 bp and two bands of 360 and 150 bp after HinfI digestion, which identify P. olseni as the causative agent of disease of all positive clams (Fig. 3B).
Genetic variation
Genetic variation statistics by locus, locality, and overall were analyzed (Table S1, Supplemental Data). All loci were polymorphic in all localities with a number of alleles per locus ranging from 6 (RdATC-219) to 18 (RdATC-215), and the allelic richness between 3.643 (RdATC-28b) and 13.767 (RdATC-215). In both cases, the lowest value was observed in RdATC-219 and the highest one in RdATC-215. Across localities, the mean number of alleles and the allelic richness varied between 7.231(AL) and 8.308 (VE), and between 6.786 (RB) and 7.763 (VE), respectively. Expected heterozygosity per locality ranged from 0.643 (OB) to 0.740 (VE), and observed heterozygosity from 0.622 (VE) to 0.682 (BA). Except RB and AL, all localities showed a total number of private alleles ranging from 1 (PO) to 11 (VE). Private alleles were always at low frequencies (<4%), except one locus at VE (frequency: 0.210, locus RdATC-238). The Friedman test detected significant differences in expected heterozygosity (Friedman chi-square = 17.905, df = 7, P = 0.012) among localities. A post hoc analysis showed significant differences between VE and localities from North coast of Portugal (AV and OB).
After sequential Bonferroni correction for the 624 comparisons analyzed, the linkage disequilibrium tests conducted for all pair of loci across localities were not significant, and 101 out of 104 locality-locus combinations showed no significant deviations from HWE after sequential Bonferroni correction. The loci RdATC-177, RdATC-199 and RdATC-212 departed from HWE in VE locality. All combinations departing from HWE were caused by a heterozygote deficit (FIS ≥ 0.444). According to FreeNa results, the three loci departing from HWE correspond to those showing the highest null allele frequencies (from 0.193 to 0.307).
Population genetic differentiation
The global multilocus estimate for FST was significantly different from zero (FST = 0.032, P-value < 0.001), indicating the existence of genetic differentiation among samples. FST estimates per locus ranged from 0.007 (RdATC-1.79) to 0.089 (RdATC-185), being all significantly different from zero (Table 2).
| Locus | Fst | P-value |
|---|---|---|
| RdATC-1.34 | 0.019 | <0.001 |
| RdATC-1.79 | 0.007 | 0.007 |
| RdATC-125 | 0.072 | <0.001 |
| RdATC-177 | 0.011 | <0.001 |
| RdATC-185 | 0.089 | <0.001 |
| RdATC-199 | 0.020 | <0.001 |
| RdATC-212 | 0.010 | 0.003 |
| RdATC-215 | 0.055 | <0.001 |
| RdATC-219 | 0.071 | <0.001 |
| RdATC-223 | 0.014 | 0.004 |
| RdATC-238 | 0.011 | <0.001 |
| RdATC-263 | 0.080 | <0.001 |
| RdATC-28b | 0.020 | 0.003 |
Pairwise multilocus FST values (Table 3) ranged from 0.000 (BA-RB and BA-PO) to 0.110 (AL-VE), being significant after sequential Bonferroni correction in 24 of 28 tests. Samples from different regions showed significant pairwise FST estimates after Bonferroni correction with the exception of BA and PO. Pairwise FST values for comparisons involving the Adriatic sample (VE) were, on average, eight times higher.
| RB | BA | PO | CA | AV | OB | AL | VE | |
|---|---|---|---|---|---|---|---|---|
| RB | – | 0.000 | 0.007** | 0.014** | 0.018** | 0.016** | 0.012** | 0.086** |
| BA | 0.466 | – | 0.000 | 0.007** | 0.011** | 0.012** | 0.014** | 0.090** |
| PO | 0.006 | 0.399 | – | 0.002 | 0.006** | 0.009** | 0.011** | 0.084** |
| CA | <0.001 | 0.004 | 0.215 | – | 0.008** | 0.008** | 0.007** | 0.099** |
| AV | <0.001 | <0.001 | 0.010 | 0.003 | – | 0.002 | 0.013** | 0.093** |
| OB | <0.001 | <0.001 | <0.001 | 0.002 | 0.226 | – | 0.015** | 0.098** |
| AL | <0.001 | <0.001 | <0.001 | 0.004 | <0.001 | <0.001 | – | 0.110** |
| VE | <0.001 | <0.001 | <0.001 | <0.001 | <0.001 | <0.001 | <0.001 | – |
Note:
Bayesian clustering analysis revealed that the ΔK distribution peaked at K = 2 (Fig. 4A). The maximum value for the “estimated likelihood of K” was at K = 3 (Fig. 4B), and with this K three differentiated population groups (1: Rías Altas, Rías Baixas and Gulf of Cadiz; 2: North coast of Portugal; 3: Adriatic Sea) could be distinguished (Fig. 5A). “Estimated likelihood of K” at K = 4 and K = 5 were similar to the value at K = 3 (Fig. 4B). For K = 4, the three groups are more evident (Fig. 5B) and the analysis with K = 5 suggests a noticeable differentiation between Rías Altas, Rías Baixas and Gulf of Cadiz (Fig. 5C). Analysis excluding VE, the most genetically differentiated locality, did not change the inferred genetic structure pattern for the Atlantic samples (Figs. 4C, 4D and 5D–5F). Hierarchical AMOVAs grouping the localities based on the different groups inferred from Bayesian analysis were carried out (Table 4). Percentage of variation among groups was higher when samples were grouped into five regions (Rías Altas, Rías Baixas, North coast of Portugal, Gulf of Cadiz and Adriatic Sea) (variation among groups = 3.553%, P < 0.001). Furthermore, this grouping showed a non-significant within-groups component (Fsc = 0.001, P > 0.05). When Atlantic samples were not subdivided into four regions (3 and 4 subdivision levels), the percentage of variation among groups was zero or close thereto and also showed a significant within-groups component (3 subdivision level: Fsc = 0.001, P < 0.001; 4 subdivision level: Fsc = 0.001, P < 0.001).
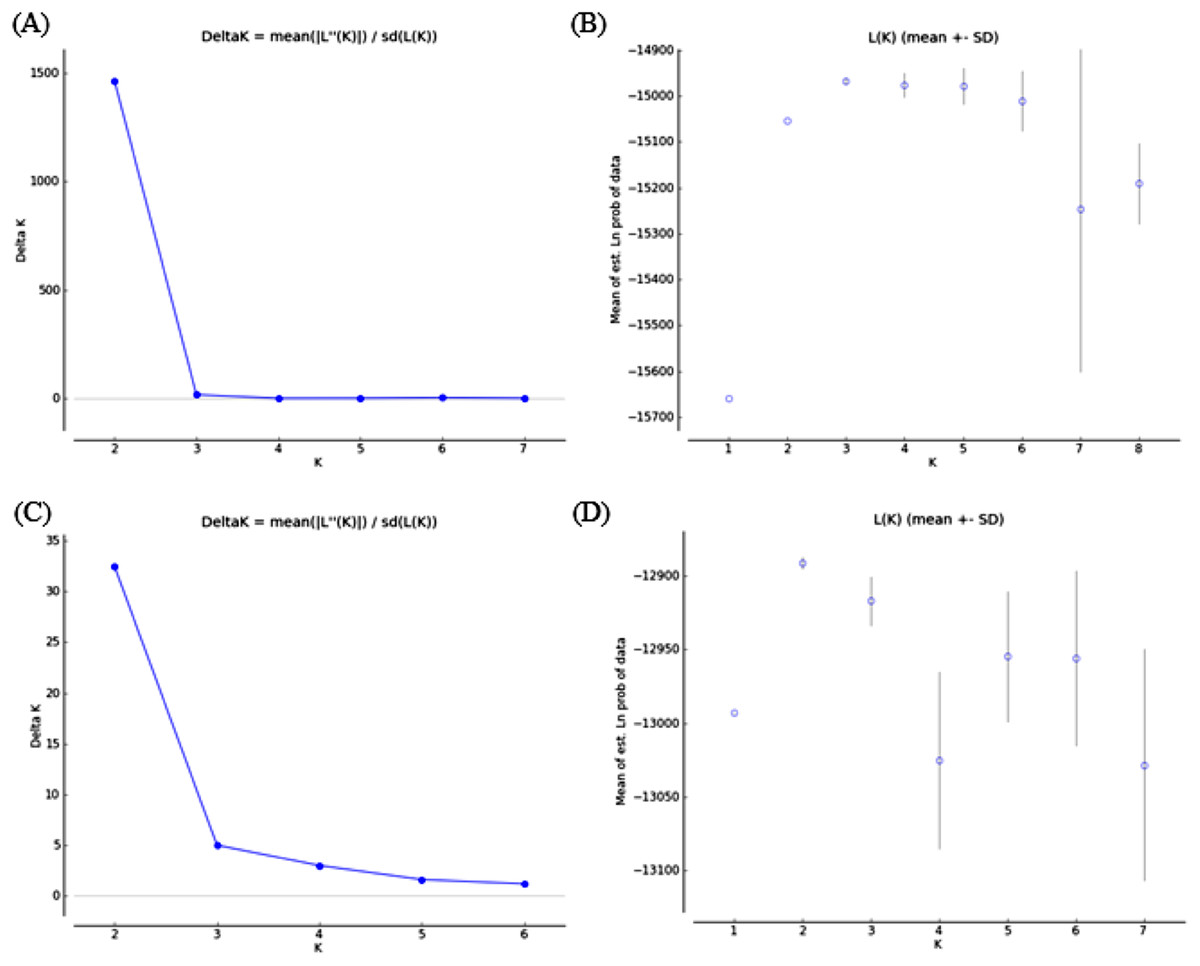
Figure 4: Bayesian analysis of genetic structure from microsatellite data with (A and B) and without VE individuals (C and D).
For each data set, ΔK as a function of K (A and C) and distribution of estimated log likelihood of K, L(K), (B and D) are shown. For L(K) each point corresponds to the mean L(K) ± SD across 10 independent runs.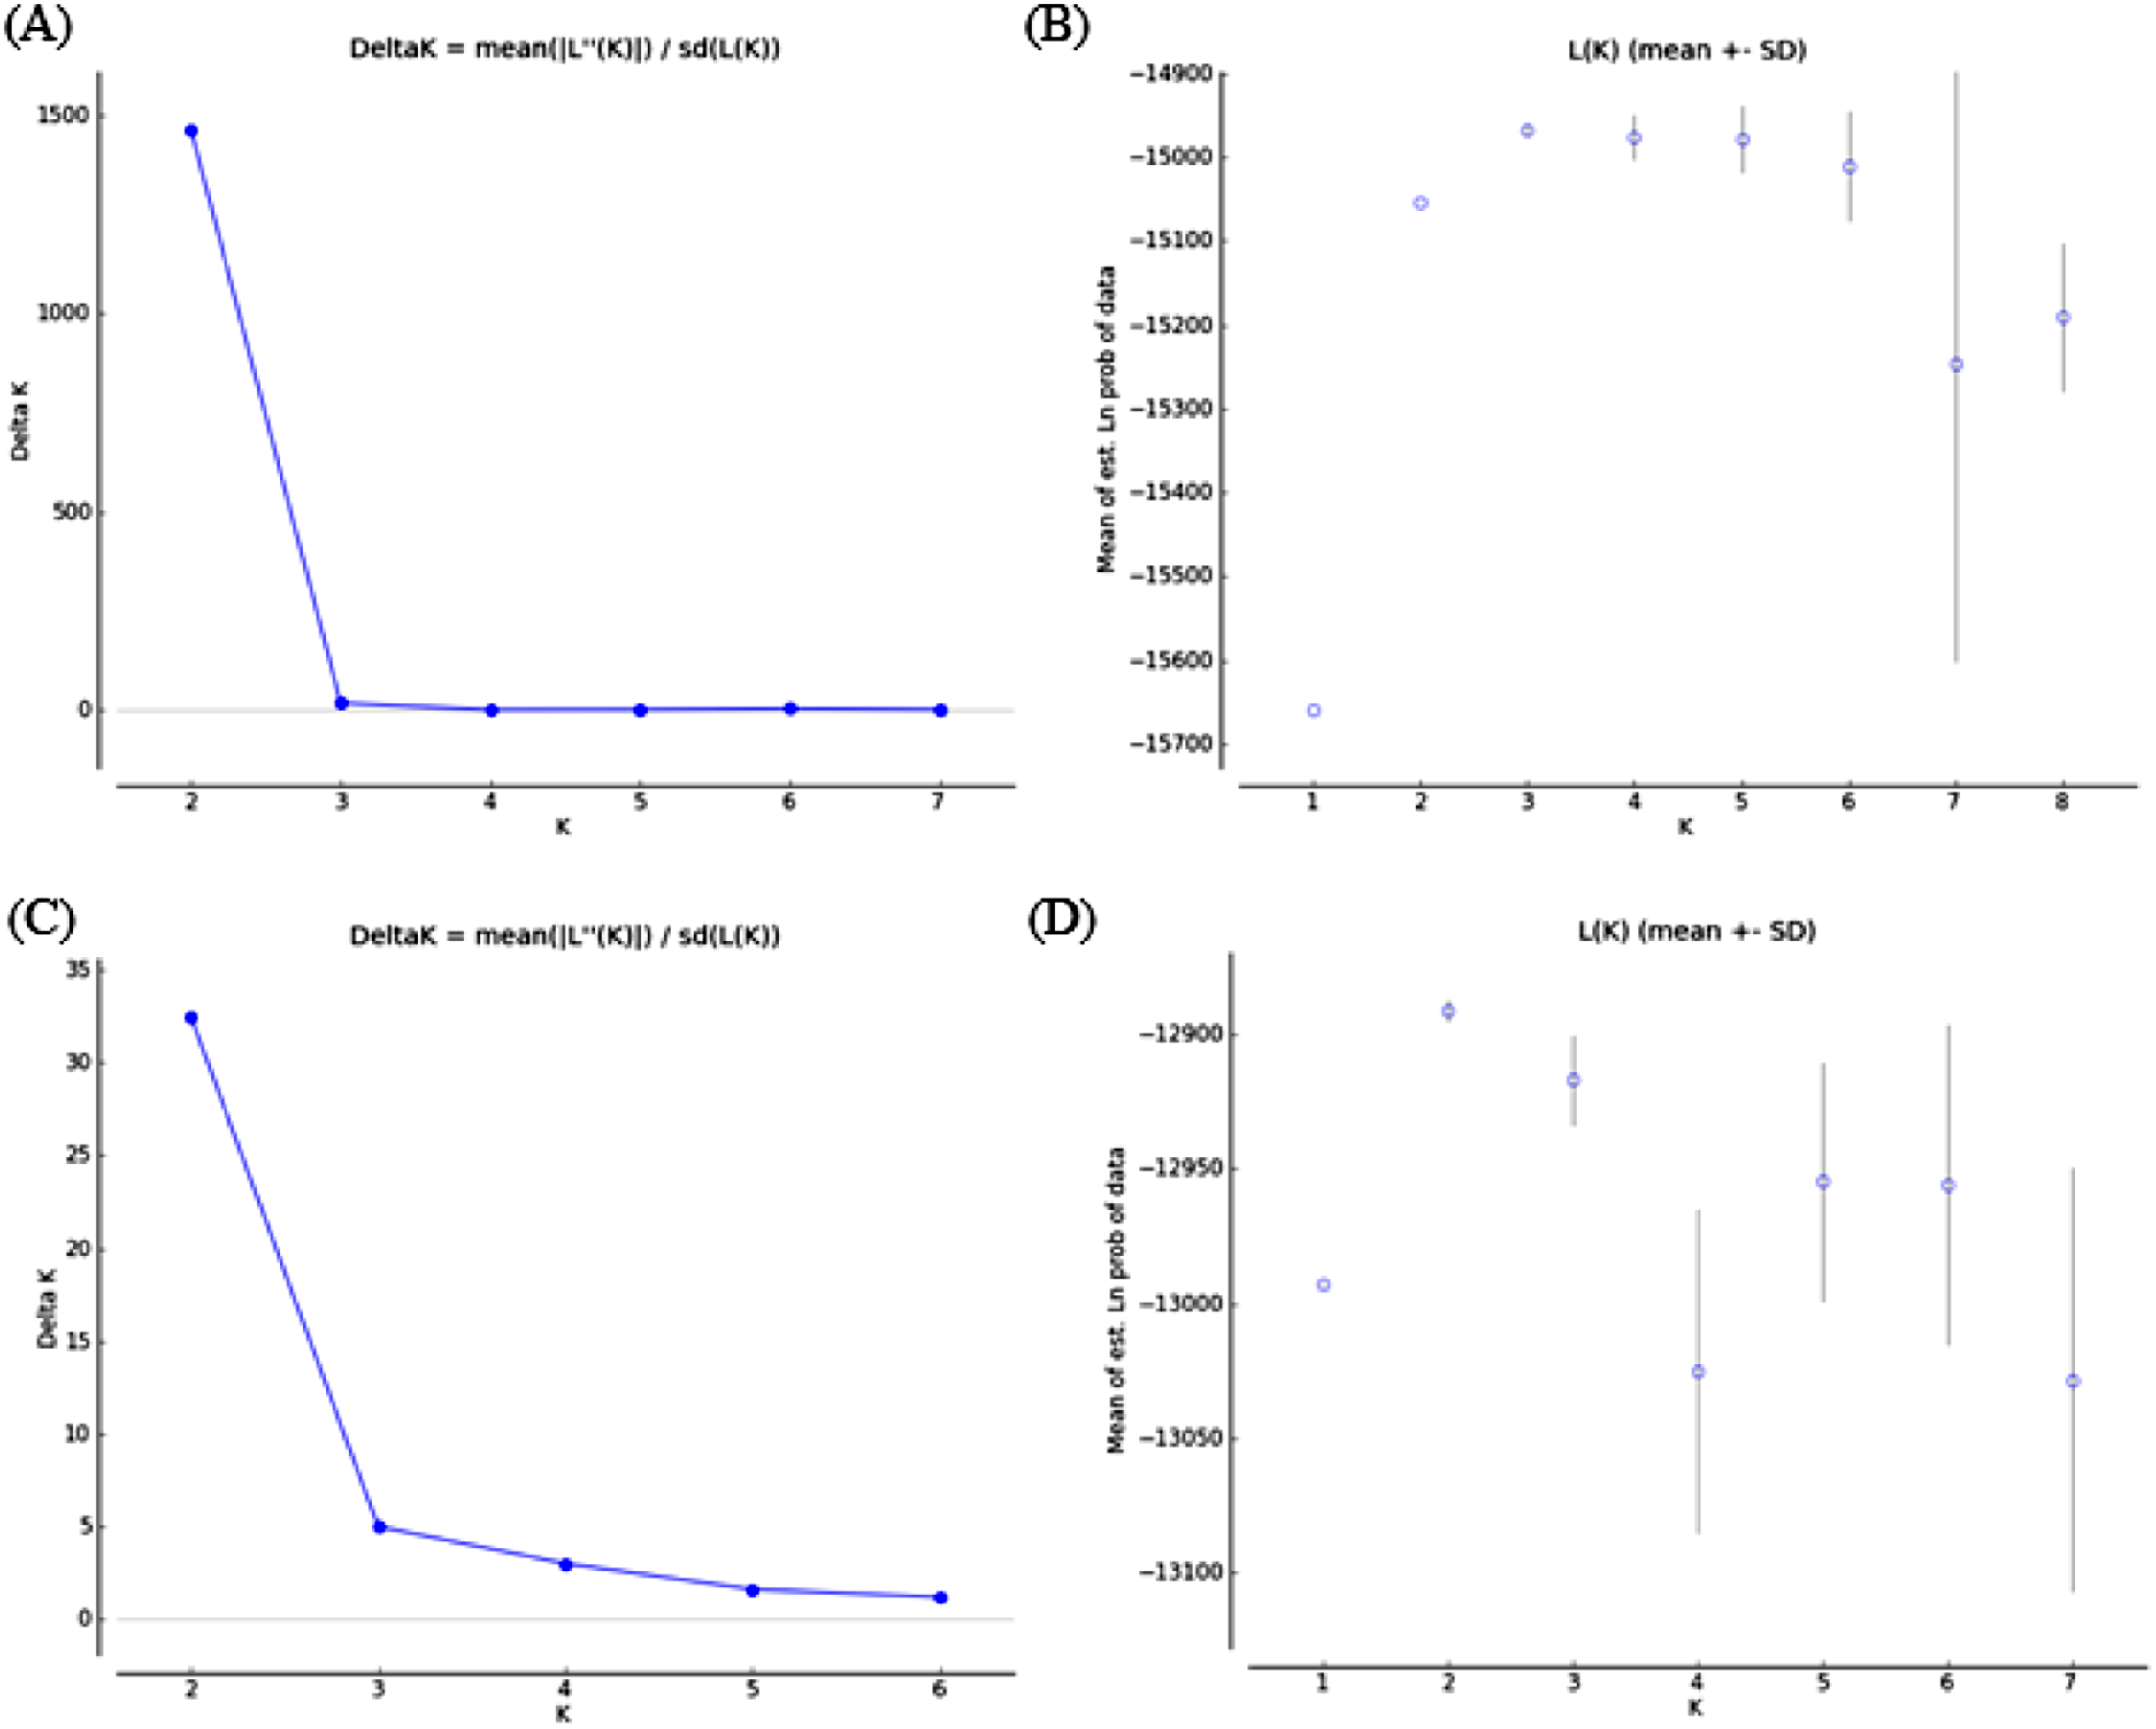
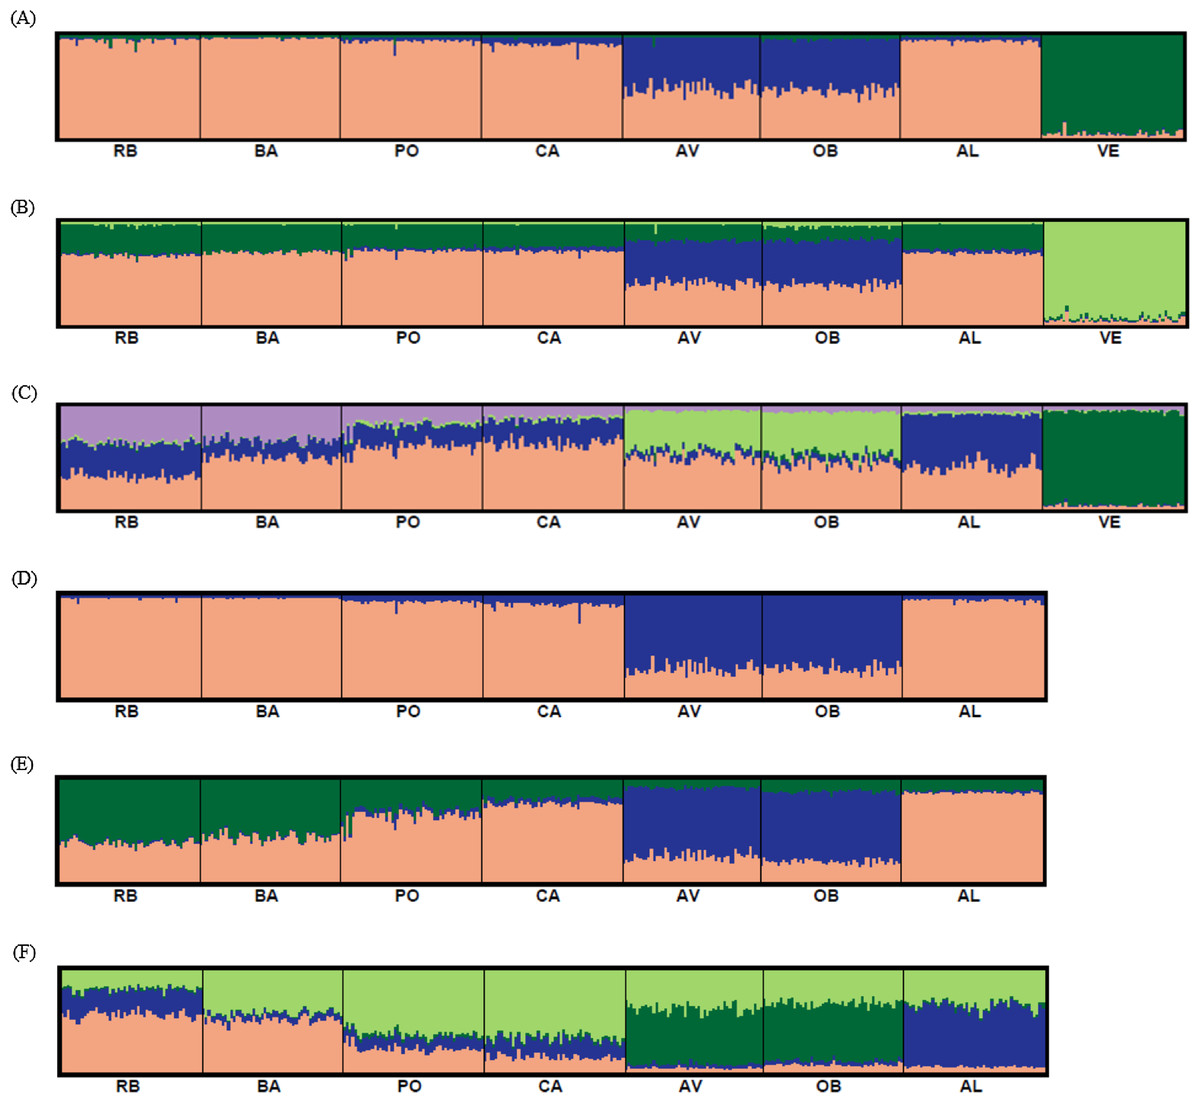
Figure 5: Graphic representation of the estimated membership coefficients for each individual obtained from the Bayesian clustering analysis of genetic structure for K = 3–5 including all samples (A–C) and for K = 2–4 excluding VE individuals (D–F).
Colours correspond to genetic clusters. Each individual is represented as a vertical bar, partitioned into K colored components that represent the individual’s estimated membership coefficients in the K clusters. There is no color correspondence across figures based on different data sets. Sample names are abbreviated as in Table 1.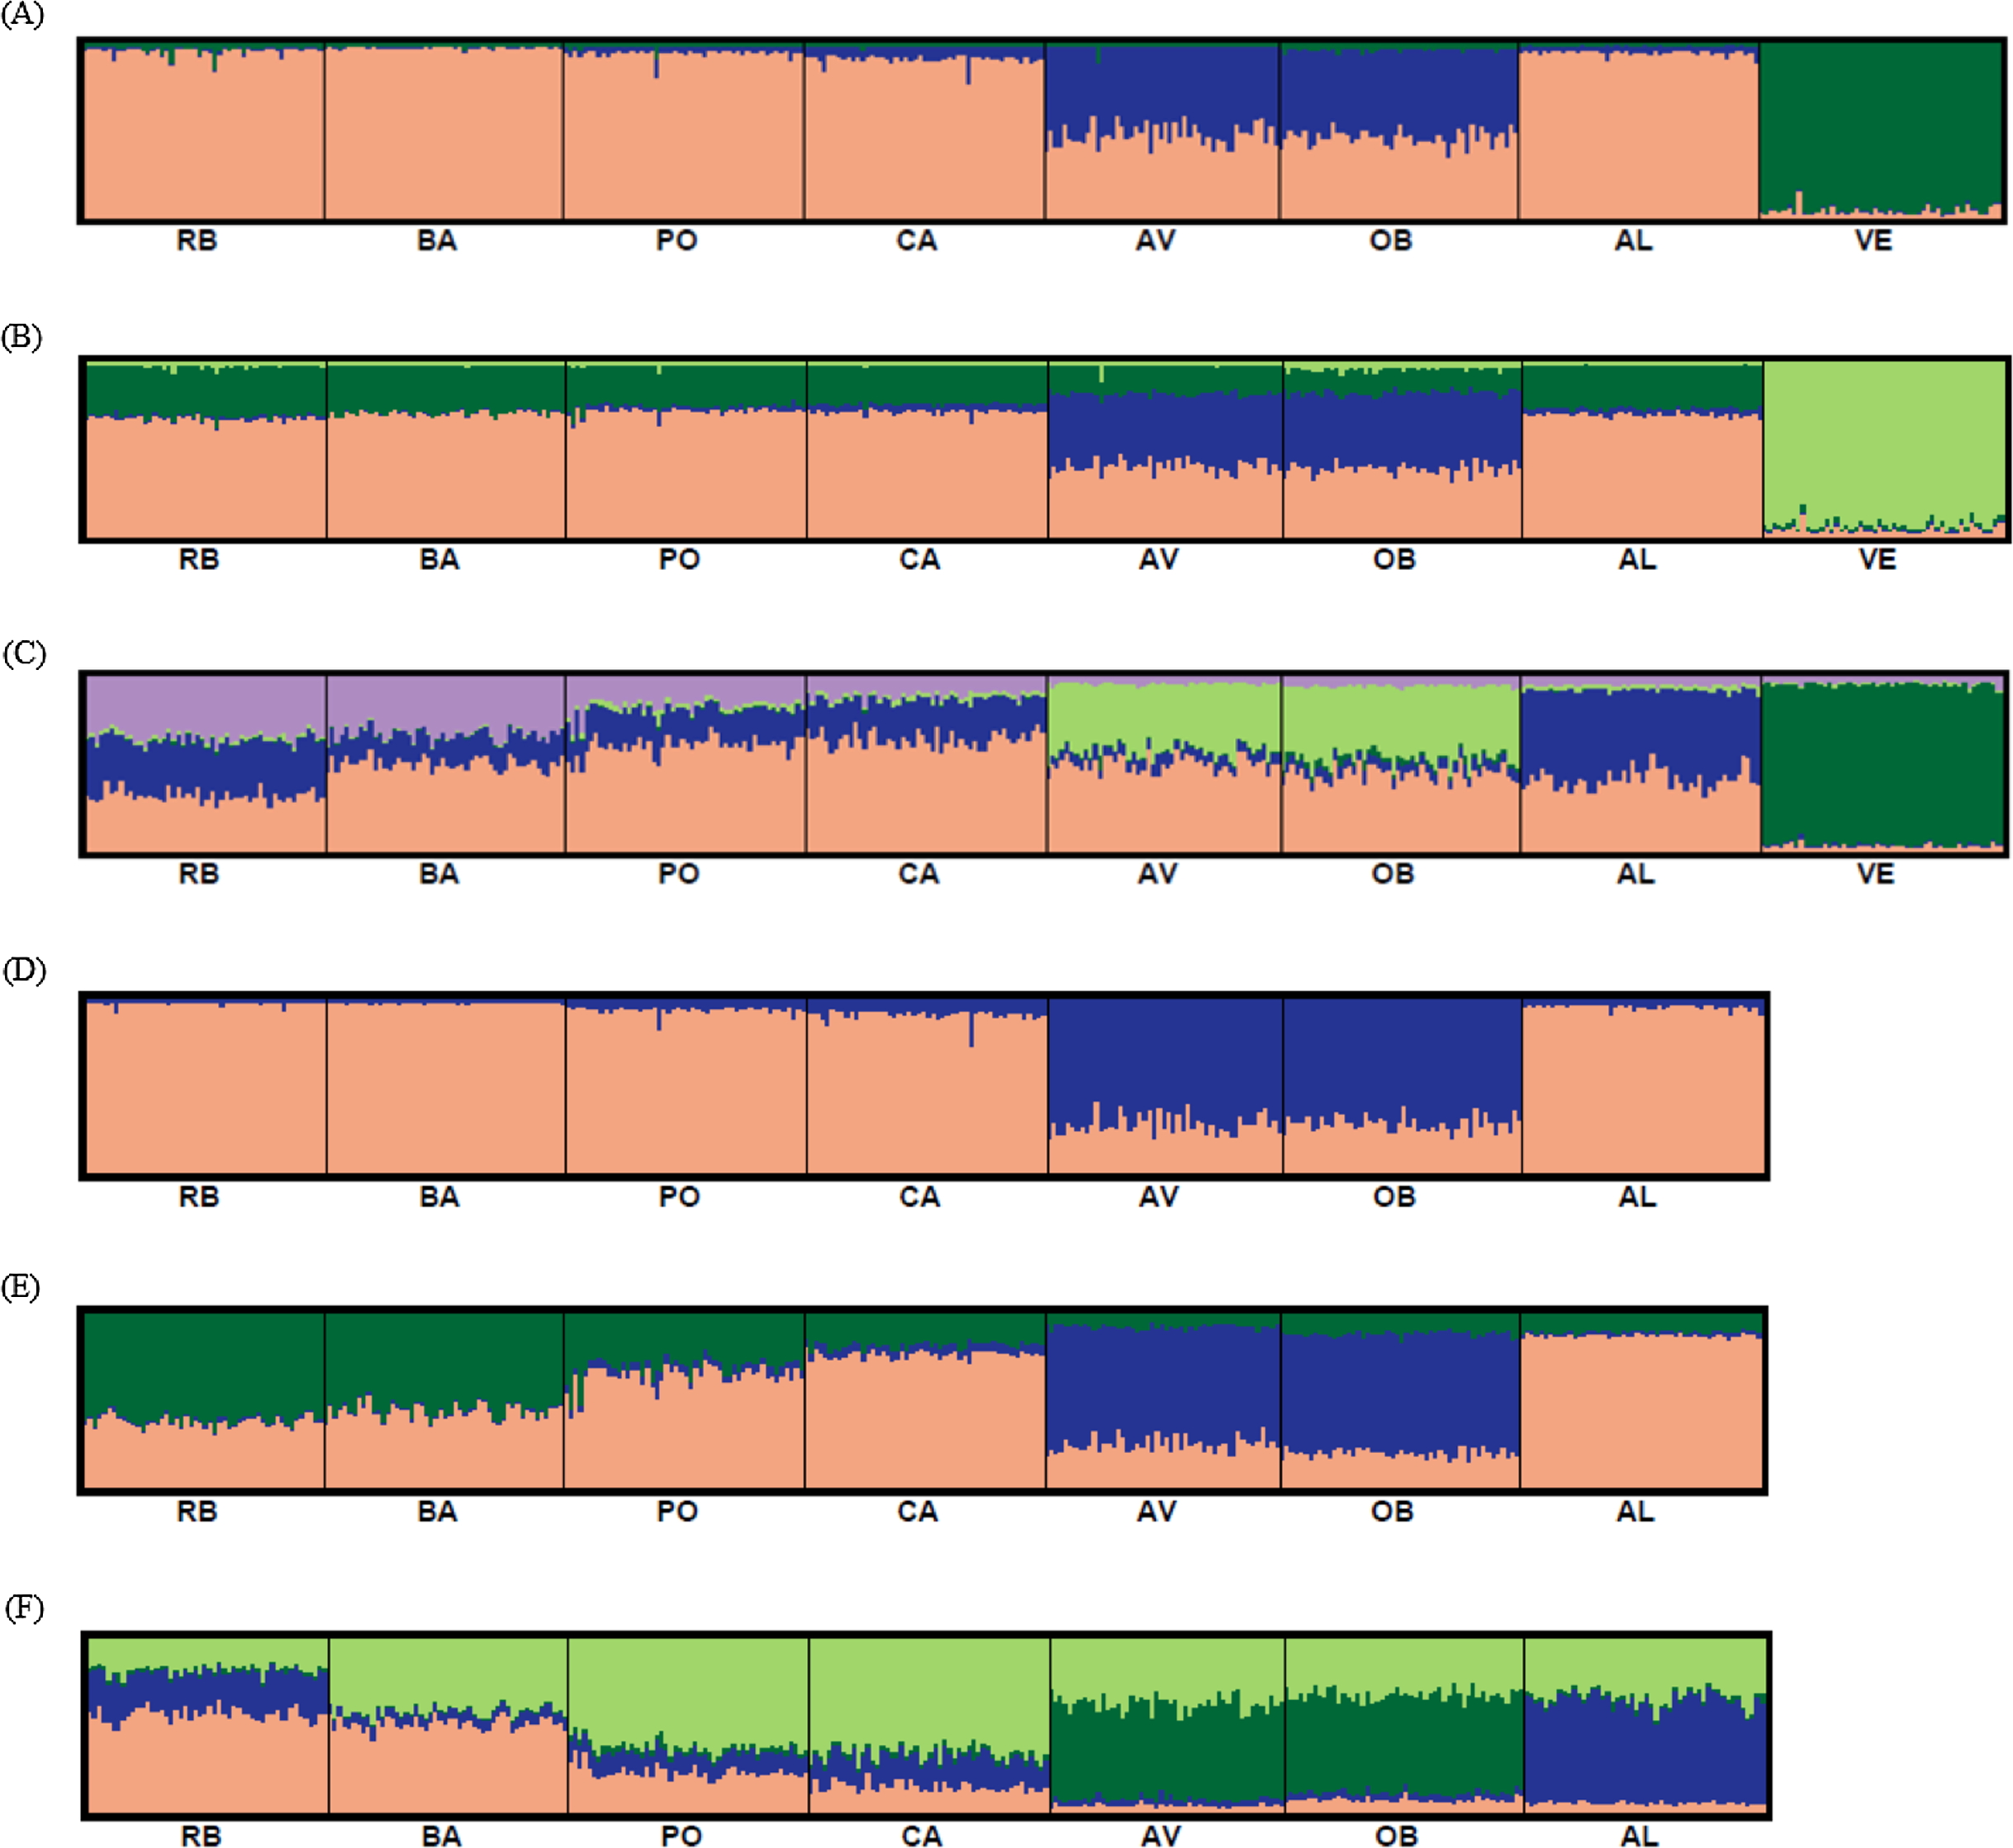
| Subdivision levels1 |
Percentage of variation | F-statistics | ||||
|---|---|---|---|---|---|---|
| Among groups |
Among populations within groups |
Within populations |
FCT | FSC | FST | |
| 3 | −0.020 | 0.110 | 99.900 | −0.002 | 0.001* | 0.001* |
| 4 | 0.010 | 0.100 | 99.890 | 0.000 | 0.001* | 0.001* |
| 5 | 3.553 | 0.103 | 96.344 | 0.036* | 0.001 | 0.037* |
Notes:
When samples were pooled according to the five geographical regions inferred by Bayesian clustering analysis and AMOVA, all FST pairwise values were significant, with higher values recorded in comparisons involving the Adriatic region (Table S2).
Mantel tests revealed a significant correlation between FST and geographic distance (R2 = 0.705, P = 0.0002) when all localities were analyzed (Fig. 6A) and when only Atlantic localities were included (R2 = 0.517, P = 0.0012) (Fig. 6B).
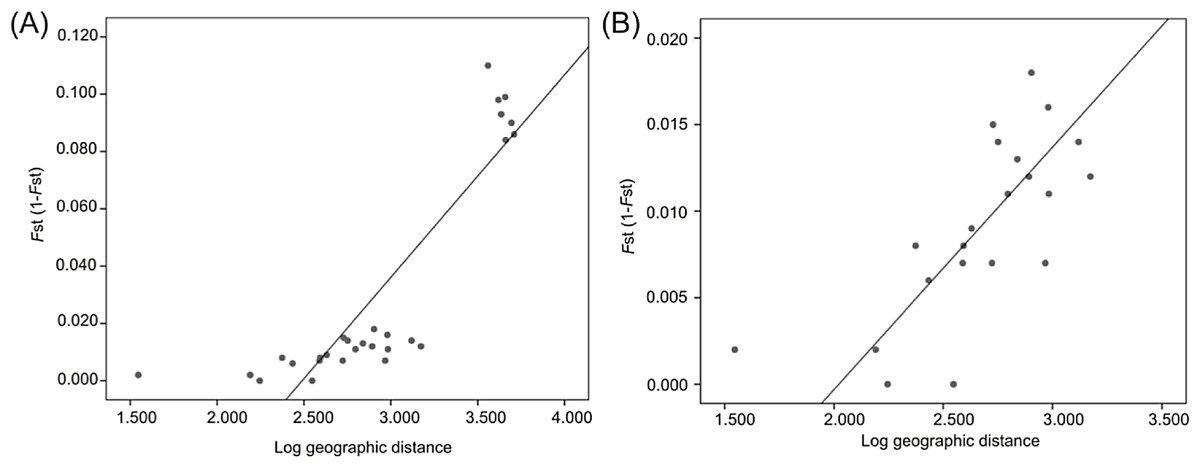
Figure 6: Linear regression established between genetic distance based on microsatellite data and log-transformed geographic distance from all localities (A) and from Atlantic localities (B).
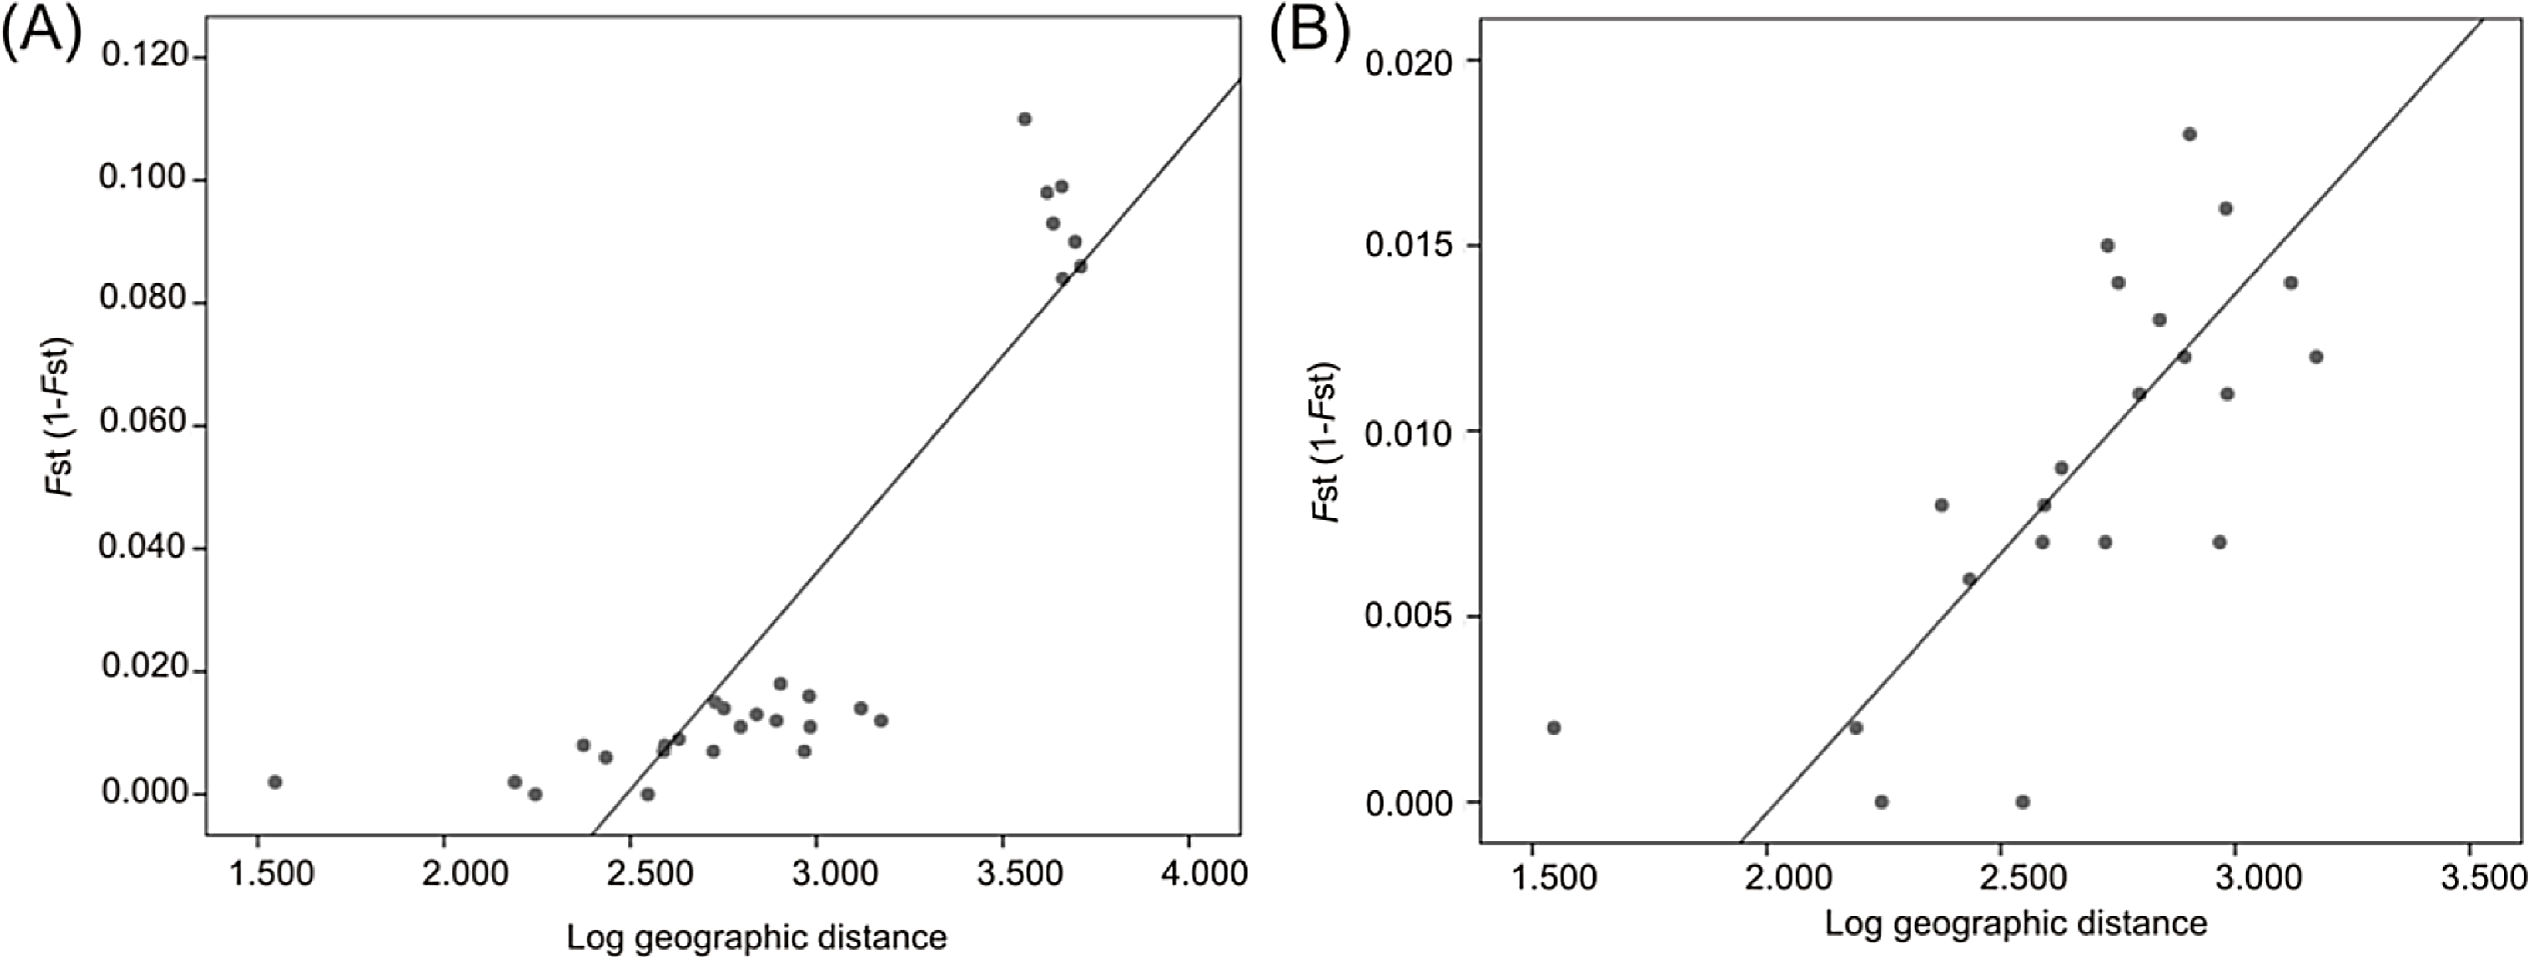
Microsatellite variation and P. olseni infection
Individuals showing congruent results with RFTM and PCR assay respecting to the infection detection were used to compare allele and genotypic frequencies between those infected and non-infected. Significant differences in the allele frequency distribution were found at six loci before sequential Bonferroni correction (RdATC-125, RdATC-215, RdATC-263, RdATC-238, RdATC-179, RdATC-177). After such correction significant differences were restricted to four loci (RdATC-125, RdATC-215, RdATC-263, RdATC-238) (Table 2). The same results were obtained for genotypic frequency distribution.
A correspondence analysis was carried out to determine which individual alleles of each of the four microsatellite loci may be more specifically involved in the allele frequency differences detected between the infected and non-infected individuals. This was done including (Fig. 7A) and excluding VE individuals (Fig. 7B) due to the higher genetic differentiation of VE respect to other localities and because all individuals from this sample were infected by the parasite. When VE individuals were included, both a relatively high positive (>47%) and/or negative (~40%) correspondence value was detected for the frequency of at least one allele of the four loci. However in several cases, the involved alleles, such as RdATC125-149 or RdATC215-134, were mainly present in VE individuals (Tables S3 and S4), which can skew the analysis. When VE individuals were excluded, some alleles, namely RdATC215-143 or RdATC238-164 presented also a higher correspondence value (58.42% and 72.93% respectively), indicating that individuals with these alleles might have higher propensity for infection. On the other hand, although less prominent, the allele RdATC215-152 could indicate greater likelihood individuals being resistant to the disease (correspondence value: −35.68%). Although this could also be deduced for individuals with the RdATC263-195 allele when VE individuals were not considered, the rarity presence of this allele (Tables S3 and S4) makes its role respect to resistance/susceptibility unclear.
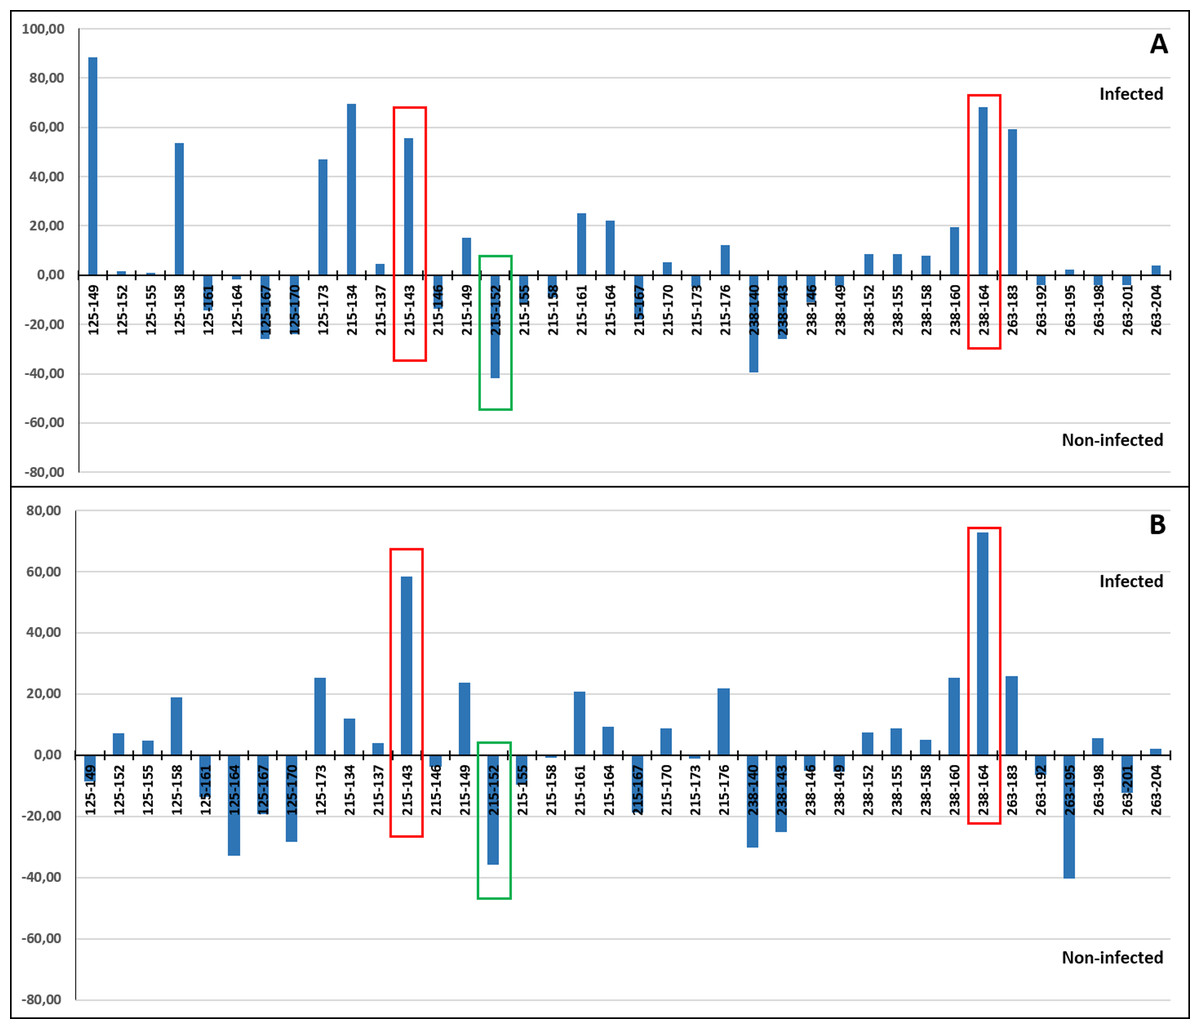
Figure 7: Correspondence values for the frequency of alleles at the microsatellite loci and infection/non-infection. Analysis carried out including (A) and excluding (B) VE individuals.
With red and green rectangles are highlighted the alleles that might indicate higher and lower propensity for P. olseni infection, respectively.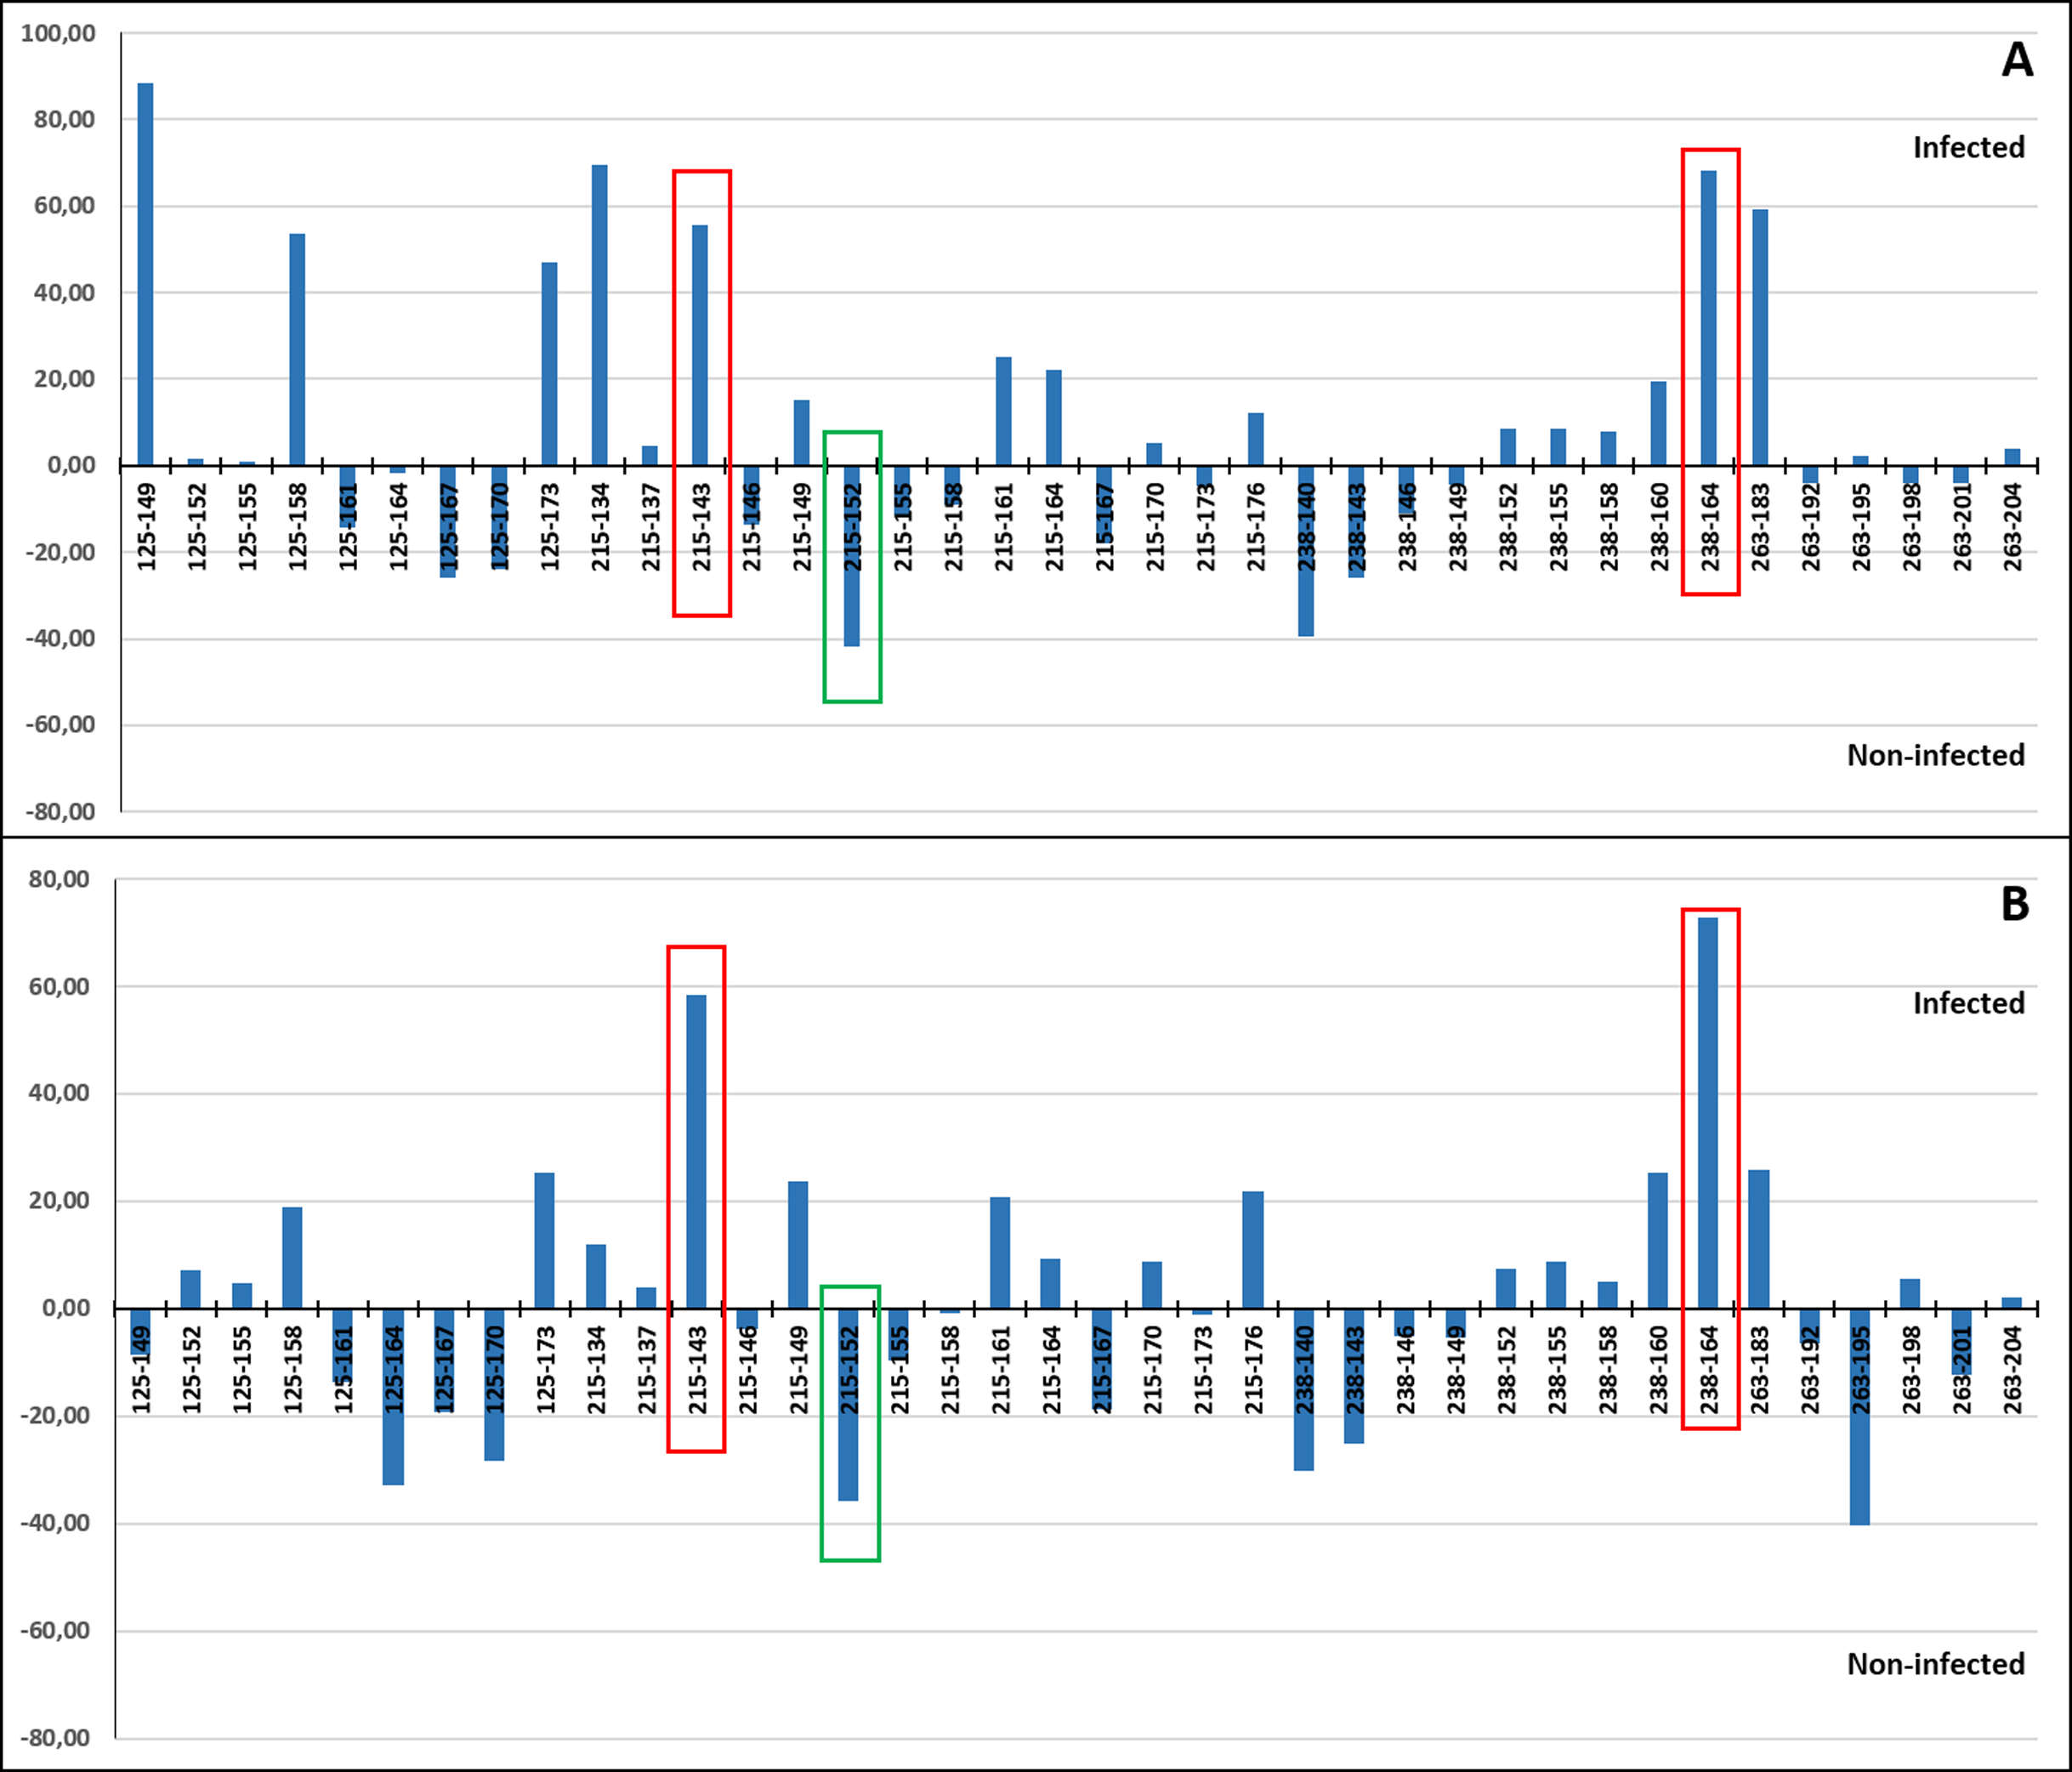
Discussion
Considering the high economic value of R. decussatus and the problems that farmers face in cultivating this species, it is evident that a well-structured breeding program of Perkinsus resistance is needed. Breeding programs are increasingly recognized as a key component of sustainable production of aquaculture species. To establish a sound strategy for breeding and deployment, a good understanding of the genetic diversity and Perkinsus infection levels of the individuals from different R. decussatus populations is a necessary first step towards a long-term sustainable goal. The success of selective breeding programs can be compromised by reduction of fitness or inbreeding depression, which may be caused by loss of genetic variability and inbreeding. In particular, inbreeding depression may affect both individual and population performance, namely growth in weight, survival, reproduction, resistance to disease, predation and environmental stress (Keller & Waller, 2002).
Clam population genetic characterization
Up to now, several studies assessing genetic diversity have been carried out in R. decussatus using different markers: allozymes (Worms & Pasteur, 1982; Jarne, Berrebi & Guelorget, 1988; Borsa, Zainui & Delay, 1991; Borsa et al., 1994; Jordaens et al., 2000; Gharbi et al., 2011); RAPDs (Pereira et al., 2011), internal transcribed spacers of ribosomal genes (ITS, Gharbi et al., 2010), introns (Cordero, Peña & Saavedra, 2008; 2014; Arias-Pérez et al., 2016); cytochrome c oxidase subunit I (COI, Cordero, Peña & Saavedra, 2014; Habtemariam et al., 2015; Sanna et al., 2017) and microsatellites (Borrell et al., 2014; Arias-Pérez et al., 2016). Regardless of the marker used, most of studies were mostly focused on the Mediterranean coast. Moreover, the P. olseni infection level of those populations was not evaluated in these studies. The selection of the eight localities of R. decussatus examined here, three from Portugal, four from Spain and one from Italy (the most important clam producers’ countries within Europe) responded to the need to obtain clams easily for the breeding program implementation in the future. Among the available markers, microsatellites, characterized by their codominant nature and usually high polymorphism, were chosen because their suitability both for genetic diversity assessment and monitoring, and for obtaining pedigree information, an aspect of great interest for a successful breeding program in aquaculture.
The present study provided data about genetic diversity for new localities of R. decussatus. According to the Friedman test results, all genetic diversity measures were non-significantly different among examined localities, except He of VE that was higher than in the North coast of Portugal. As is common in population genetics surveys, several diversity parameters had been estimated in this study, and among them Rs, which is better adapted to problems related with conservation genetics (Petit, El Mousadik & Pons, 1998). While heterozygosity measures are sensitive to the allele frequencies in the population, Rs is indicative of their presence and consequently is a good indicator of the evolutionary potential of a population (Greenbaum et al., 2014 and references therein). Focusing, therefore, in Rs, values obtained here (6.786–7.763) were similar or higher than those reported by Borrell et al. (2014; 5.80–6.83) for wild samples from three Spanish localities of Cantabrian Sea and Galician coast, and similar or lower than those reported by Arias-Pérez et al. (2016; 6.877–8.240) for a set of eleven Spanish localities. Nevertheless, it must be remembered that data comparisons between different studies entail some difficulties. Rs is usually calculated based on a minimum sample size, which differs among studies. Moreover, at the same locality, the estimated values may show temporary changes or be influenced by the sampling strategy (Borrell et al., 2014). Regarding He (0.643–0.740) and Ho (0.622–0.682), the values obtained were very similar to previous studies (He = 0.619–0.734 and Ho = 0.608–0.675 in Borrell et al. (2014); He = 0.633–0.736 and Ho = 0.613–0.693 in Arias-Pérez et al. (2016)). The higher values of Rs and He in the VE sample agree with the higher genetic diversity at microsatellite loci in clams from the Mediterranean coast than those from Atlantic shores (Arias-Pérez et al., 2016).
Only three out of 104 locality-locus combinations studied showed significant deviations from HWE after sequential Bonferroni correction. In contrast to previous studies in R. decussatus (Borrell et al., 2014; Arias-Pérez et al., 2016), all deviations were found at the same locality (VE). Deviation from HWE may be due to one or several factors, including the substructure of samples, inbreeding, selection, and the presence of null alleles. Given that all deviations were caused by a heterozygote deficit and that the higher frequency of null alleles was found at the loci implicated, it seems reasonable to assume that these alleles may be the main cause of HWE deviations detected. The fact that all null alleles were found in the Venice sample suggest that these clams may display a high mutation rate in the flanking regions of at least some microsatellites, which could be associated with a more polluted environment (Rico et al., 2017).
The analyses of population differentiation (FST, Bayesian clustering and AMOVAs) are consistent with the existence of a pattern composed of five groups: Rías Altas (RB and BA), Rías Baixas (PO and CA), North coast of Portugal (AV and OB), Gulf of Cadiz (AL) and Adriatic Sea (VE). Significant genetic differentiation between Atlantic and VE is not unexpected given the geographic distance. In fact, in a phylogeographic analysis of introns and COI gene including eleven populations from French Atlantic coasts to Turkey, Cordero, Peña & Saavedra (2014) found three groups of populations: Atlantic populations, Mediterranean populations plus Tunisia and Adriatic and Aegean populations. Historical and present day hydrographic conditions, as well as an endogenous genetic barrier could cause the observed restrictions in gene flow (Cordero, Peña & Saavedra, 2014). Moreover, Venice Lagoon is a well-known location where several events of mass mortality have occurred over the years, which can result in selection on individuals by disease pressure (Pretto et al., 2014) and consequently a modification of the genetic composition. Data concerning the Atlantic coast refines the population structure identified previously, providing evidence of a greater genetic subdivision. Arias-Pérez et al. (2016) identified three genetically different regions, Cantabric Sea, Rías Baixas and the Gulf of Cadiz. The genetic differentiation of Rías Altas found in this study suggests that the genetic differentiated region of Cantabric Sea identified by Arias-Pérez et al. (2016) extends up to BA, given that RB examined here and the Eo locality examined in Arias-Pérez et al. (2016) are in a small ría with about 14 km2 of extension and, therefore, it is unlikely that those localities are genetically differentiated. Although the localities examined differ, the results obtained for Rías Baixas and Gulf of Cadiz are in good agreement with those of Arias-Pérez et al. (2016). The analysis for the first time of samples from the North coast of Portugal allowed us to detect a new genetically differentiated region. The levels of genetic differentiation detected between the Atlantic regions were low (FST < 0.02), but it should be taken into account that highly variable microsatellites markers rarely yield high FST values (Edelaar & Bjorklund, 2011). The picture of marked subdivision along the Atlantic coast of the Iberian Peninsula contrasts with the population structure inferred for other bivalves such as the mussel Mytilus galloprovincialis (Diz & Presa, 2008), the sword razor shell Ensis siliqua (Arias-Pérez et al., 2012) or the wedge clam Donax vittatus (Fernández-Pérez et al., 2017), where a reduced or insignificant genetic structure was detected. The pattern of genetic variation across the Atlantic Iberian Peninsula coast could be more likely explained by contemporary environmental conditions than historical factors. As in Arias-Pérez et al. (2016), the degree of genetic differentiation detected in R. decussatus with microsatellites markers increased significantly with geographic distance, according to a model of isolation by distance, where gene flow is prevalent but the exchange of individuals is more frequent among nearby than more remote populations. However, it cannot be ruled out that local factors, such as currents affecting larval dispersion or the selection, could subtly affect the detected pattern of isolation-by-distance.
Perkinsus infection and clam genetic composition
Perkinsus infection levels among European populations have been studied for many years due to its association with episodes of massive mortality (Ruano, Batista & Arcangeli, 2015). Herein, the semi-quantitative RFTM assay was used to evaluate Perkinsus´ infection level. This method is easy to perform, sensitive, and very cost-effective. However, it is not specific at the species level and it is very invasive. The RFTM assay is the most widely used method, allowing the detection of all known Perkinsus species with exception of P. qugwadi (Blackbourn, Bower & Meyer, 1998). For that, infection by the parasite was evaluated by molecular techniques such as the amplification of the ITS region to detect the presence/absence of the parasite; and also by RFLP technique to determine the species (Abollo et al., 2006). All positive samples were infected by the P. olseni parasite. It is interesting that only this species was found in clams when other species of the parasite are present in the same areas such as P. chesapeaki in Galician waters (Ramilo et al., 2016). VE and AV were the localities with higher and lower Perkinsus infection level, respectively. Moreover, within the same location, different levels of P. olseni infection were detected in clams with similar size/age. This may suggest that within the same locality, there are individuals with different susceptibility for Perkinsus. These data are in line with those reviewed by Ruano, Batista & Arcangeli (2015), who reported the presence of Perkinsus in different localities from Portugal, Spain and Italy. In fact, the distribution of Perkinsus spp. in Europe is extensive, ranging from the North eastern Atlantic and Mediterranean Sea (Ruano, Batista & Arcangeli, 2015), being P. olseni the most prevalent species. Different factors can affect Perkinsus infection level in clams, namely the abundance of infectious stages, hydrodynamics of the environment, density of the host population and clam age. Moreover, temperature, salinity, clam condition (stress, immunity system, gonadal stage, food availability, among others) can affect infection level of individuals within populations. Thus, it is important to monitor Perkinsus infection level over time in the different populations and also to carry out challenge tests in controlled environment to select for Perkinsus resistant varieties for use in a breeding program.
The detection of significant differences in allele and genotypic frequencies at the loci RdATC-125, RdATC-215, RdATC-263 and RdATC-238 between P. olseni non-infected and infected individuals could be interpreted as result of a potential association with QTL related to P. olseni infection. Three specific alleles, RdATC215-143, RdATC238-164 and RdATC215-152 were identified as more directly related to P. olseni infection. Individuals with RdATC215-143 or RdATC238-164 might have higher susceptibility to the infection, while, those with RdATC215-152 might have higher propensity for disease resistance, at least in clams from Atlantic coast of the Iberian Peninsula. During the implementation of selective breeding programs, conducting further analysis of loci along several generations, it would be possible to test the utility of the identified alleles and its linkage to Perkinsus resistance. Therefore, the data provided open the first way for the identification of markers that assist the obtaining of perkinsosis resistant varieties of R. decussatus.
As described before, to establish the founder population to conduct a selective breeding program the following main aspects should be considered: (i) broad genetic diversity to avoid rapid inbreeding and to maximize the likelihood of long-term genetic response; (ii) broodstocks should come from locations with long-term exposure to Perkinsus, where high natural selection pressure exists. This may result in highly infected individuals that can tolerate the infection and stay alive and/or individuals with low infection or without infection that present a combination of genes that confer resistance to the parasite; (iii) the facility of a regular supply of clams all year round is also desirable. Considering this, integrating results of genetic diversity within and among populations to obtain the maximum genetic diversity, the origin of the populations chosen to establish a founder population with clams for a breeding program would be BA from Rías Altas, PO or CA from Rías Baixas, OB from North Coast of Portugal, and AL and VE. Regarding the analysis of Perkinsus infection level and microsatellite results, individuals with the presence of alleles RdATC215-152 should be prioritized, in order to have parental individuals with a potential molecular trait associated with the resistance to the parasite.
Conclusions
This work reports an assessment of the genetic diversity and population differentiation of new localities of R. decussatus and an evaluation of P. olseni infection levels. Significant differences in allele and genotypic frequencies at four microsatellite loci between P. olseni infected and non-infected individuals were found, and also both a positive or negative relationship between the frequency of certain alleles and the parasite infection. Based on the genetic and infection analysis a founder population for a breeding program is proposed. The data provided constitute a preliminary base for selecting R. decussatus clams with resistance to perkinsosis.