
Identification of Dendrobiums in situ by Raman spectroscopy and micro-computed tomography imaging
- Published
- Accepted
- Received
- Academic Editor
- Sreeprasad Sreenivasan
- Subject Areas
- Raman Spectroscopy, Surface and Structural Imaging
- Keywords
- Dendrobium, Raman, Identification, In situ, Imaging
- Copyright
- © 2022 Zhang et al.
- Licence
- This is an open access article distributed under the terms of the Creative Commons Attribution License, which permits unrestricted use, distribution, reproduction and adaptation in any medium and for any purpose provided that it is properly attributed. For attribution, the original author(s), title, publication source (PeerJ Analytical Chemistry) and either DOI or URL of the article must be cited.
- Cite this article
- 2022. Identification of Dendrobiums in situ by Raman spectroscopy and micro-computed tomography imaging. PeerJ Analytical Chemistry 4:e18 https://doi.org/10.7717/peerj-achem.18
Abstract
Background
Dendrobium candidum/officinale (Dendrobium candidum Wall.ex Lindl.; Dendrobium officinale Kimura et Migo) is an expensive medicinal plant used mainly as a tonic in China. Tie-pi-feng-dou is the common name of the processed medicinal Dendrobium candidum/officinale. The market prices of Dendrobium sources vary significantly and it is difficult to identify different types of Dendrobiums due to their similar appearances. The use of counterfeit Dendrobium candidum/officinale is ubiquitous and problematic. Therefore, it is important to be able to discriminate between the wide range of available Dendrobium.
Methods
In an effort to better distinguish between the varieties of Dendrobium, Raman spectroscopy was used to detect specific Dendrobiums relative to their source. Transport channel imaging of the microstructural sites by micro-computed tomography (micro-CT) was used to identify the unique constitution and enrichment status of dendrobines, which was determined mainly by the geographical source of the Dendrobium. This implies that exclusive spectral traits may be unique to different regions. The presence or absence of these traits differ among the geographical origins.
Results
We can identify several spectral traits for various Dendrobiums. An intense peak at 1,525 cm−1 was only found in Dendrobium candidum/officinale (Zhe-jiang/Yun-nan/An-hui), while the characteristic Dendrobium candidum/officinale bands were near 742 cm−1, 1,326 cm−1 and 1,330 cm−1. A systematic method for distinguishing between four geographical locations of Dendrobium (Zhe-jiang/Yun-nan/An-hui/Gui-zhou) were established. This reveals that the origin of an unknown Dendrobium may be identified by Raman spectroscopy and micro-CT imaging. This method was shown to be efficacious, fast, and non-destructive.
Introduction
In situ identification has been of great interest in a wide range of fields. Studies on in situ Raman identification represent a growing field. Dendrobium candidum/officinale (Dendrobium candidum Wall.ex Lindl.; Dendrobium officinale Kimura et Migo) has been one of the most well-known traditional herbs in China for centuries. Dendrobium is currently thought to boost human immunity, nourish the stomach, reduce blood sugar levels, prolong life, and has shown promising therapeutic effects in Alzheimer’s disease (Nie et al., 2016; Lo et al., 2004; Luo et al., 2008; Bulpitt et al., 2007). In the last few decades, there has been a surge of interest in the effects of Dendrobium for the preservation of health. According to the traditional Chinese medicine (TCM) theory, health preservation seeks to maintain health, prevent diseases, and prolong life expectancy for an individual. However, the counterfeiting and the adulteration of herbal products have been reported in a number of upscale suppliers of these treatments. In situ Raman identification can play an important role in combating counterfeited Dendrobium. There is an urgent need to address the safety problems caused by the adulteration of these products as the adulterated and substituted species may have different or lower pharmacological action compared with that of their authentic counterparts. At present, the identification of this kind of Chinese medicine is difficult, and the majority of Dendrobiums purchased in the market are not authentic Dendorbium candidum/officinale. The purpose of our work was to explore whether in situ Raman spectroscopy can be used as a rapid analytical tool to evaluate the quality of Dendrobium candidum/officinale. Raman spectroscopy is a relatively fast and nondestructive technique and the spectra of Raman are easily reproducible with minimal sample preparation.
As early as 200 B.C., the use of Dendrobium candidum/officinale had been recorded in medical books, making it one of oldest traditional Chinese medicinal plants. In modern times, many health characteristics of Dendrobium candidum/officinale have been confirmed and it is commonly used to treat various sub-health conditions. In addition, a broad spectrum of illnesses, irrespective of cause, were treated using Dendrobium as an immunologic agent (Wang et al., 2013; Xie et al., 2016; Zha et al., 2014; Yang et al., 2014). There are several different kinds of Dendorbium candidum/officinale (including Zhe-jiang, An-hui, and Yun-nan varieties) and Dendrobium nobile (Gui-zhou) in China. The amount of dendrobine from plants of different origins varies and we may be able to deduce the origin of Dendrobium through the identification of their specific species. Dendrobium candidum/officinale products are now available in many forms, such as granule, capsule, tablet, and the whole stem. The variety of plant species and its growth environment and storage conditions will have a great influence on the dendrobine proportions, so it is plausible to use an analytical method to identify the origin of Dendrobium candidum/officinale.
The price of authentic Dendrobium candidum/officinale is much higher than that of a substituted species (including Dendrobium nobile), therefore, a producer may alter the source of the Dendrobium candidum/officinale for financial reasons. Raman spectroscopy has the ability to rapidly measure medicine and chemical reagents in situ, and its application requires no chemical treatment of Dendrobiums. Raman spectroscopy is highly applicable to the fields of forensic science and law enforcement (Sikirzhytski, Sikirzhytskaya & Lednev, 2011; Bell et al., 2005; De Gelder et al., 2005) and may also facilitate the identification of kinds of Dendrobiums.
Several spectroscopic methods can be used to discriminate Dendrobium officinale from non-Dendrobium officinale, such as near-infrared spectroscopy (NIR) (Wang, Xiang & Zhang, 2009; Hu et al., 2014; Wei et al., 2015) and the determination of total polyphenols content in Dendrobium officinale (Ma et al., 2016). HPLC has also been used to analyze the acids and coumarin derivatives in Dendrobium stem powder (Zhang et al., 2006; Chen et al., 2012). Gas chromatography (Wang et al., 2011), mass spectrometry (Wang et al., 2016; Wu et al., 2016; Tao et al., 2015; Zheng et al., 2015), mid-infrared (Chen et al., 2015; Luo, He & Chun, 2013) and NMR spectroscopy (Gao et al., 2018) have also been applied as spectroscopic methods in the process of instrument analysis. However, the use of in situ precise micro-CT navigation has not been well-reported prior to Raman spectroscopy. The aim of this study was to explore the validity of in situ Raman spectroscopy in the discrimination of Dendrobiums and to distinguish Dendrobium candidum/officinale and Dendrobium nobile by direct explication of the Raman spectra of Dendrobium. We also sought to identify its exclusive features for the rapid identification of unknown samples of Dendrobium.
Nevertheless, we observed Dendrobium tissue inhomogeneity due to the fibrous component and local differences in cell density. In other words, measurement uncertainty was amplified by the nonuniformity of the native tissue; that is, the tissue was not homogeneous. Therefore, how to efficiently find the position of homogeneity of dendrobine, has become particularly important. To improve the reliability and stability of in-situ Raman detection, this work introduced the image navigation technique with computed tomography reconstruction. And the detecting position could be identified easily on the Micro-CT scan. The proposed method is extended here to combine in-situ Raman spectroscopy with X-ray Micro-CT to allow image-guided Raman spectroscopy using anatomical structures from CT as a priori knowledge.
Materials & Methods
Samples
Fresh strips of Dendrobium candidum/officinale samples of Zhe-jiang (ZJ), An-hui (AH) and Yun-nan (YN) origins (provinces of China) were obtained. Slices of Dendrobium nobile (Gui-zhou, GZ, province of China) were also used in this study (Table 1).
Micro-CT navigation and positioning
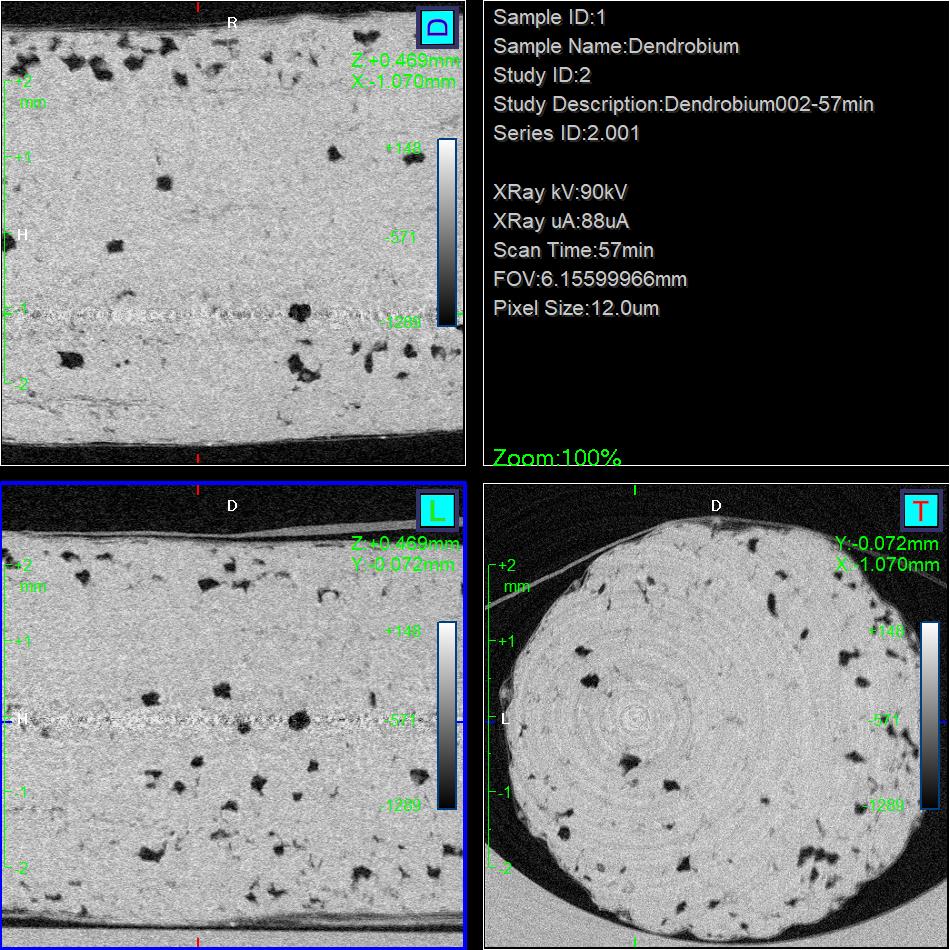
The micro structure of Dendrobium was observed by using micro-computed tomography (Micro-CT) (Quantum GX2; PerkinElmer Co., Ltd., Waltham, MA) with the following parameters: scanning voltage 80 kV; scanning current 80 µA; and imaging was acquired with a field of view (FOV) of 18 mm. Micro-CT reconstructions demonstrated the real architecture (Fig. 1A), and the red rectangular boxes (Fig. 1B) outline a sagittal image of the detecting site. This site demonstrates the microstructure characteristic of a long, perfectly connected transmission channel through the entire Dendrobium. To ensure consistency in the basic data, all Raman spectra were obtained using the same detecting site positioned at the center of red rectangular box at the transversal section (Fig. 1A). The data were untreated.
| Code | Province of China | Longitude | Latitude | Place of collection |
|---|---|---|---|---|
| 1 | Yun-nan | 104 | 23 | Yun-nan Wen-shan |
| 2 | Zhe-jiang | 121 | 29 | Zhe-jiang Tian-tai |
| 3 | An-hui | 116 | 31 | An-hui Huo-shan |
| 4 | Gui-zhou | 105 | 28 | Gui-zhou Chi-shui |
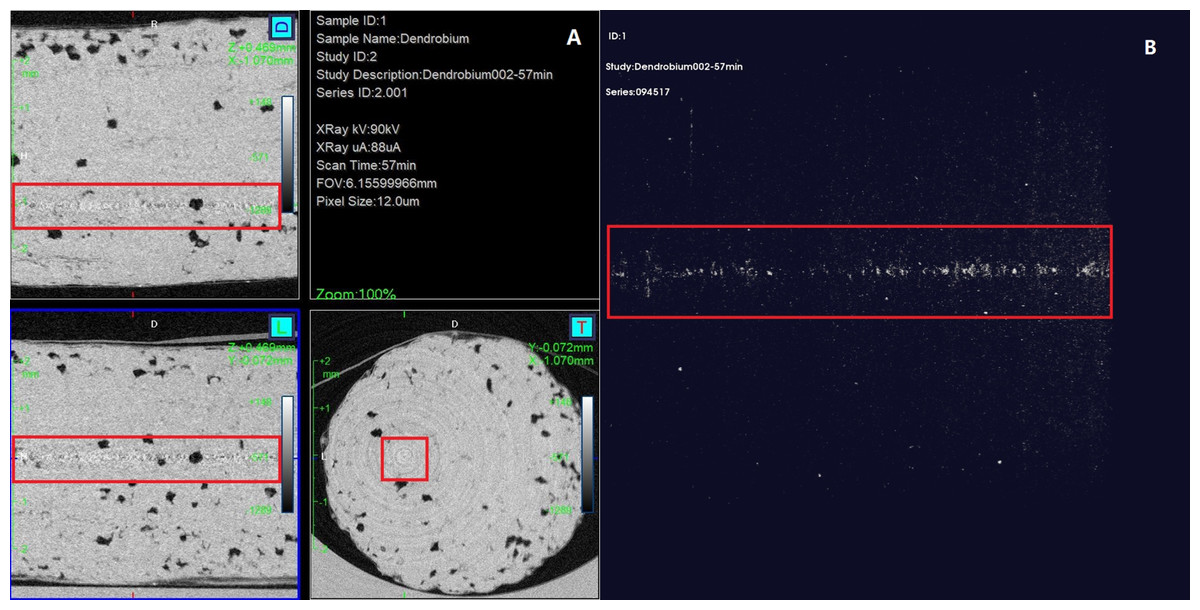
Figure 1: Transversal (T), sagittal (L), coronal (D) and reconstruction (top right) views of Dendrobium.
The rectangular box indicates the position where Raman spectra were measured.
Raman spectroscopy
The Raman spectrum was obtained from direct scanning on the transversal surface of sliced Dendrobium stem in situ. The Renishaw inVia (Gloucestershire, United Kingdom) Raman instrument was used to obtain Raman spectra using a semiconductor laser via a resolution of four cm−1 at 785 nm. Owing to the Dendrobium origin and sliced positon, the laser power was adjusted to 10% at source. The exposure time was 10 s, the continuous spectrum scanning was conducted three times, 50 × objective lens, scanning range was 1,700–200 cm−1, and three points were selected randomly in a 3 ×2 mm field of vision for surface scanning. In order to get reproducible average values, scans were conducted three separate times at different points. To avoid Raman spectral line drift and ensure consistency, we kept the laser power low in spectral measurements. Band assignments for normal Raman spectra of Dendrobium candidum/officinaleare listed in Table 2.
Results
Raman spectra of different positions of same Dendrobium stem (same origin)
For reproducibility, three positions (top (T), middle (M) and bottom (B)) of the same stem were sliced to obtain Raman spectra. The corresponding positions of the 17 peaks marked in the Raman spectrum of dendrobine can be found in the Raman spectrum of Dendrobium samples (Fig. 2). All of the marked peaks are the representative spectra of dendrobine. The Raman peak intensity measured for different samples and locations was the ratio of integrating peak height. As the integrating peak height at 1,185 cm−1 is relatively stable compared with other peaks in the spectra of Dendrobium samples, we defined this peak as the basic peak.
| Raman shift/cm−1 | Assignment |
|---|---|
| 1326, 1333 | C-H deformation (isopropyl) |
| 742 | Ring vibration |
| 519 | S-S stretching |

Figure 2: Raman spectrum of dendrobine.
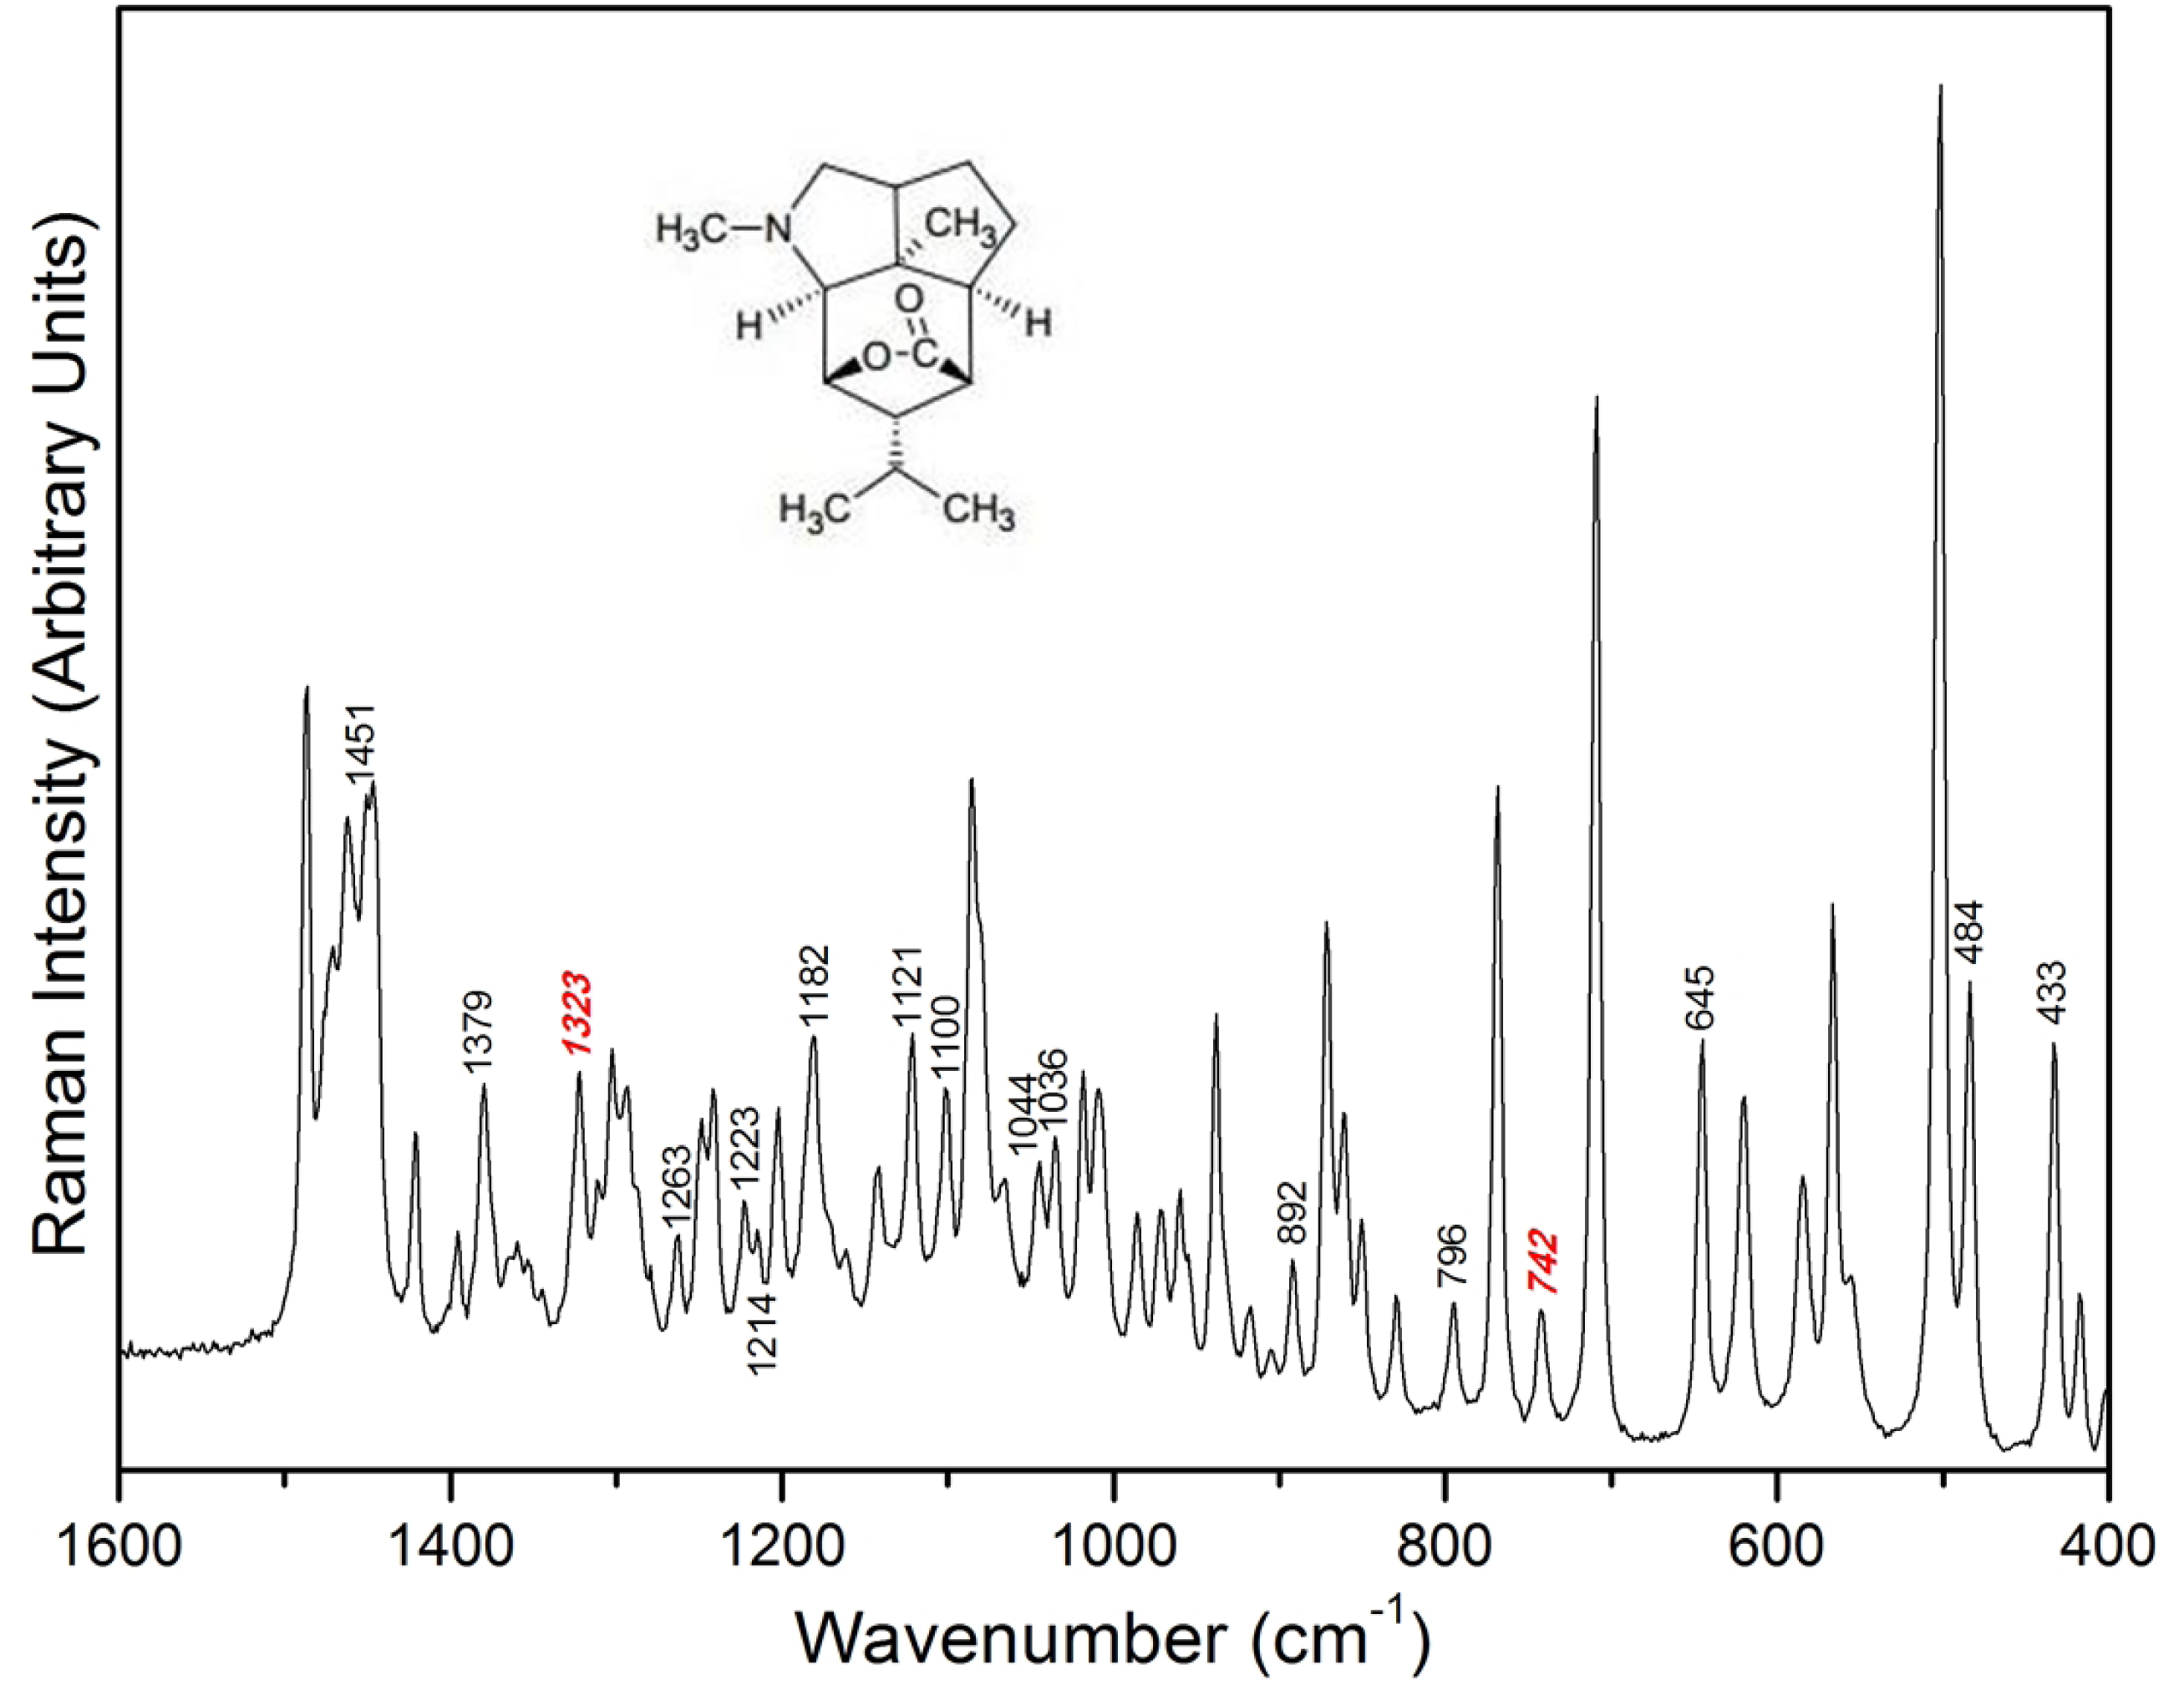
To compare the difference among the samples, we labelled the figures, and highlighted the specific Raman peaks in Figs. 2, 3 and 4. The specific Raman assignments are shown in Table 2. The spectra obtained from the Dendrobium specimens, Zhe-jiang (Fig. 3A), An-hui (Fig. 3B), Yun-nan (Fig. 3C), and Gui-zhou (Fig. 3D), have analogous peaks. Nevertheless, the slight distinctions in the peak shape and strengths of certain peaks still exist owing to the inconsistent dendrobine contents of four sources of Dendrobiums and diverse surrounding environments throughout the growth of Dendrobiums. In the three positions (T, M, and B) of spectra for ZJ and AH, the peaks at 742 cm−1 are weaker than others, whereas in the spectrum of YN, this peak was as intense as the others. The peak area of this exclusive spectrum (742 cm−1) was shown to be unstable at different positions, while the exclusive peak at 1,326–1,333 cm−1 was stable. Figure 3D shows that there is a clear decreasing trend at 742 cm−1. What is interesting about the data in this figure is that the wavenumber of ring vibration (742 cm−1) was moved to 724 cm−1. This result is significant at the GZ sample. Figure 3 reveals that four samples all generated well-defined spectra and that the Raman peaks of three different positions are similar.
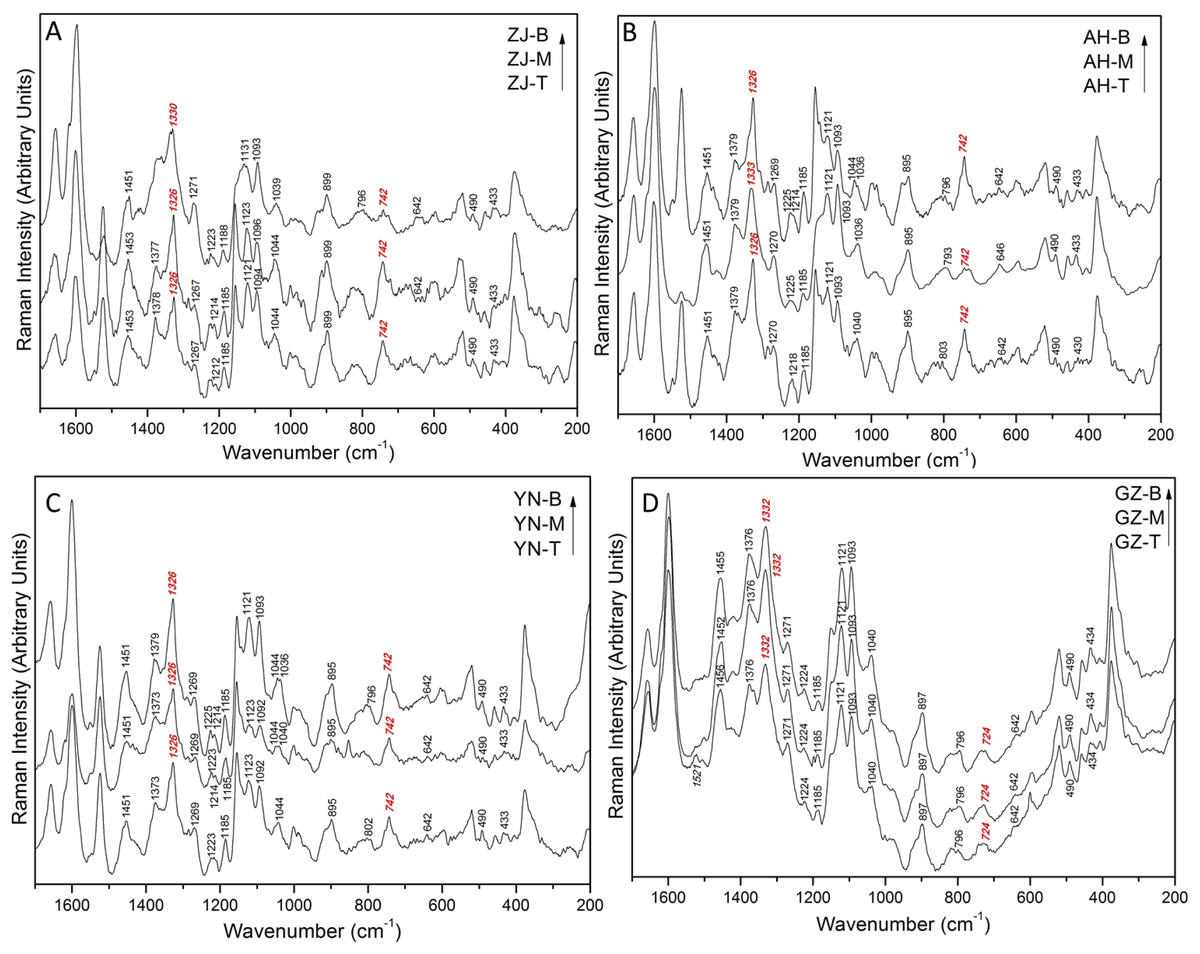
Figure 3: Raman spectra of Dendrobium candidum/officinale (ZJ/AH/YN) and nobile (GZ) at different positions (B-bottom, M-middle, T-top).
ZJ, AH, YN and GZ represent the origin of Dendrobium in (A) Zhe-jiang, (B) An-hui, (C) Yun-nan and (D) Gui-zhou, respectively.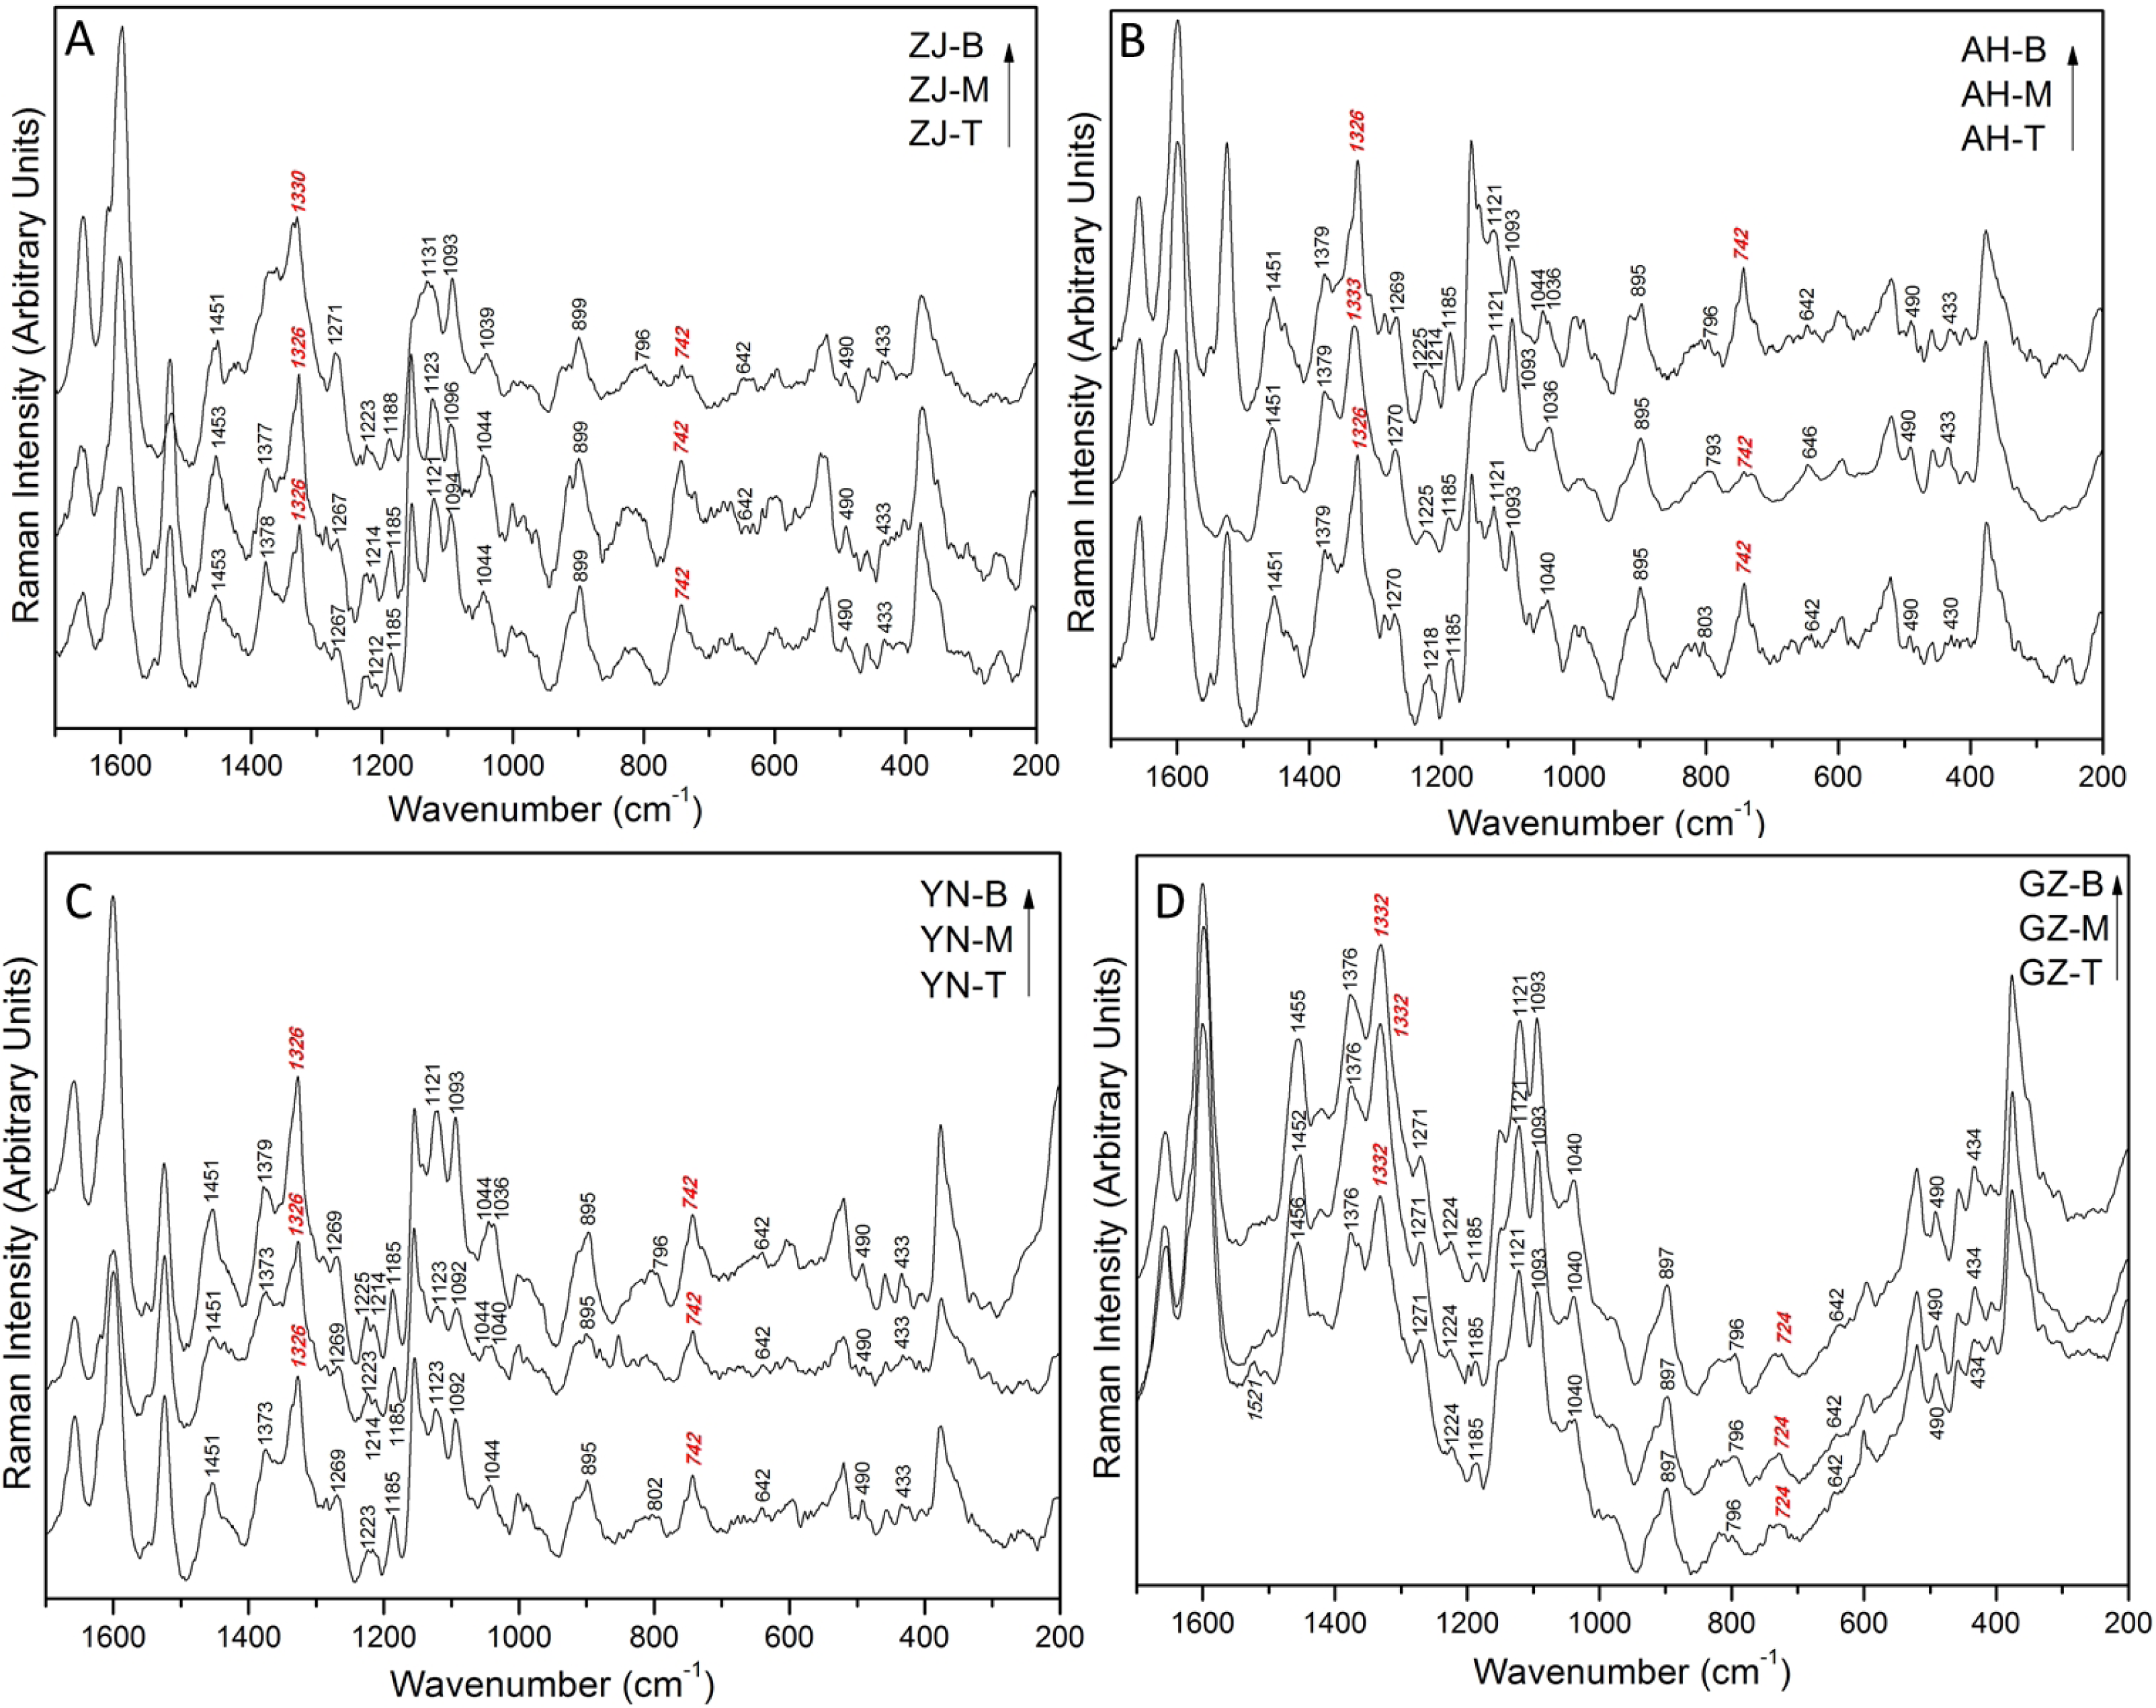

Figure 4: (A–D) Raman spectra of top/middle/bottom stem from Dendrobium of different origins.
Raman spectra of different origins of same Dendrobium stem (same position)
Spectra analysis was performed using the simple comparative analysis, with an 1,185 cm−1 peak serving as the comparator. We found that the difference of integrating peak height reflected the difference of dendrobine in Dendrobiums from different origins. Figure 4 shows that, except for the top position, there were evident differences in dendrobine content in the Raman spectra. The peaks at matching wavenumbers had the closet similarity at the top stem, whereas the peaks at the middle and bottom of the stem had a number of differences which were assigned to the different concentrations of dendrobine. Since the spectra from the top position had a consistent relative peak intensity in each sample, the top position was used as a fixed site for comparing different Dendrobiums.
The results of the comparative analysis were displayed in Figs. 4C, 4D and 5. All four Dendrobium samples (ZJ, AH, YN, and GZ) owned an assigned peak between 1,326–1,333 cm−1 (C–H deformation, isopropyl), which showed that the relative intensity was intense and stable. Another assigned peak at 742 cm−1 was the ring structure vibration. This peak was collectively intense in the bottom (AH and YN), middle (ZJ and YN) and top (ZJ, AH, and YN) sections. In addition, a stable and notable peak at 519 cm−1 with medium strength was appointed to S-S stretching, which indicates the existence of a protein including cysteine (Tarakeshwar & Manogaran, 1995). The observation may be related to the viscous proteins in Dendrobium, indicating that Dendrobium contains not only polysaccharides and dendrobine, but also rich protein substances.

Figure 5: The variation of identified peak intensity for different dendrobiums.
Aside from the assigned Raman peaks of Dendrobium, the Raman peaks were labeled according to the sample, specifically those peaks that helped to delineate the differences among different variants (Figs. 4C, 4D). Initially, at the top position, GZ is easily discerned by eye. The peaks at 1,525 cm−1 and 742 cm−1 were strong peaks for the ZJ, AH, and YN samples, while in the GZ sample, the intensity of those two peaks were weaker and disappeared. The Raman specificity of GZ Dendrobium was obtained through this step. An inspection of the spectra in Figs. 3A, 3B and 3C revealed that the peak was at 742 cm−1 with relative intensity changes at different positions. For the ZJ and AH samples, the peak shape at 742 cm−1 was found to be unstable in Raman spectra at different positions, however, the YN sample did not lose its stability. The Raman specificity of the YN Dendrobium was also obtained through this step. As for the remaining samples from ZJ and AH, they were more heterogeneous and contained a splitting of two peaks at 1,330 cm−1 and 1,326 cm−1. The results shown in Fig. 4A indicate that the peak located at 1,330 cm−1 was from the ZJ sample and the peak located at 1,326 cm−1 was from the AH sample. Taken together, these results suggest that there is an association between component spectra and Dendrobium varieties.
Raman spectra of Dendrobium candidum/officinale and Dendrobium nobile at top position
As seen in Figs. 4D and 5, the characteristic peak intensity of Dendrobium nobile (GZ) was higher compared to the Dendrobium candidum/officinale (ZJ, AH, YN) except for the peak at 897 cm−1. The peaks were very intense in the Dendrobium nobile spectrum. This difference was clearly detectable to the naked eye. Meanwhile, there was no significant change for the waveform appearance.
The peak at 1,332 cm−1 in the C-H deformation was assigned to isopropyl. There were also other peaks that were more closely matching Dendrobium candidum/officinale spectra. Peaks at 1,185, 1,121, 1,093, 897, and 490 cm−1 were identical to those peaks from Dendrobium candidum/officinale (Fig. 4C). The peaks at 1,456, 1,376, 1,332 and 1,271 cm−1 were nearly identical to the peaks observed from Dendrobium candidum/officinale specimens (Fig. 4C). Nevertheless, some differences were found. Surprisingly, only one peak at 1,521 cm−1 showed a significant difference. An intense peak at 1,525 cm−1 in Dendrobium candidum/officinale spectra did not appear in any of the Dendrobium nobile spectra, and the peak intensity at 1,521 cm−1 in Dendrobium nobile was very weak or disappeared (Fig. 3D). When compared to normal Raman spectrum of dendrobine, the peaks at 1,521 and 1,525 cm−1 did not belong to dendrobine in the Dendrobium samples. We were easily able to distinguish Dendrobium nobile from Dendrobium candidum/officinale using the Raman spectra.
Discussion
In the market circulation period, there is no accurate definition of Dendrobium candidum/officinale. Despite a label of Dendrobium candidum/officinale, the quality varies with its origins. Since natural Dendrobium candidum/officinale is very expensive at present, this study hoped to use an in-situ method to determine the authenticity of the product and subsequently reduce its cost without reducing its efficacy. Although the Raman spectra have no obvious distinguishing morphological features, the differences in specific peak characters were the biggest indicators between samples. For example, the shift of the two peaks at 1,326 cm−1 and 1,333 cm−1 between the spectra from ZJ and AH Dendrobiums differed (Table 2).
Through the direct comparison of different sources of Dendrobium, the spectra from the YN Dendrobium specimens (Fig. 3C) contained almost all of the spectral characteristics present from AH Dendrobium samples. Furthermore, it also displays approximate characteristics to spectra from ZJ sample. The Dendrobium samples used were unprocessed fresh samples, therefore, those spectral characteristics mainly reflected the molecular vibrational information of the dendrobine. For example, the C-H deformation peak between 1,326–1,333 cm−1 demonstrated that the deformation could be assigned to isopropyl C-H bonds (Table 2). By comparing a large number of spectral data, we found that the dominant peaks appearing in the spectra from either AH or ZJ Dendrobium emerged in the spectra from the YN Dendrobium without exception (Figs. 4A, 4B, 4C). There was an attempt to make a distinction for all three sources of Dendrobiums on the basis of spectral differences, as well as with Dendrobium nobile, which could be done using a step-by-step method to identify the origins directly (Table 3). The likenesses and distinctions among the spectra from diverse Dendrobium specimens can be utilized to discriminate the origin of Dendrobium. Based on above four steps (Table 3), we can easily assign the origin of GZ, YN, ZJ, and AH Dendrobiums by comparing the Raman spectra, respectively.
| Step | Appearance of spectrum | YES | NO |
|---|---|---|---|
| 1 | Peaks at 1525 cm−1 and 742 cm−1 (top position) with high intensity (Figs. 4C and 4D). | Spectrum may be from Dendrobium candidum/officinale. | Spectrum is from Dendrobiumnobile(GZ). |
| 2 | Peak at 742 cm−1 with relative intensity changes at different positions (Figs. 3A, 3B, and 3C). | Spectrum may be from Zhe-jiang (ZJ) or An-hui (AH) Dendrobium candidum/officinale. | Spectrum is from Yun-nan (YN) Dendrobiumcandidum/officinale. |
| 3 | Peak at 1330 cm−1 on the basis of step 2 (Fig. 4A). | Spectrum is from Zhe-jiang (ZJ) Dendrobiumcandidum/officinale. | |
| 4 | Peak at 1326 cm−1 on the basis of step 2 (Fig. 4A). | Spectrum is from An-hui (AH) Dendrobiumcandidum/officinale. |
Notes:
The relative intensity refers to the ratio of the intensity of any peak to the intensity of the basic peak at 1,185 cm−1.
Forthcoming utilization of Micro-CT navigation approaches (experimental design and analysis) enables wider application and impact from experimentally derived Raman data. Further research should be undertaken to confirm these results on a larger variety of geographical origins. We should conduct more works on a wider species of Dendrobiums from not only China but other Southeast Asian countries. To evaluate the accuracy and practicability of distinguishing among sources of Dendrobiums, portable Raman spectroscopic equipment should be used. We will provide a toolkit to disseminate our findings and potentially impact facile screening and on-site detection on a wider scale throughout China. Future studies could be improved to provide wider impact and a clearer rationale. To achieve this goal, we have to add a chemometric package to a portable Raman instrument for the purpose of screening abundant spectral data with minor forecasting error.
Conclusions
The purpose of the experiment as shown in Table 3 was to illustrate the steps required to provide an accurate identification of Dendrobiums from different origins. The novelty of our study lies in the measurement position of dendrobine in conduction path (Fig. 1B) and the relevance for in-the-field discrimination of Dendrobiums. Although this may seem to be a superfluous exercise, we believe it is important in view of the recent report showing that the price gap among Dendrobiums is quite significant, and can be 100-fold or even higher. Currently, this assessment mainly relies on the subjective judgment of experienced hands, which is inefficient and presents difficultly for the general population with low levels of experience. Therefore, we provided an objective, systematic, non-invasive, and in-situ method to help people distinguish diverse Dendrobiums from different sources. Through our step-by-step approach, Raman spectroscopy was shown to be a potential method to assess the authenticity of Dendrobiums. Although this method was not comprehensive, it reflected the in-situ components from different Dendrobium candidum/officinale samples.