
Electronic, magnetic and optical properties of XScO3 (X=Mo, W) perovskites
- Published
- Accepted
- Received
- Academic Editor
- Matthieu Verstraete
- Subject Areas
- Electronic, Optical and Magnetic, Energy Materials, Materials Science (other), Semiconductors, Sensors
- Keywords
- Transition metals, FP-LAPW, mBJ potential, Electronic structure, Dielectric function, Optical conductivity, Magnetic moments, Optical constants, Half metallic perovskites
- Copyright
- © 2021 Ramanathan and Khalifeh
- Licence
- This is an open access article distributed under the terms of the Creative Commons Attribution License, which permits unrestricted use, distribution, reproduction and adaptation in any medium and for any purpose provided that it is properly attributed. For attribution, the original author(s), title, publication source (PeerJ Materials Science) and either DOI or URL of the article must be cited.
- Cite this article
- 2021. Electronic, magnetic and optical properties of XScO3 (X=Mo, W) perovskites. PeerJ Materials Science 3:e15 https://doi.org/10.7717/peerj-matsci.15
Abstract
The density functional theory (DFT) full potential linearized augmented plane wave (FP-LAPW) method with the modified Becke–Johnson (mBJ) approximation is used to perform spin polarised calculations of the transition metal perovskites MoScO3 and WScO3. Both depict half metallic behaviour with semiconducting and metallic in the minority and majority spins respectively. MoScO3 and WScO3 have indirect R− Γ band gaps in the minority spin channels of 3.61 and 3.82 eV respectively. Moreover, they both show substantial integer magnetic moments of 3μB with 100% spin polarization typical to half metals. In addition, we calculate the dielectric function, optical conductivity and the optical constants, namely, the refractive index, the reflectivity, the extinction and absorption coefficients.
Introduction
The recent years has seen a lot of research on perovskites for potential applications in electronics, photovoltaics, renewable energy and innumerable other industries (Mannhart & Schlom, 2010; Kulkarni et al., 2012; Hodes, 2013). The universal structural formula of a perovskite is ABX3 and the cubic form is the most ideal case. X atom is usually oxygen. It could also be a halide. A/B atoms are in general alkali, alkali earth, rare earth or transition metals (Johnsson & Lemmens, 2007; Babu et al., 2012). Thus, an enormous variety of structural modifications and variants are possible which can accommodate almost all of the elements in the periodic Table. The flexibility in choice of atom types gives rise to a multitude of perovskite structures with interesting electronic, magnetic and optical properties and motivates the continued interest in this family (Hayatullah et al., 2014; Sesion et al., 2010; Aycibin & Naciye, 2017).
Transition metals (TM) are exceptionally valuable and allow for complex magnetic interactions depending upon the local environment and dimensionality to give intriguing magnetic, magneto-electric, multiferroic, piezoelectric properties (Ramanathan & Khalifeh, 2017; Cai et al., 2019; Wang & Zhang, 2004) and even induce non-magnetic materials to become magnetic (Ramanathan, Khalifeh & Hamad, 2009; Ramanathan, Khalifeh & Hamad, 2011). Thus, transition metal (TM) perovskites are of special interest and past research show a wide range of electronic, magnetic and optical properties owing to the complex nature of TM ion interactions with oxygen or halides (Kimura et al., 2003; Kovalenko, Protesescu & Maryna, 2017). It is mainly the unfilled or filled‘d’ bands of the TM that are responsible for the electronic/magnetic and dielectric properties respectively.
In most of the previous studies on TM perovskites, the TM occupies the B site. Recently, we explored the effect of 3d-filling on the electronic, magnetic and optical properties on TMScO3 perovskites where the TM (from Ti to Zn) sits on the A site (Mahmoud et al., 2020). The materials show half metallic behavior with wide band gaps, except for TiScO3 and VScO3 which are metallic and semiconducting. As, a further study, in the current work we explore the electronic, magnetic and optical properties with TM Mo and W which are isoelectric to Cr in group VI i.e. MoScO3 and WScO3 perovskites. The purpose of the paper is to give the essential and accurate theoretical information of the optoelectronic properties of these perovskite compounds, which are being investigated for the first time for possible technological applications and further research.
The perovskites MoScO3 and WScO3 are investigated from first principles using the full-potential linearized augmented plane wave (FP-LAPW) density functional theory (DFT) method with the wien2k software program. We have used the mBJ exchange potential as DFT-mBJ is a powerful tool and predicts the important electronic and band-structure related properties with high degree of accuracy.
The paper is arranged as follows: “Materials & Methods” gives the Calculation details, “Results” is devoted to the Discussion of results under the sub headings_ Structural and electronic; Magnetic and Optical properties, finally “Conclusions” presents the Conclusions.
Materials & methods
The full-potential linearized-augmented plane wave (FP-LAPW) method as implemented in the WIEN2k (Blaha et al., 2020) code based on DFT (Kohn & Sham, 1965) is used to calculate the spin polarized ground states of the perovskites. We have used generalized gradient approximation (GGA) of Perdew, Burke and Ernzerhof (PBE) (Perdew, Burke & Ernzerhof, 1996) to calculate the optimized structures at a 10 × 10 × 10 kpoint grid. The optimized lattice constant values have then been used with the more accurate Modified Becke-Johnson (mBJ) exchange correlation of Trans Blaha (Tran & Blaha, 2009) to evaluate the electronic, magnetic and optical properties using denser grids of 15×15×15 and 30×30×30 for electronic/magnetic and optical properties respectively.
In order to achieve energy eigenvalues convergence, the wave functions in interstitial region were expanded in plane waves with a cutoff of Rmt*Kmax set to 8; Kmax gives the magnitude of the largest K vector in the plane-wave expansion. The muffin-tin radius (RMT), which denotes the smallest atomic sphere radius is taken to be 2.5 and 2.7 a.u for Mo, W respectively and 1.60 a.u for Sc and O atoms. The Brillouin zone integrations within the self-consistency cycle are performed via a tetrahedron method (Blöchl, Jepsen & Andersen, 1994) using 120 k points in the irreducible wedge of the Brillouin zone (IBZ) for all compounds. The self-consistence calculations have convergence tolerance thresholds of less than 10−4 Ry in energy and 10−4 in electron charges.
Results
Structural and electronic properties
The MoScO3 and WScO3 Perovskites in the cubic form with space group is Pm-3m (#221) contain one formula unit and the Mo/W, Sc and O atoms are positioned at 1a (0, 0, 0), 1b (½, ½, ½) and 3c (0, ½, ½) sites of Wyckoff coordinates, respectively.
The lattice constants of XScO3 structures are optimized using Murnaghan equation of state (Murnaghan, 1944) and the energy vs volume curves are presented in Fig. 1 along with the structure visualization. The energies have been shifted by the minimum energy value which is set to zero in the plot. Since, the structure is cubic only volume optimization is required.
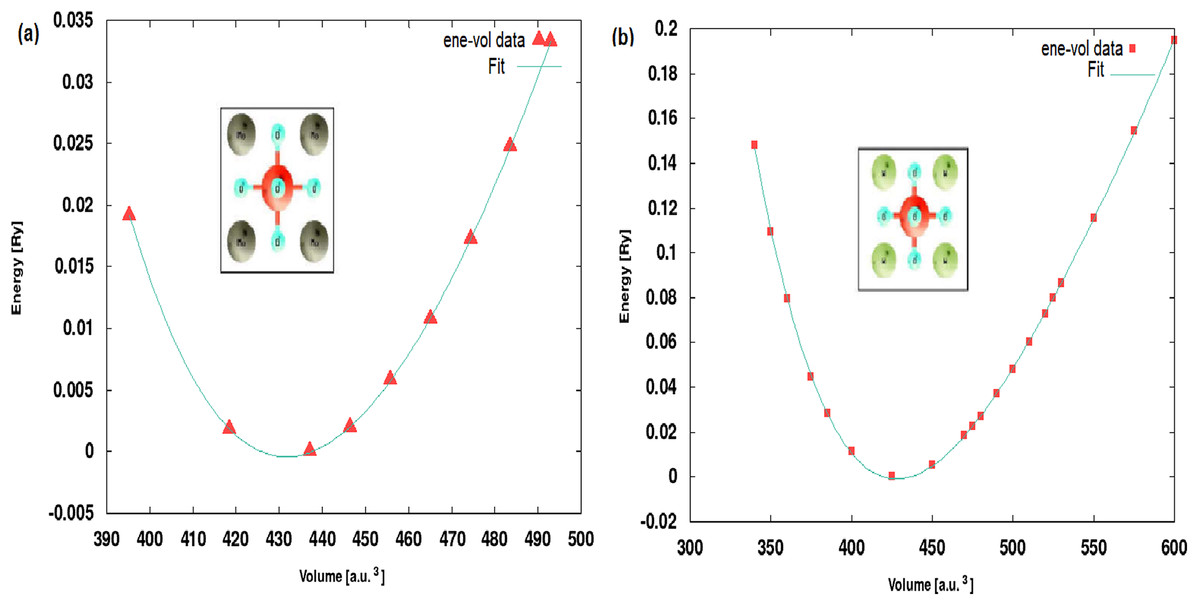
Figure 1: Optimised structures.
The energy-volume optimization showing the Murnaghan fit curves for (A) MoScO3 and (B) WScO3.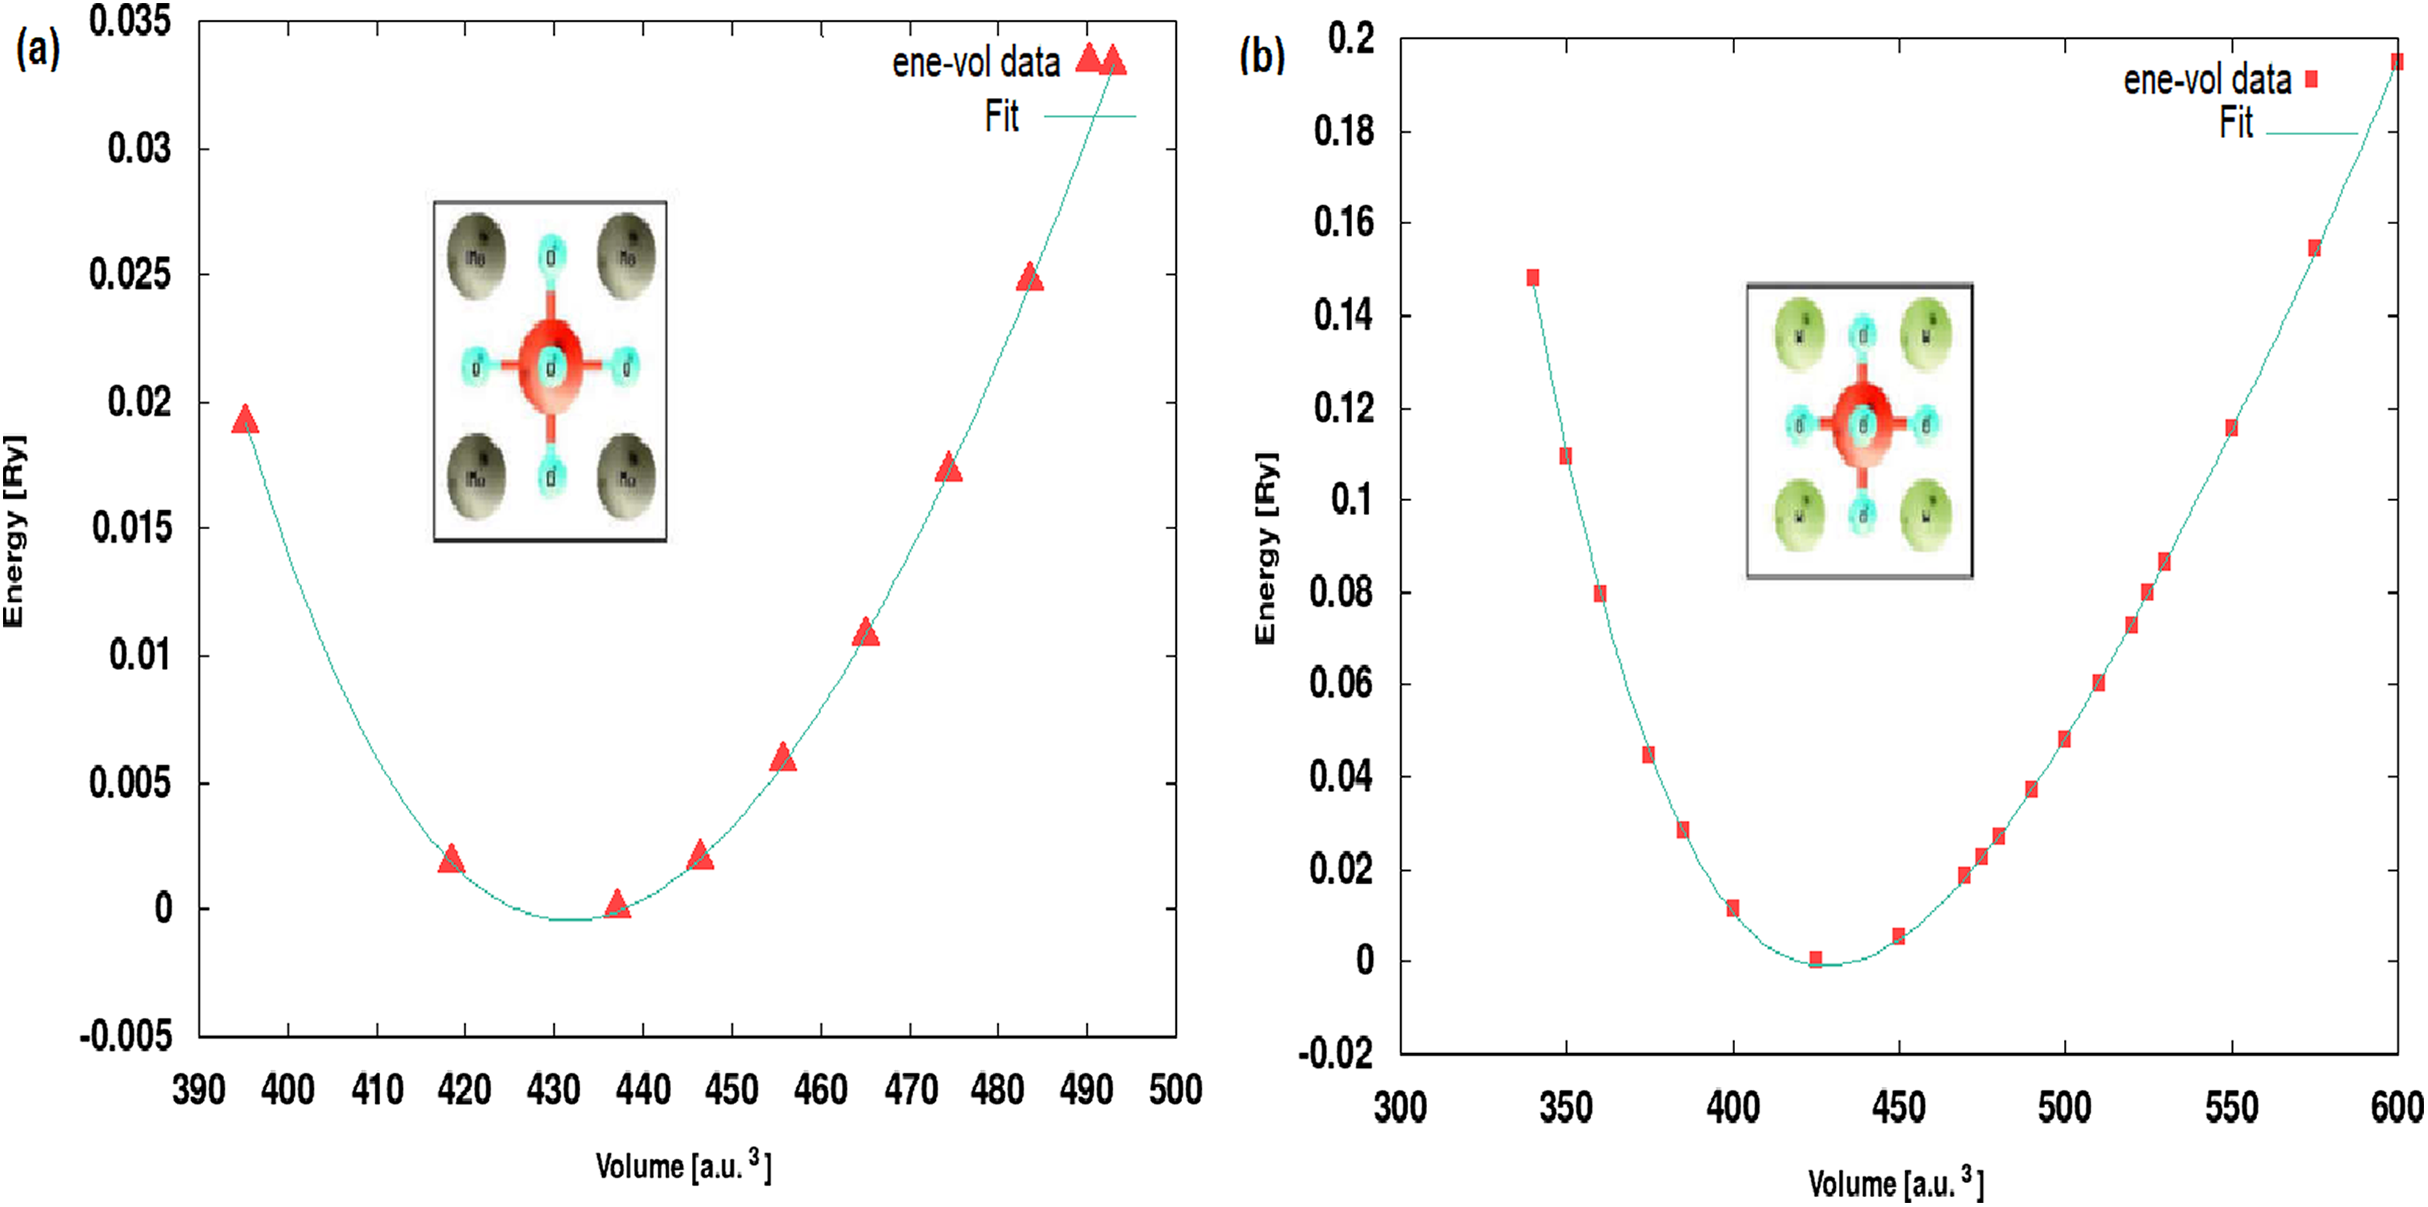
The optimized lattice constants and bulk moduli at the equilibrium minimum energy ground state are shown in Table 1. We notice from the Table that the lattice constant of the perovskites decreases slightly with increasing atomic numbers of the TM. Although, the individual ionic radii of Mo and W are comparable the decrease in size of the compounds can be attributed to the change in electronic density and changes in the occupation of the band orbitals in new molecular environment.
| Perovskites | Lattice constant a [Å] | Bo [GPa] | Eform [Ry] | Elastic constants (GPa) | ||
|---|---|---|---|---|---|---|
| C11 | C12 | C44 | ||||
| MoScO3 | 4.000 | 153.197 | −1.958 | 282.2 | 83.5 | 19.8 |
| WScO3 | 3.988 | 157.798 | −1.848 | 242.3 | 122.3 | 15.9 |
The thermodynamic stability of the perovskites is important for the existence and synthesis of these compounds. We have evaluated the energies of formation Eform for the perovskites to give an indication of their stability and these values are presented in Table 1. The energy of formation is obtained by using Eq. (1) below:
(1) where, Eform is the formation energy of the perovskite; X = Mo/W; ; and are the bulk equilibrium total energies of the XScO3 compound, the TM element and Sc respectively; and is the free energy of a single oxygen atom. The Eform obtained for MoScO3 and WScO3 are −1.958 and −1.848 Ry respectively. The negative values of formation energy indicate that the perovskites are energetically stable and can be easily synthesized experimentally.
In addition to the thermodynamic stability, the mechanical/structural stability of the perovskites is an essential factor that needs to be evaluated. The dynamic stability of a crystal is measured by its response to deformations and the evaluation of the elastic energy viz the elastic constants. If a system is deformed under equilibrium conditions arbitrarily through a small strain “e”, the change in energy would be as denoted in Eq. (2) below (Mouhat & Coudert, 2014).
(2)
The number of independent elastic constants in a crystal is dictated by symmetry of the system. For cubic symmetry as in the present study only three independent elastic constants C11, C12 and C44 are required to confirm the stability and the above equation is reduced to
(3)
The system will be dynamically stable if Uelast is positive i.e. the deformed system is at a higher energy. This condition restricts the values of elastic constants, which are the necessary stability conditions of Born (Born, 1940); C12 < B < C11; (C11 − C12) > 0; (C11 + 2C12) > 0 and C44 > 0.
We have obtained the second order elastic constant values by performing rigorous strain-energy calculations using the package ElaStic 1.0 (Golesorkhtabar et al., 2013) with the wien2k DFT code. The results for a second order fit are given in Table 1. A look at these values show that the comprehensive Born criteria holds true for both the perovskites and the mechanical dynamical stability of these perovskites is confirmed. Due to lack of previous experimental or theoretical works on these new perovskites we cannot compare our results for the thermodynamic or mechanical stability.
The dynamic stability of a crystal also requires that all the phonon frequencies in the spectra are positive and that there are no imaginary or soft phonon modes. We have investigated the phonons at the gamma point (zone center) by performing a density functional perturbation theory (DFPT) calculation using the Quantum Espresso code (Baroni et al., 2001) with projector augmented wave (PAW) pseudopotentials and the GGA-PBE exchange correlation (Perdew, Burke & Ernzerhof, 1996). Fully relaxed structures and very stringent convergence thresholds of 10−22Ry are used for highly precise and accurate results. The results for both the perovskites show the presence of imaginary phonon frequencies (negative values) at Γ point and indicate dynamic instability as seen from Table S1 of supplementary information. This implies the possibility of lower order symmetry phases and could indicate the presence of interesting ferroelectric order. More detailed experimental and theoretical investigations with full phonon dispersions for cubic as well other lower order structures are required to confirm these results and is a strong motivation for future work on these perovskites. For the sake of comparison by experimentalists we have included the simulated powder diffraction patterns of these perovskites in the supplementary information Fig. S1.
The electronic and optical calculations have been performed using the mBJ exchange functional to obtain highly accurate band structures of the perovskites and very reliable results for all the optical properties under investigation. The MoScO3 and WScO3 band structures along the high symmetry points are shown in Figs. 2 and 3 respectively.
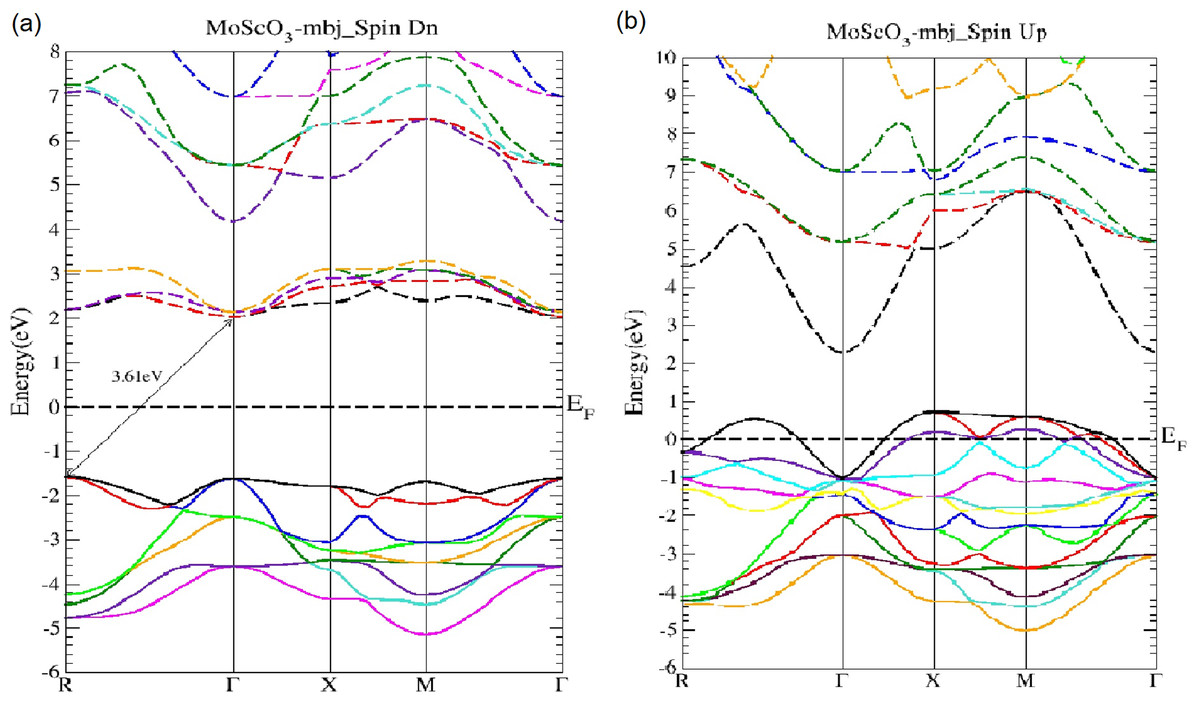
Figure 2: MoScO3 mBJ band structure.
The MoScO3 electronic band structures for (A) the minority (Spin Dn) and (B) the majority (Spin Up) channels.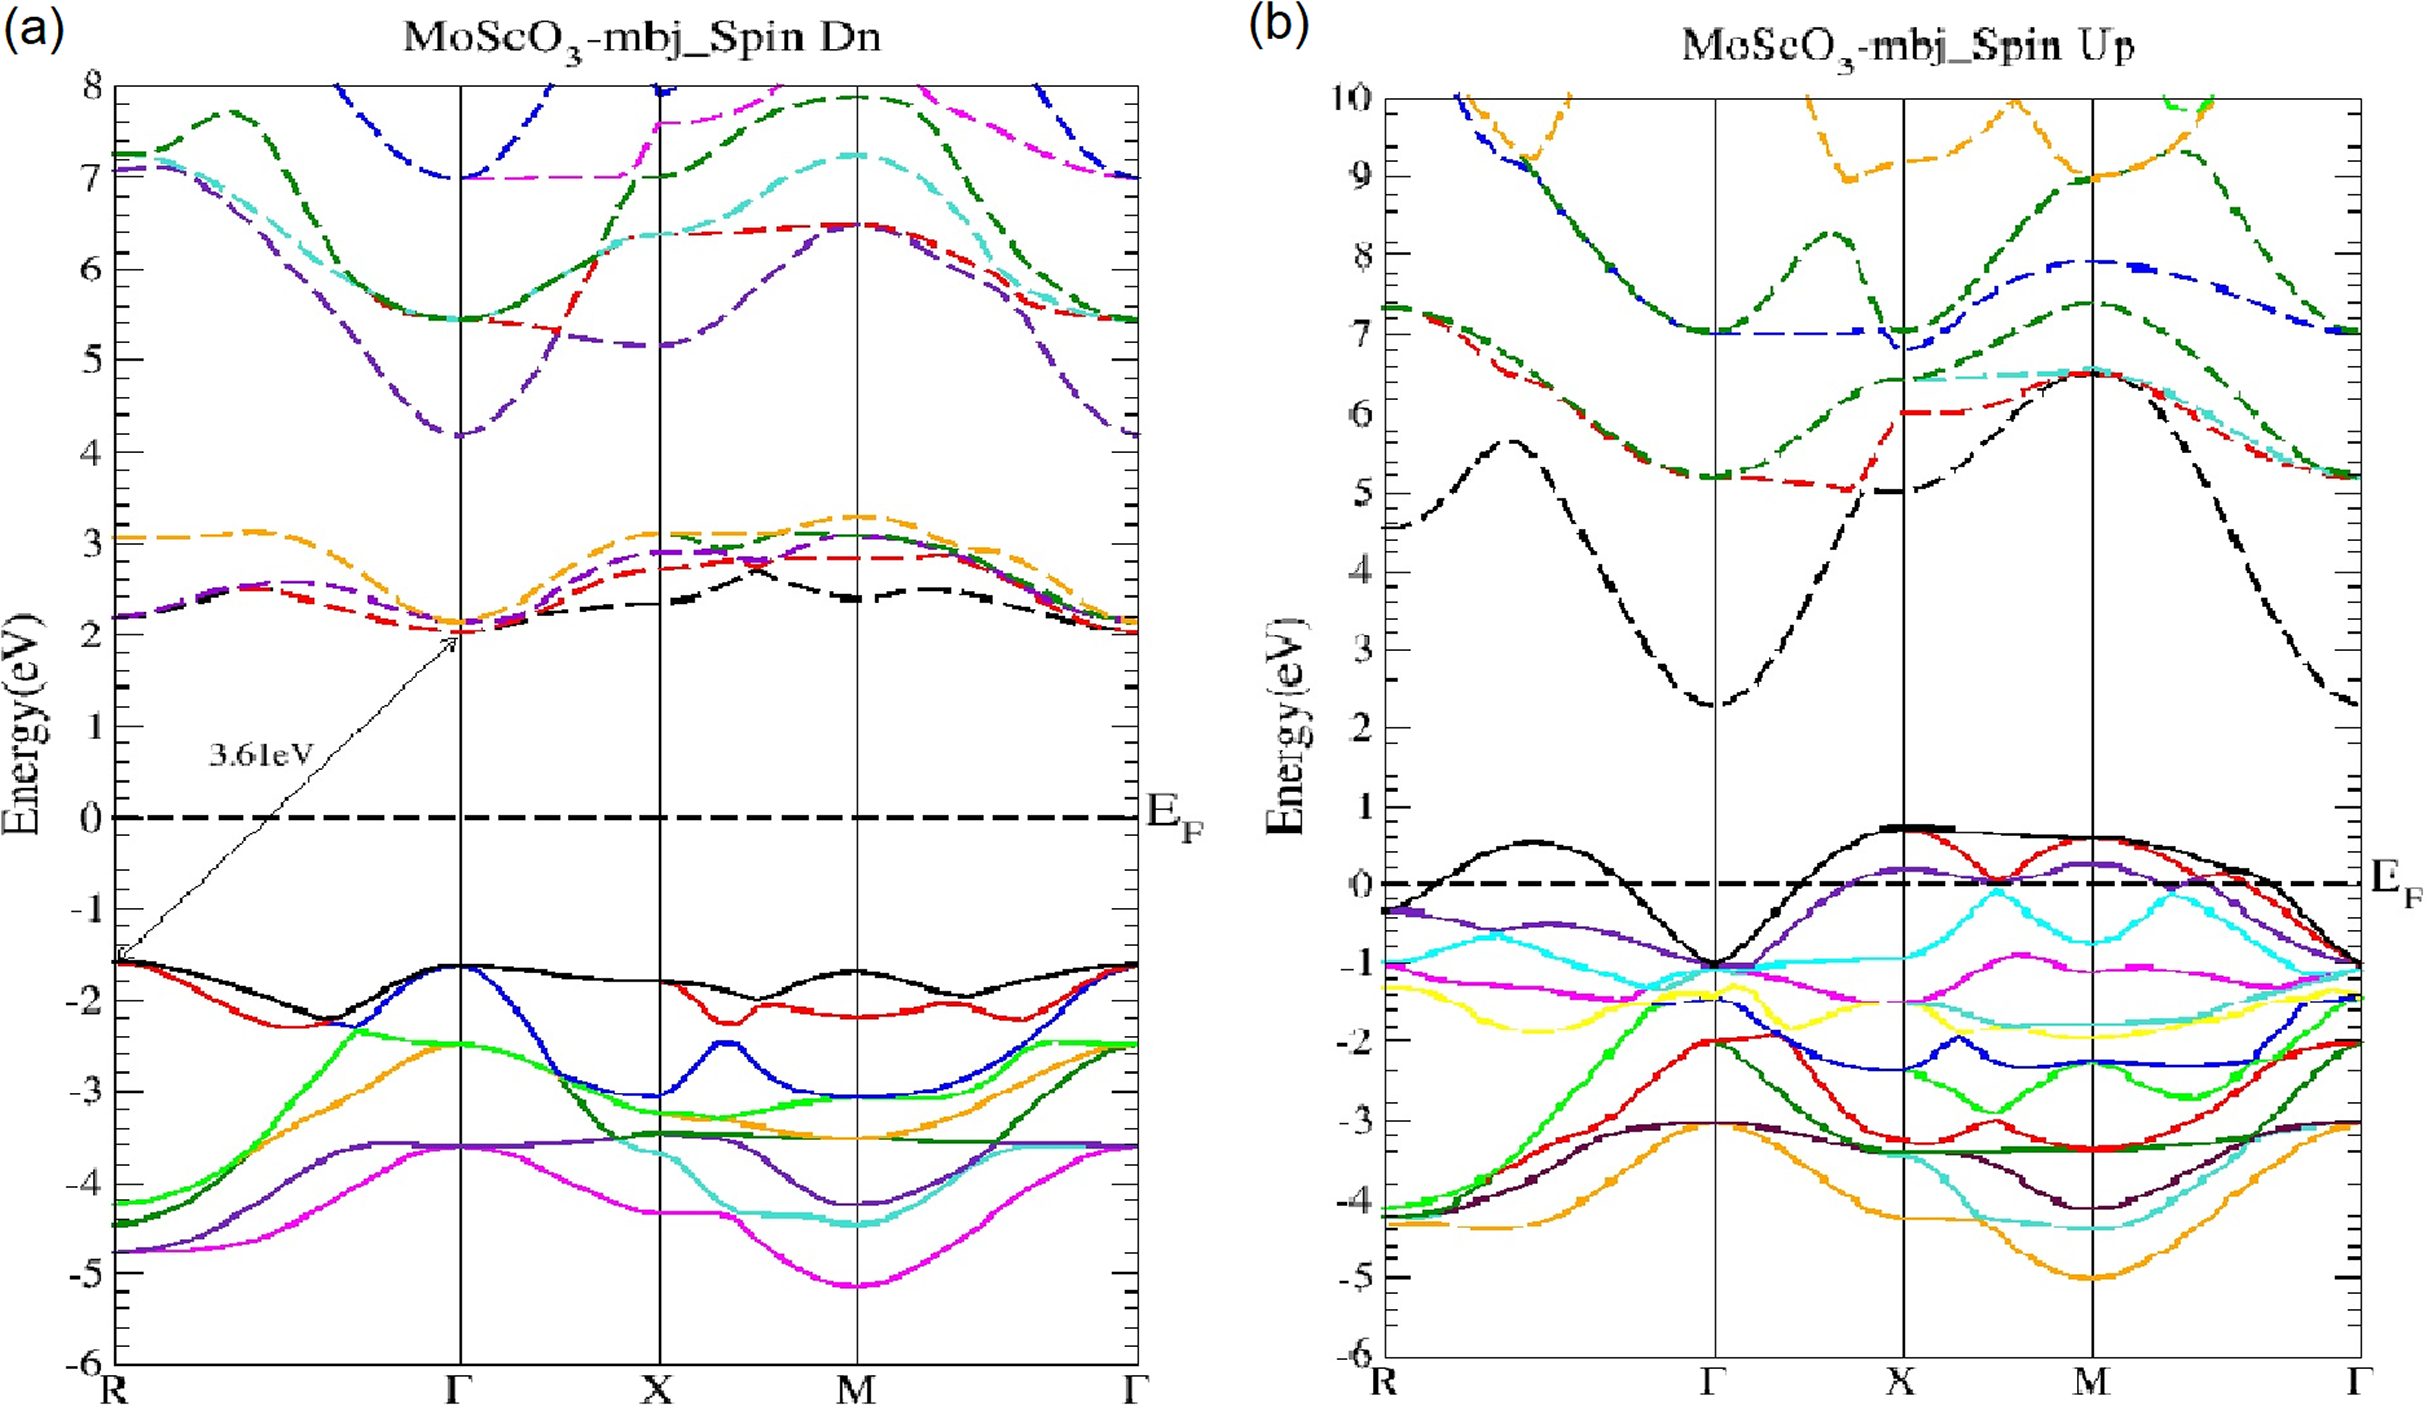
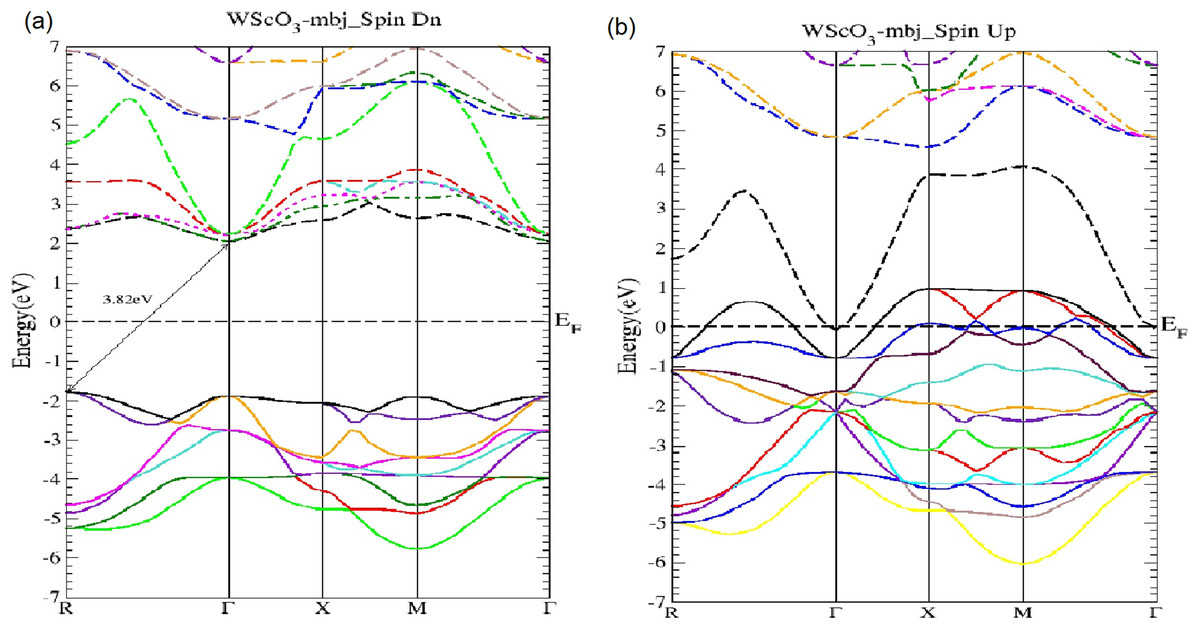
Figure 3: The WScO3 mBJ band structure.
The WScO3 electronic band structures for (A) the minority (Spin Dn) and (B) the majority (Spin Up) channels.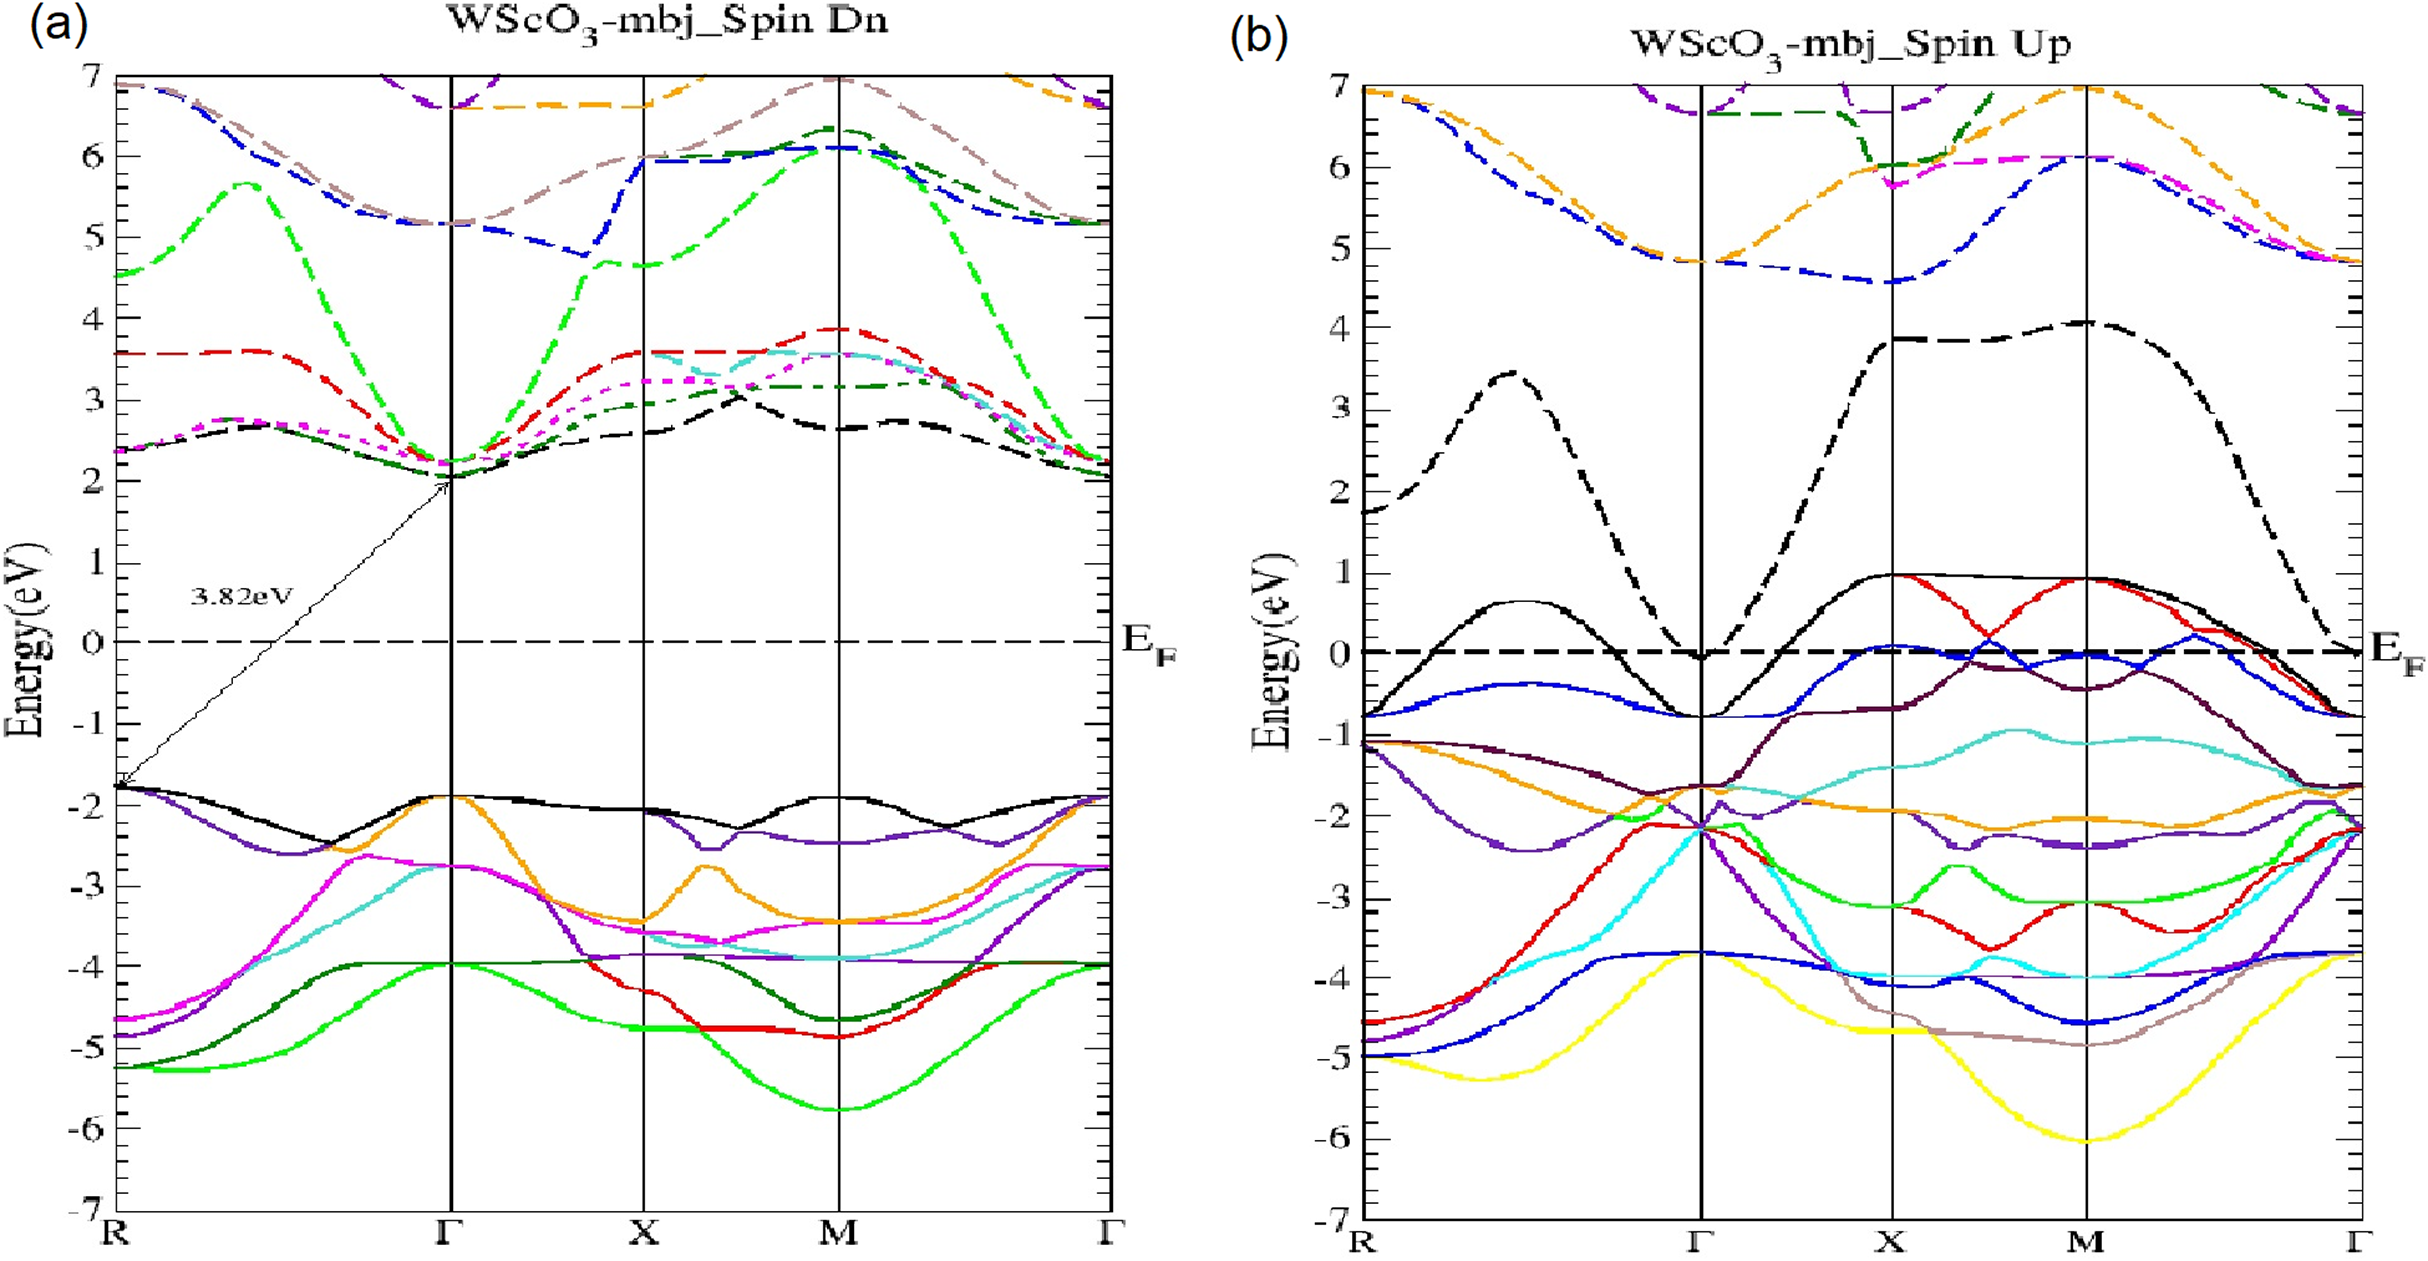
As seen from Fig. 2, MoScO3 shows interesting semi-conducting behavior in the minority spin with an indirect R−Γ bandgap of 3.61 eV which predominates over the direct Γ−Γ gap of 3.64 eV. In fact we see that the difference between valence band maximum (VBM) at the R and Γ points are very close, with just a difference of 0.033 eV.
In Fig. 3 the WScO3 band structures are depicted and in contrast to MoScO3 we see a more pronounced half metallic behavior. The minority band shows an indirect R−Γ gap of 3.82 eV and the majority spin band is strongly metallic with valence bands deep in the conduction band. Table 2 presents a summary of the band structure results.
| Pervoskite XScO3 |
Band-gap [eV] | |||
|---|---|---|---|---|
| Minority | Majority | |||
| MoScO3 | R− Γ Γ− Γ |
3.61 3.64 |
Slightly Metallic | No gap |
| WScO3 | R−Γ | 3.82 | Metallic | No gap |
| CrScO3 | Γ− Γ | 5.496 | Metallic | No gap |
Magnetic properties
Although the TM are paramagnetic and individually do not show any magnetism, the Mo/WScO3 perovskites are magnetic. The spin polarized total density of states (TDOS) plots is shown in Figs. 4 and 5 for MoScO3 and WScO3 respectively.
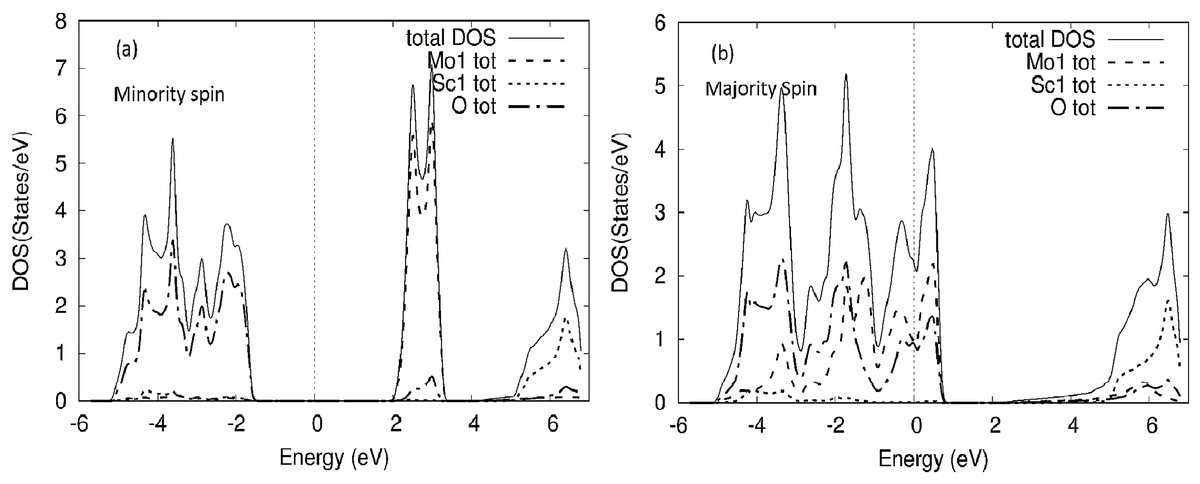
Figure 4: MoScO3 TDOS.
The MoScO3 electronic total density of states TDOS for the compound and the atom constituents in (A) minority and (B) majority spin channels.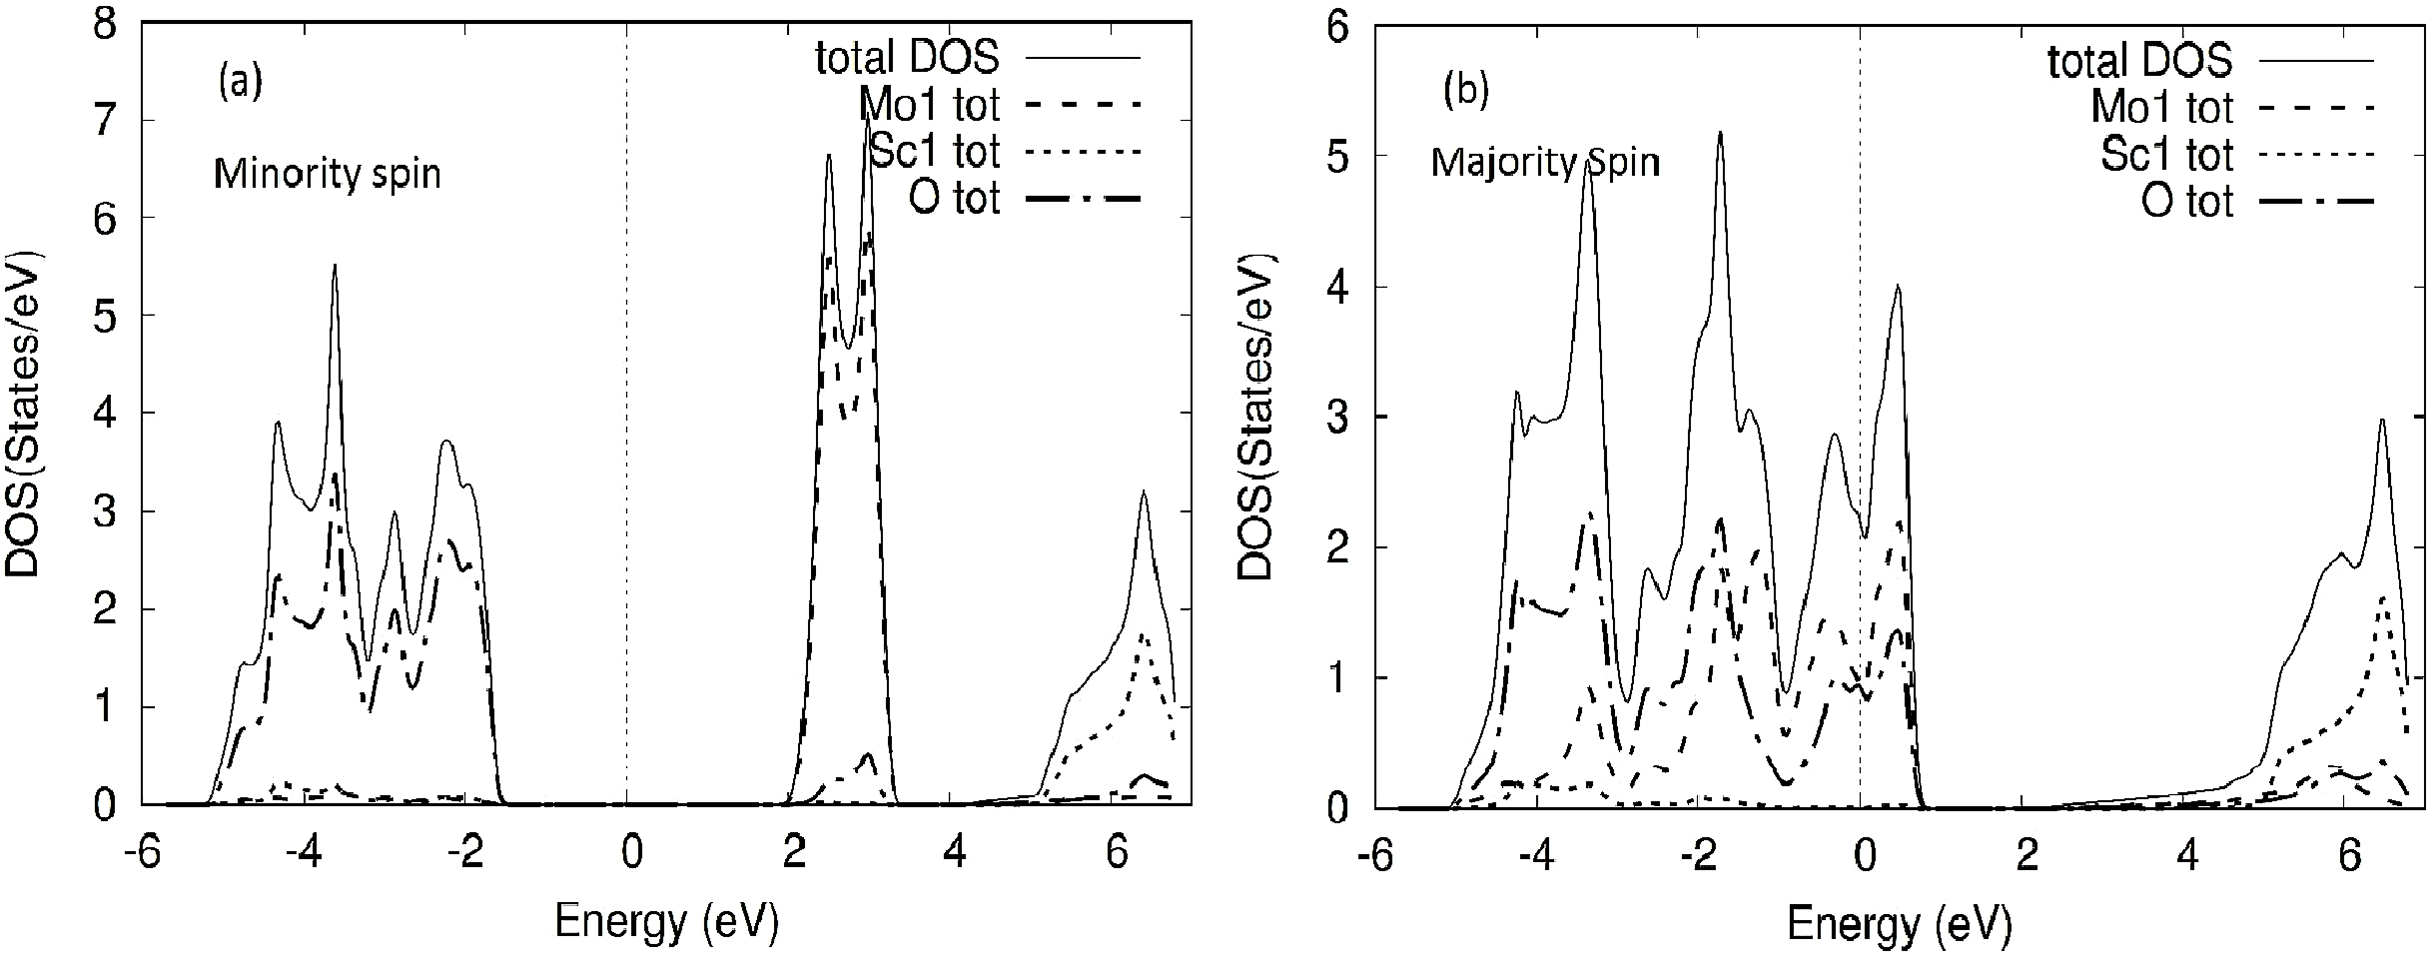
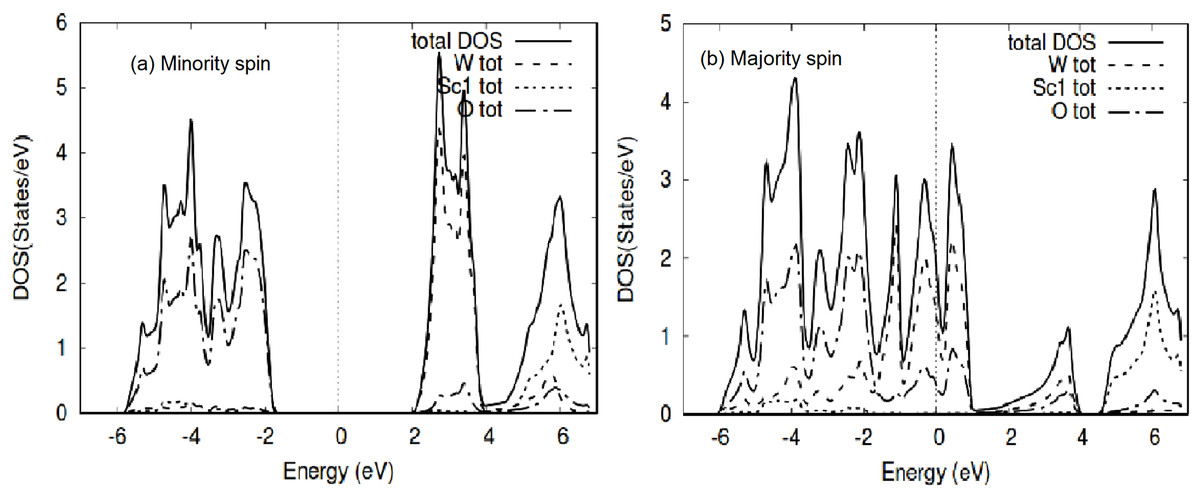
Figure 5: WScO3 TDOS.
The WScO3 electronic total density of states TDOS for the compound and the atom constituents in (A) minority and (B) majority spin channels.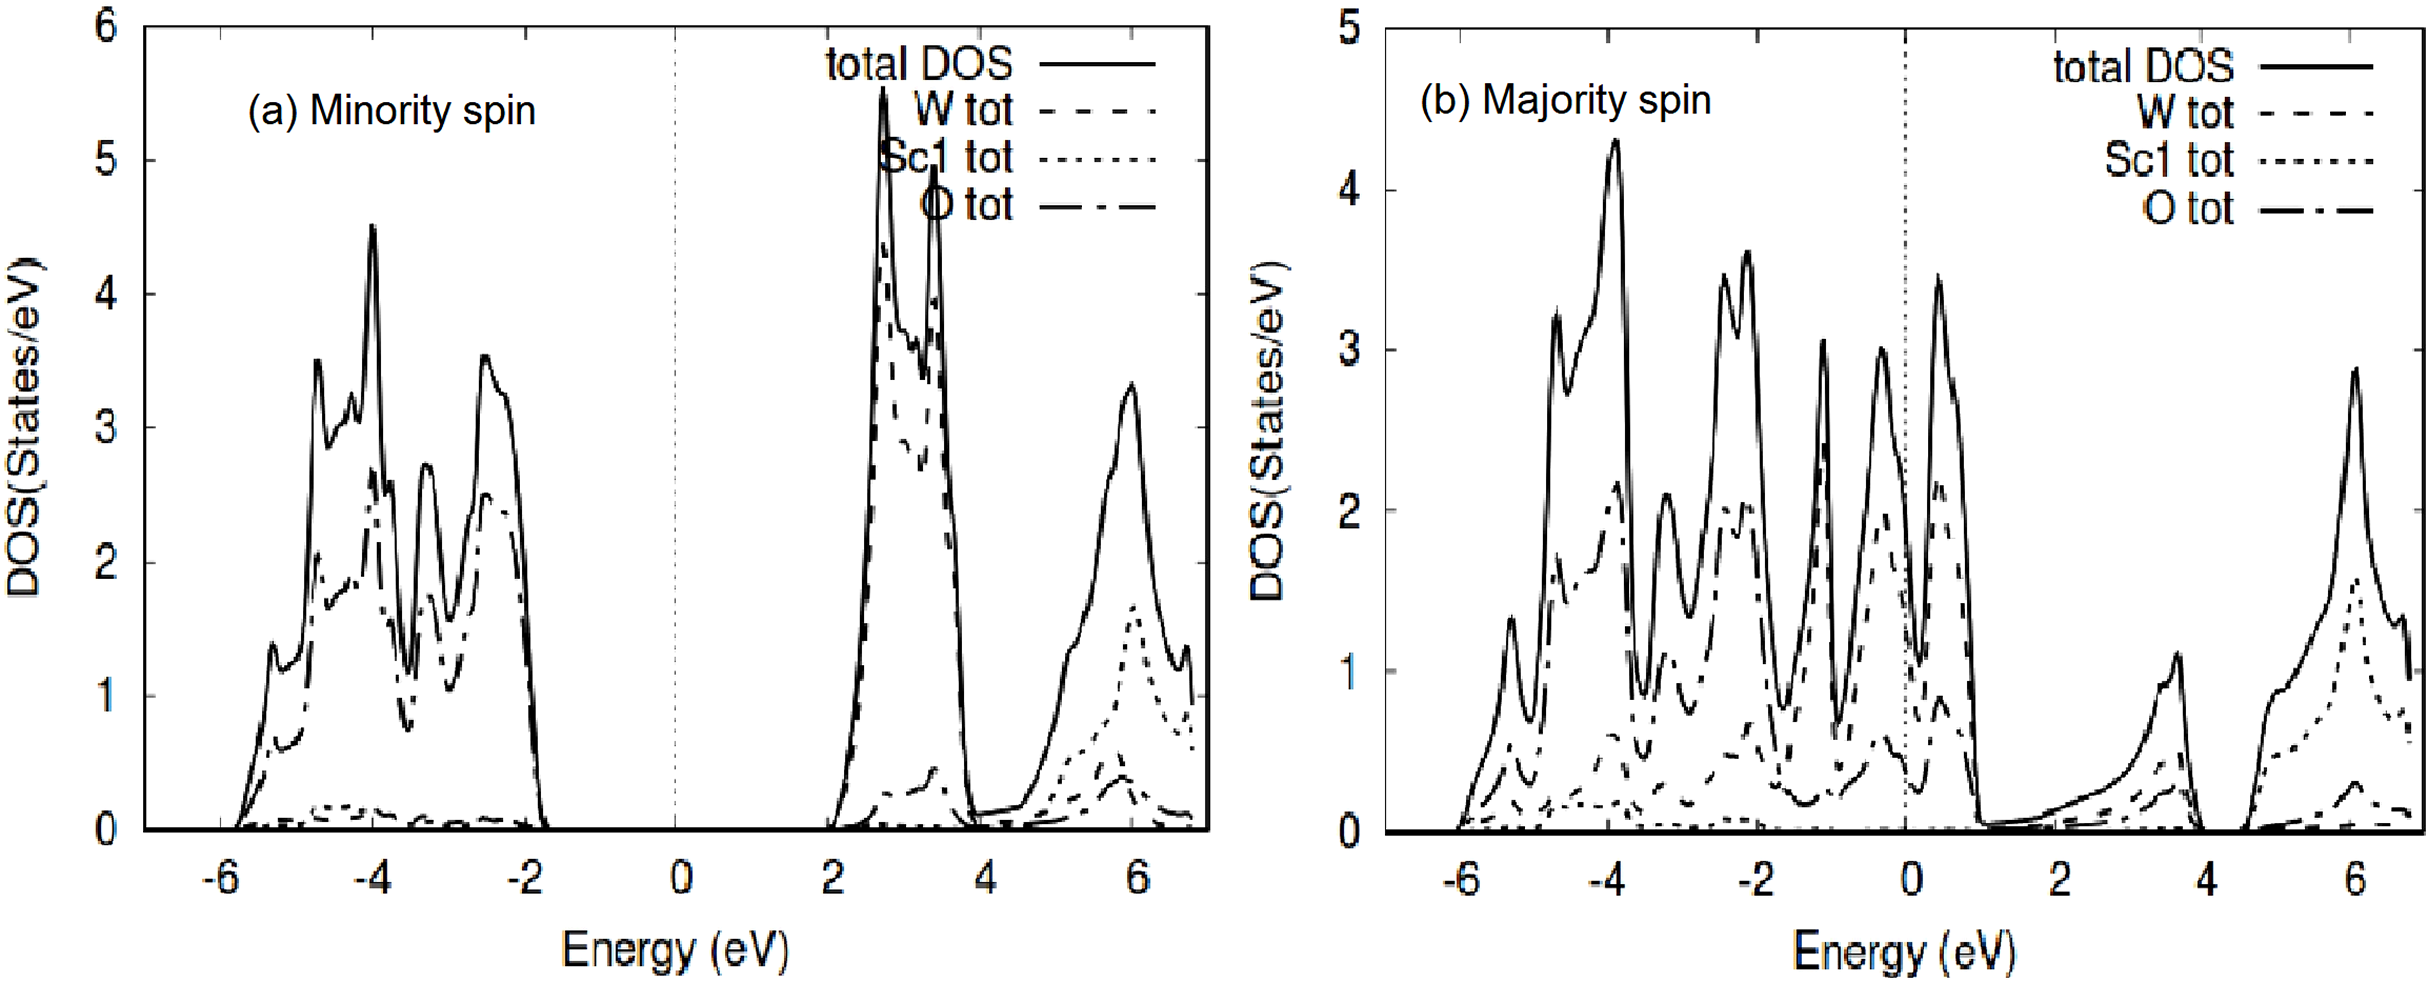
The TDOS of the minority spin of the compound shows clearly the energy gap, with the Mo DOS dominating the conduction band and oxygen states on the valence side of the TDOS. Meanwhile for the majority spin the TDOS of the compound and Mo and O DOS have peaks around E-Fermi, clearly indicating a metallic behavior for MoScO3 majority spin state.
The TDOS for WScO3 in Fig. 5 shows a similar trend as in MoScO3, with minority spin showing the band gap and semiconducting nature, while, the majority TDOS has prominent peaks at E-Fermi belonging to the full compound, Mo and O indicating the metallic behavior and showing consistency with the band structure plots Figs. 2 and 3. In addition, we notice, that the TDOS for both the perovskite compounds in Figs. 4 and 5 shows a marked difference in the spin up and spin down density and this clearly gives rise to the magnetism with a magnetic moment of 2.99μB in the two perovskites as shown in Table 3 which lists the total, atom wise and interstitial magnetic moments of the perovskite compounds.
| Compound | X (Mo, W, Cr) |
Sc | O | Intertitial | Total moment |
|---|---|---|---|---|---|
| MoScO3 | 2.957 | 0.006 | −0.114 | 0.375 | 2.997 |
| WScO3 | 2.996 | 0.012 | −0.144 | 0.417 | 2.994 |
| CrScO3 | 3.536 | 0.004 | −0.215 | 0.101 | 2.999 |
Optical properties
It is highly important to have a very dense grid and an accurate exchange correlation in the FP-LAPW to calculate the complex dielectric function that takes into account the self-energy and local field corrections. The TB-mBJ proves to be an excellent choice with a 30 × 30 × 30 grid for our optical properties calculations to obtain a high degree of accuracy of results. In this section we present the results for the dielectric function, optical conductivity and the important optical constants namely, the refractive index, the reflectivity, the extinction and absorption coefficients.
The complex dielectric function (ε = ε1 + iε2) is a function of the amount of light absorbed by the material. The imaginary part of dielectric function, ε2(ω), which represents absorption behavior, can be calculated from the electronic band structure of solids (Dressel & Gruner, 2002). The real part of dielectric function, ε1(ω), can be calculated according to Kramers–Kroing relation (Kramers, 1927; Kronig, 1926) which represents the electronic polarization under incident light. Figure 6 shows the real and imaginary plots for the dielectric function for the Mo/WScO3 perovskites in the photon energy range of 0–14 eV. The complex index of refraction of the medium N is defined as
(4) where, n is the usual refractive index and k is the extinction coefficient. Using the values of ε1 and ε2 we can obtain the refractive index n, reflectivity, and the extinction and absorption coefficients from the Eqs. (5), (6), (7) and (8).
(5)
(6)
(7)
(8)
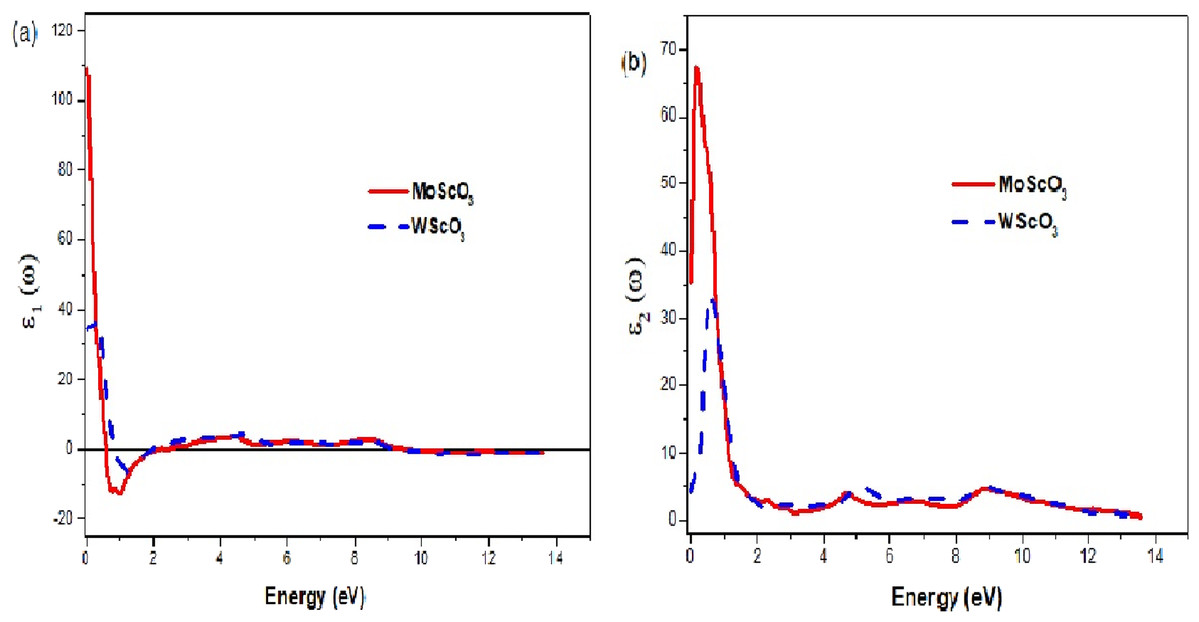
Figure 6: The Mo/WScO3 dielectric functions.
The Mo/WScO3 dielectric functions (A) the real part ε1(ω) and (B) the imaginary part ε2(ω).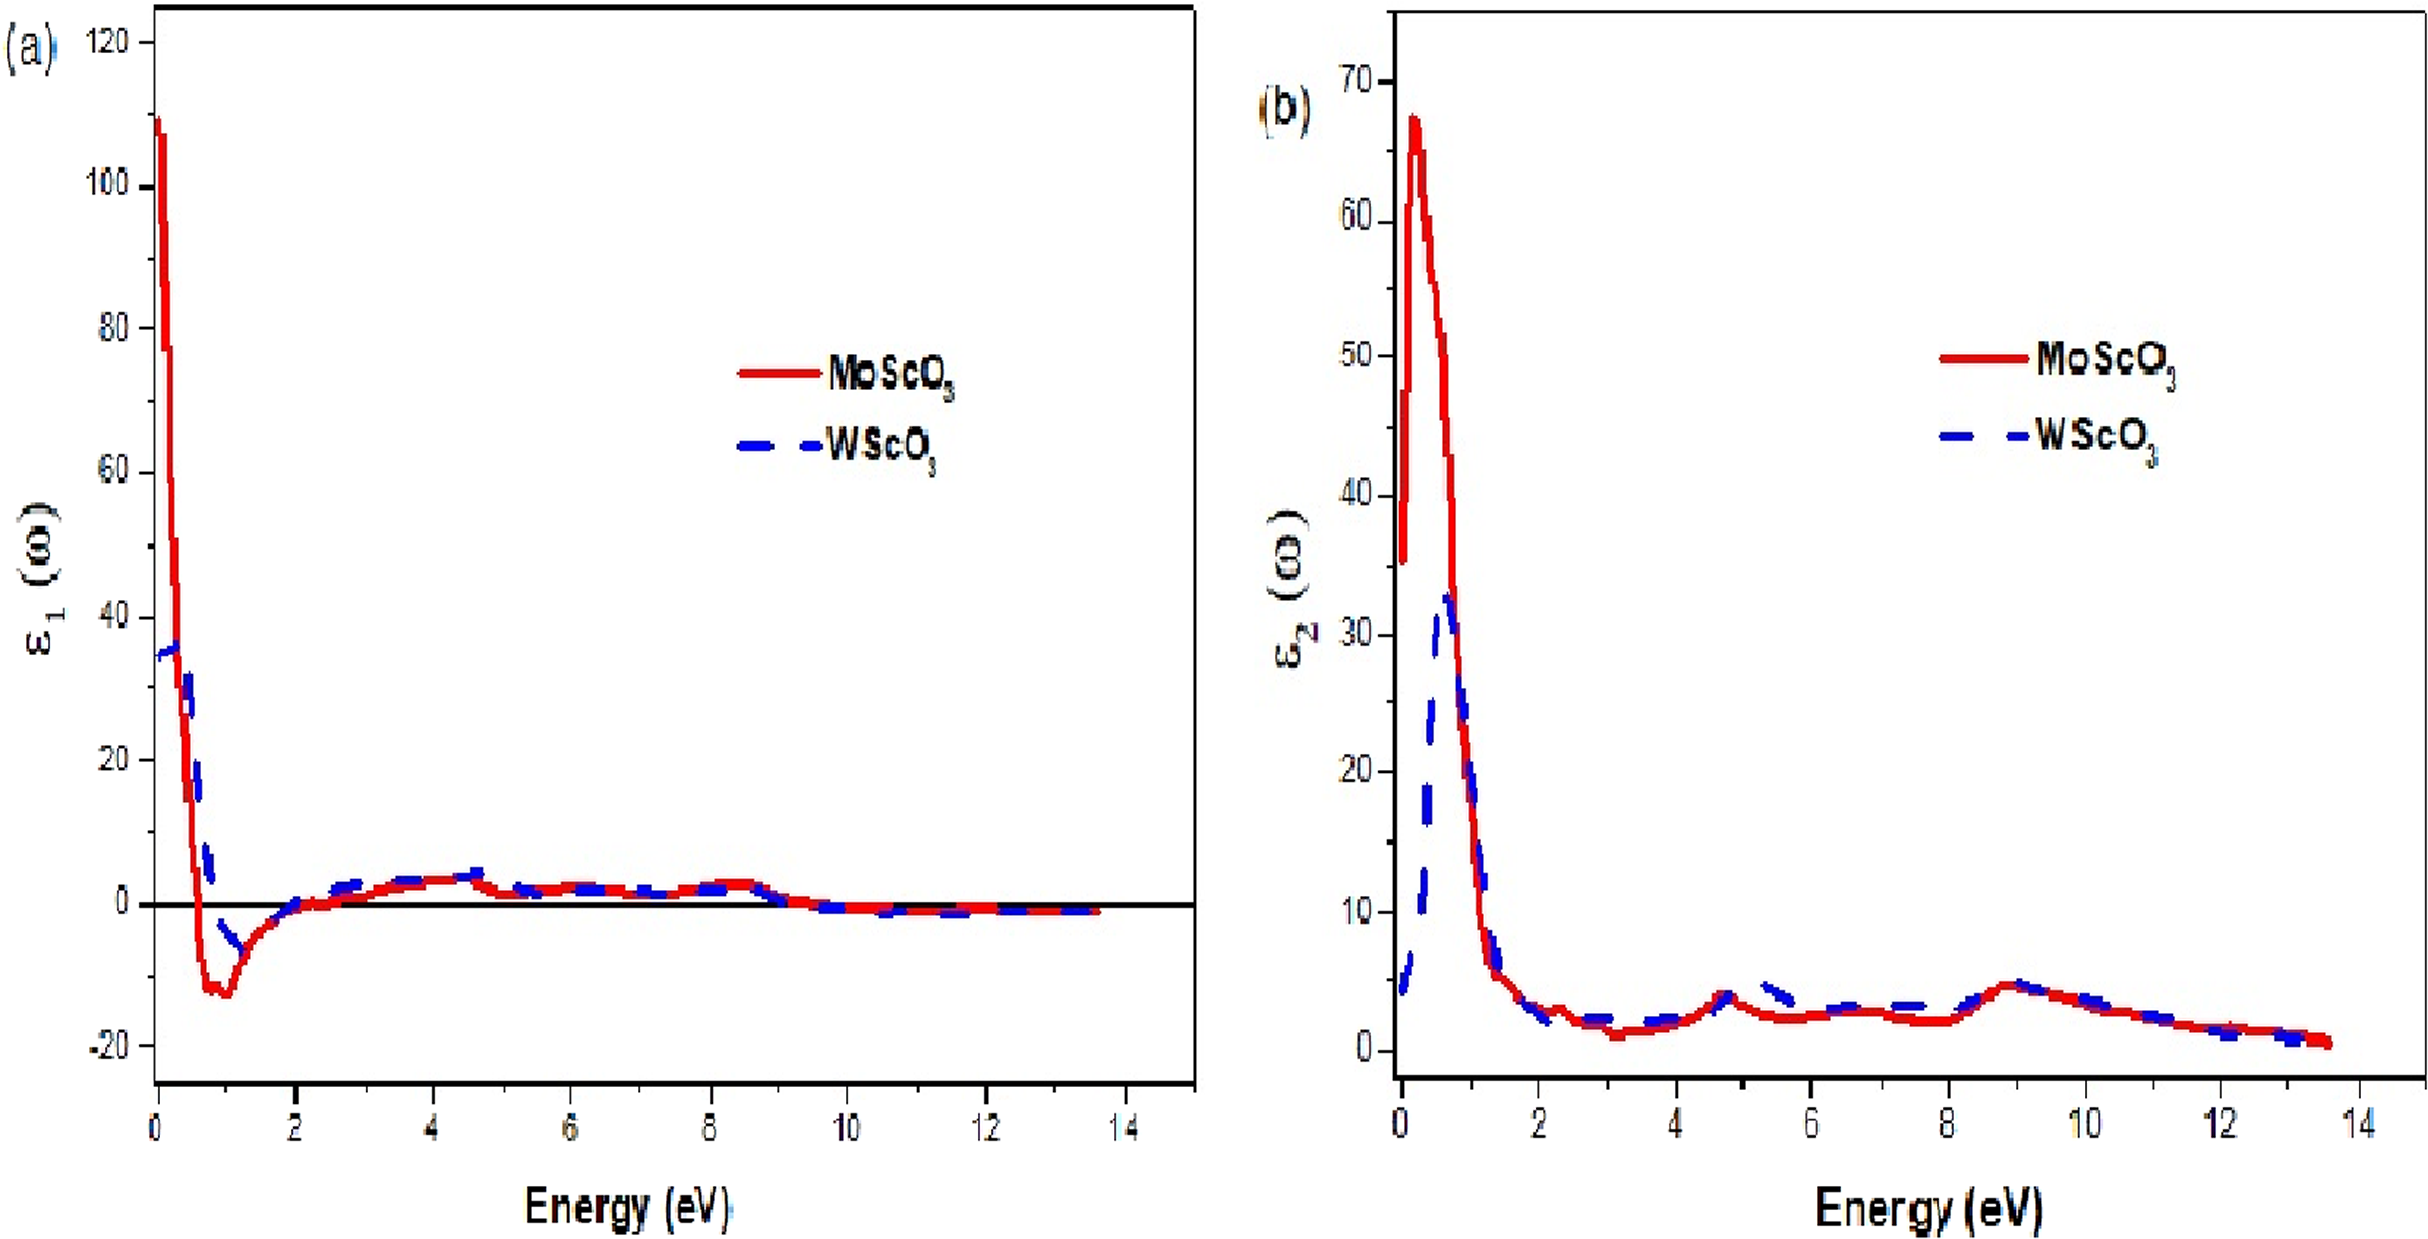
The refractive index and reflectivity plots are shown in Figs. 7A and 7B respectively in the photon energy range 0–14 eV, which captures all the necessary features. Refractive index is a function of incident frequency and the graphs display maximum peak values around ω = 0, with a decrease in values as we go towards higher frequencies. Both MoScO3 and WScO3 have large refractive index values of 10.6 and 5.7 respectively as a result of the high electron densities in these materials (Babu et al., 2012). The refractive index shows an almost constant and optically isotropic behavior at high energies > orange. The reflectivity is a maximum in the visible energy range; beyond this we observe an almost constant region with very small reflectance values in 3–8 and 2–8 eV for MoScO3 and WScO3 respectively. This region of the spectra therefore provides good ultraviolet (UV) and higher energy absorption.

Figure 7: Mo/WScO3 refractive index and reflectivity.
The Mo/WScO3 optical constants (A) refractive index n(ω) and (B) the reflectivity R(ω) as a function of the photon energies.
In Table 4 we list the energies of the zeros of ε1(ω) and static values of the refractive index, the reflectivity and absorption coefficients.
| Compound | Zeros of ε1(ω) [eV] | ε1(0) | n(0) | R(0) | I(0) |
|---|---|---|---|---|---|
| MoScO3 | 2.163 eV; 2.435 | 109.052 | 10.576 | 0.691 | 0.231 |
| WScO3 | 0.829; 1.946 | 34.329 | 5.869 | 0.504 | 0.351 |
The extinction coefficient and energy loss graphs are shown in Fig. 8. The extinction or attenuation coefficient relates to how strongly light of a particular wavelength is absorbed. It is an intrinsic property that depends on the chemical composition of the compound. It is a measure of the diminution of transmitted light due to scattering and absorption in the medium.
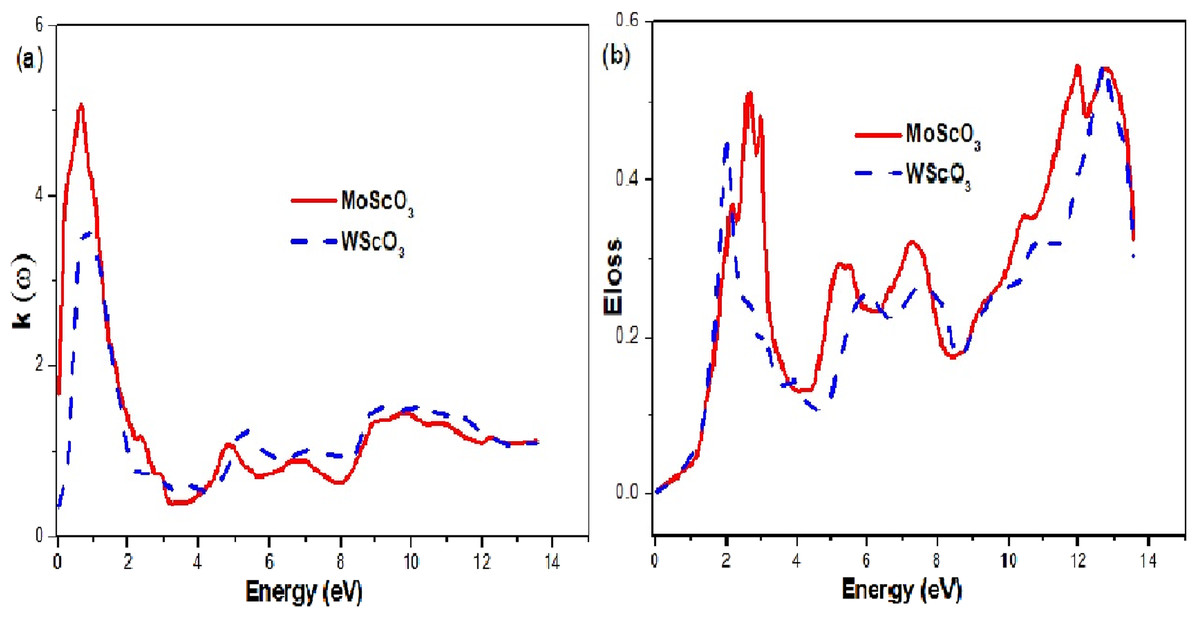
Figure 8: Mo/WScO3 extinction coefficient and energy loss.
The Mo/WScO3 (A) extinction coefficient and (B) energy loss L(ω) as a function of the photon energies.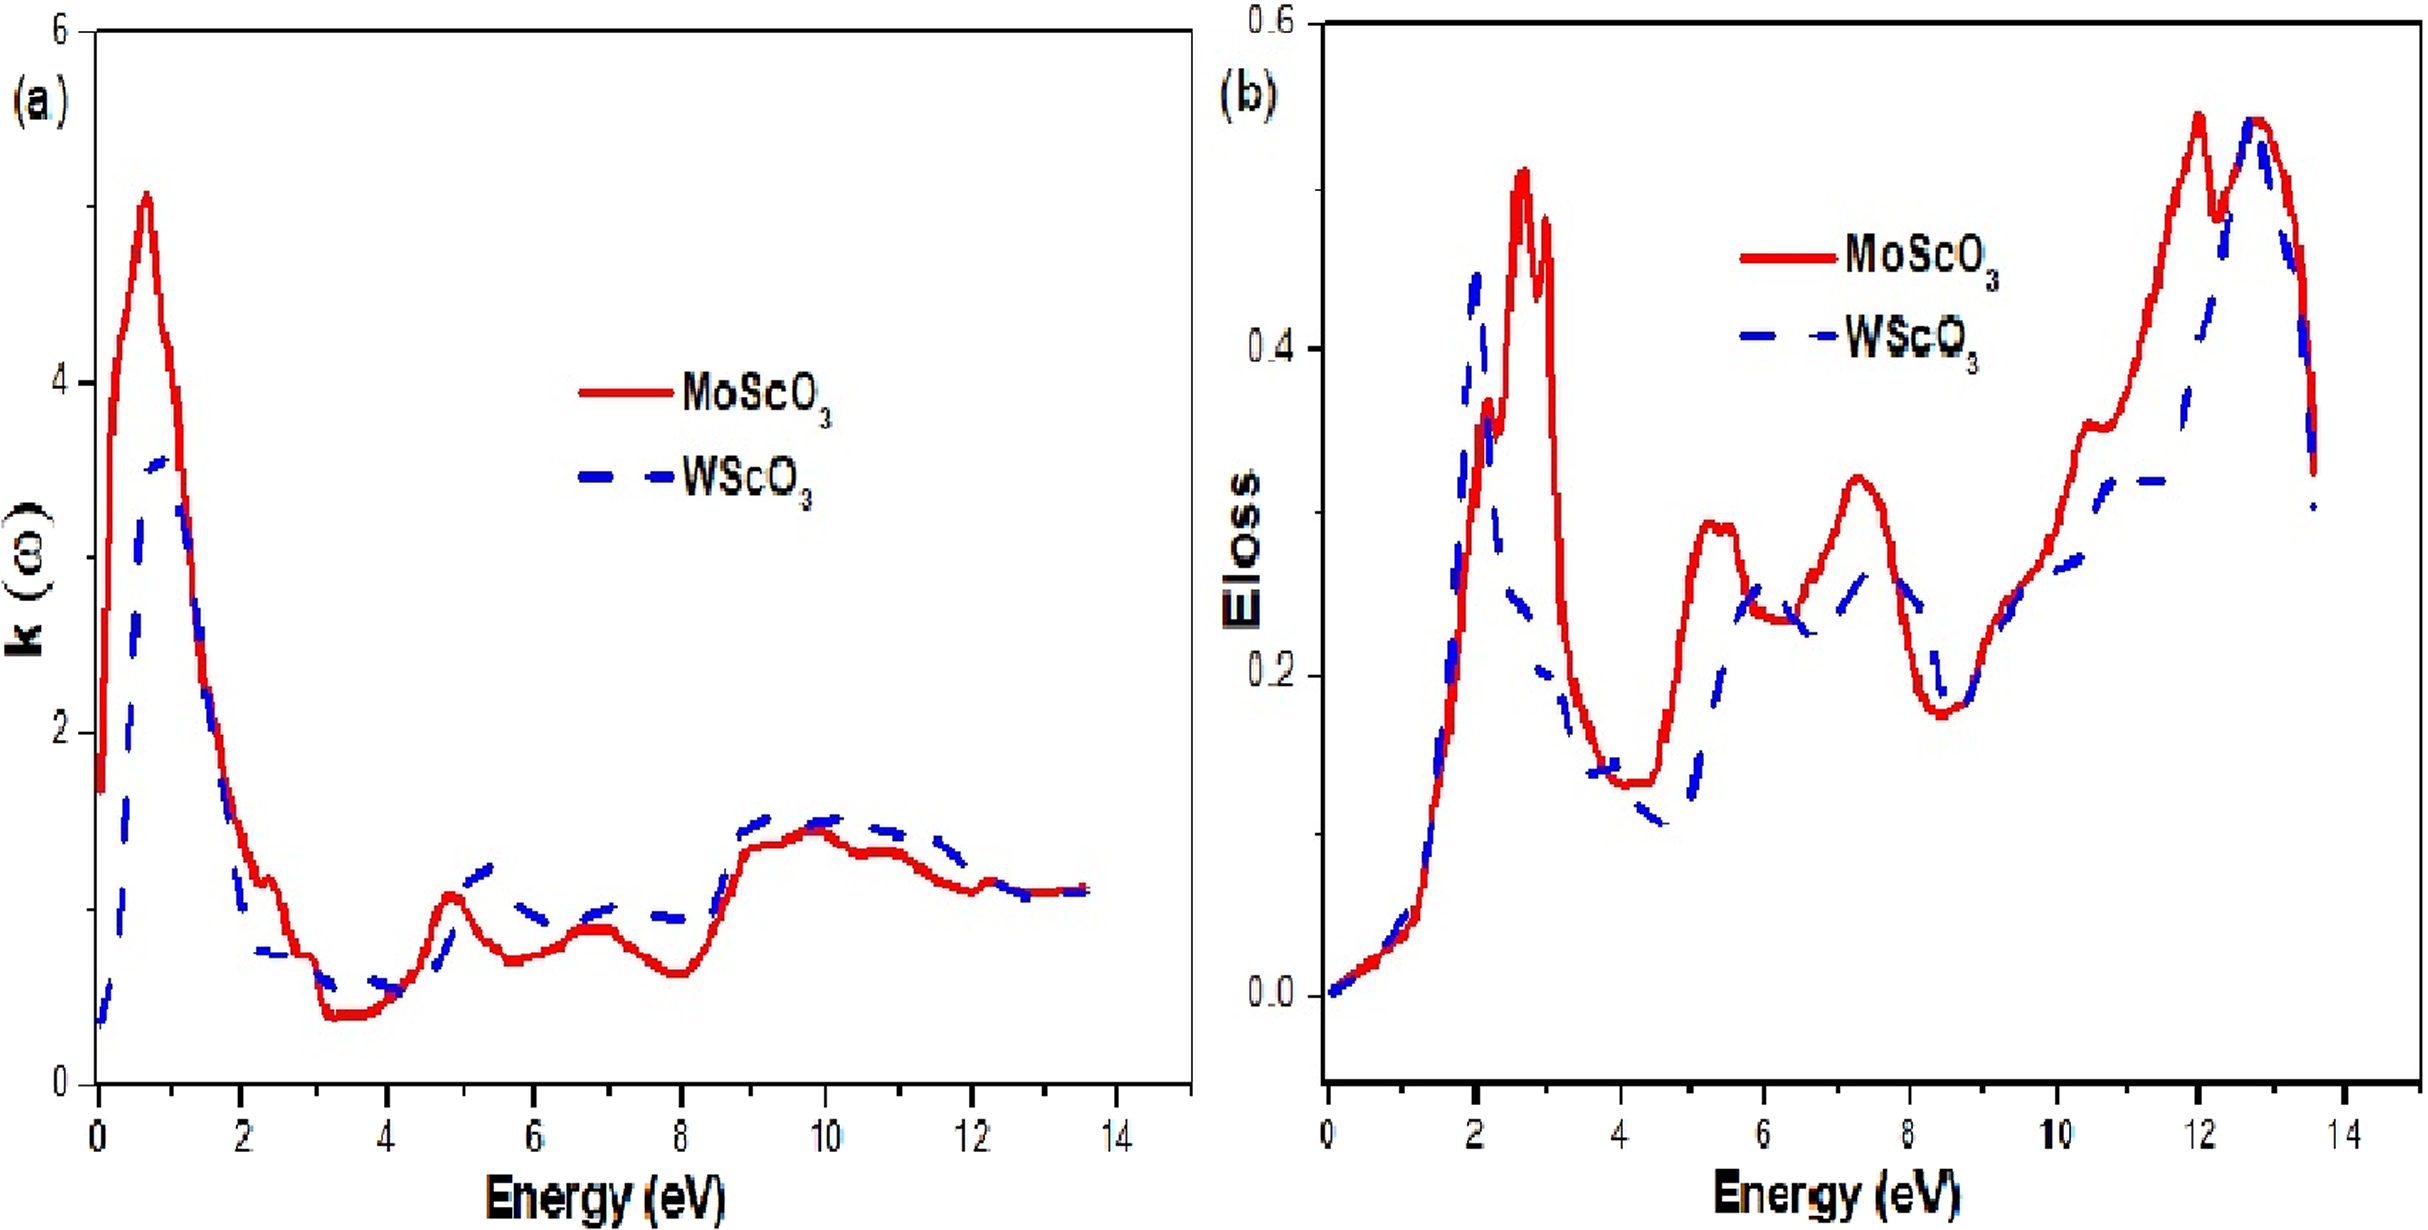
The electron energy loss denoted by α(ω) is an important quantity and it represents the energy loss of the electron as it traverses in the medium. This function is shown in Fig. 8B. When the incident photon propagates through a polarizable dielectric or magnetic material and excites some internal degrees of freedom of the material, polaritons are formed (Sun et al., 2016; Rödl & Bechstedt, 2012). The polariton type depends on the type of elementary excitation i.e. phonon, plasmon, magnon or exiton. This is a complicated process and the peaks can be interpreted as a polariton excitation. We observe 4 peak curves for the two compounds, which occur at different characteristic energy values.
The optical conductivities and absorption coefficients are shown in Figs. 9A and 9B respectively.
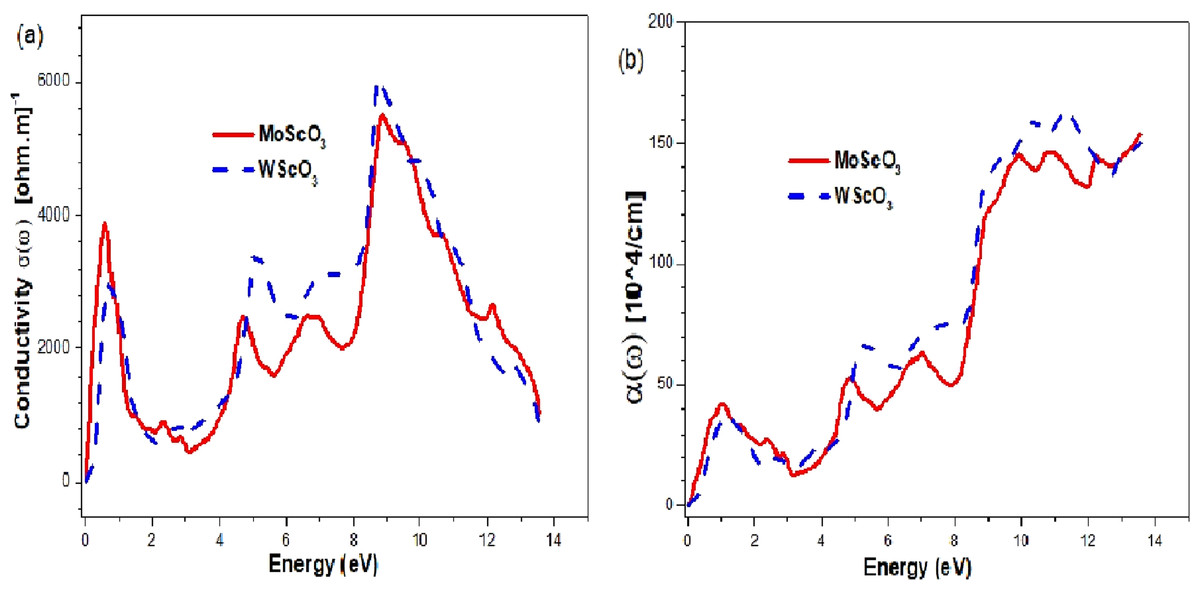
Figure 9: Mo/WScO3 Optical conductivity and absorption coefficient.
The Mo/WScO3 (A) optical conductivity σ (ω) and (B) absorption coefficient α(ω) as a function of the photon energies.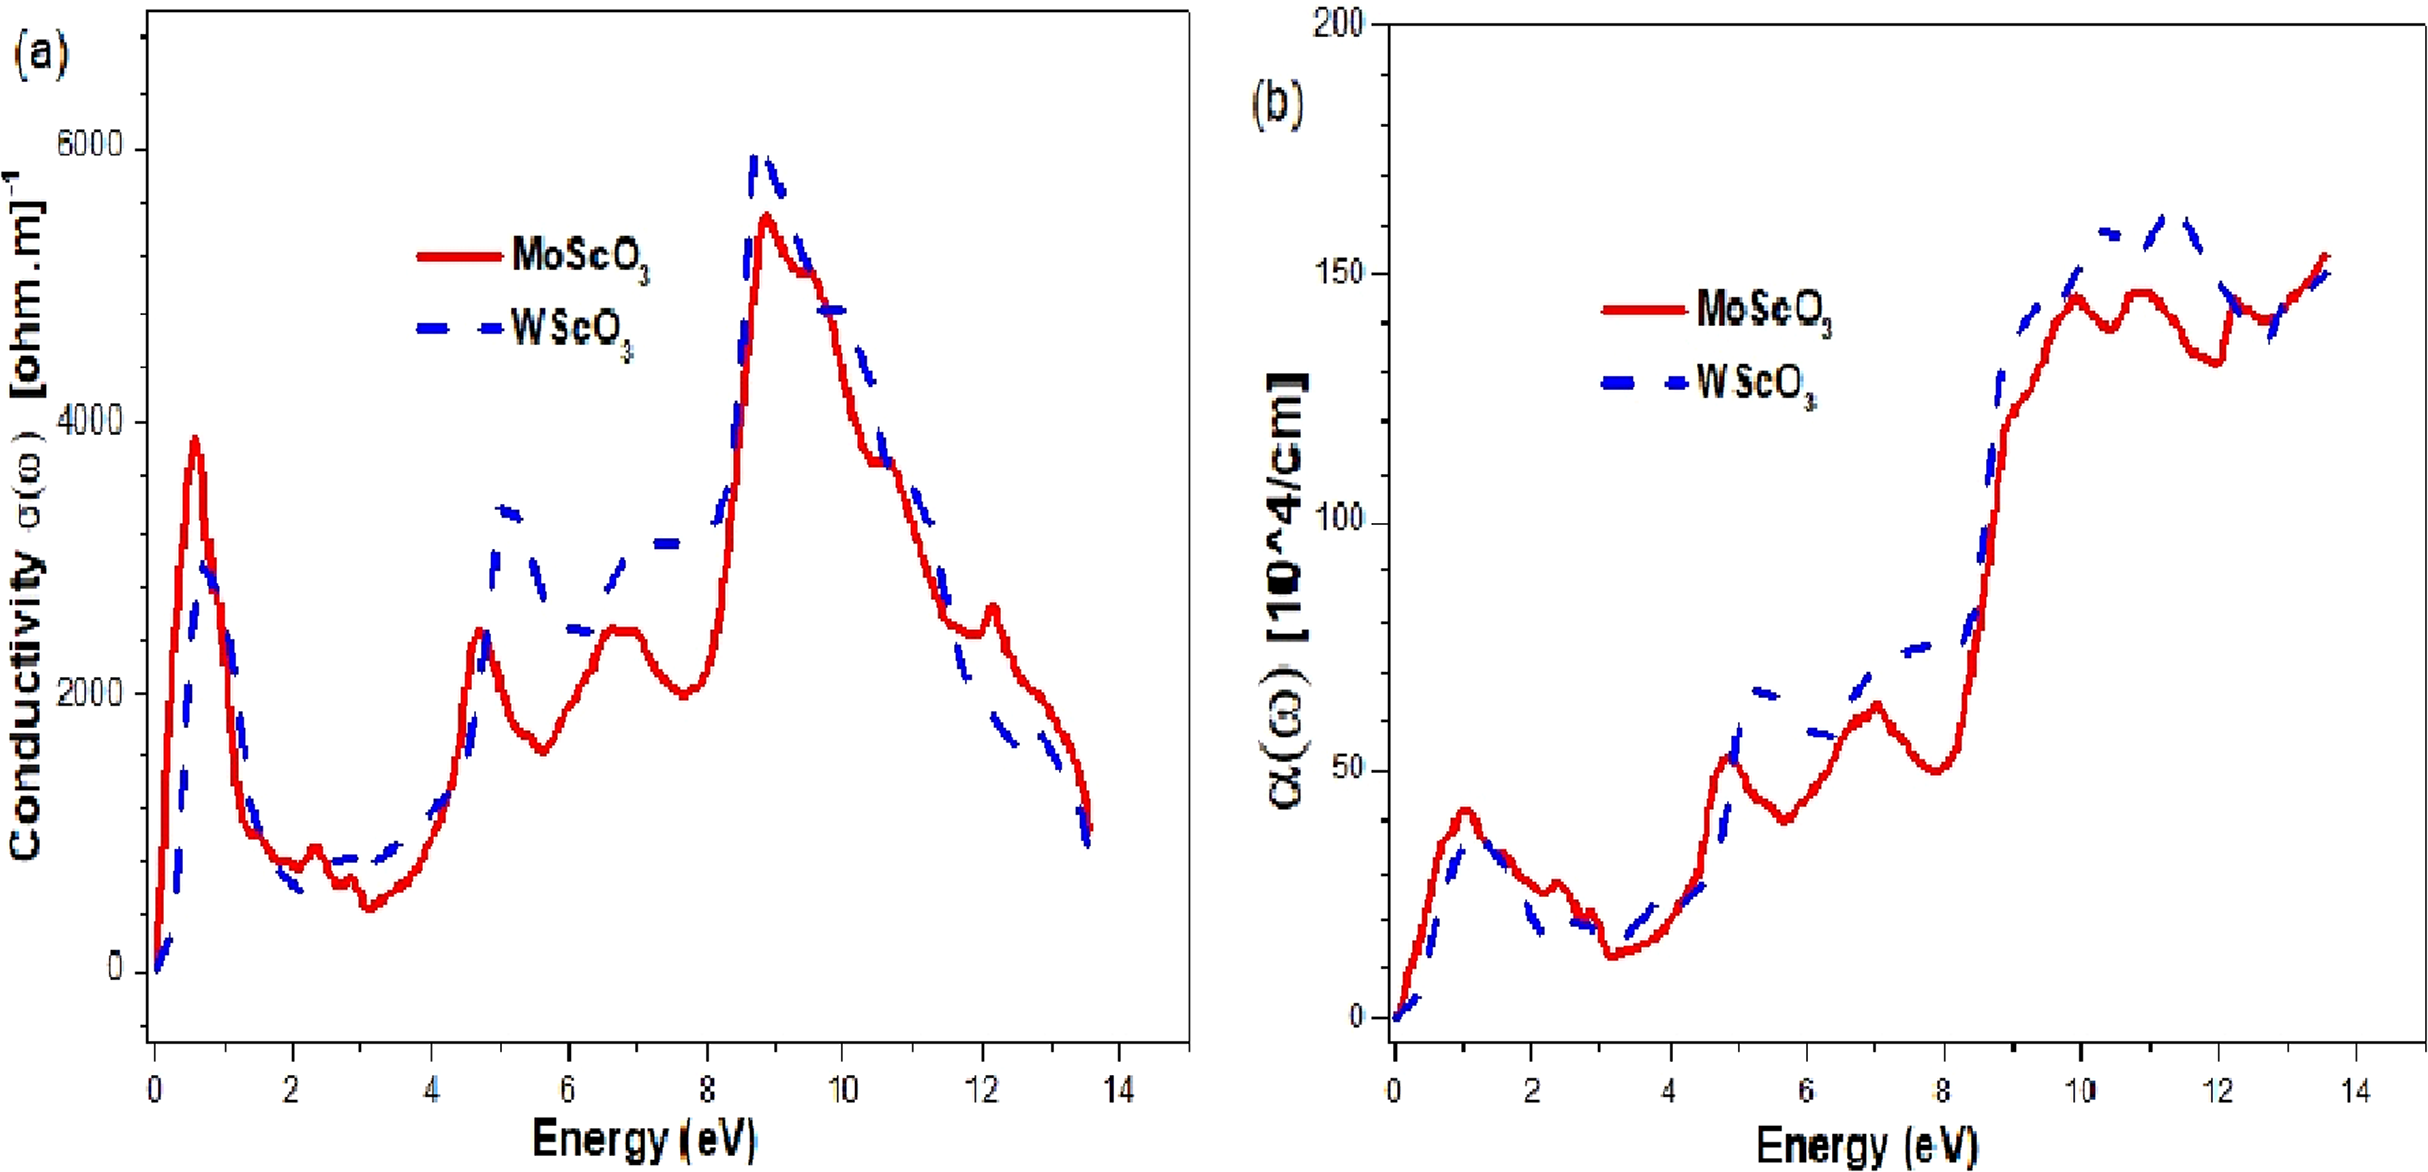
The plots have 4 maximum peaks at different energy values. First, in the infra red (IR) region; the next peaks appear in the UV and above region. Similar features appear for the absorption coefficients.
Discussion
The mbj exchange potential has consistently proved to give accurate and very reliable band structures comparable to that of GW or hybrid functionals. A direct bandgap is very favorable since excitation is possible with photons of energy equivalent or higher than the band gap, and gives stronger emission or absorption properties for potential applications in photovoltaics (PV), light emitting diodes (LED) etc. The indirect band gap requires both a photon and phonon for excitation of electrons from the valence to conduction band; nevertheless, it has also useful applications in optoelectronics. Both the Mo and W perovskites are semiconducting in the minority channel with large bandgap values of 3.6 and 3.8 eV as seen from Table 2. The fact that the direct Γ−Γ gap is very close in energy to the indirect R−Γ gap in Mo is favorable and makes the MoScO3 better suited for optoelectronic applications than that of W perovskite. Both the perovskites show metallic behavior in the majority channels the only difference being that the Mo perovskite shows a slight metallic behavior with only very few valence bands at the beginning of the conduction band, whereas the W shows a more pronounced metallic behavior as seen from Figs. 2B and 3B. The perovskites are therefore ferromagnetic half metals and the presence of states at the Fermi level in one spin channel and semiconducting in the other spin channel make these materials to have 100% spin polarization at the Fermi level. Such a feature has good potential for applications in spintronics (Rostami, Afshari & Moradi, 2013; Mir, Seha & Gupta, 2020).
For the sake of comparison with the isoelectric TM Cr we have included in the Table the values for CrScO3 from reference (Mahmoud et al., 2020). We see in contrast to Mo and W perovskites CrScO3 is an insulator with a very large bandgap of 5.5 eV in the minority channel and metallic in the majority spin.
The magnetic moment of the compounds arises mainly from the TM with unfilled d bands. For the sake of comparison the corresponding values for CrScO3 has been included from reference (Mahmoud et al., 2020) in Table 3. The local environment and the complex interactions of the TM ‘d’ orbitals with the Sc and O2 atoms gives rise to the total, atom wise and interstitial magnetic moments as observed. Sc does not seem to play any major role in the magnetism as indicated by the spin polarized total density of states (TDOS) plots Figs. 3 and 4. We also note from the table that the perovskites have very similar total moments of ~3μB. This is as expected since Mo, W and Cr belong to the same group VI elements and are isoelectric.
Knowledge of the optical properties of a compound is crucial and fundamental for many applications and applied research. We see from the plots of the real and imaginary parts of dielectric function that the active spectral region is within 2 eV, beyond which the graphs are flat. The static dielectric constants are those at ω = 0, and we notice that the ε1 value of MoScO3 is more than double that of WScO3 indicating a very much higher dielectric constant. The negative values for ε1(ω) indicate a metal like behavior in these very low photon energies with complete reflection of light. Moreover, in Fig. 6B the ε2(ω) peaks are also more than twice that of WScO3, implying much higher absorption capabilities. The peaks occur at low photon energy around 1 eV and indicate transitions of valence oxygen ‘2p’ electrons to low lying conduction 4/5d bands. These observations confirm MoScO3 to have better performance than WScO3 for optoelectronics.
Both MoScO3 and WScO3 have large refractive index values of 10.6 and 5.7 respectively as seen from Fig. 7A as a result of the high electron densities in these materials (Babu et al., 2012). The refractive index shows an almost constant and optically isotropic behavior at high energies > orange. The reflectivity Fig. 7B is a maximum in the visible energy range, and the materials could be used as reflective coatings in this range. Beyond this we observe an almost constant region with very small reflectance values in 3–8 and 2–8 eV for MoScO3 and WScO3 respectively. This region of the spectra therefore provides good ultraviolet (UV) and higher energy absorption. It is well known that the materials with band gaps larger than 3.1 eV as in the present case, work well for device applications in the UV region of the spectrum (Maqbool, Amin & Ahmad, 2009). After 8 eV we see steady increases to reach ~0.6 for both compounds.
Since, ε1(ω) gives us information about the electronic polarizability of a material, the zero values represent the threshold values. For negative values of ε1(ω), the electrons are able to completely screen the external field, which results in reflection. But, for positive ε1(ω) values (frequencies higher than Plasmon frequency), the electrons do not succeed in screening the fields, which can penetrate the dielectric medium. We see from the plot shape in Fig. 8A high values of attenuation in the 0–3 eV energy range indicating maximum absorption in this region. Figure 6B also proves this point.
From the graphs in Fig. 9 we notice that both the perovskites have good optical conductivities in the visible range and also high absorption coefficients making them excellent for optoelectronic applications. They have 4 maximum peaks at different energy values. First peak, in the infra red (IR) region allows for possible use as IR detectors and sensors. The next peaks appear in the UV and above region making them appropriate for UV device applications.
Conclusions
In conclusion, this is the first investigation of the perovskites Mo/WScO3 using DFT, full potential linearized augmented plane wave method with mBJ approximation to obtain accurate electronic, band structures, magnetic and optical properties. The results indicate that the compounds are half metals with semiconducting in the minority and metallic behaviour in the majority spin channels. Moreover, the considerable band gap and sizeable magnetic moment makes these materials very suitable for spintronic applications.
In addition, the optical spectral properties in the energy range of 0–14 eV for the dielectric function and optical constants gives a very reliable and through understanding for potential applications of these materials in optoelectronics.