
Genome-wide identification of the Tubby-Like Protein (TLPs) family in medicinal model plant Salvia miltiorrhiza
- Published
- Accepted
- Received
- Academic Editor
- Vladimir Uversky
- Subject Areas
- Agricultural Science, Bioinformatics, Genomics, Molecular Biology, Plant Science
- Keywords
- Tubby-Like Proteins, TLPs, Medicinal plant, Salvia miltiorrhiza, Abiotic stress
- Copyright
- © 2021 Wang et al.
- Licence
- This is an open access article distributed under the terms of the Creative Commons Attribution License, which permits unrestricted use, distribution, reproduction and adaptation in any medium and for any purpose provided that it is properly attributed. For attribution, the original author(s), title, publication source (PeerJ) and either DOI or URL of the article must be cited.
- Cite this article
- 2021. Genome-wide identification of the Tubby-Like Protein (TLPs) family in medicinal model plant Salvia miltiorrhiza. PeerJ 9:e11403 https://doi.org/10.7717/peerj.11403
Abstract
Tubby-Like Proteins (TLPs) are important transcription factors with many functions and are found in both animals and plants. In plants, TLPs are thought to be involved in the abiotic stress response. To reveal the potential function of TLPs in the medicinal model plant Salvia miltiorrhiza, we identified 12 S. miltiorrhiza TLPs (SmTLPs) and conducted a comprehensive analysis. We examined SmTLP gene structure, protein structure, phylogenetics, and expression analysis. Our results show that all SmTLPs, except SmTLP11, have a complete typical Tub domain. Promoter analysis revealed that most SmTLPs are involved in hormone and abiotic stress responses. Expression analysis revealed that the 12 SmTLPs could be divided into three categories: those specifically expressed in roots, those specifically expressed in stems, and those specifically expressed in leaves. Additional studies have shown that SmTLP10 may play an important role in the plant cold resistance, while SmTLP12 may be involved in the S. miltiorrhiza ABA metabolic pathway. Our study represents the first comprehensive investigation of TLPs in S. miltiorrhiza. These data may provide useful clues for future studies and may support the hypotheses regarding the role of TLPs in plant abiotic stress process. All in all, we may provide a reference for improving S. miltiorrhiza quality using genetic engineering technology.
Introduction
Tubby-Like Proteins (TLPs) are widely distributed in living creatures and have diverse functions (Ikeda, Nishina & Naggert, 2002; Wang, Xu & Kong, 2018). Previous studies have indicated that TLPs exist in all eukaryotes, from single-celled to multicellular organisms (Wang, Xu & Kong, 2018). The TLP family shares a common tertiary structure, with a beta barrel structure packed around an alpha helix in the central pore (Yulong et al., 2016). Each TLP is characterized by a signature tubby domain at its C-terminus. The tubby domain shares 55% to 95% identity across various species and is thought to be significant for the proper folding, solubility, and subcellular localization of TLPs, as well as other important functions (Ikeda, Nishina & Naggert, 2002; Kim et al., 2017; Yang et al., 2008). In contrast to the conserved C-terminal tubby domain, motifs at N-terminus of TLPs (e.g., F-box, WD40 repeat, or SOCS box) differ greatly across species. According to previous studies, TLPs can be divided into three classes based on phylogenetic trees (Gagne et al., 2002; Lai et al., 2012). Although plants have more TLPs than do animals, the N-termini of animal TLPs are highly divergent while the majority of plant TLPs contain N-terminal F-box domains and are relatively conserved in this region (Gagne et al., 2002; Lai et al., 2012).
TLPs are thought to function as transcription factors, but the specific mechanism was unknown (Boggon et al., 2000). First identified in obese mice at the end of the last century, TLPs have been shown to play a dominant role in the maintenance and functioning of neurons during post-differentiation and TLP mutations can lead to infertility, insulin resistance, and retinal degeneration with hearing loss (Coleman & Eicher, 1990; Heckenlively et al., 1995; Kleyn et al., 1996; Noben-Trauth et al., 1996). TLPs’ roles in animals have been extensively studied, while TLP research in plants has mainly focused on the response of plants to biotic and abiotic stresses (Lai et al., 2004; Liu, 2008; Wang, Xu & Kong, 2018; Yang et al., 2008; Yulong et al., 2016; Zhang et al., 2020). In Arabidopsis thaliana, the TLP gene family contains 11 genes (AtTLP1–AtTLP11) (Lai et al., 2004). Previous research indicates that AtTLP9 is involved in the response to salt and drought stress and that AtTLP3 is involved in the regulation of the ABA signaling pathway during seed germination (Bao et al., 2014; Lai et al., 2004). In Oryza sativa, the TLP gene contains 14 members (OsTLP1–OsTLP14) and expression profiling analysis revealed that OsTLP14 plays an important role in seed germination and seedling formation (Liu, 2008). In Cicer arietinum, overexpression of CaTLP1 enhances tolerance to salt, drought, and oxidative stress (Wardhan et al., 2012). Malus domestica TLPs play an important role in stress response and the expression of MdTLP7 was reported to enhance abiotic stress tolerance in Arabidopsis (Xu et al., 2019).
Salvia miltiorrhiza is an emerging model plant in traditional Chinese medicine research and is widely cultivated (Cheng, 2006; Xu et al., 2016c; Zhang et al., 2014). Abiotic stress has a serious impact on the cultivation of plants, so improving S. miltiorrhiza’s stress resistance is important. Previous studies have explored the role of TLP family genes in stress resistance in plants including A. thaliana. However, the role of TLP family genes in S. miltiorrhiza remains unknown. The publication of the S. miltiorrhiza genome provides an opportunity to perform a genome-wide analysis of the TLP gene family to clarify their evolutionary history and explore their functional mechanisms (Xu et al., 2016a). In this study, we identified and analyzed 12 SmTLP genes in S. miltiorrhiza. We analyzed their gene and protein structures and predicted their cis-activating elements. Using qPCR, we analyzed the role of SmTLPs in plant abiotic stress. These results lay the foundation for further elucidation of the roles of the SmTLPs family in stress resistance.
Material and Methods
Data collection
Initially, based on the keyword Tubby like protein, already-known TLP protein sequences from A. thaliana, S. lycopersicum, and O. sativa were retrieved from the NCBI database (https://www.ncbi.nlm.nih.gov/) (Table S1). The S. miltiorrhiza genome (published) was downloaded from the China National Traditional Chinese Medicine Data Center (ftp://danshen.ndctcm.org:10402/) (Xu et al., 2016a).
Identification of TLPs in S. miltiorrhiza data collection
We used two methods to accurately identify TLPs in S. miltiorrhiza. First, we used the online software iTAK (http://itak.feilab.net/cgi-bin/itak/index.cgi) to directly identify 12 candidate SmTLPs (Zheng et al., 2016). Then, based on the hidden Markov model (HMM) of the Tubby domain (PF01167) obtained from the Pfam database (http://pfam.xfam.org/), we also identified 12 candidate SmTLPs using Hmmsearch (3.2.1) (Potter et al., 2018). Next, we used the Web CD-Search Tool (https://www.ncbi.nlm.nih.gov/Structure/bwrpsb/bwrpsb.cgi) to identify and confirm the domains of candidate SmTLPs identified by the two methods. Finally, we identified 12 SmTLPs and named them SmTLP1–SmTLP12. The SmTLPs’ physicochemical characteristics were analyzed using the ProtParam tool (http://web.expasy.org/protparam/). Characteristics included the grand average of hydropathicity (GRAVY), instability index, theoretical isoelectric point (p I), and molecular weight (Mw). The WoLF PSORT (https://wolfpsort.hgc.jp/), Busca (http://busca.biocomp.unibo.it/) and Plant-mPLoc (http://www.csbio.sjtu.edu.cn/bioinf/plant-multi/) were used to predict the subcellular localization of the SmTLPs in S. miltiorrhiza.
Analysis of gene structure and protein structure
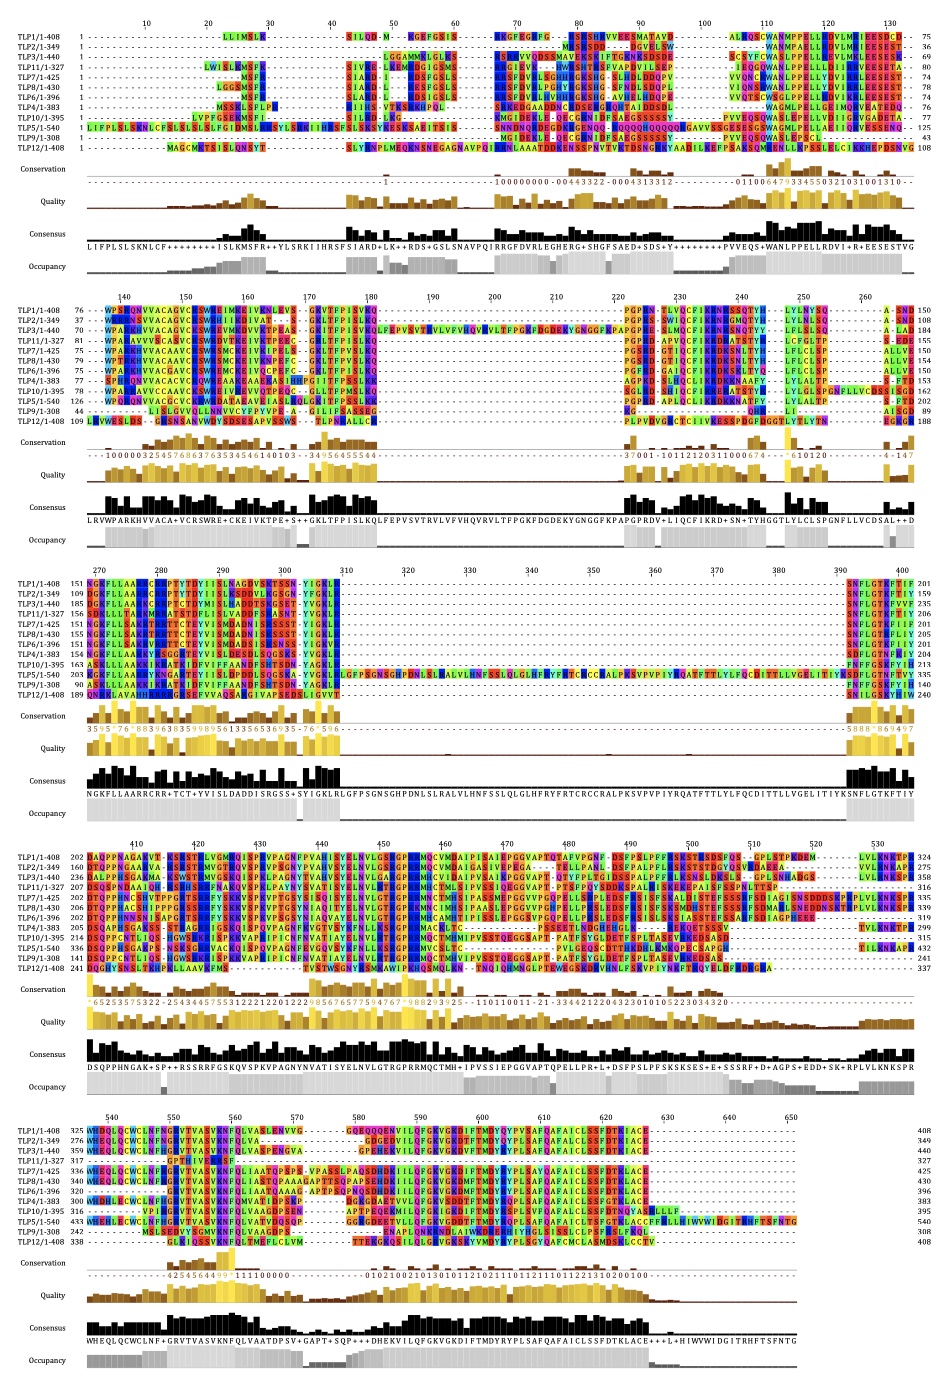
TBtools was used to analyze the gene structure of SmTLPs (Chen et al., 2020). Conserved motifs in SmTLPs were identified using the MEME tool (http://meme-suite.org/tools/meme) and the following criteria: maximum number of motifs were set to 10; the minimum motif width was 6; and the maximum motif width was 200. Other parameters were set to default. Tubby domain protein alignment was performed using Clustal Omega (https://www.ebi.ac.uk/Tools/msa/clustalo/) and verified by MEGA X (Kumar et al., 2018; Sievers & Higgins, 2018; Sievers et al., 2011). The SWISS-MODEL (https://www.swissmodel.expasy.org/) was used to construct the SmTLPs homologous protein model using the default parameters (Bienert et al., 2017; Guex, Peitsch & Schwede, 2009; Waterhouse et al., 2018).
Multiple sequence alignment and phylogenetic tree construction
All S. miltiorrhiza, A. thaliana, S. lycopersicum, and O. sativa TLPs were pooled into the Clustal Omega tool (https://www.ebi.ac.uk/Tools/msa/clustalo/) to perform multiple sequence alignments (Sievers & Higgins, 2018; Sievers et al., 2011). MEGA X (version 10.0.5) was used to perform a phylogenetic analysis of the aligned protein sequences using the Neighbor-Joining and the Maximum likelihood methods (Bootstrap = 1,000 replicates; other parameters: default) (Kumar et al., 2018). The phylogenetic tree we obtained was adjusted using Evolview (https://www.evolgenius.info/evolview).
Analysis of the promoter cis-regulating elements
A DNA sequence 2,000 bp upstream from 12 SmTLP family members was extracted from the genome database and defined as the promoter sequence. This submitted to PlantCARE (http://bioinformatics.psb.ugent.be/webtools/plantcare/html/) to identify the possible cis-regulating elements in the promoter sequence (Lescot, 2002). The visualization tool TBtools was used to map the distribution of cis-regulating elements in the promoters (Chen et al., 2020).
Analysis of gene expression
Two-year full-flowering S. miltiorrhiza plants with good and consistent growth condition were selected and divided into three groups. The control group was not given any treatment. The treatment group 1 was sprayed with 100 μmol L-1 ABA and the treatment group 2 was cultured at 4 °C. Each treatment consisted of three separate biological replicates. After treatment for 6 h, samples were taken, frozen in liquid nitrogen and stored in a refrigerator at −80 °C. Total RNA was extracted from roots, stems, leaves, and flowers using RNA extraction kit (Version 1.5) (DNase I) (Biofit Biotechnologies Co., Ltd) and three biological replicates were performed. cDNA was obtained by reverse transcription using the PrimeScript™ RT Reagent Kit with gDNA Eraser (Perfect Real Time) (Takara, Beijing, China). qRT-PCR analysis was performed using SYBR Premix Ex Taq™II (TaKaRa, Japan) and the following cycling parameters: 95 °C for 30 s, and 40 cycles of 95 °C for 5 s, and 60 °C for 34 s. qRT-PCR data was calculated and analyzed using the 2 − ΔΔCt method. DNA and CDS sequences were used to design gene-specific primers for amplification (Supplementary Materials Data 2) using Primer 5 software. The error bars represent qRT-PCR result variability from the three replicates. Using the Student’s t test, P ≤ 0.01 (*) and P ≤ 0.05 (**) were compared with WT.
Results
Identification of SmTLPs
Based on TLP sequences known to be found in A. thaliana we used the online iTAK online tool to identify 12 SmTLPs in the S. miltiorrhiza genome. Like with previous studies on A. thaliana, S. lycopersicum, and O. sativa, we named the 12 S. miltiorrhiza TLPs (Table 1).
| Group | Name | Gene ID | ORF (bp) | Protein (aa) | Subcellular localization | GRAVY | Instability index | pI | Mw (kDa) | |
|---|---|---|---|---|---|---|---|---|---|---|
| A1 | TLP1 | SMil_00010911 | 1,227 | 408 | nucl | −0.285 | 58.61 | unstable | 9.56 | 45.63 |
| TLP2 | SMil_00011940 | 1,050 | 349 | chlo | −0.340 | 55.91 | unstable | 9.35 | 39.19 | |
| TLP3 | SMil_00005797 | 1,323 | 440 | chlo | −0.211 | 44.69 | unstable | 9.52 | 48.65 | |
| TLP4 | SMil_00008084 | 1,152 | 383 | mito | −0.588 | 47.96 | unstable | 9.35 | 42.57 | |
| TLP5 | SMil_00025399 | 1,623 | 540 | chlo | −0.360 | 49.22 | unstable | 9.43 | 60.64 | |
| A2 | TLP6 | SMil_00009426 | 1,191 | 396 | nucl | −0.317 | 58.59 | unstable | 9.35 | 44.02 |
| TLP7 | SMil_00004338 | 1,278 | 425 | nucl | −0.353 | 63.13 | unstable | 9.54 | 47.64 | |
| TLP8 | SMil_00012920 | 1,293 | 430 | nucl | −0.401 | 65.55 | unstable | 9.62 | 48.31 | |
| B | TLP9 | SMil_00019666 | 927 | 308 | plas | −0.198 | 56.59 | unstable | 8.61 | 34.08 |
| TLP10 | SMil_00023352 | 1,188 | 395 | cyto | −0.159 | 53.93 | unstable | 8.8 | 43.88 | |
| TLP11 | SMil_00021823 | 984 | 327 | nucl | −0.443 | 71.3 | unstable | 9.76 | 36.93 | |
| C | TLP12 | SMil_00020329 | 1,227 | 408 | nucl | −0.547 | 45.66 | unstable | 9.52 | 45.78 |
The number of amino acids in the 12 SmTLPs ranged from 308 to 540. Physicochemical property analysis results revealed that the relative molecular weight of the 12 TLPs ranged from 34.08 to 60.64 kDa. The theoretical isoelectric points (p I) of all 12 TLPs were greater than 7, with TLP9 having the smallest p I (8.61) and TLP11 having the largest pI (9.76). The instability indice values for all SmTLPs were greater than 40, indicating that they are unstable proteins. In the grand average of hydropathicity, all SmTLPs’ values were negative. This indicates that SmTLPs are hydrophilic proteins. TLP4 had the best water solubility with a GRAVY value of -0.588. Subcellular localization prediction showed that all SmTLPs were located in the nucleus, suggesting that they play an important role there. This is consistent with previous studies on A. thaliana and S. lycopersicum (Lai et al., 2004; Zhang et al., 2020). The basic physicochemical properties of TLPs are shown in Table 1.
Phylogenetic analysis of SmTLPs
To investigate the phylogenetic relationship between S. miltiorrhiza TLPs, we constructed a phylogenetic tree including S. miltiorrhiza, A. thaliana, S. lycopersicum, and O. sativa TLPs using the Neighbor-Joining and Maximum likelihood methods (Fig. 1). This analysis clearly reveals that the 12 SmTLPs, 11 AtTLPs, 11 SlTLPs, and 14 OsTLPs are clustered and divided into three large subfamilies: A, B, and C. The A subfamily is further divided into AI and AII groups. This grouping is consistent with previous reports on S. lycopersicum (Zhang et al., 2020). The AI subfamily contains the most TLPs, including five SmTLPs (SmTLP1, SmTLP2, SmTLP3, SmTLP4, and SmTLP5) and 14 other TLPs. There are 15 TLPs in the A II subfamily, including three SmTLPs (SmTLP6, SmTLP7, and SmTLP8). The B subfamily has three SmTLPs (SmTLP9, SmTLP10, and SmTLP11). The C subfamily is the smallest subfamily, with only four TLPs (OsTLP13, AtTLP8, SlTLP11, and SmTLP12), and none of these TLPs contain F-box domains. The TLPs within each subfamily have high homology and close evolutionary relationships (Wang, Xu & Kong, 2018). However, the evolutionary concerns of S. miltiorrhiza, A. thaliana, and S. lycopersicum are closer.
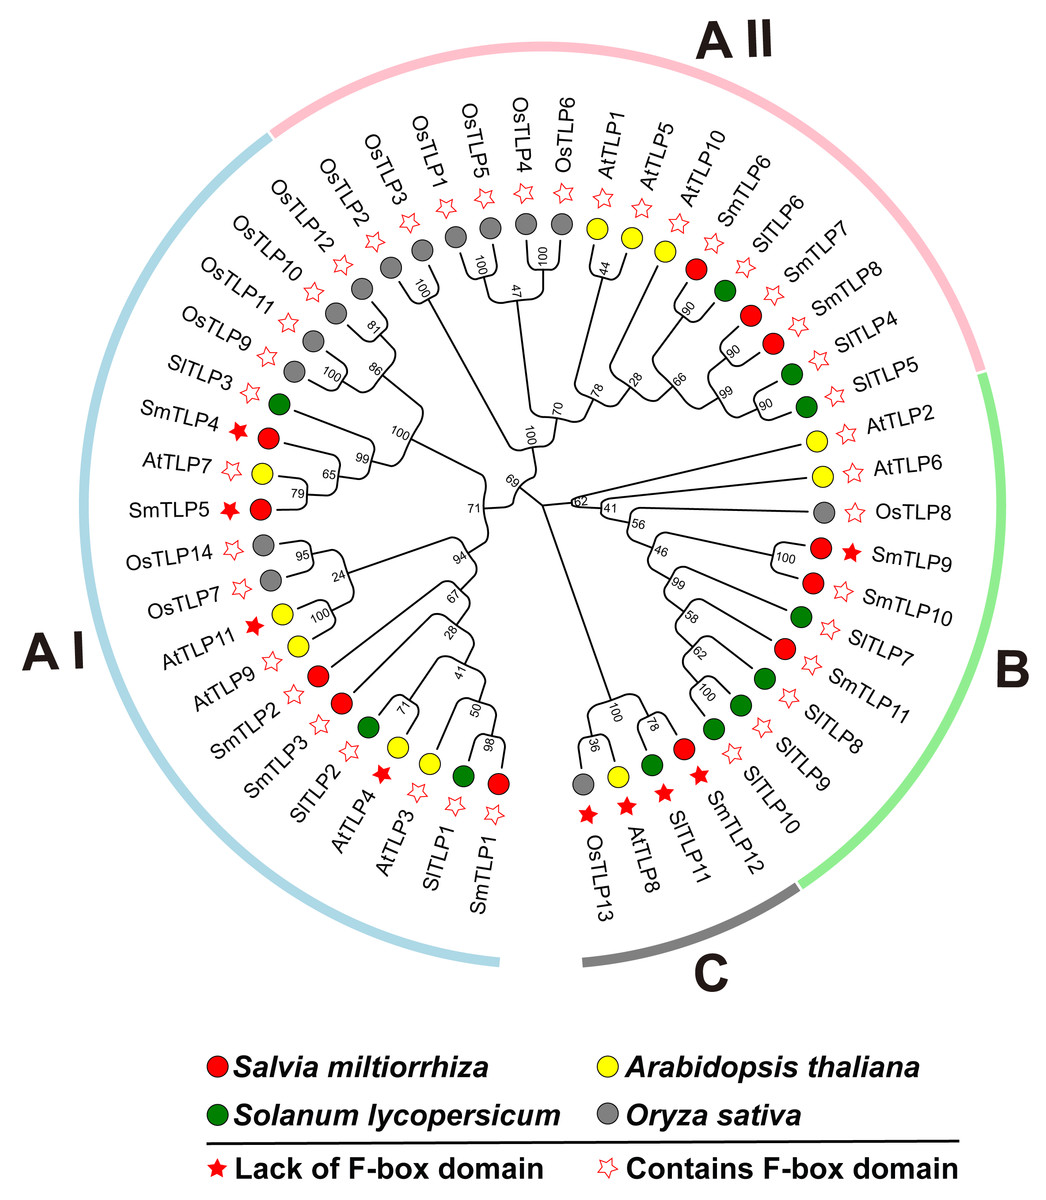
Figure 1: The phylogenetic tree of TLP proteins in four plants, including A. thaliana, O. sativa, S. lycopersicum, and S. miltiorrhiza.
The phylogenetic tree is constructed by MEGA X with the following parameters: Neighbor-Joining method, Poisson correction, Bootstrap = 1,000 replicates. All the members were divided into four classes which were represented by different colors. The members from various species were indicated by different labels. The proteins with F-box and those without F-box were marked by different stars.
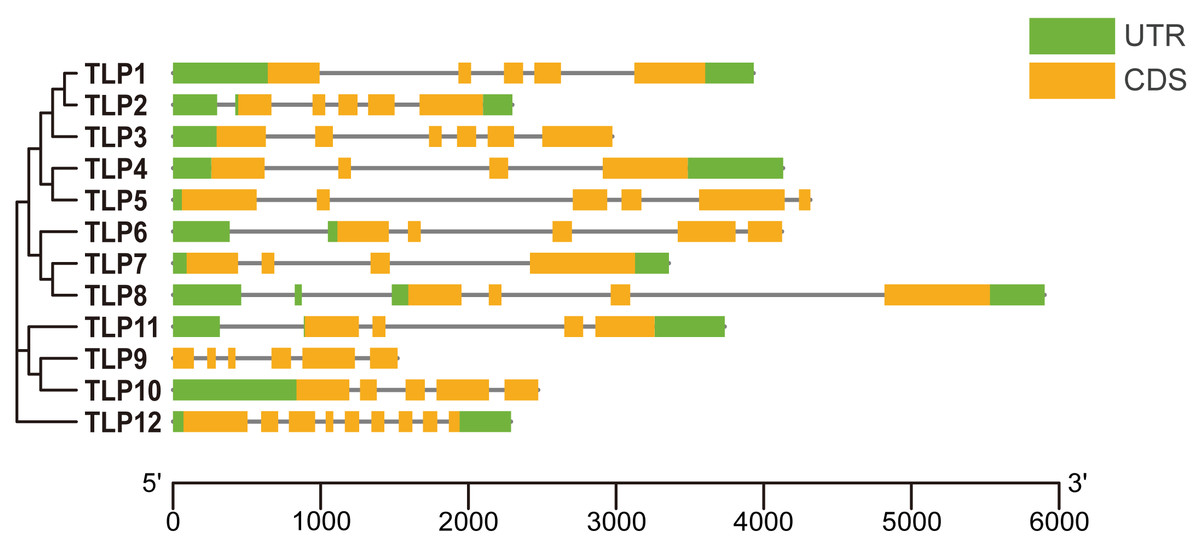
Figure 2: The gene structure of TLP genes in S. miltiorrhiza.
UTR, Untranslated region; CDS, Coding sequence. The picture is drawn by Tbtools.
Gene structure, conserved motifs, and conserved domains in SmTLPs
To improve our understanding of gene function and evolution, we analyzed the TLP gene structure (Fig. 2). Although some SmTLPs are very close phylogenetically, their exon number, distribution, and gene length greatly differ, especially between TLP1 and TLP2, and between TLP7 and TLP8. This is consistent with previous studies on S. lycopersicum, and may imply that the genetic structure of TLPs is easily altered (Zhang et al., 2020).
To further understand the process of TLP evolution, we analyzed the TLP motifs using MEME. A total of 10 motifs were identified (Fig. 3 and Fig. S1).
Conservative motif analysis results showed that all SmTLP members contained motif 1 and motif 4 (Fig. 3A). SmTLP members on the same branch of the phylogenetic tree had small differences in motif type, number, and position. SmTLP members on different branches of the phylogenetic tree had larger differences in motif type, number, and position. In particular, TLP12 had the fewest motifs, which may indicate that it has other unique functions. Closely related members on the phylogenetic tree often contain the same motif, indicating that TLPs in the same group have similar functions.
Proteins’ key conserved domains often confer function. To explore SmTLP function and structure we used the SMART database. The results show that, except for SmTLP9 and SmTLP12, SmTLPs have both a Tub domain (PF01167) and an F-box domain (PF00646) (Fig. 4 and Fig. S2). SmTLP structure was further explored by Tub domain 3D modeling. This analysis revealed that SmTLP11 Tub structure is incomplete, which may impact its function.
With additional 3D modeling and analysis of the TLPs’ Tub domain, we found that 11 SmTLPs have a complete Tub domain consisting of a closed β barrel with 12 anti-parallel strands and a central hydrophobic α helix (Fig. 5). We also found that TLP11 has an incomplete Tub domain, which may account for its special function, but this requires further experimental verification.
Analysis of SmTLP promoter sequences
The PlantCARE database was used to analyze 2,000 bp of DNA sequence upstream of the TLP genes’ transcription start site to determine the potential functions of TLPs. The main promoter was mapped and is displayed in Fig. 6. A variety of cis-elements that respond to environmental and hormonal signals have been identified in SmTLPs (Table 2). This implies that SmTLPs have a somewhat complicated mechanism of expression regulation. TLPs contain a variety of hormone response elements, including ABA, auxin, gibberellin, and MeJA response elements. Previous studies have shown that TLPs can also respond to light, temperature, hypoxia, and salt stress (Zhang et al., 2020). SmTLP10 had the most low-temperature response elements, which may indicate that it plays an important role in plant cold resistance (Fig. 7). TLP5 had the most meristem expression elements, indicating that it is important for plant meristem growth. Additional experiments are required to confirm these inferences.
The expression profiling of SmTLPs in different tissues of S. miltiorrhiza
Tissue-specific gene expression can be used to predict gene function. Therefore, we used qRT-PCR to detect SmTLP expression in various S. miltiorrhiza tissues (Fig. 8). The results showed that SmTLPs have distinct expression patterns. Four SmTLPs (SmTLP1, SmTLP2, SmTLP4, and SmTLP5) have unique expression patterns in the roots, which may imply that they function in stress resistance. This speculation requires further experimental verification. Four SmTLPs (SmTLP3, SmTLP9, SmTLP10, and SmTLP11) have unique expression patterns in the stems. The remaining four SmTLPs (SmTLP6, SmTLP7, SmTLP8, and SmTLP12) have unique expression patterns mainly in the flowers. Only SmTLP12 is expressed in leaves.
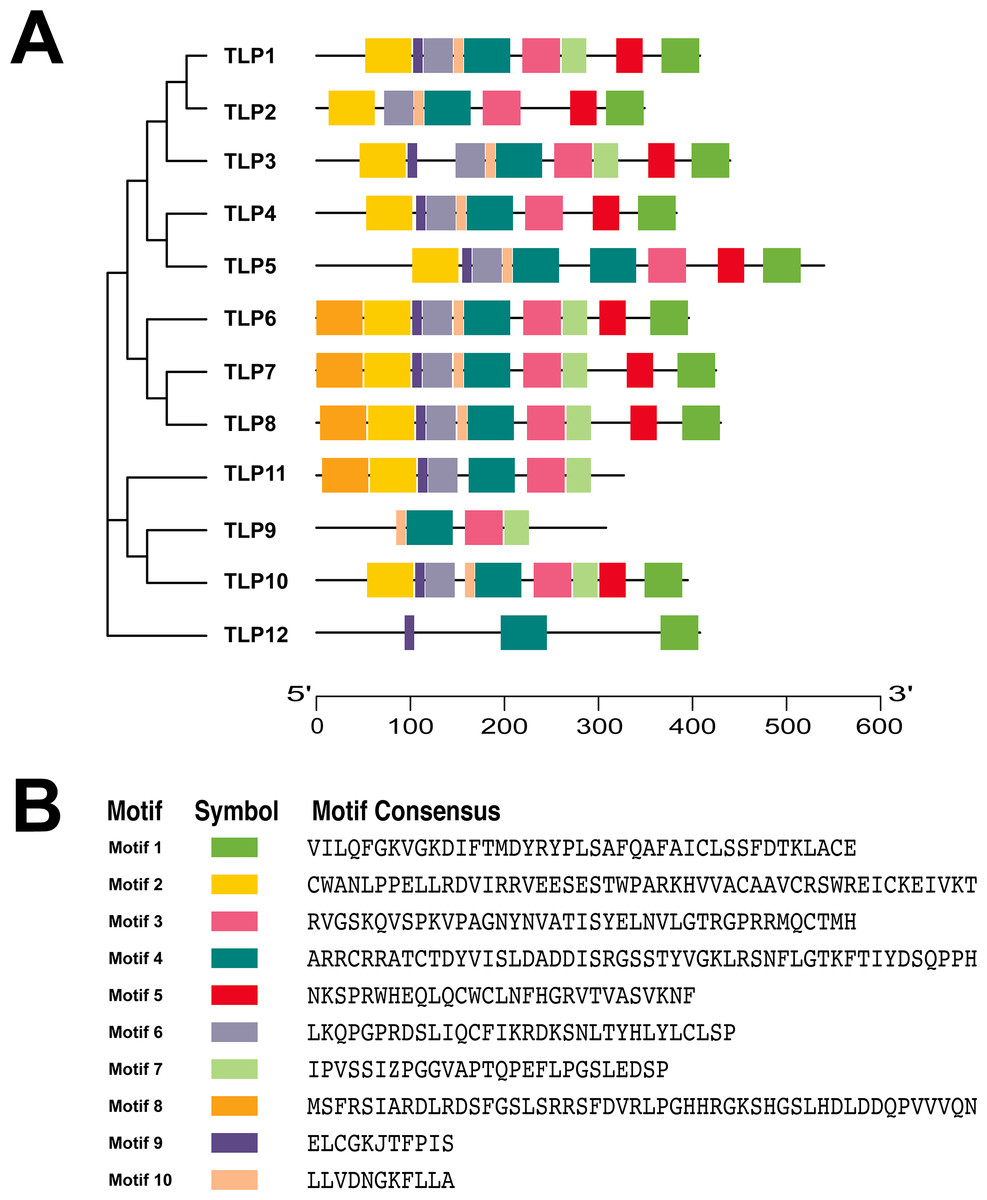
Figure 3: The conserved motifs of TLP proteins in S. miltiorrhiza.
(A) The localization of conserved motifs; (B) the Motif consensuses of conserved motifs. The full-length protein of SmTLPs was analyzed by MEME online software (maximum number of 10 motifs; minimum motif width of 6; maximum motif width of 200).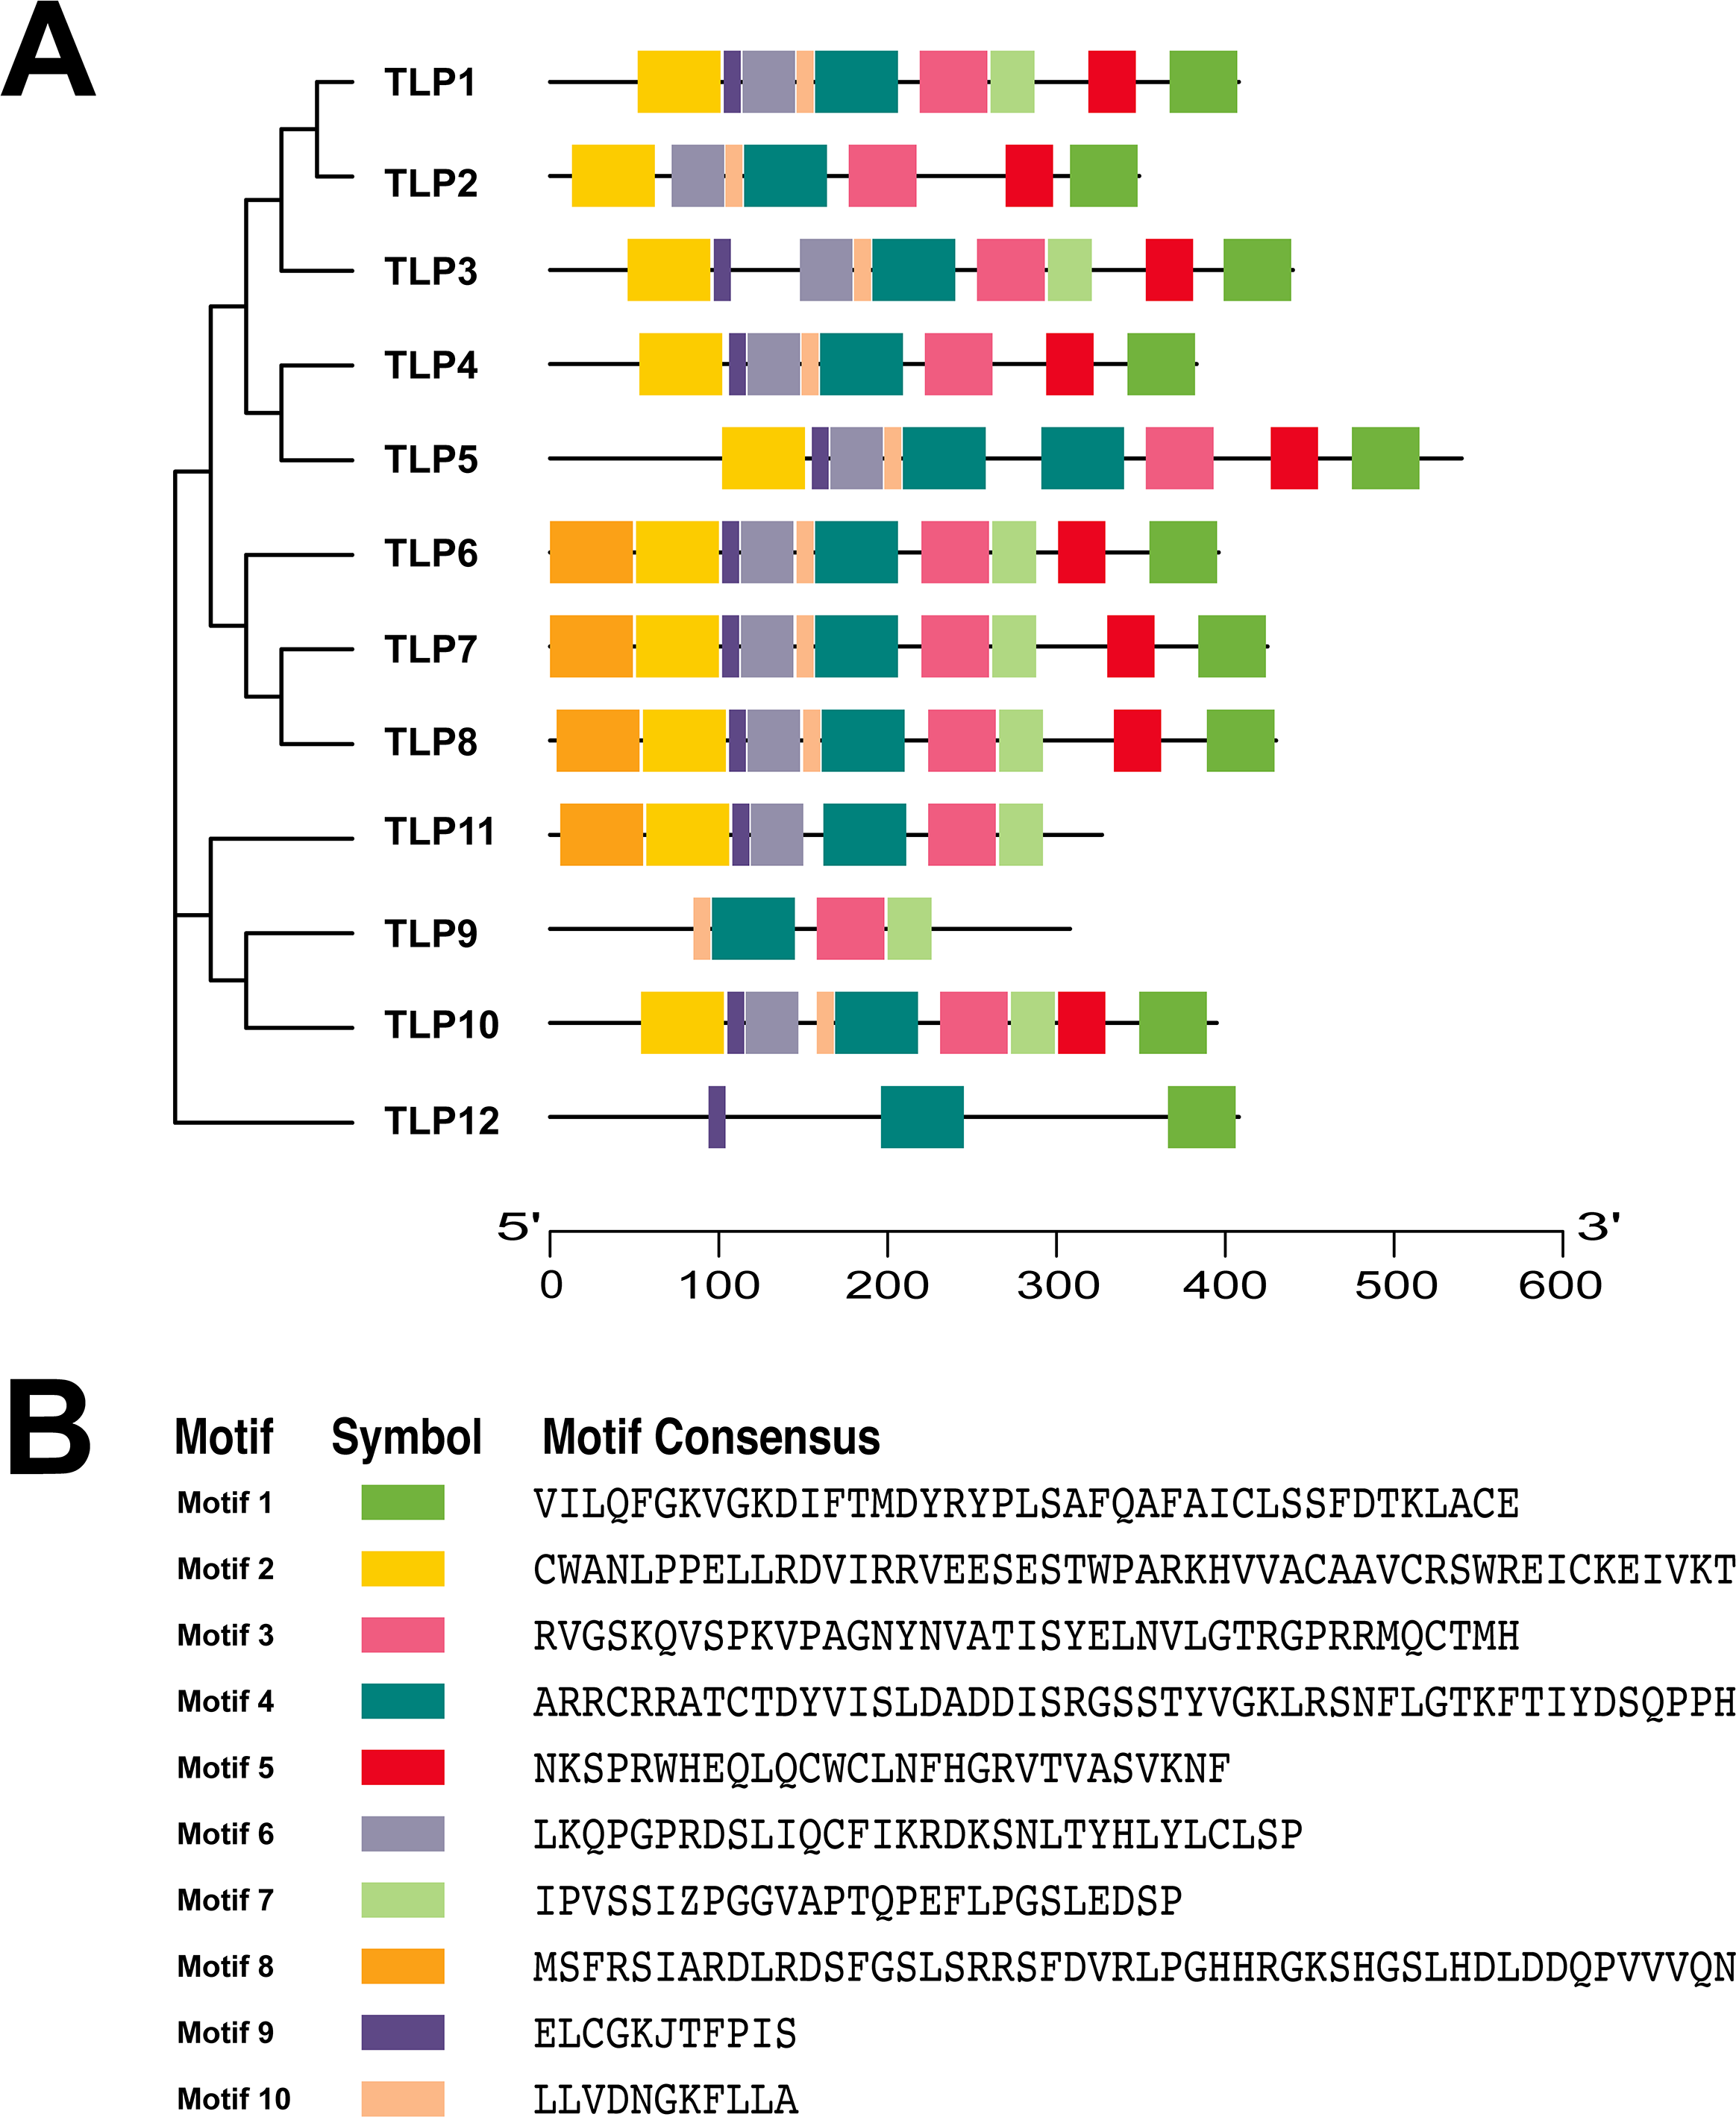
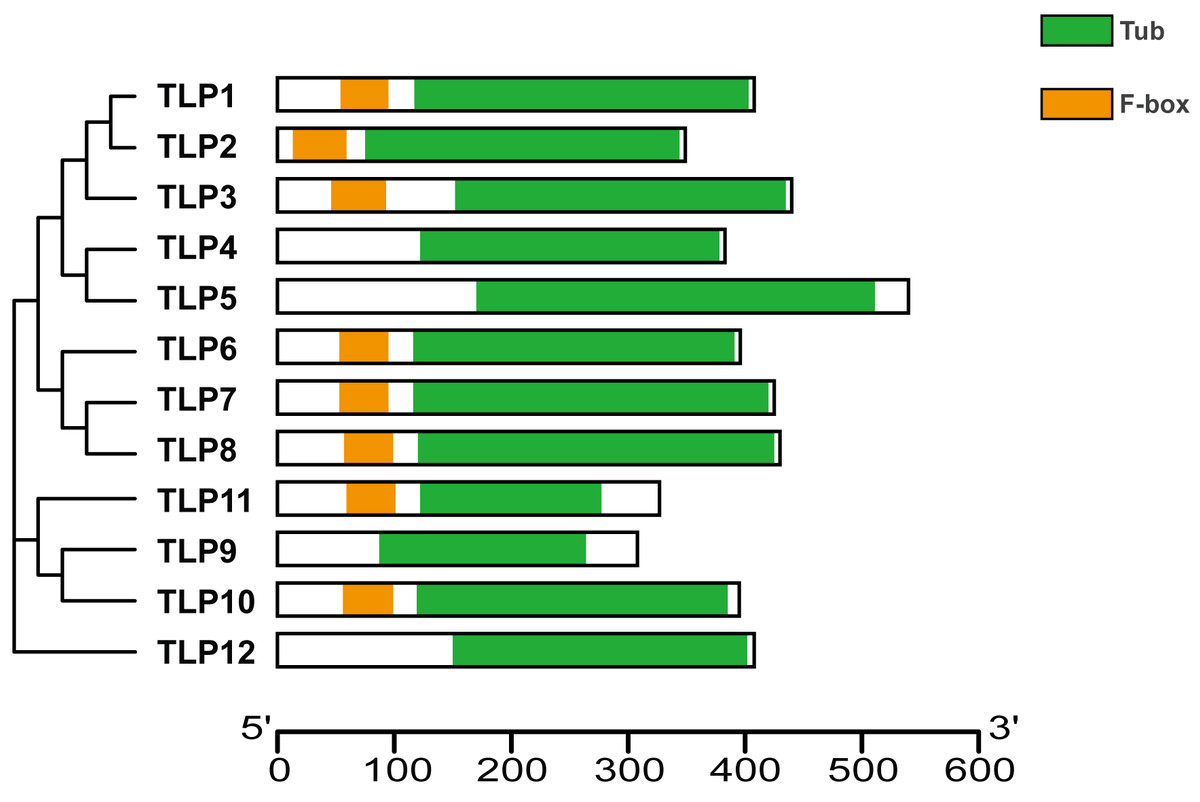
Figure 4: The conserved domains of TLP proteins in S. miltiorrhiza.
Different domains, including Tub and F-box were represented by colorful blocks. The relevant analysis results are based on the Pfam database.
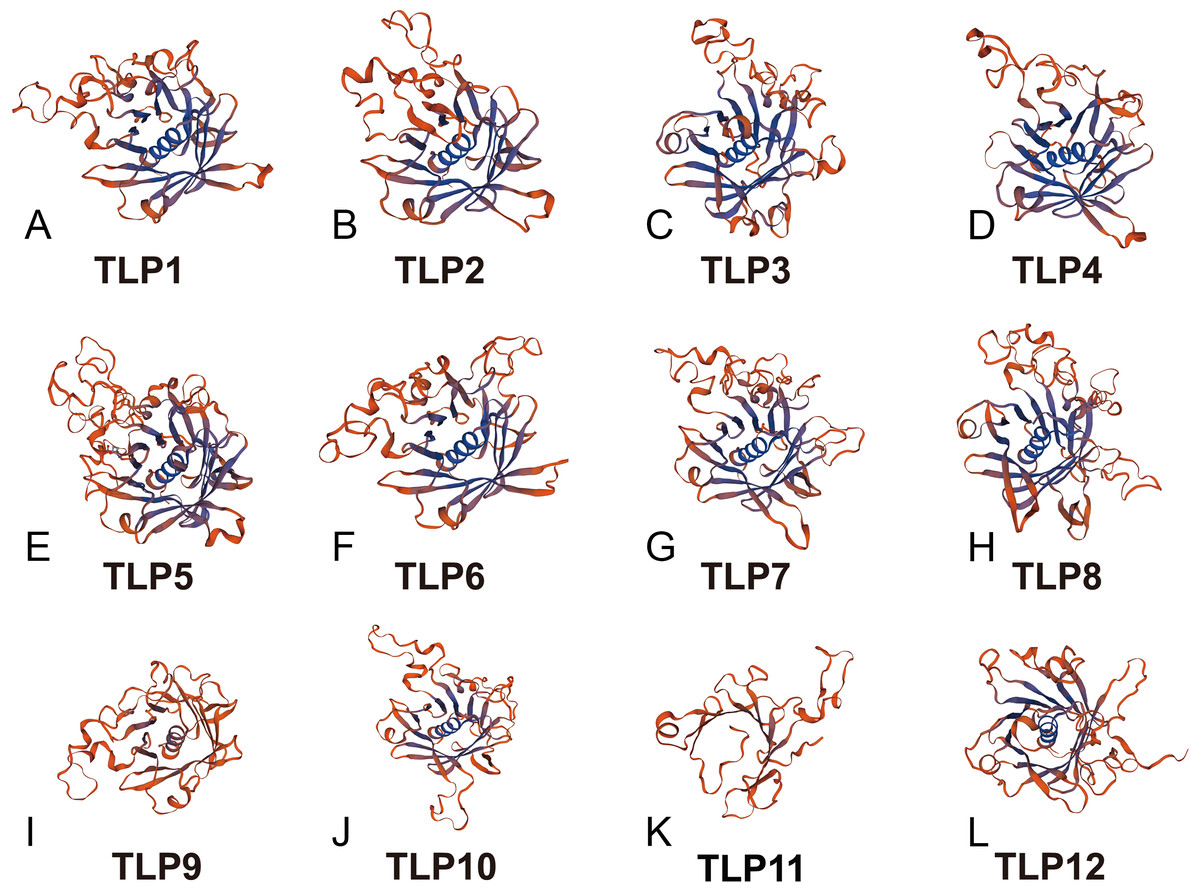
Figure 5: The 3D-model of the Tub domain of TLP proteins in S. miltiorrhiza.
The analysis results and pictures are generated by SWISS-MODEL (default parameters).
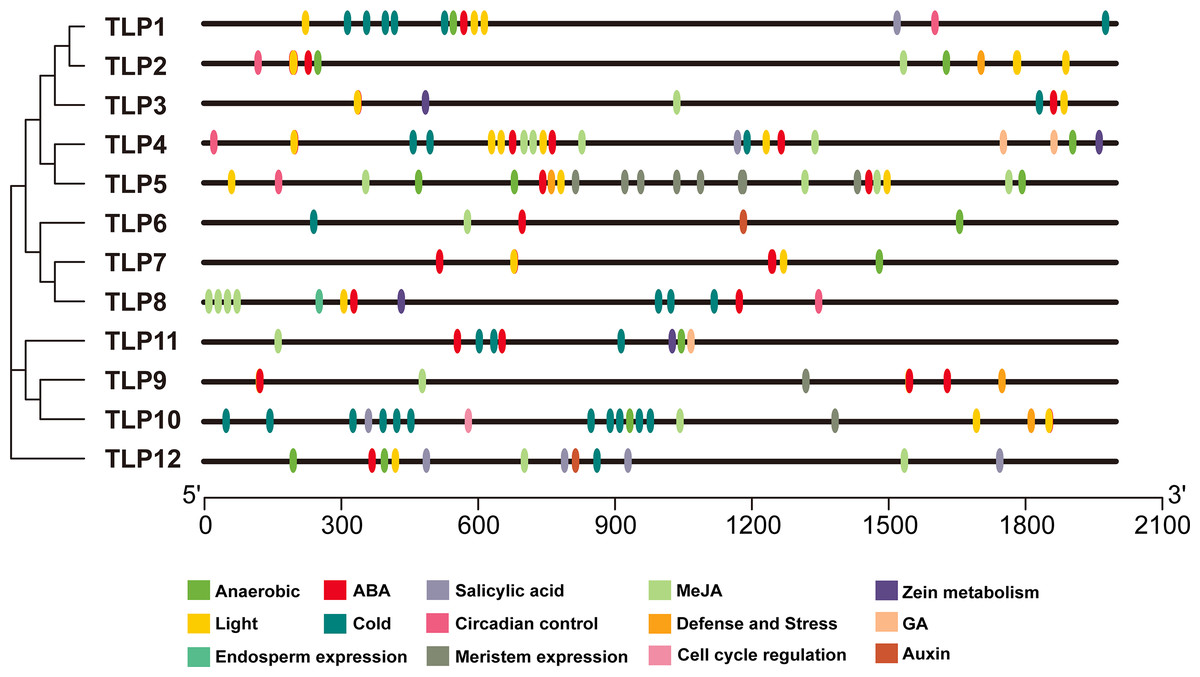
Figure 6: The cis-element distribution in the putative promoters of TLP genes in S. miltiorrhiza.
These cis-elements were shown in different colors and were located at 2,000 bp upstream of the SmTLP promoters.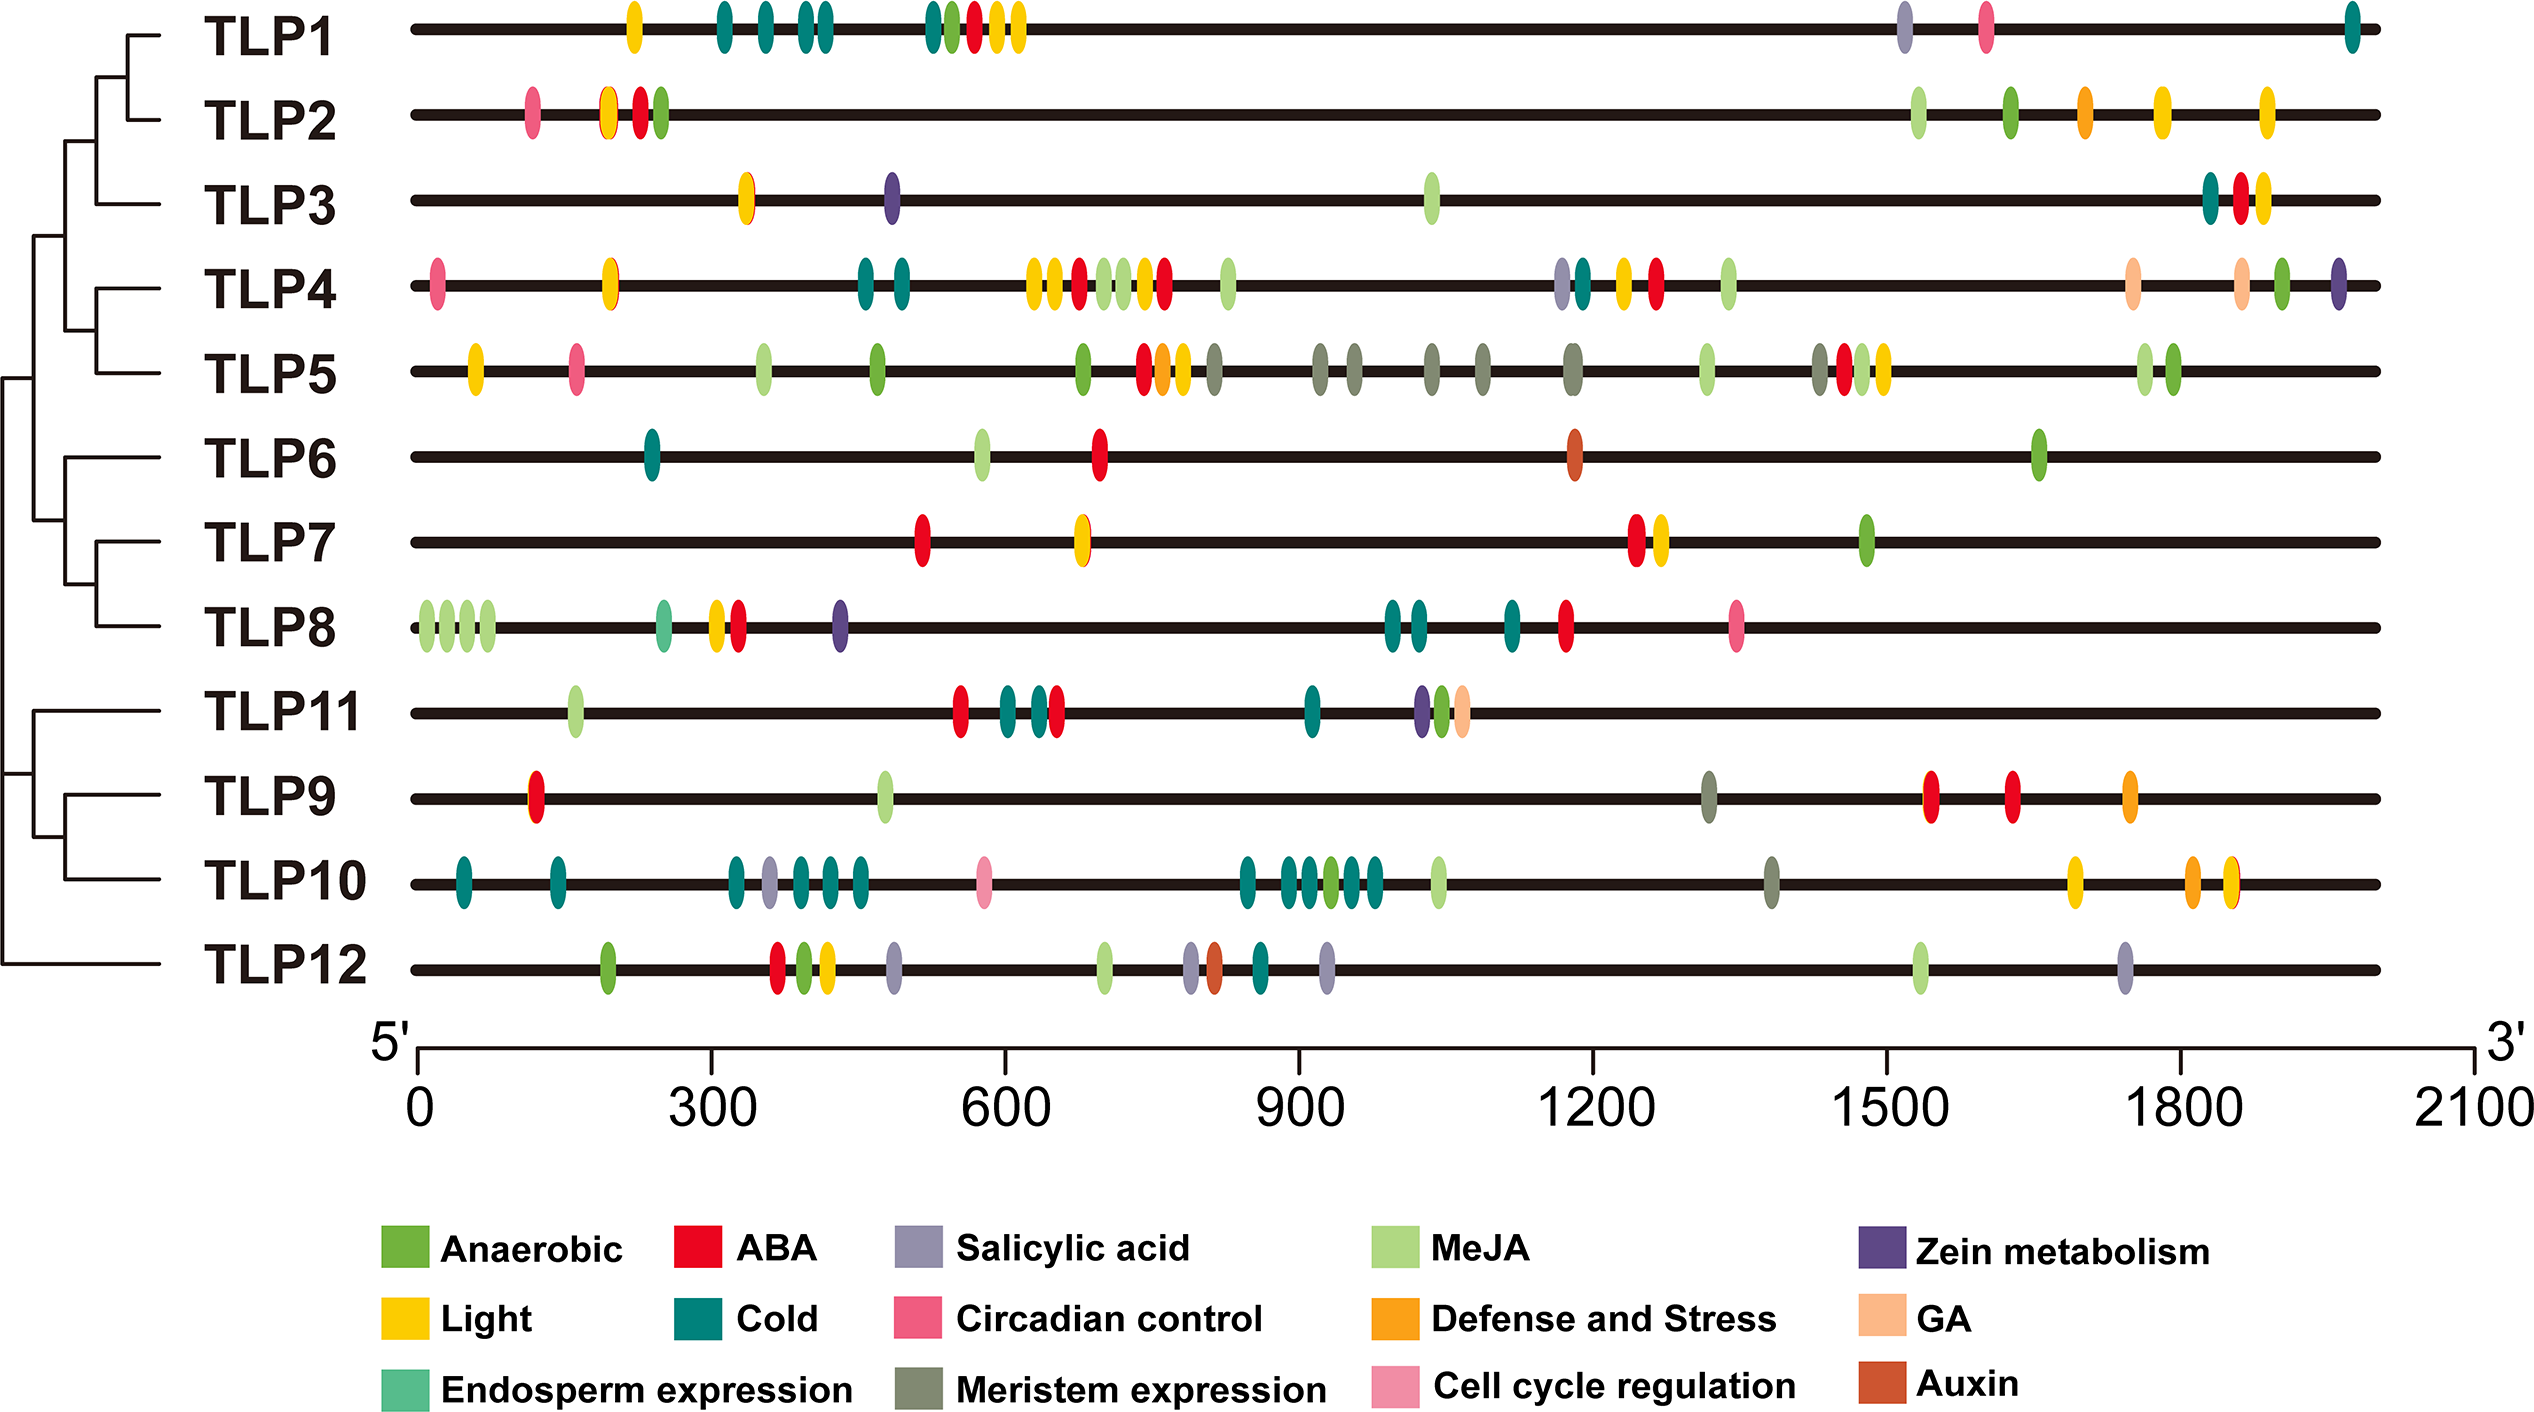
| Gene | Cis-elements | Sequences | Correlation |
|---|---|---|---|
| TLP1 | ARE | AAACCA | Anaerobic Induction |
| TLP1 | ACE | GACACGTATG | Light |
| TLP1 | G-Box | CACGTT | Light |
| TLP1 | G-box | CACGAC | Light |
| TLP1 | circadian | CAAAGATATC | Circadian Control |
| TLP1 | LTR | CCGAAA | Low-Temperature |
| TLP1 | LTR | CCGAAA | Low-Temperature |
| TLP1 | LTR | CCGAAA | Low-Temperature |
| TLP1 | LTR | CCGAAA | Low-Temperature |
| TLP1 | LTR | CCGAAA | Low-Temperature |
| TLP1 | LTR | CCGAAA | Low-Temperature |
| TLP1 | ABRE | ACGTG | Abscisic Acid |
| TLP1 | TCA-element | CCATCTTTTT | Salicylic Acid |
| TLP2 | ABRE | GACACGTGGC | Abscisic Acid |
| TLP2 | ABRE | CACGTG | Abscisic Acid |
| TLP2 | ABRE | ACGTG | Abscisic Acid |
| TLP2 | ABRE | AACCCGG | Abscisic Acid |
| TLP2 | ABRE | ACGTG | Abscisic Acid |
| TLP2 | G-box | ACACGTGGC | Light |
| TLP2 | G-box | CACGTG | Light |
| TLP2 | G-box | GCCACGTGGA | Light |
| TLP2 | G-box | CACGAC | Light |
| TLP2 | CGTCA-motif | CGTCA | Meja |
| TLP2 | circadian | CAAAGATATC | Circadian Control |
| TLP2 | TC-rich repeats | ATTCTCTAAC | Defense And Stress |
| TLP2 | TGACG-motif | TGACG | Meja |
| TLP2 | ARE | AAACCA | Anaerobic Induction |
| TLP2 | ARE | AAACCA | Anaerobic Induction |
| TLP2 | G-Box | CACGTG | Light |
| TLP2 | G-Box | CACGTT | Light |
| TLP3 | TGACG-motif | TGACG | Meja |
| TLP3 | O2-site | GATGACATGG | Zein Metabolism Regulation |
| TLP3 | ABRE | ACGTG | Abscisic Acid |
| TLP3 | ABRE | ACGTG | Abscisic Acid |
| TLP3 | CGTCA-motif | CGTCA | Meja |
| TLP3 | LTR | CCGAAA | Low-Temperature |
| TLP3 | G-box | TACGTG | Light |
| TLP3 | G-box | TACGTG | Light |
| TLP4 | TGACG-motif | TGACG | Meja |
| TLP4 | TGACG-motif | TGACG | Meja |
| TLP4 | TGACG-motif | TGACG | Meja |
| TLP4 | ARE | AAACCA | Anaerobic Induction |
| TLP4 | G-Box | CACGTG | Light |
| TLP4 | TATC-box | TATCCCA | Gibberellin |
| TLP4 | TATC-box | TATCCCA | Gibberellin |
| TLP4 | TCA-element | TCAGAAGAGG | Salicylic Acid |
| TLP4 | O2-site | GATGACATGG | Zein Metabolism Regulation |
| TLP4 | ABRE | CACGTG | Abscisic Acid |
| TLP4 | ABRE | ACGTG | Abscisic Acid |
| TLP4 | ABRE | ACGTG | Abscisic Acid |
| TLP4 | ABRE | ACGTG | Abscisic Acid |
| TLP4 | ABRE | ACGTG | Abscisic Acid |
| TLP4 | G-box | CACGTG | Light |
| TLP4 | G-box | CCACGTAA | Light |
| TLP4 | G-box | TACGTG | Light |
| TLP4 | G-box | CACGTC | Light |
| TLP4 | G-box | CACGTC | Light |
| TLP4 | CGTCA-motif | CGTCA | Meja |
| TLP4 | CGTCA-motif | CGTCA | Meja |
| TLP4 | CGTCA-motif | CGTCA | Meja |
| TLP4 | LTR | CCGAAA | Low-Temperature |
| TLP4 | LTR | CCGAAA | Low-Temperature |
| TLP4 | LTR | CCGAAA | Low-Temperature |
| TLP4 | circadian | CAAAGATATC | Circadian Control |
| TLP5 | TC-rich repeats | ATTCTCTAAC | Defense And Stress |
| TLP5 | TGACG-motif | TGACG | Meja |
| TLP5 | TGACG-motif | TGACG | Meja |
| TLP5 | TGACG-motif | TGACG | Meja |
| TLP5 | TGACG-motif | TGACG | Meja |
| TLP5 | ARE | AAACCA | Anaerobic Induction |
| TLP5 | ARE | AAACCA | Anaerobic Induction |
| TLP5 | ARE | AAACCA | Anaerobic Induction |
| TLP5 | CAT-box | GCCACT | Meristem Expression |
| TLP5 | CAT-box | GCCACT | Meristem Expression |
| TLP5 | CAT-box | GCCACT | Meristem Expression |
| TLP5 | CAT-box | GCCACT | Meristem Expression |
| TLP5 | CAT-box | GCCACT | Meristem Expression |
| TLP5 | CAT-box | GCCACT | Meristem Expression |
| TLP5 | CAT-box | GCCACT | Meristem Expression |
| TLP5 | CAT-box | GCCACT | Meristem Expression |
| TLP5 | G-Box | CACGTT | Light |
| TLP5 | ABRE | ACGTG | Abscisic Acid |
| TLP5 | ABRE | ACGTG | Abscisic Acid |
| TLP5 | ABRE | ACGTG | Abscisic Acid |
| TLP5 | G-box | CACGTC | Light |
| TLP5 | G-box | CACGTC | Light |
| TLP5 | circadian | CAAAGATATC | Circadian Control |
| TLP5 | CGTCA-motif | CGTCA | Meja |
| TLP5 | CGTCA-motif | CGTCA | Meja |
| TLP5 | CGTCA-motif | CGTCA | Meja |
| TLP5 | CGTCA-motif | CGTCA | Meja |
| TLP6 | AuxRR-core | GGTCCAT | Auxin |
| TLP6 | TGACG-motif | TGACG | Meja |
| TLP6 | ARE | AAACCA | Anaerobic Induction |
| TLP6 | G-Box | CACGTT | Light |
| TLP6 | ABRE | ACGTG | Abscisic Acid |
| TLP6 | CGTCA-motif | CGTCA | Meja |
| TLP6 | LTR | CCGAAA | Low-Temperature |
| TLP7 | G-Box | CACGTT | Light |
| TLP7 | ARE | AAACCA | Anaerobic Induction |
| TLP7 | ABRE | ACGTG | Abscisic Acid |
| TLP7 | ABRE | ACGTG | Abscisic Acid |
| TLP7 | ABRE | CGTACGTGCA | Abscisic Acid |
| TLP7 | ABRE | ACGTG | Abscisic Acid |
| TLP7 | G-box | CACGTC | Light |
| TLP7 | G-box | TACGTG | Light |
| TLP8 | CGTCA-motif | CGTCA | Meja |
| TLP8 | CGTCA-motif | CGTCA | Meja |
| TLP8 | circadian | CAAAGATATC | Circadian Control |
| TLP8 | LTR | CCGAAA | Low-Temperature |
| TLP8 | LTR | CCGAAA | Low-Temperature |
| TLP8 | LTR | CCGAAA | Low-Temperature |
| TLP8 | G-box | TACGTG | Light |
| TLP8 | O2-site | GATGA(C/T)(A/G)TG(A/G) | Zein Metabolism Regulation |
| TLP8 | ABRE | ACGTG | Abscisic Acid |
| TLP8 | ABRE | GACACGTGGC | Abscisic Acid |
| TLP8 | ACE | GACACGTATG | Light |
| TLP8 | GCN4_motif | TGAGTCA | Endosperm Expression |
| TLP8 | TGACG-motif | TGACG | Meja |
| TLP8 | TGACG-motif | TGACG | Meja |
| TLP9 | CAT-box | GCCACT | Meristem Expression |
| TLP9 | G-Box | CACGTT | Light |
| TLP9 | G-Box | CACGTT | Light |
| TLP9 | TC-rich repeats | ATTCTCTAAC | Defense And Stress |
| TLP9 | TGACG-motif | TGACG | Meja |
| TLP9 | G-box | TACGTG | Light |
| TLP9 | G-box | TAAACGTG | Light |
| TLP9 | CGTCA-motif | CGTCA | Meja |
| TLP9 | ABRE | ACGTG | Abscisic Acid |
| TLP9 | ABRE | ACGTG | Abscisic Acid |
| TLP9 | ABRE | ACGTG | Abscisic Acid |
| TLP10 | TC-rich repeats | ATTCTCTAAC | Defense And Stress |
| TLP10 | MSA-like | TCCAACGGT | Cell Cycle Regulation |
| TLP10 | TGACG-motif | TGACG | Meja |
| TLP10 | TCA-element | CCATCTTTTT | Salicylic Acid |
| TLP10 | ABRE | ACGTG | Abscisic Acid |
| TLP10 | ABRE | ACGTG | Abscisic Acid |
| TLP10 | ARE | AAACCA | Anaerobic Induction |
| TLP10 | CAT-box | GCCACT | Meristem Expression |
| TLP10 | G-Box | CACGTT | Light |
| TLP10 | G-box | TAAACGTG | Light |
| TLP10 | G-box | TACGTG | Light |
| TLP10 | CGTCA-motif | CGTCA | Meja |
| TLP10 | LTR | CCGAAA | Low-Temperature |
| TLP10 | LTR | CCGAAA | Low-Temperature |
| TLP10 | LTR | CCGAAA | Low-Temperature |
| TLP10 | LTR | CCGAAA | Low-Temperature |
| TLP10 | LTR | CCGAAA | Low-Temperature |
| TLP10 | LTR | CCGAAA | Low-Temperature |
| TLP10 | LTR | CCGAAA | Low-Temperature |
| TLP10 | LTR | CCGAAA | Low-Temperature |
| TLP10 | LTR | CCGAAA | Low-Temperature |
| TLP10 | LTR | CCGAAA | Low-Temperature |
| TLP10 | LTR | CCGAAA | Low-Temperature |
| TLP11 | TATC-box | TATCCCA | Gibberellin |
| TLP11 | ARE | AAACCA | Anaerobic Induction |
| TLP11 | TGACG-motif | TGACG | Meja |
| TLP11 | CGTCA-motif | CGTCA | Meja |
| TLP11 | LTR | CCGAAA | Low-Temperature |
| TLP11 | LTR | CCGAAA | Low-Temperature |
| TLP11 | LTR | CCGAAA | Low-Temperature |
| TLP11 | O2-site | GATGATGTGG | Zein Metabolism Regulation |
| TLP11 | ABRE | AACCCGG | Abscisic Acid |
| TLP11 | ABRE | GCAACGTGTC | Abscisic Acid |
| TLP11 | ABRE | AACCCGG | Abscisic Acid |
| TLP12 | ARE | AAACCA | Anaerobic Induction |
| TLP12 | ARE | AAACCA | Anaerobic Induction |
| TLP12 | AuxRR-core | GGTCCAT | Auxin |
| TLP12 | TGACG-motif | TGACG | Meja |
| TLP12 | TGACG-motif | TGACG | Meja |
| TLP12 | G-box | CACGTC | Light |
| TLP12 | CGTCA-motif | CGTCA | Meja |
| TLP12 | CGTCA-motif | CGTCA | Meja |
| TLP12 | LTR | CCGAAA | Low-Temperature |
| TLP12 | TCA-element | CCATCTTTTT | Salicylic Acid |
| TLP12 | TCA-element | CCATCTTTTT | Salicylic Acid |
| TLP12 | TCA-element | CCATCTTTTT | Salicylic Acid |
| TLP12 | TCA-element | CCATCTTTTT | Salicylic Acid |
| TLP12 | ABRE | ACGTG | Abscisic Acid |
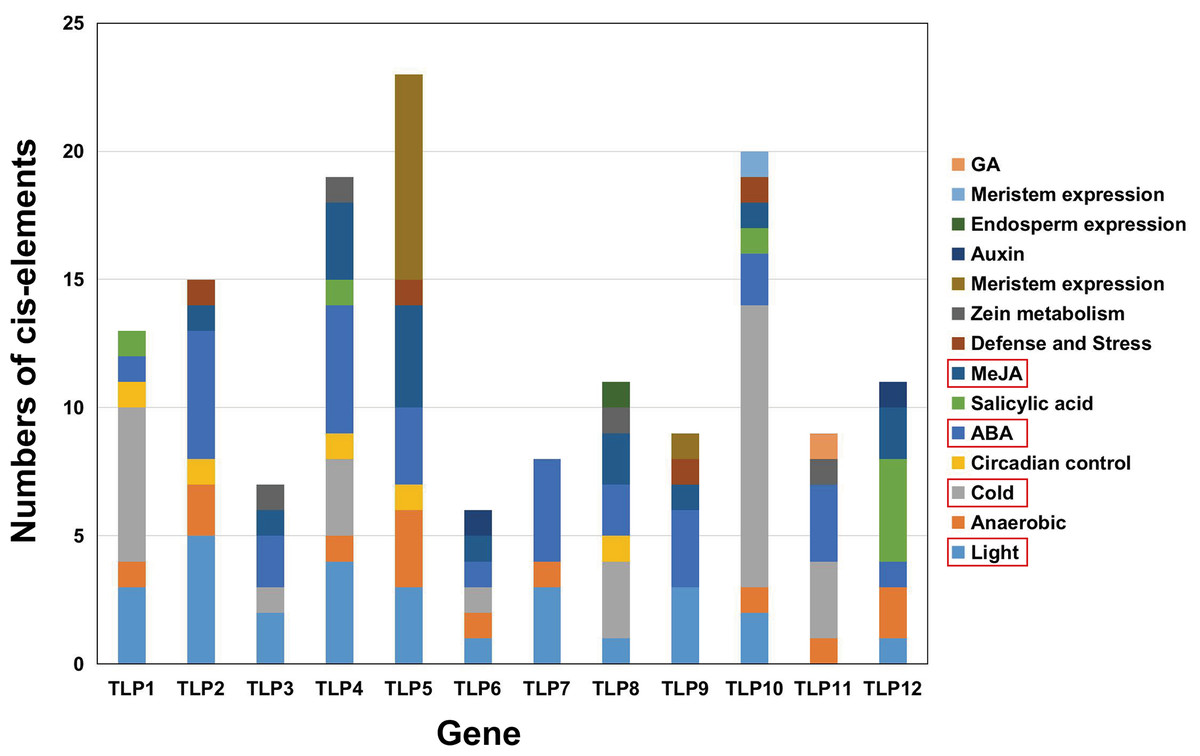
Figure 7: The analysis of putative Cis-elements of TLP genes in S. miltiorrhiza.
These cis-elements were shown in different colors.
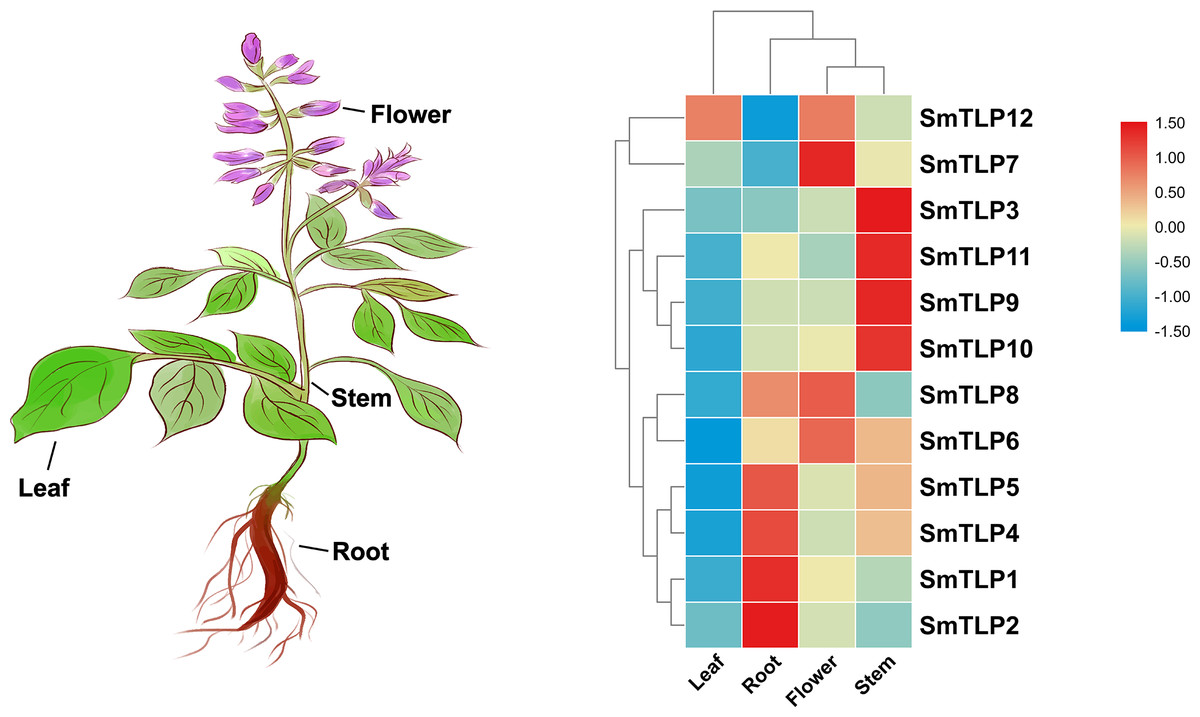
Figure 8: The expression patterns of TLP genes in different S. miltiorrhiza tissues, including leaf, root, flower, and stem.
The data was homogenized by Log2 (X + 1) and the heat map was drawn by TBtools.
The expression of SmTLPs under ABA and cold treatment
We performed stress treatment on S. miltiorrhiza and used qRT-PCR to detect SmTLP expression to explore the response of SmTLPs to stress (Fig. 9). Under cold stress, the stem SmTLP3 expression decreased significantly, while SmTLP10 stem expression increased significantly. This suggests that these genes may play important roles in stem growth. After the flowers were subjected to cold stress, SmTLP6 expression decreased significantly and SmTLP8 expression increased significantly. This may indicate that they are involved in important physiological processes in flowers. Under cold stress, the SmTLP8 and SmTLP10 expression in roots significantly increased, indicating that they are involved in the cold-stress response in S. miltiorrhiza. Under ABA stress, SmTLP12 expression significantly increased, indicating that SmTLP12 may participate in the ABA pathway in S. miltiorrhiza.
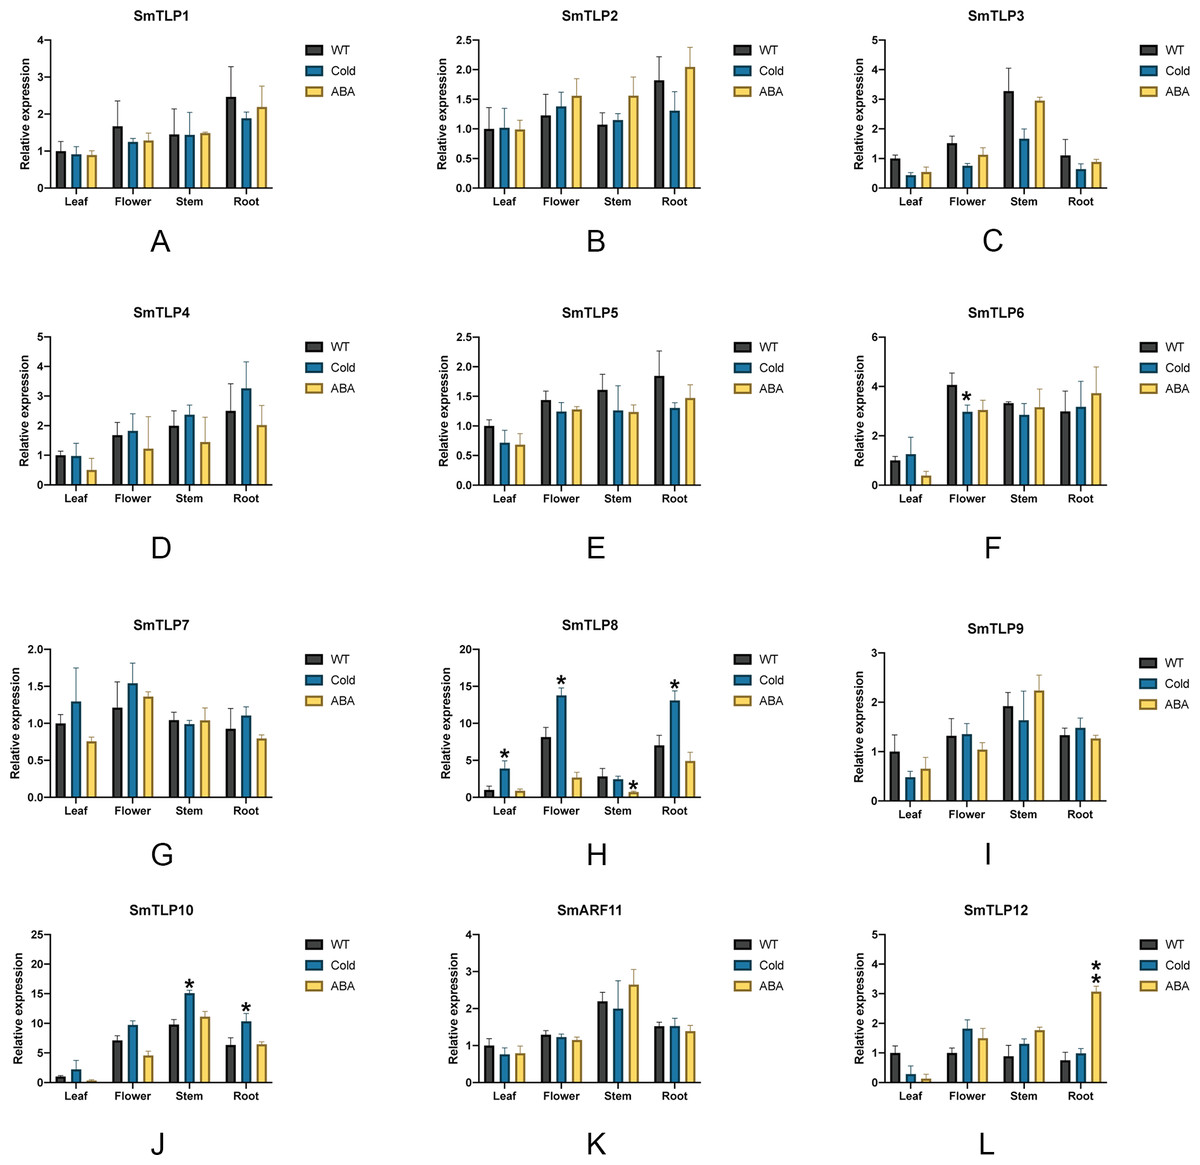
Figure 9: The expression of TLP genes in S. miltiorrhiza under cold stress and exogenous ABA stress treatment (A-L).
WT, Wild type; Cold, Exposure at 4 °C for 6 h; ABA, Exposure to 100 µM ABA for 6 h. Error bars represent the variability of qRT-PCR results from three replicates. **, P ≤ 0.01 and *, P ≤ 0.05, based on Student’s t test, compared with WT.
Discussion
TLP, a transcription factor widely found in animal and plant genomes, plays a variety of important functions (Wang, Xu & Kong, 2018). To date, analysis of plant TLP gene families has shown that multiple TLP genes are involved in plant responses to biological and abiotic stresses (Lai et al., 2004; Liu, 2008; Xu et al., 2016c; Yulong et al., 2016). This indicates that TLP genes can be used as candidate genes in plant resistance breeding. S. miltiorrhiza is an important herbal medicine and is widely cultivated because of its high economic value and importance in research. In this study, we examined the potential functions of S. miltiorrhiza TLPs. Using bioinformatics, we identified 12 SmTLPs and conducted comprehensive analyses including gene structure, protein structure, phylogenetic, and expression analyses.
Analysis of gene and protein structure revealed that most TLPs have both a Tub and F-box domain and is consistent with previously reported results (Lai et al., 2004; Liu, 2008; Xu et al., 2016c; Yulong et al., 2016). Similarly, based on the 3D modeling approach, we confirm that SmTLPs, except for SMTLP11, have the complete TUB domain consisting of a closed β barrel with 12 anti-parallel strands and a central hydrophobic α helix. This suggests that SMTLP11 may have special qualities.
Phylogenetic analysis showed that the 12 identified SmTLPs are divided into three subfamilies (Fig. 5). This is consistent with the results of previous studies, indicating the conservation and importance of TLPs (Xu et al., 2016b; Yulong et al., 2016; Zhang et al., 2020). Interestingly, we found that none of the TLPs in the C subfamily possess the F-box domain thought to be related to plant stress resistance (Gagne et al., 2002; Lai et al., 2004; Xu et al., 2019). This result indicates that TLPs in the C subfamily are highly conserved, and suggests that they may have other important functions in plants.
The cis-element is a regulatory element in plants that plays a vital role in transcription level regulation. Promoter analysis suggests that SmTLPs not only participate in hormone regulation, but may also play an important role in plant resistance to drought, low temperature, and exogenous ABA responses (Fig. 6 and Fig. 7) (Bao et al., 2014). We found that SmTLP10 has the most cold-induced cis-elements, implying that it plays an important role in the response to cold in S. miltiorrhiza.
To further study the response of SmTLPs to abiotic stress, we used q-PCR to analyze the expression patterns of 12 SmTLPs in various S. miltiorrhiza tissues. The results showed that SmTLPs are expressed in different tissues. Additionally, we found that, consistent with our promoter analysis, the SmTLP10 expression increased significantly in roots and stems after S. miltiorrhiza was exposed to cold stress. This indicates that SmTLP10 plays an important role in plant resistance to cold stress. Moreover, SmTLP12 expression increased significantly in roots after being induced by exogenous ABA. This may indicate that SmTLP12 is involved in the ABA pathway in S. miltiorrhiza.
Conclusions
In this paper, we identified 12 TLPs in S. miltiorrhiza and conducted a comprehensive analysis of SmTLPs, including gene structure analysis, protein structure analysis, phylogenetic analysis and expression analysis, etc. Promoter analysis shows that most SmTLPs are not only related to hormone response, but also related to abiotic stress. Expression analysis showed that the 12 SmTLPs were mainly divided into three categories: one was specifically expressed in roots, one was specifically expressed in stems, and the other was specifically expressed in leaves. Additional studies have shown that SmTLP10 may play an important role in plants’ resistance to cold, while SmTLP12 may be involved in the plant’s ABA metabolic pathway. Our results clarify the basic bioinformatic characteristics of TLPs in S. miltiorrhiza and verify that some TLPs (TLP10 and TLP12) play an important role in the anti-stress functions of S. miltiorrhiza. This work also lays the foundation for stress resistance breeding in S. miltiorrhiza.