
The complete chloroplast genome sequences of three Broussonetia species and comparative analysis within the Moraceae
- Published
- Accepted
- Received
- Academic Editor
- Victoria Sosa
- Subject Areas
- Genetics, Genomics, Molecular Biology, Plant Science, Taxonomy
- Keywords
- Broussonetia, Moraceae, Chloroplast genome, Phylogeny, Comparative analysis
- Copyright
- © 2022 Yang et al.
- Licence
- This is an open access article distributed under the terms of the Creative Commons Attribution License, which permits unrestricted use, distribution, reproduction and adaptation in any medium and for any purpose provided that it is properly attributed. For attribution, the original author(s), title, publication source (PeerJ) and either DOI or URL of the article must be cited.
- Cite this article
- 2022. The complete chloroplast genome sequences of three Broussonetia species and comparative analysis within the Moraceae. PeerJ 10:e14293 https://doi.org/10.7717/peerj.14293
Abstract
Background
Species of Broussonetia (family Moraceae) are commonly used to make textiles and high-grade paper. The distribution of Broussonetia papyrifera L. is considered to be related to the spread and location of humans. The complete chloroplast (cp) genomes of B. papyrifera, Broussonetia kazinoki Sieb., and Broussonetia kaempferi Sieb. were analyzed to better understand the status and evolutionary biology of the genus Broussonetia.
Methods
The cp genomes were assembled and characterized using SOAPdenovo2 and DOGMA. Phylogenetic and molecular dating analysis were performed using the concatenated nucleotide sequences of 35 species in the Moraceae family and were based on 66 protein-coding genes (PCGs). An analysis of the sequence divergence (pi) of each PCG among the 35 cp genomes was conducted using DnaSP v6. Codon usage indices were calculated using the CodonW program.
Results
All three cp genomes had the typical land plant quadripartite structure, ranging in size from 160,239 bp to 160,841 bp. The ribosomal protein L22 gene (RPL22) was either incomplete or missing in all three Broussonetia species. Phylogenetic analysis revealed two clades. Clade 1 included Morus and Artocarpus, whereas clade 2 included the other seven genera. Malaisia scandens Lour. was clustered within the genus Broussonetia. The differentiation of Broussonetia was estimated to have taken place 26 million years ago. The PCGs’ pi values ranged from 0.0005 to 0.0419, indicating small differences within the Moraceae family. The distribution of most of the genes in the effective number of codons plot (ENc-plot) fell on or near the trend line; the slopes of the trend line of neutrality plots were within the range of 0.0363–0.171. These results will facilitate the identification, taxonomy, and utilization of the Broussonetia species and further the evolutionary studies of the Moraceae family.
Introduction
Broussonetia (family Moraceae) species are trees or shrubs producing economically valuable wood. They are typically native to eastern Asia but have been introduced to all of the Pacific Islands (Seelenfreund et al., 2011). Currently, there are five recognized species in this genus (Wang, Huang & Qin, 2012; Chung et al., 2017). Of these five, Broussonetia papyrifera L. is a pioneer species with strong stress tolerance. It usually grows on arid hillsides, in valleys, and on roadsides. The bark of B. papyrifera can be used to make textiles and high-grade paper, hence its common name “paper mulberry”. In 2019, the complete nuclear genome of B. papyrifera was sequenced and the genetic basis for its adaptability in paper-making, animal feed, and medicine was revealed (Peng et al., 2019). Broussonetia kazinoki Sieb. and Broussonetia kaempferi Sieb. are both shrubs. Together with B. papyrifera, all three species belong to the tribe Broussonetieae Gaud (Zhang & Cao, 1998). Their leaf, bark, fruit, and latex can be used as raw materials for medicines (Cao et al., 2020).
An artificial, interspecific hybrid (hybrid paper mulberry) was crossbred between B. kazinoki and B. papyrifera. The leaves of the resulting plant are widely used as fodder because they are rich in protein (Si et al., 2018). The hybridization of Broussonetia may occur rarely in nature. B. × kazinoki is a natural hybridization between Broussonetia monoica Hance (synonym: B. kazinoki) and B. papyrifera, is known as “kōzo” in Japan and “daknamu” in Korea, and it is used as the main material for making traditional paper (Kuo et al., 2022).
The distribution of B. papyrifera is thought to be related to human migration throughout history (Payacan et al., 2017). A tree native to South China and Southeast Asia, B. papyrifera, was brought to Polynesia by Austronesian-speaking travelers as a source of bark fiber. It is now distributed as far as Easter Island and is now homogeneous in the Pacific, representing a rich germplasm resource (Chang et al., 2015). B. papyrifera also shows dispersal patterns across the vast Pacific region on the basis of ribosomal RNA sequences and inter-simple sequence repeat (ISSR) markers. These findings are in agreement with current archaeological evidence (Matisoo-Smith, 2015).
The chloroplast (cp) is an important organelle found in green plant cells with approximately 10,000 DNA copies per leaf cell (Bendich, 1987). The sequence of the cp genome is an appropriate molecular marker for plants, being restricted to both lower and higher plants. Recently, genes or inter-gene spacers in the cp genome have been used in plant molecular systematic studies (Wu et al., 2018; Li et al., 2020; Li et al., 2021). Next-generation sequencing (NGS) may significantly reduce the time and cost of obtaining abundant nucleotide sequences. Approximately five percent of the reads obtained by NGS of plant species are derived from the chloroplast, which is perfectly amenable to cp genome assembly (Bakker et al., 2016). To-date, a total of 117 cp genomes from 71 species of Moraceae have been sequenced.
The cp genomes of six species of the Broussonetia alliance were assembled and used to identify the origin of B. × kazinoki and to re-examine the taxonomic proposition of the Broussonetia alliance (Kuo et al., 2022). The current research on the cp genome of the hybrid paper mulberry supports a close genetic relationship with B. kazinoki and the maternal genetics of the cp genome (Zhang et al., 2022). Our research reports on the sequencing information and characterizations of the complete cp genomes of B. papyrifera, B. kazinoki, and B. kaempferi, which are all Broussonetia species found on the Chinese mainland (Zheng et al., 2002). We also analyzed the phylogenetic relationships, differentiation times, codon usage pattern, and natural selection pressures within the Moraceae family. This information may be helpful to better understand the evolutionary history and driving forces of the Moraceae.
Materials & Methods
Sample collection, DNA extraction, and genome sequencing
Fresh leaves of B. papyrifera and B. kazinoki were sampled from a single plant of each species growing in Ankang (108°58′55′E, 32°41′50′N), Shaanxi Province, China, on September, 2015. The fresh leaves of B. kaempferi were sampled from a single tree growing in Liuzhou (109°26′59′E, 24°17′12′N), Guangxi Province, China, on April, 2017. The voucher specimens of the three species were planted in the Sericultural Research Base of Ankang University (Fig. 1).
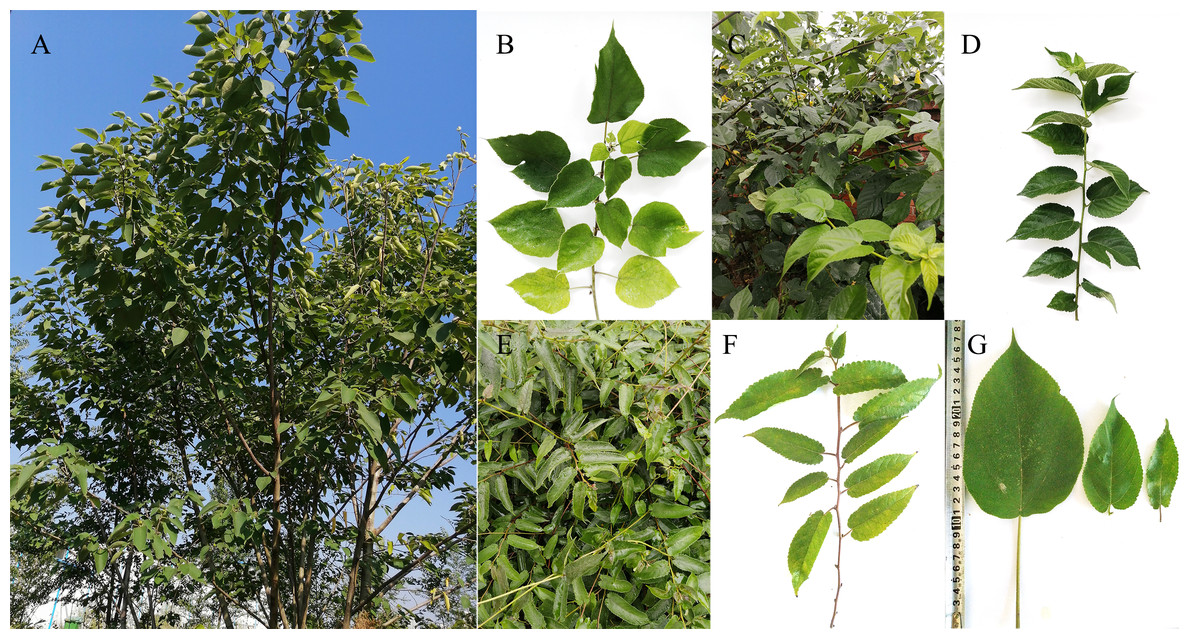
Figure 1: Morphology of three Broussonetia species.
(A, B) Plant and branch of B. papyrifera. (C, D) Plant and branch of B. Kazinoki. (E, F) Plant and branch of B. kaempferi. (G) Leaf morphology of three Broussonetia species.
A modified high-salt method was used to extract the genomic DNA from the leaves (Shi et al., 2012). The resulting genomic DNA was then fragmented and indexed by barcoding. The paired-end libraries, with an insert size of ∼350 bp, were then constructed in accordance with the standard Illumina protocol and the sequencing was carried out on the HiSeq 2000 platform with 125-bp paired-end reads (Illumina Inc., San Diego, CA, USA).
Genome assembly and annotation
The chloroplast reads were isolated from the raw reads using the bowtie2 software (Langmead & Salzberg, 2012) with a very sensitive local model and cp genome of Ficus racemosa L. (Mao & Bi, 2016) used as a reference. The resulting reads were assembled using SOAPdenovo2 with Kmer = 63 (Luo et al., 2012). Then, all of the contigs were mapped to the reference cp genome using BLAT (Kent, 2002) to identify their position and direction. Sequences with ambiguous alignment were trimmed manually and were regarded as gaps. The gaps were filled by the consensus sequence, which was generated with the model implemented in MAQ software (Li, Ruan & Durbin, 2008). The process was repeated until the reference genome was fully supported. SAMtools (Li et al., 2009) was used to parse the depth of assembly sequences.
The preliminary annotations of B. papyrifera, B. kazinoki, and B. kaempferi cp genomes were performed using the online automatic annotator, DOGMA (Wyman, Jansen & Boore, 2004). The protein coding genes (PCGs) and rRNA genes were then verified using BLASTN searches (e-value cutoff = 1e−10) against other Moraceae family cp genomes to ensure accurate annotations (Chen et al., 2015). The start and stop codons, or intron and exon junctions, of each annotated PCG were manually compared with the cp genomes of F. racemosa and Morus mongolica Schn. using the check_annotations.py module (Jin et al., 2020). The tRNA genes were confirmed using tRNAscan-SE 1.21, which specified that mitochondrial/cp DNA was the source (Schattner, Brooks & Lowe, 2005).
The analysis of RPL22 deficiency or transfer in genus Broussonetia
The primers, F22 (5′-GCAAACCAAAGAGAATGATGAC-3′), and R22 (5′-CGAGCGTCTACCATTATACCTAC-3′), were designed for the amplification of the RPS3–RPS19 region, including the inter-genic (IG) regions of RPS3–RPL22 and RPL22–RPL19, and the RPL22 gene. They were used to identify RPL22 gene deficiency in the cp genome. The PCR amplifications of the RPS3–RPS19 region were carried out with the genomic DNA of B. papyrifera, B. kaempferi, and B. kazinoki, as templates. The RPS3–RPS19 region of hybrid B. kazinoki × B. papyrifera, and M. mongolica were amplified at the same time. The PCR products were then cloned and sequenced. The resulting sequences were then aligned using ClustalX1.83 software (Thompson et al., 1997), and the corresponding results were adjusted manually according to the RPS3, RPL22, and RPS19 gene borders.
The primers, rpl22f (5′-ATAACCCCGTCCTCGAGCTT-3′) and rpl22r (5′-AGAAGAGAAGGACCAAGCGA-3′), were designed inside the RPL22 gene, according to F. racemosa and M. mongolica, and were used to identify whether the RPL22 gene was transferred to the nuclear genome. The RPL22 genes of M. mongolica were amplified simultaneously as a control. The amino acid sequence of RPL22 from F. racemosa and M. mongolica were subjected to TBLASTN analysis of the whole-genome sequence of B. papyrifera and the raw data (Gertz et al., 2006).
Phylogenetic analysis
To illustrate the phylogenetic relationships among members of the family Moraceae, 32 complete cp genomes were downloaded from GenBank (Table S1). Three species Rosa chinensis Jacq., Rosa minutifolia Engelm. and Rosa rugosa Thunb. from the family Rosaceae were used as the outgroups. The sequences of 66 PCGs present in all the 38 species (35 plus three outgroup species) were extracted using Python 3.6. Then, each of the 66 PCGs were aligned, accounting for frame shifts and stop codons, by MACSE with default settings (Ranwez et al., 2018). Phylogenetic analyses were performed using the concatenated nucleotide sequences by both the Maximum-Likelihood (ML) and Bayesian Inference (BI) methods. The generalized time reversible (GTR) with invariable sites (+I) discrete gamma (+G) model was selected by model test applying the Akaike information criterion (AIC) and Bayesian information criterion (BIC) using jModelTest (Darriba et al., 2012). ML phylogenies were inferred using RAxML 8.2.12 software, the bootstrap analysis was performed with 1,000 replications (Stamatakis, 2014). BI phylogenies were inferred using MrBayes 3.2.7 (Ronquist et al., 2012), with Markov chain Monte Carlo (MCMC) algorithm of 1,000,000 generations, sampled every 1,000 generations until convergence. The first 25% of the trees were discarded as burn-in, while the remaining trees were used to generate the consensus tree.
Divergence time estimation
The RAxML tree and software MCMCTREE of PAML (Phylogenetic Analysis of Maximum Likelihood) (version 4.9j) was used for divergence time analysis (Yang, 2007). We estimated the divergence time under the relaxed clock and the Hasegawa-Kishino-Yano 1985 (HKY85) nucleotide substitution model. The nucleotide substitution rate was set as (r = 1. 368 ×10−9, rgene gamma =2, 14.6, 1) gamma distribution (Muse, 2000; Xu et al., 2012). The two primary calibration points in our analyses were: (1) the divergence between the Moraceae and the Rosaceae, 42–161 million years ago (Mya), according to http://www.timetree.org; and (2) the divergence between Morus alba L. and Morus notabilis Schn., 6–17 Mya, based on genome sequence estimates (Jiao et al., 2020).
The MCMC method was run for 2,000 generations as burn-in, then sampled every ten generations until a total of 20,000 samples had been generated. Convergence at each node was determined using Tracer v1.7 by confirming the effective sample sizes (ESS) above 200, with the 95% highest probability density (HPD) accepted (Rambaut et al., 2018).
Natural selection event analysis
The natural selection events can be measured by non-synonymous substitutions (dN) and synonymous substitutions (dS). The observation dN >dS suggest positive selection, otherwise it will be negative selection. The value of dN/dS was calculated by two methods: (1) using HyPhy 2.2.4 software, the unrooted phylogenetic tree, the Branch-site model, and the Muse-Gaut 1994 (MG94) codon substitution model (Pond, Frost & Muse, 2005); and (2) using program CodeML in PAML and the pairwise comparison matrix of 35 concatenated nucleotide sequences (Yang, 2007).
PCG divergence and indices of codon usage
The analysis for the sequence divergence (pi) of each PCG among the 35 cp genomes was conducted using DnaSP v6 software (Rozas et al., 2017). The amino acid composition and relative synonymous codon usage (RSCU) values were calculated using Mega 11 (Tamura, Stecher & Kumar, 2021). The effective number of codons (ENc) is widely used as a measure of codon usage bias (CUB). GC3S indicated the GC content at the third synonymously-variable coding position and excluded Met, Trp, and the three stop codons, which are indicators of the level of nucleotide composition bias (Wright, 1990; Ahmad et al., 2013). ENc-plot (ENc vs GC3S) is a useful indicator of the factors affecting codon usage (Comeron & Aguadé, 1998; Peden, 1999). The values of ENc and GC3S were calculated using the CodonW program in the Mobyle server (https://mobyle.rpbs.univ-paris-diderot.fr/cgi-bin/portal.py#welcome). The values of GC12 (the GC contents at the first and second positions) and GC3 (GC contents at the third position) were also obtained by this method.
Results
Genome assembly and features
The mean depth of the final assembled B. papyrifera, B. kazinoki, and B. kaempferi cp genomes were approximately 484.2-fold, 295.1-fold, and 608.2-fold, respectively (Table S2). Their lengths were 160,239 bp, 160,841 bp, and 160,592 bp, respectively (Table 1). The lengths were all shorter than those of Broussonetia kurzii Hook and Broussonetia luzonica Blanco, but longer than those of the genus Morus. All three cp genomes had the quadripartite structures typical of land plants, including a large single-copy (LSC) region, a small single-copy (SSC) region, and two inverted-repeat (IR) regions.
| Attribute | B. papyrifera | B. kazinoki | B. kaempferi | B.luzonica | B. kurzii |
|---|---|---|---|---|---|
| Genome size/GC content | 160,239/35.83 | 160,841/35.73 | 160,592/35.64 | 162594/35.66 | 162170/35.66 |
| LSC size/ GC content | 88,622/33.5 | 89,066/33.34 | 89,001/33.22 | 89980/33.29 | 90174/33.24 |
| SSC size/ GC content | 19,919/28.5 | 20,093/28.47 | 19,997/28.3 | 19560/28.52 | 20150/28.51 |
| IR size/ GC content | 25,849/42.66 | 25,841/42.68 | 25,797/42.67 | 2652742.32 | 25923/42.66 |
The GC contents of B. papyrifera, B. kazinoki, and B. kaempferi were 35.83%, 35.73%, and 35.64%, respectively. As with other members of the Moraceae, the GC content distribution of the three Broussonetia cp genomes was also uneven, being highest in the IR region, intermediate in the LSC region, and lowest in the SSC region (Table 1).
Overall, 131 genes were found in each of the three Broussonetia cp genomes, namely 86 PCGs, 36 tRNAs, and eight rRNAs (Table S3), arranged in the same linear order as in other species of the Moraceae, except for gene RPL22, which was absent from the three Broussonetia cp genomes (Fig. 2). Of all these genes, seven PCGs, seven tRNAs, and four rRNAs were duplicated in the IR regions. Additionally, ten PCGs (atpF, ndhA, ndhB, petB, petD, RPL2, RPL16, rpoC1, RPS16, and ycf68) and six tRNAs (trnI-GAU, trnG-UCC, trnK-UUU, trnL-UAA, trnV-UAC, and trnA-UGC) contained one intron, whereas three PCGs (RPS12, ycf3, and clpP) had two introns (Table S3).
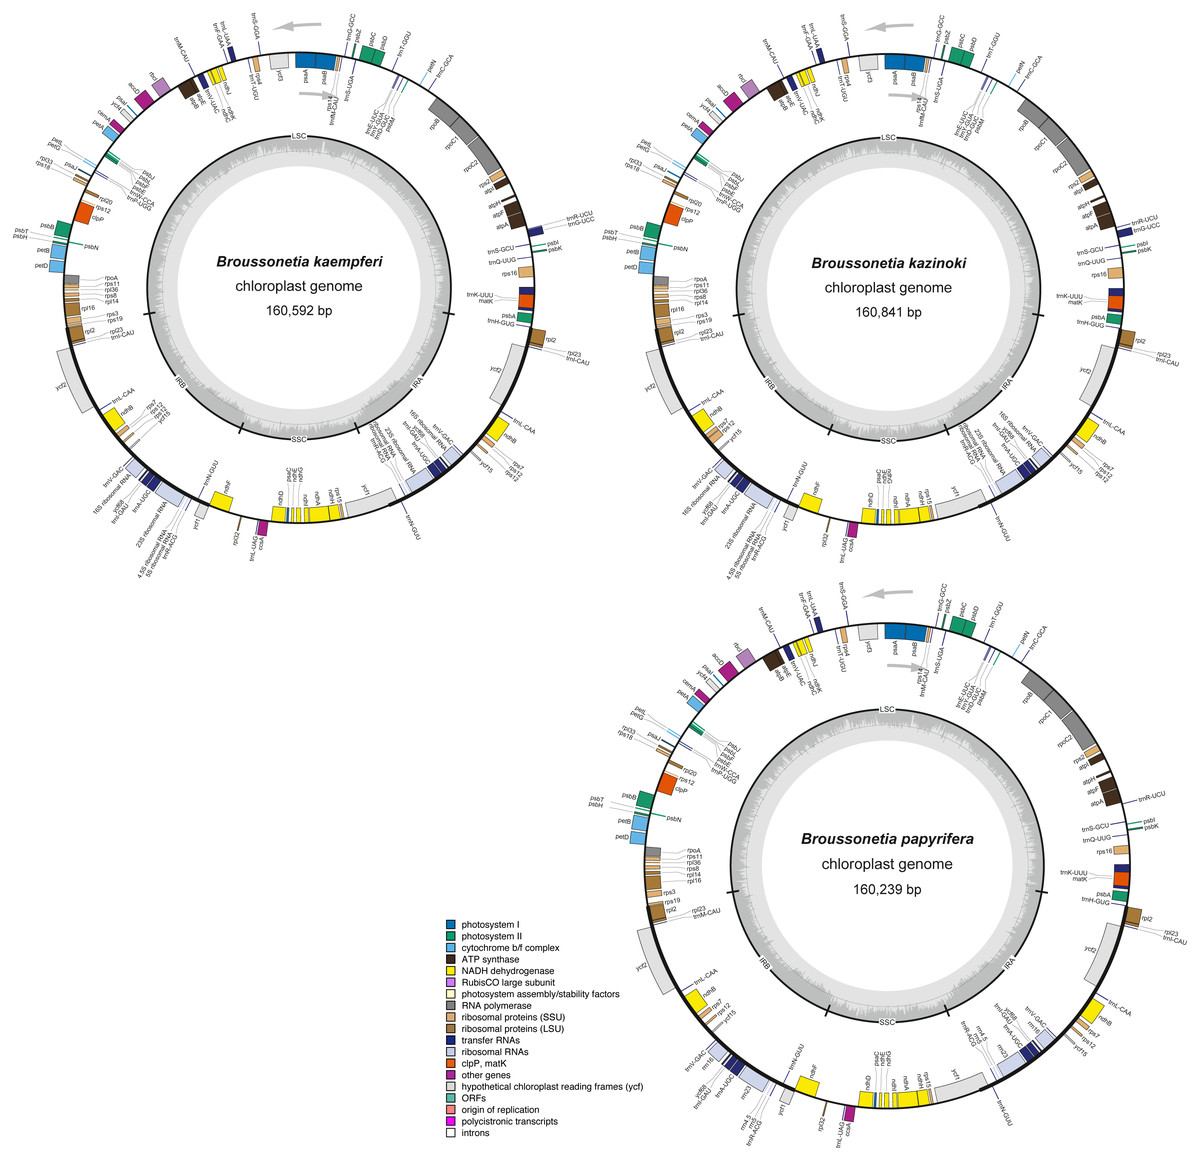
Figure 2: The cp genome structure of three Broussonetia species.
The colored bars indicate different functional groups. The dark gray inner circle corresponds to GC content, the light-gray to AT content. All three genomes were composed by the large single copy regions (LSC), small single copy regions (SSC) and the inverted repeat regions of IRA and IRB. Genes drawn inside and outside the circle are transcribed clockwise and counter-clockwise, respectively.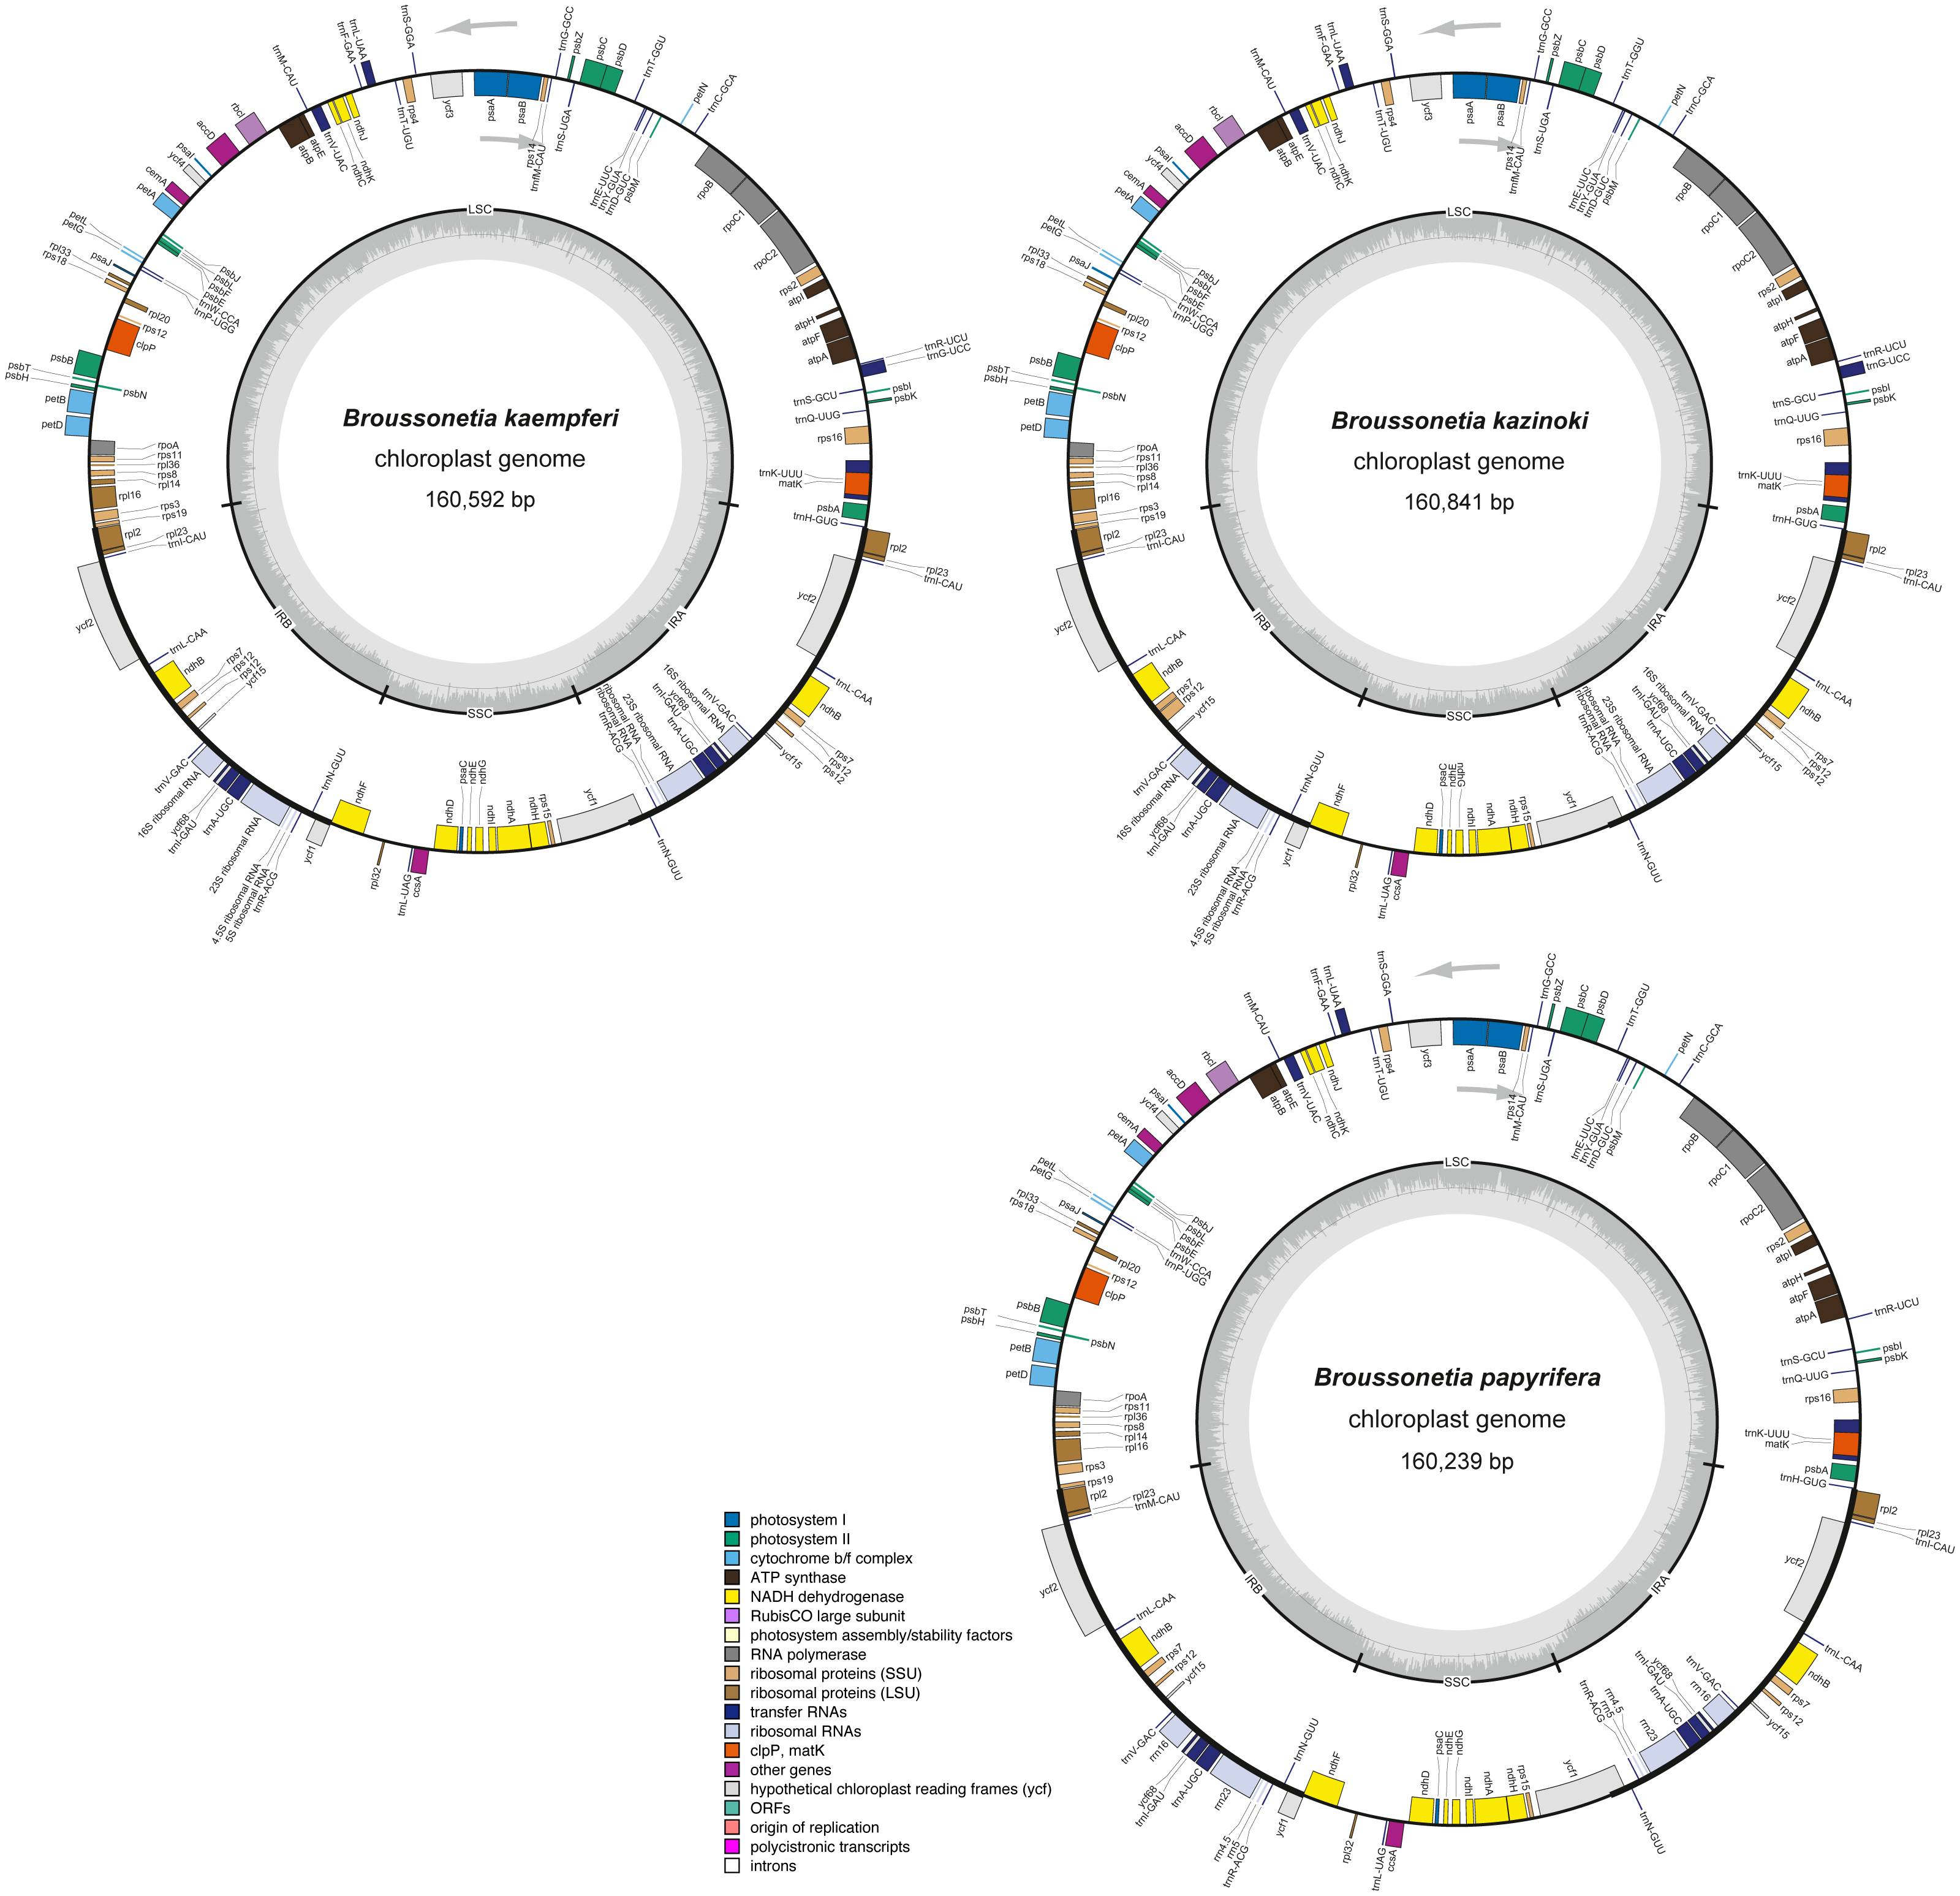
The absence of the RPL22 gene from the genus Broussonetia
Agarose gel electrophoresis showed that the PCR amplification products of the F22 and R22 primers were different lengths (Fig. 3A). The sequences of the clones were the same as those in the HiSeq 2000 platform, which confirmed that the RPL22 gene is a truncated pseudogene in B. papyrifera and was lost in B.kaempferi, B.kazinoki, and the hybrid B. kazinoki × B. papyrifera chloroplast genome (Fig. 3B).
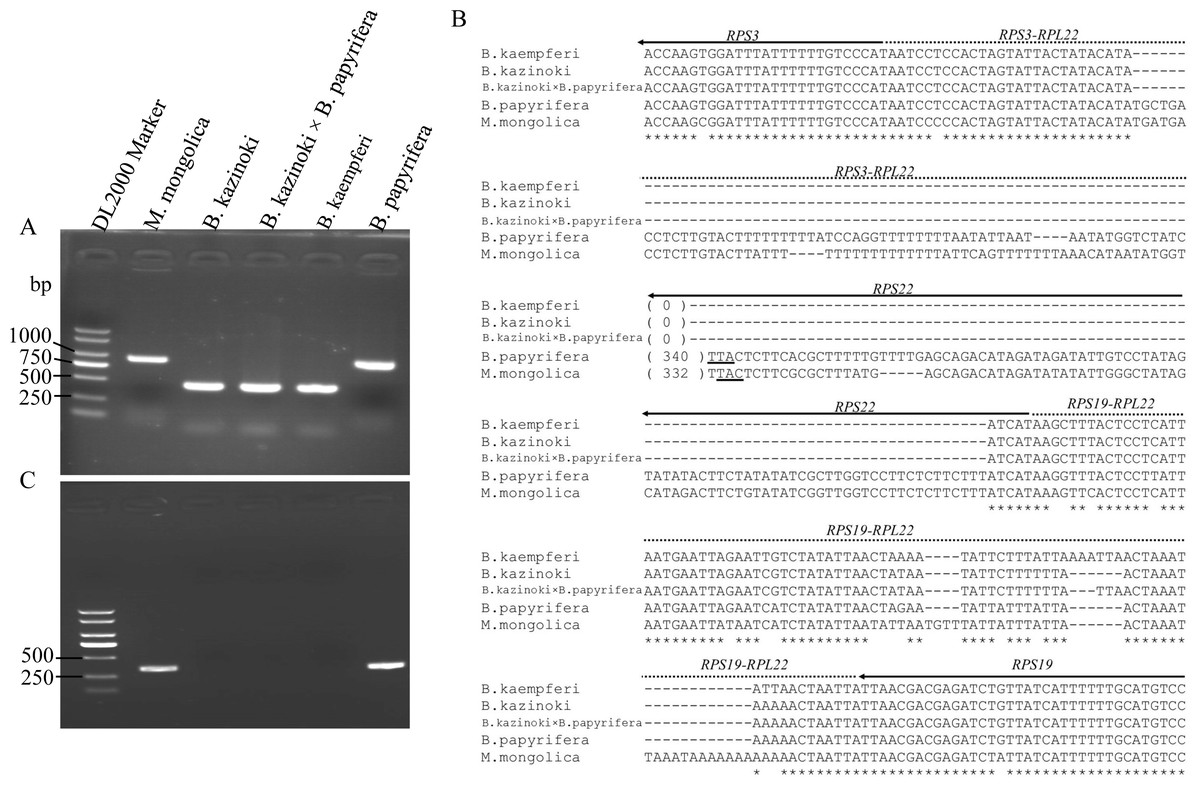
Figure 3: The detection and analysis of Broussonetia RPL22 gene.
(A) PCR amplification of the RPS3–RPS19 region. (B) The alignment analysis of RPS3–RPS19 region, the arrow indicated the direction of gene transcribed, the underlined TTA indicated the stop codon. (C) PCR amplification of the RPL22 region.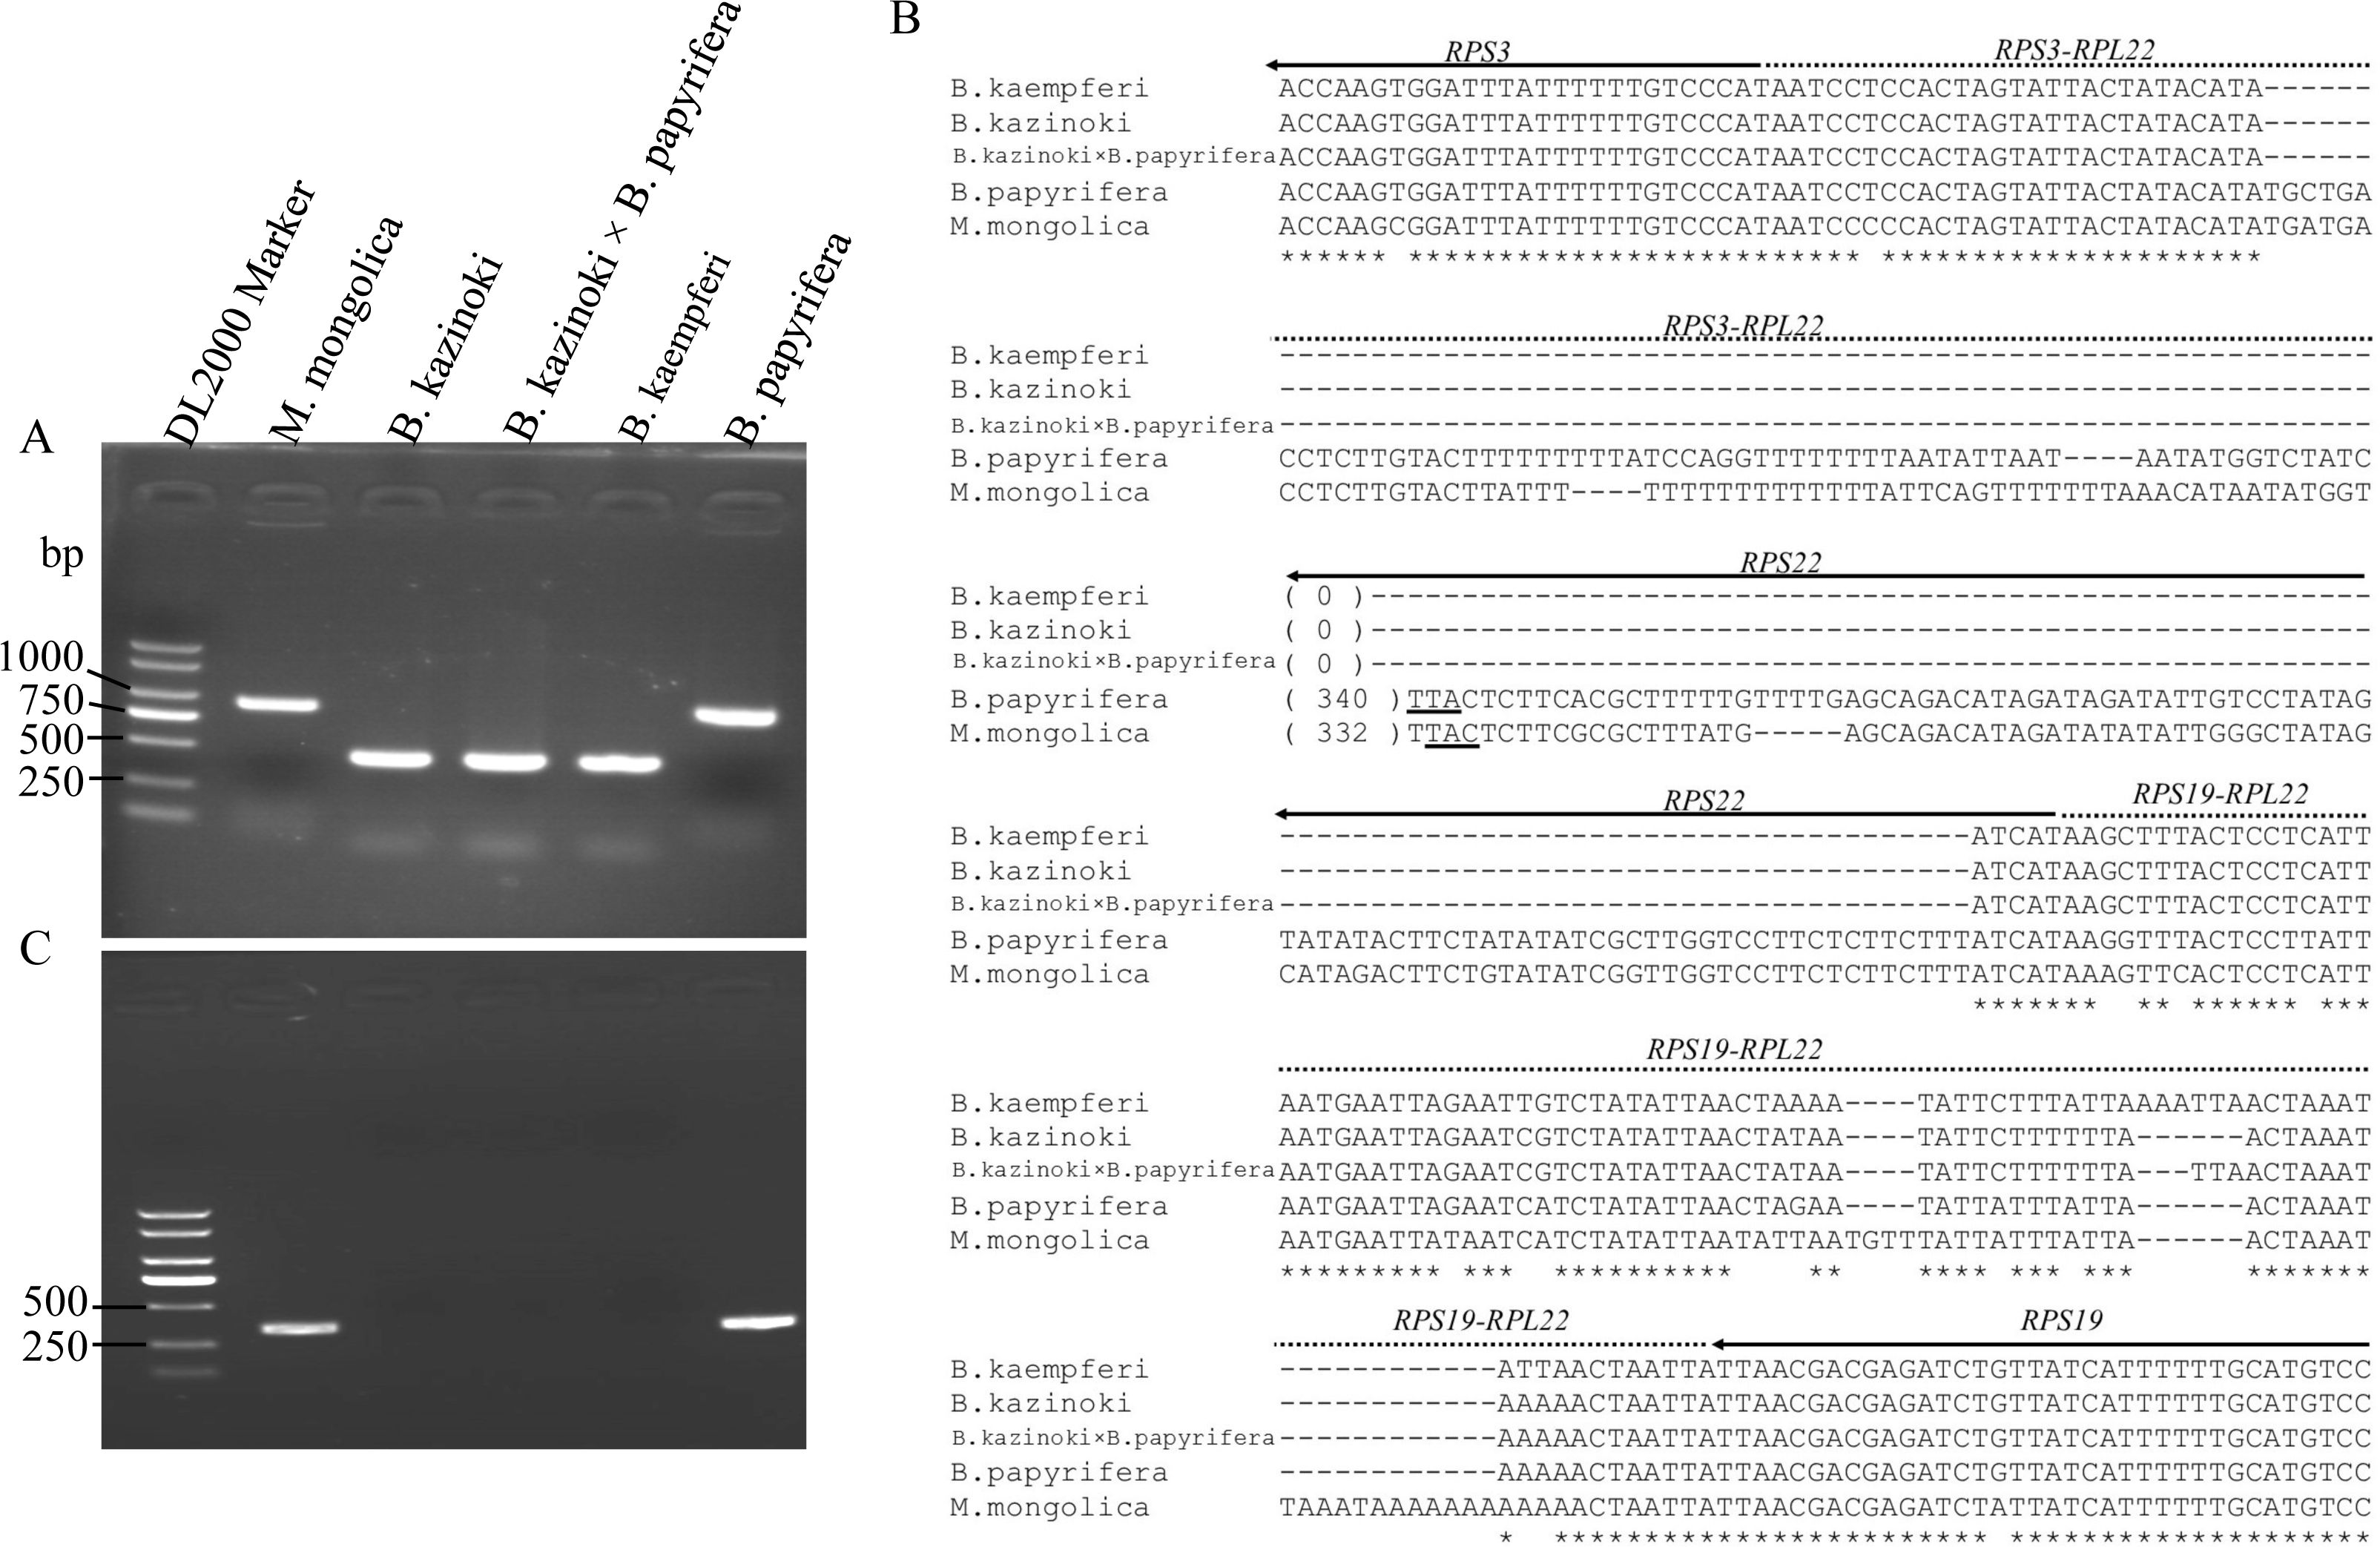
The PCR amplification products of the rpl22f and rpl22r primers contained no expected products, indicating that there was no transfer of RPL22 in B. papyrifera, B. kaempferi, B. kazinoki, and hybrid B. kazinoki × B. papyrifera (Fig. 3C). The results of TBLASTN analysis showed that no RPL22 gene was detected in the B. papyrifera genome, too. Also, further gene content analysis showed that RPL22 gene is lacked in other two Broussonetia plants (B. luzonica and B. kurzii), and Malaisia scandens Lour., a plant of genus Malaisia family Moraceae.
Phylogenetic and molecular dating analysis
The concatenated sequence, including 66 PCGs that were 56,217 bp in length and had 6,847 diverse loci, was used to construct the phylogenetic tree. Both ML and BI phylogenetic trees had two clades: clade 1 included Morus and Artocarpus, whereas clade 2 included the other seven genera. The three Broussonetia species in this study were clustered into one branch, and M. scandens was aggregated within this branch. B. luzonica and B. kurzii were present in the sister branch (Fig. 4). The genus Broussonetia was the earlier diverging lineage than the genera Ficus, Trophis and Antiaris, later than genus Streblus. Fifteen genes (infA, psbL, ycf3, clpP, ndhF, ycf1, RPS2, RPL16, RPL32, RPS3, RPL22, ndhA, cemA, ycf68, and ycf15) were lost to differing degrees from the 35 cp genomes (Fig. 4).
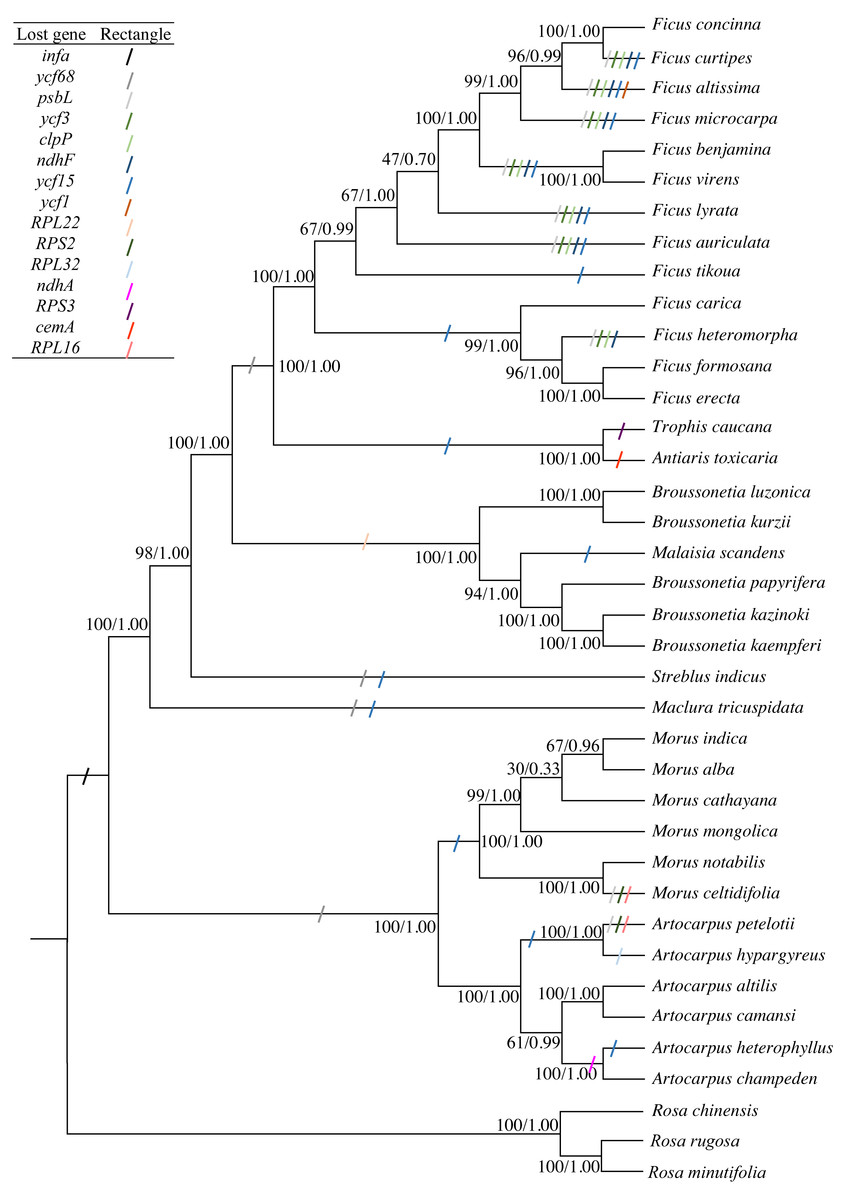
Figure 4: Phylogenetic trees constructed by maximum-likelihood (ML) and Bayesian inference (BI) methods.
Three Rosa species were used as the outgroups. Numbers (before/after) near the nodes indicate ML bootstrap support and Bayesian posterior probability values. Colored rectangles indicate the putative gene losses.
The likelihood of the best-scored ML tree was 137,376 and the bootstrap support values in all the nodes between the genera were greater than 90%, reaching 100% in five cases (Fig. 4). At the species level, the values at the partial nodes (six out of 35) were less than 90%, especially in the species of genus Morus. The values at the nodes of (Morus cathayana Hemsl. (M. alba, Morus indica L.)) were 30 and 67, respectively. The BI tree showed similar topologies with the ML tree. The three clades of M. cathayana, (M. alba, Morus indica) and M. mongolica in the BI tree could not be effectively distinguish (Fig. 4), which may be caused by the interspecific free hybridization within the genus Morus.
We further evaluated the molecular clock based on the phylogenetic tree, HKY85 nucleotide substitution, and two calibration points, 42–161 Mya for the divergence between the Moraceae and the Rosaceae and 6–17 Mya for the divergence between M. alba and M. notabilis. The mean and 95% highest posterior density (HPD) divergence times were mapped onto the phylogenetic tree. The common ancestor of Moraceae occurred before 52.74 Mya, whereas divergence between genus took place within the range of 33.01–50.10 Mya among the genera. The divergence of Broussonetia took place around 26.11 Mya. This was much earlier than the divergence of Morus, Artocarpus, and Ficus, which diverged approximately 5.50–19.98 Mya (Fig. 5).
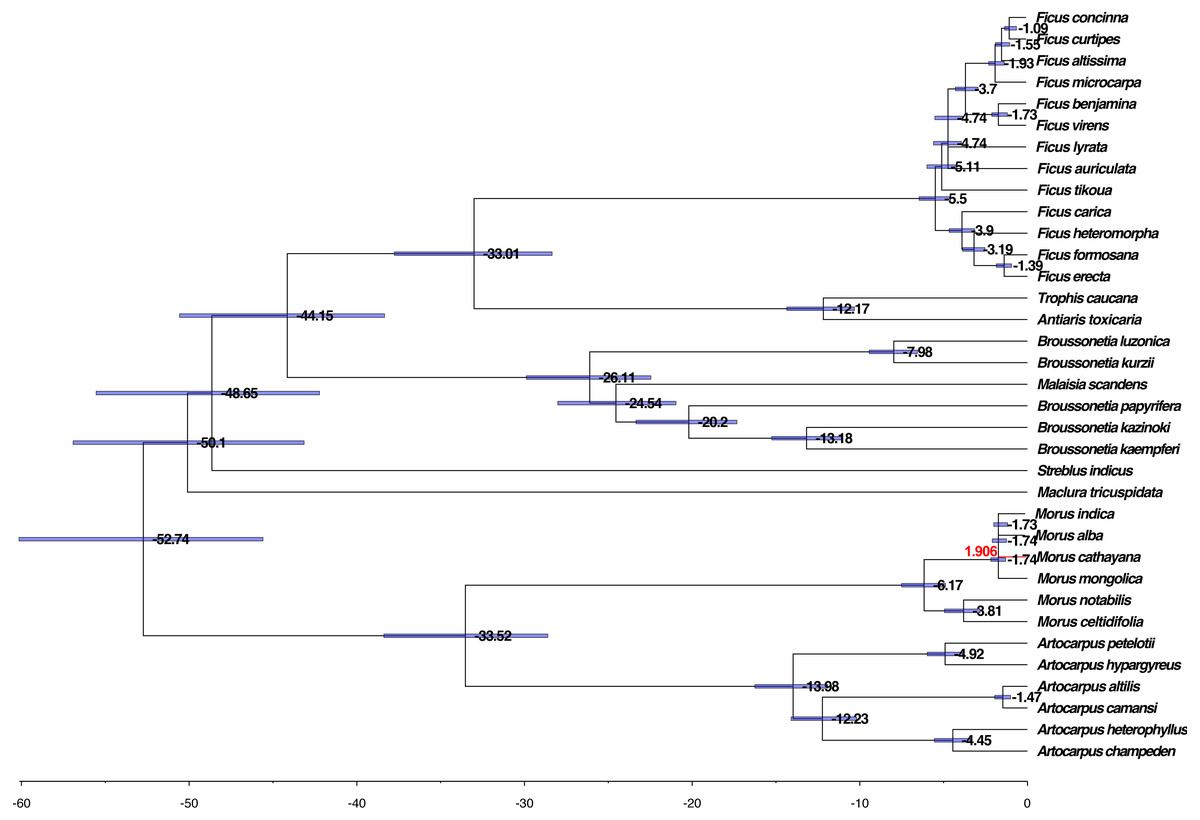
Figure 5: Phylogenomic analysis of the divergence time and natural selection.
The branch lengths are proportional to the estimated times. Numbers denoted at each node are inferred divergence times (million years). Blue bars are 95% highest probability density (HPD) accepted. The red branch line indicates dN/dS >1.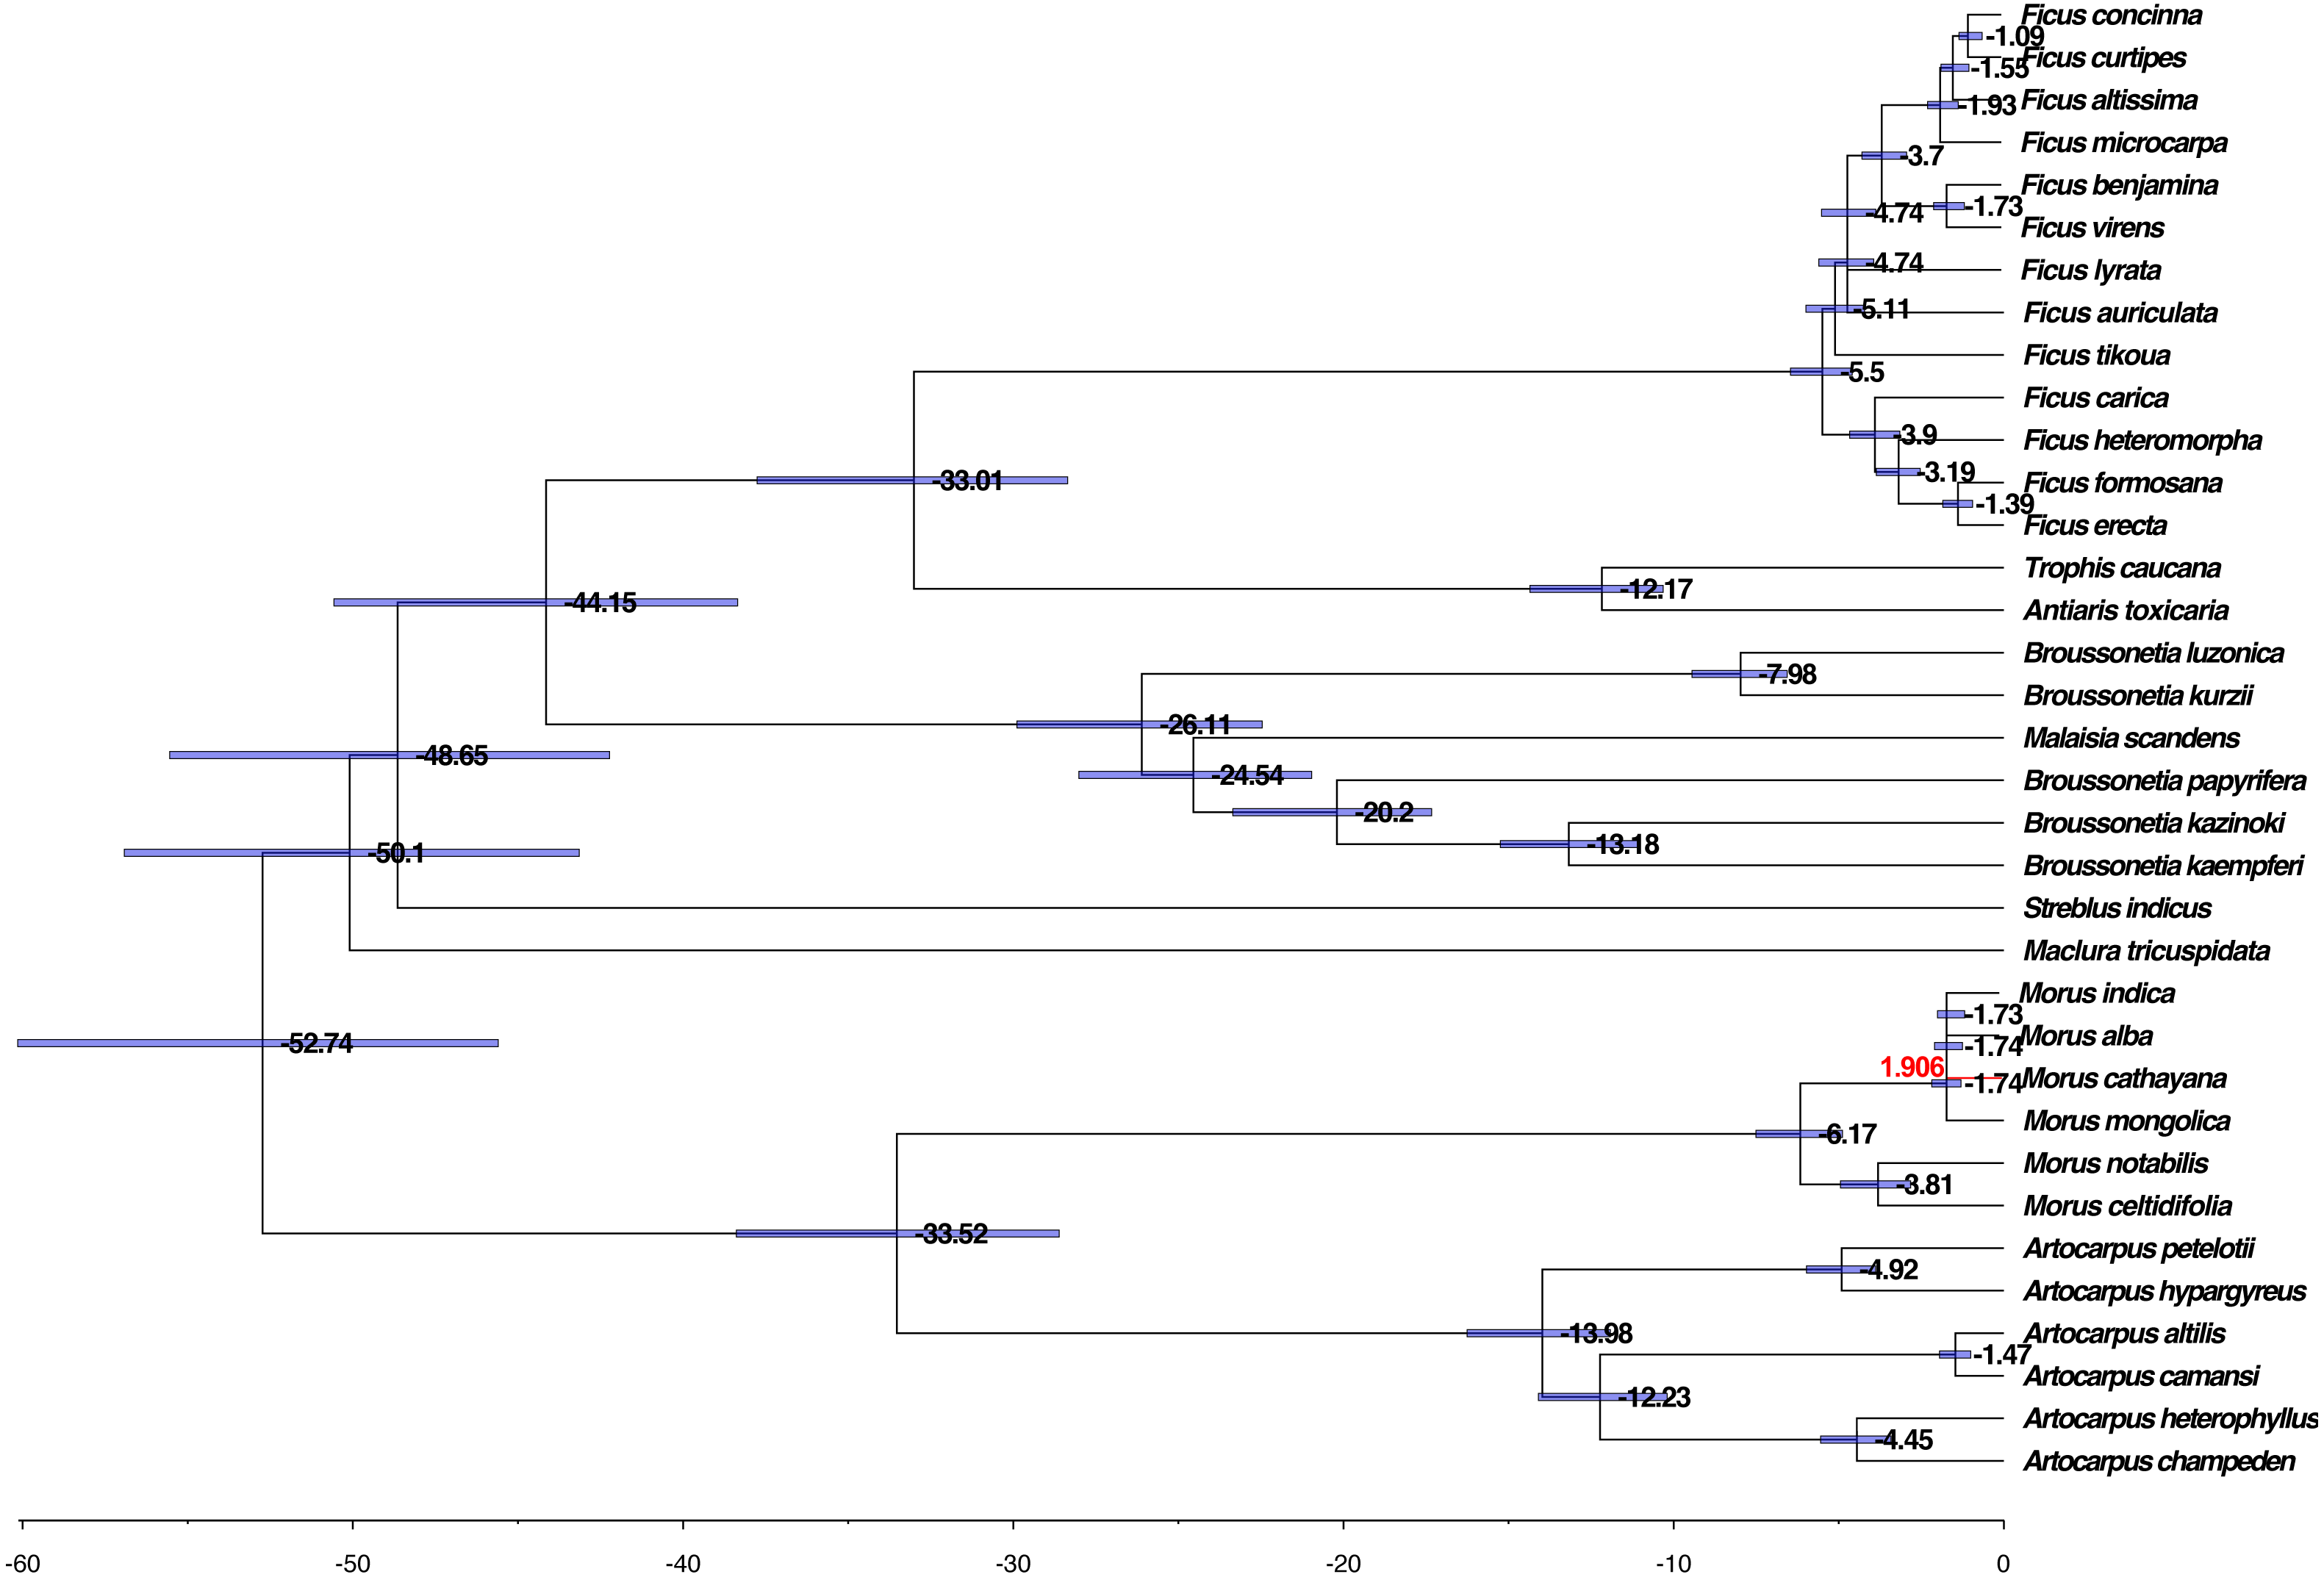
Natural selection event analysis
The dN/dS ratios of all branches and species calculated using the unrooted tree were less than one except for M. cathayana, a wild mulberry species unique to China, which had a ratio of 1.906 (Fig. 5). The dN/dS ratios based on the pairwise comparison matrix of concatenated nucleotide sequences showed that the highest average value for any genus was 0.519 for Morus, compared with 0.229 for Broussonetia, 0.241 for Ficus, and 0.413 for Artocarpus (Tables S4 –S7). The ratio between M. cathayana and M. mongolica was 2.705 (Table S4), which was the highest ratio occurring in the genus Morus.
PCG divergence and indices of codon usage
The analysis of sequence divergence among the PCGs of the 35 cp genomes showed that the pi values were in the range of 0.0005 (psbF)-−0.0419 (RPS16) with a mean of 0.0174, indicating small differences among the PCGs. The pi values of PCGs in the SSC region were all greater than 0.01, with a mean of 0.0226, which was much higher than those in the IR regions, all of which were below 0.01 (Fig. S1).
A total of 26,288–26,306 codons were identified in the cp genome of three Broussonetia species; these were used in RSCU analysis. The results showed that the most commonly used codons consisted of mostly A and U (i.e., AUU for Ile, AAA for Lys, UUU for Phe, and AAU for Asn). The codons that were infrequently used consisted of more G and C (i.e., GGC for Gly, CGC and CGG for Arg, CUG and CUC for Leu, GCG for Ala, and CCG for Pro). In addition, there were 30 codons with RSCU >1; among them, 29 codons ended with A or U and one codon (UUG for Leu, 1.20–1.21) ended with G (Table S8).
The distribution of the average ENc values of the PCGs in this study was 25.6 (RPL36)–61.0 (psbF). The distribution of the average GC3S value was 12.10%–34.14%. The distribution of the majority of the genes in the ENc-plots fell on or near the trend line, except for psbF (ENc =61), which was above the curve. In addition, some genes (petN, psbI, psbJ, RPL33, and RPL36) fell far below the expected line, suggesting that the codon usage bias could be affected by many factors (Fig. 6).
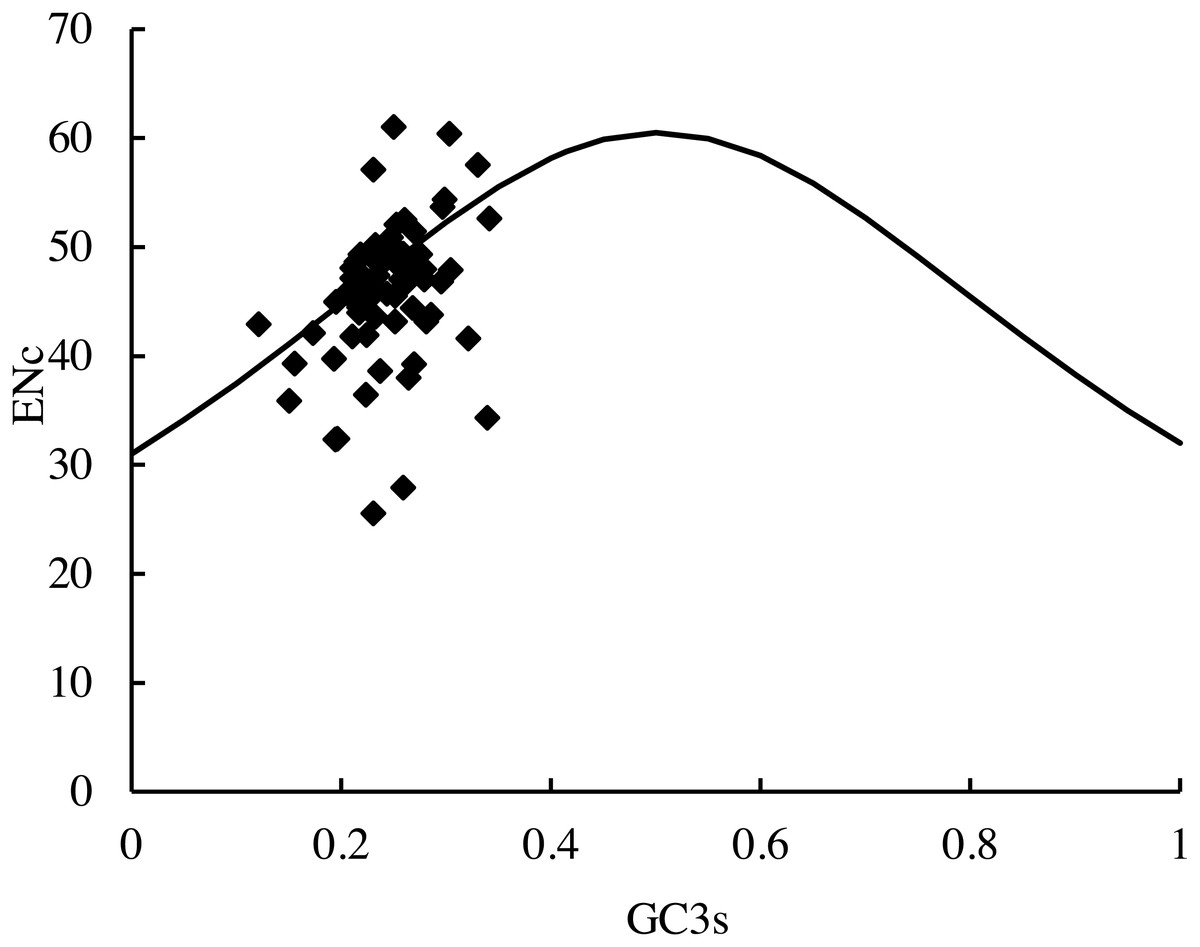
Figure 6: ENc-plots (ENc vs GC3S) of 66 protein-coding genes (PCGs).
Solid lines are expected ENc from GC3S.
Further analysis of the base composition showed that the distribution of the average GC content for GC12 was 33.55%–56.08%, and for GC3 was 14.32%–36.73%. The distribution range for each was relatively narrow. The neutrality plots of GC12 versus GC3 for the 35 species showed that the distributions of the genes deviated from the diagonal line (slopes = 1) and the slopes of the trend lines ranged from 0.036 to 0.171. The correlation coefficient ranged from 0.032 to 0.151 (Table 2), which indicated that there were no correlations between GC12 and GC3 for the genes.
| Species | Slope | Intercept | Relative index | Species | Slope | Intercept | Relative index |
|---|---|---|---|---|---|---|---|
| Antiaris toxicaria | 0.108 | 0.399 | 0.101 | Ficus erecta | 0.070 | 0.408 | 0.063 |
| Artocarpus altilis | 0.131 | 0.391 | 0.107 | Ficus formosana | 0.073 | 0.408 | 0.065 |
| Artocarpus camansi | 0.138 | 0.389 | 0.113 | Ficus heteromorpha | 0.069 | 0.409 | 0.063 |
| Artocarpus champeden | 0.131 | 0.392 | 0.110 | Ficus lyrata | 0.048 | 0.415 | 0.043 |
| Artocarpus heterophyllus | 0.093 | 0.403 | 0.079 | Ficus microcarpa | 0.062 | 0.410 | 0.056 |
| Artocarpus hypargyreus | 0.060 | 0.413 | 0.052 | Ficus tikoua | 0.083 | 0.405 | 0.075 |
| Artocarpus petelotii | 0.036 | 0.420 | 0.032 | Ficus virens | 0.076 | 0.407 | 0.067 |
| Broussonetia kaempferi | 0.071 | 0.408 | 0.060 | Maclura tricuspidata | 0.171 | 0.382 | 0.151 |
| Broussonetia kazinoki | 0.048 | 0.415 | 0.041 | Malaisia scandens | 0.101 | 0.400 | 0.092 |
| Broussonetia kurzii | 0.047 | 0.415 | 0.045 | Morus alba | 0.104 | 0.400 | 0.092 |
| Broussonetia luzonica | 0.048 | 0.415 | 0.044 | Morus cathayana | 0.111 | 0.398 | 0.098 |
| Broussonetia papyrifera | 0.120 | 0.395 | 0.107 | Morus celtidifolia | 0.105 | 0.400 | 0.094 |
| Ficus altissima | 0.067 | 0.409 | 0.060 | Morus indica | 0.102 | 0.400 | 0.092 |
| Ficus auriculata | 0.070 | 0.408 | 0.063 | Morus mongolica | 0.106 | 0.400 | 0.094 |
| Ficus benjamina | 0.069 | 0.408 | 0.061 | Morus notabilis | 0.120 | 0.395 | 0.107 |
| Ficus carica | 0.089 | 0.403 | 0.080 | Streblus indicus | 0.123 | 0.394 | 0.101 |
| Ficus concinna | 0.083 | 0.405 | 0.074 | Trophis caucana | 0.145 | 0.389 | 0.138 |
| Ficus curtipes | 0.079 | 0.406 | 0.070 |
Discussion
We determined the complete cp genome of three Broussonetia species, and found the RPL22 gene was incomplete in, or completely missing from, the cp genome of all Broussonetia species. These results are consistent with those from Kuo et al. (2022). Moreover, the RPL22 gene was not transferred to the nuclear genome and may be used as a potential molecular marker to identity the Broussonetia alliance from the family Moracea. Some gene fragments were found to have been functionally transferred from chloroplasts to the nuclear genome, such as RPL22 of the legume pea, which was found to have been transferred to its nuclear genome (Gantt et al., 1991). In addition, nptII (an exogenous resistance gene integrated into the tobacco plastid), psbA of rice (Oryza sativa L.), and rpoA of the moss Physcomitrella patens Hedw., were all found to have been transferred from their cp genome to their nuclear genome (Yu et al., 1997; Cove, 2000; Huang, Ayliffe & Timmis, 2003; Stegemann & Bock, 2006). These proteins encoded by the now-nuclear genes were then transported to the cp to perform their functions (James, 2003).
The gene absent events of all the cp genomes used in this study were analyzed. A total of 15 genes were lost from the 35 Moraceae cp genomes to different degrees (Fig. 4). These results are consistent with the cp genome undergoing some changes (gene loss, transfer, rearrangement) over a long-term evolutionary process (Huang, Ayliffe & Timmis, 2003; Wang et al., 2018). The infA gene was lost many times (Millen et al., 2001), and was deleted from most of the Rosid cp genome during angiosperm evolution (Kong & Yang, 2016; Tao et al., 2017). As a result, the infA gene was lost from all 35 studied species. The psbL gene was lost from 12 of the species studied, including ten from the genus Ficus and each one from Morus and Artocarpus. The deletion of the ycf3, clpP, and ndhF genes was observed in eight species of the genus Ficus. There were up to five missing genes in Ficus altissima Bl.; the ycf1 gene was also considered. Ycf1, ycf2, RPL22, RPL23, and accD were also lost from some angiosperms (Jansen et al., 2007; Guisinger et al., 2010). The chloroplast genes could not be easily discarded in photosynthetic species and were functionally removed by some unknown mechanism. Therefore, further studies are needed to determine whether the absent genes may be transferred to the nuclear genome or functionally replaced by nuclear genes (Ueda et al., 2008).
The phylogenetic relationship among 35 Moraceae species was studied in this article. M. scandens, which had previously been identified as a species of Trophis or Caturus (Green, 1993), was clustered within the genus Broussonetia with a very high bootstrap value. This was consistent with earlier studies (Chung et al., 2017; Kuo et al., 2022). There may be two reasons for this situation. First, M. scandens should have been located within the genus Broussonetia and the deletion of the RPL22 gene from both Broussonetia spp. and M. scandens supports this view. Second, is related to the sample collection region (Fernández-Mazuecos & Vargas, 2010; Hazzi et al., 2018). The leaf samples of the three Broussonetia species in this study and M. scandens were all from the Chinese mainland, but the other two Broussonetia species (B. luzonica and B. kurzii) were sampled from Philippines and Thailand (Kuo et al., 2022).
The divergence of Broussonetia occurred long before that of the other three genera, which indicated that Broussonetia may exhibit more evolutionary differences in response to geographical distribution. The most common variant of B. papyrifera found in the Pacific region has a clear Taiwanese origin, and Taiwan harbored 19 haplotypes (total 48), of which 16 were endemic (Matisoo-Smith, 2015). In addition, the haplotype distribution based on ndhF-rpl32 sequence also showed high differentiation of B. monoica from different regions (Kuo et al., 2022). The results all provide strong evidence of the evolutionary history of the Broussonetia genus.
The dN/dS value can reflect natural selection events (Mugal, Wolf & Kai, 2014). The dN/dS ratios among Morus and Artocarpus are higher than for other Moraceae genera, which indicated that the clade of Morus and Artocarpus had undergone positive selection. This may have been caused by the artificial selection of mulberry trees for their use in raising silkworms. The results also showed that, at the whole-chloroplast protein level, purifying (negative) selection is the major strategy in use by the other genera (Hershberg & Petrov, 2008).
The CUB may be affected by many factors, such as DNA variation under natural selection, tRNA abundance, gene sequence length, GC content, and protein translation efficiency, etc (Qin et al., 2013). The study of CUB is not only helpful in explaining the evolutionary pattern among species, but also has great significance in terms of gene expression, vector construction, and the analysis of unknown functional genes. The RSCU value is frequently observed for a codon and divided by the expected frequency, which is an important index of CUB (Sharp & Li, 1986). The RSCU values in the three Broussonetia species exhibited similar preferences, which is consistent with previous studies, showing that closely related species generally have similar RSCU values (Athey et al., 2017; Zhang et al., 2017; Gao et al., 2018; Peng et al., 2020). Meanwhile, A/U ending codons were preferred with higher RSCU (>1) values, as observed in the cp genomes of other land plants (Asaf et al., 2018; Song et al., 2022). These results indicated that those codons are used more frequently than expected, which may be driven by the high A/U content of the cp genome (Zhou, Long & Li, 2008; Gao et al., 2018).
The Enc-plot is a useful tool for studying the factors affecting codon usage, such as mutation or natural selection (Liu, 2013). Most of the 66 genes from the cp genomes of the 35 species used in this article followed the trend line, which indicated that the characteristics of codon usage were random, showed a weak bias, and that the base composition bias on the 3rd codon was the main influencer of the CUB. These results are similar to the ENc plot of the Asteraceae family (Nie et al., 2014). Meanwhile, several genes fall far below the line in the plot, indicating that selection pressure can also influence codon usage (He et al., 2016).
GC12-GC3 is an indicator of the genomic trend of non-neutral mutational pressure in chloroplast codons; some research indicates that the factors influencing chloroplast codon biases are complex (Chen et al., 2004). The neutrality plot analysis showed that the correlation between GC12 and GC3 was weak, and the slopes of all the trend lines were less than 0.2. Therefore, the influence of mutation on the codons was very small, whereas other factors, such as natural selection, may have more effect on codon preference (Galtier et al., 2018). In summary, natural selection and gene base composition are the main factors affecting CUB; similar conclusions were also obtained in a study of mitochondrial codons, a finding which was consistent with the selection–mutation drift theory (Kawabe & Miyashita, 2003).
Conclusions
The complete chloroplast genomes of B. papyrifera, B. kazinoki, and B. kaempferi were 160,239 bp, 160,841 bp, and 160,592 bp in length, respectively. The RPL22 gene was incomplete or missing in Broussonetia. M. scandens was clustered within the genus Broussonetia, with very high bootstrap value. The indices of codon usage suggested that natural selection and gene base composition are the main factors affecting codon usage in the cp genomes of members of the family Moraceae, a finding which is consistent with the selection–mutation drift theory.
Supplemental Information
The nucleotide diversity (pi) values of the aligned 66 protein-coding genes (PCGs) within 35 Moraceae cp genomes
The genes from the inverted repeat regions (IR) are indicated by red, genes left and right of which are from large single copy regions (LSC) and small single copy regions (SSC), respectively.
The tre format file of Fig. 4 (Phylogenetic trees from maximum likelihood (ML) analyses of 35 species based on 66 protein-coding genes) is generated by RAxML
This file can be read by TreeGraph to draw phylogenetic trees.
The tre format file of Fig. 5 (Phylogenomic analysis of the divergence time and natural selection) is generated by PAML
This file can be read by FigTree to draw phylogenetic trees with divergence time.