
Identification of nutritional components in unripe and ripe Docynia delavayi (Franch.) Schneid fruit by widely targeted metabolomics
- Published
- Accepted
- Received
- Academic Editor
- Rogerio Sotelo-Mundo
- Subject Areas
- Agricultural Science, Biochemistry, Plant Science, Forestry
- Keywords
- Docynia delavayi (Franch), Metabolites, PCA, OPLS-DA, UPLC-MS/MS, KEGG
- Copyright
- © 2022 Chen et al.
- Licence
- This is an open access article distributed under the terms of the Creative Commons Attribution License, which permits unrestricted use, distribution, reproduction and adaptation in any medium and for any purpose provided that it is properly attributed. For attribution, the original author(s), title, publication source (PeerJ) and either DOI or URL of the article must be cited.
- Cite this article
- 2022. Identification of nutritional components in unripe and ripe Docynia delavayi (Franch.) Schneid fruit by widely targeted metabolomics. PeerJ 10:e14441 https://doi.org/10.7717/peerj.14441
Abstract
Docynia delavayi (Franch.) Schneid is an evergreen tree with multiple benefits and high development and utilization value. The fruit is consumed as fresh and dry fruit, juices, and other products. However, it is unknown the chemical changes that occur upon fruit maturation. The metabolite content of unripe and ripe fruit was examined using UPLC-MS/MS technology based on a broadly targeted metabolome. We identified 477 metabolites, of which 130 differed between ripe and unripe fruit. These compounds are primarily involved in the biosynthesis of secondary metabolites, such as pantothenic acid, flavonoids, and amino acids. Moreover, in ripe fruit, there are 94 metabolites that are upregulated, particularly flavonoids and terpenoids. In comparison, compounds associated with sour flavors (amino acids, phenolic acids, organic acids) are down-regulated. Remarkably, these metabolites have a strong relationship with the medicinal properties of D. delavayi. This study provides a global perspective of the D. delavayi fruit metabolome and a comprehensive analysis of metabolomic variations during fruit development, thereby increasing the knowledge of the metabolic basis of important fruit quality traits in D. delavayi fruit.
Introduction
Docynia delavayi (Franch.) Schneid (Rosacea), is widely known as Duo-Yi in China. In some provinces like Yunnan, Guizhou, and Sichuan, its planting concentrates in the valleys, creeks, and shrubs at an altitude ranging between 1,000 and 3,000 m (Ci et al., 2020). The flowering season of D. delavayi spans from March to April of the year, and the fruiting season lasts from September to December of the year (Su, 2019). D. delavayi as a sort of fruit has a distinctive taste, showing high nutritional and medicinal value. In southwest China, it is commonly applied for the treatment of digestive disorders and hypertension (Xukun et al., 2014). Fruit extracts are rich in secondary metabolites and natural active compounds, including flavonoids, dietary fiber, amino acids, terpenoids, and alkaloids (Mei et al., 2002). In light of the above, D. delavayi fruit immaculously satisfies the functional fruit requirements, thus is considered a desirable fruit.
As a crucial part of natural growth for plants, the development and ripening of fruit are not only regulated by internal genetic information but also affected by external factors (Ramos-Aguilar et al., 2021). During the course of ripening, the variations in sweetness, hardness, and colour are the significant influencing factors for fruit quality (Bapat et al., 2009). Thus, the research of fruit growth and ripening is needed to improve our understanding as to the formation of fruit mass in D. delavayi. Despite some research that has already been conducted on the fruit composition of D. delavayi (Lee, Mattheis & Rudell, 2012), it is focused mainly on some particular metabolites. Unripe D. delavayi and ripe D. delavayi differ in their nutrient metabolite profiles. For this reason, to better understand the difference between them, a systematic analysis is required to understand the changes in composition.
Metabolomics can be applied to identify and analyze the metabolites of fruit, which is essential for determining its nutritional value (Quinet et al., 2019; Xu et al., 2021). Broadly targeted metabolomics combines the benefits of both untargeted and targeted metabolomics. Due to its high efficiency, high sensitivity, and extensive coverage, targeted metabolomics has already been widely applied to the study of metabolic changes in various fruits (Sawada et al., 2009; Chen et al., 2013). Based on ultra-performance liquid chromatography/tandem mass spectrometry (UPLC-MS/MS), metabolomics has a library for the easy recognition of various compounds. It has already been adopted to analyze metabolite profiles and to examine the variations in plant composition (Xiao et al., 2014; Wang et al., 2017; Li et al., 2021). For instance, metabolomics analysis can be conducted to examine the metabolite changes in those apples subjected to various ripening treatments (Lee, Mattheis & Rudell, 2012). The metabolomics method can be used to decode the metabolic changes in strawberry during the course of development and ripening (Zhang et al., 2010).
This study is purpose to determine the metabolic differences between unripe D. delavayi and ripe D. delavayi by applying a targeted metabolomics strategy. Such metabolites as amino acids, phenolic acids, organic acids, flavonoids and terpenoids, all of which contribute to increasing nutritional value, are the focus of the present study. The findings of it could help improve our understanding as to the metabolism of key mass characteristics in fruit, thus providing a solution to the planting of high-quality D. delavayi.
Materials and Processes
Sample collection
On July 18, 2020, the samples were collected from Lancang country (100°21′E, 22°56′N) in Yunnan province, China. Field experiments were approved by the National Natural Science Foundation of China (project number: 32060350) and the samples were collected with the consent of Liu Yu and Zhang Xinluo villagers; Nuozadu village committee for supporting this study. Immediately afterwards, the harvested fruits were transported to a laboratory, where they were graded by maturity and colouring stage: green unripe (GW) and red ripe (GX). (Su, 2019). Approximately 15 fruits in each stage were combined to represent one biological replicate, with three biological replicates prepared for each stage. All samples were frozen with dry ice.
Sample preparation and extraction
These biological samples were freeze-dried by using a vacuum freeze-dryer (Scientz-100F). Then, the freeze-dried samples were crushed for 1.5 min at 30 Hz by a mixer mill (MM 400, Retsch GmbH, Haan, Germany) fitted with a zirconia bead. 100 mg of lyophilized powder was dissolved in 1.2 mL of 70% methanol solution, and then stirred for 30 s at a 30-minute interval (6 times in total). Finally, the samples were placed in a refrigerator at 4 °C overnight. After 10 min of centrifugation at 12,000 rpm, the extracts were filtrated (SCAA-104, 0.22 µm pore size; ANPEL, Shanghai, China) for subsequent UPLC-MS/MS analysis.
UPLC-MS/MS conditions
Given the limited availability of extracts, the application of ultra-performance liquid chromatography coupled to tandem mass spectrometry is considered to be one of the preferred methods of analysis. The following UPLC conditions are required for the present study (Chen et al., 2013):
-
Column, Agilent SB-C18 (1.8 µm, 2.1 mm*100 mm);
-
The mobile phase included solvent A:
-
MilliQ water with 0.1% formic acid, and solvent B:
-
Acetonitrile with 0.1% formic acid.
-
ESI-Q TRAP-MS/MS
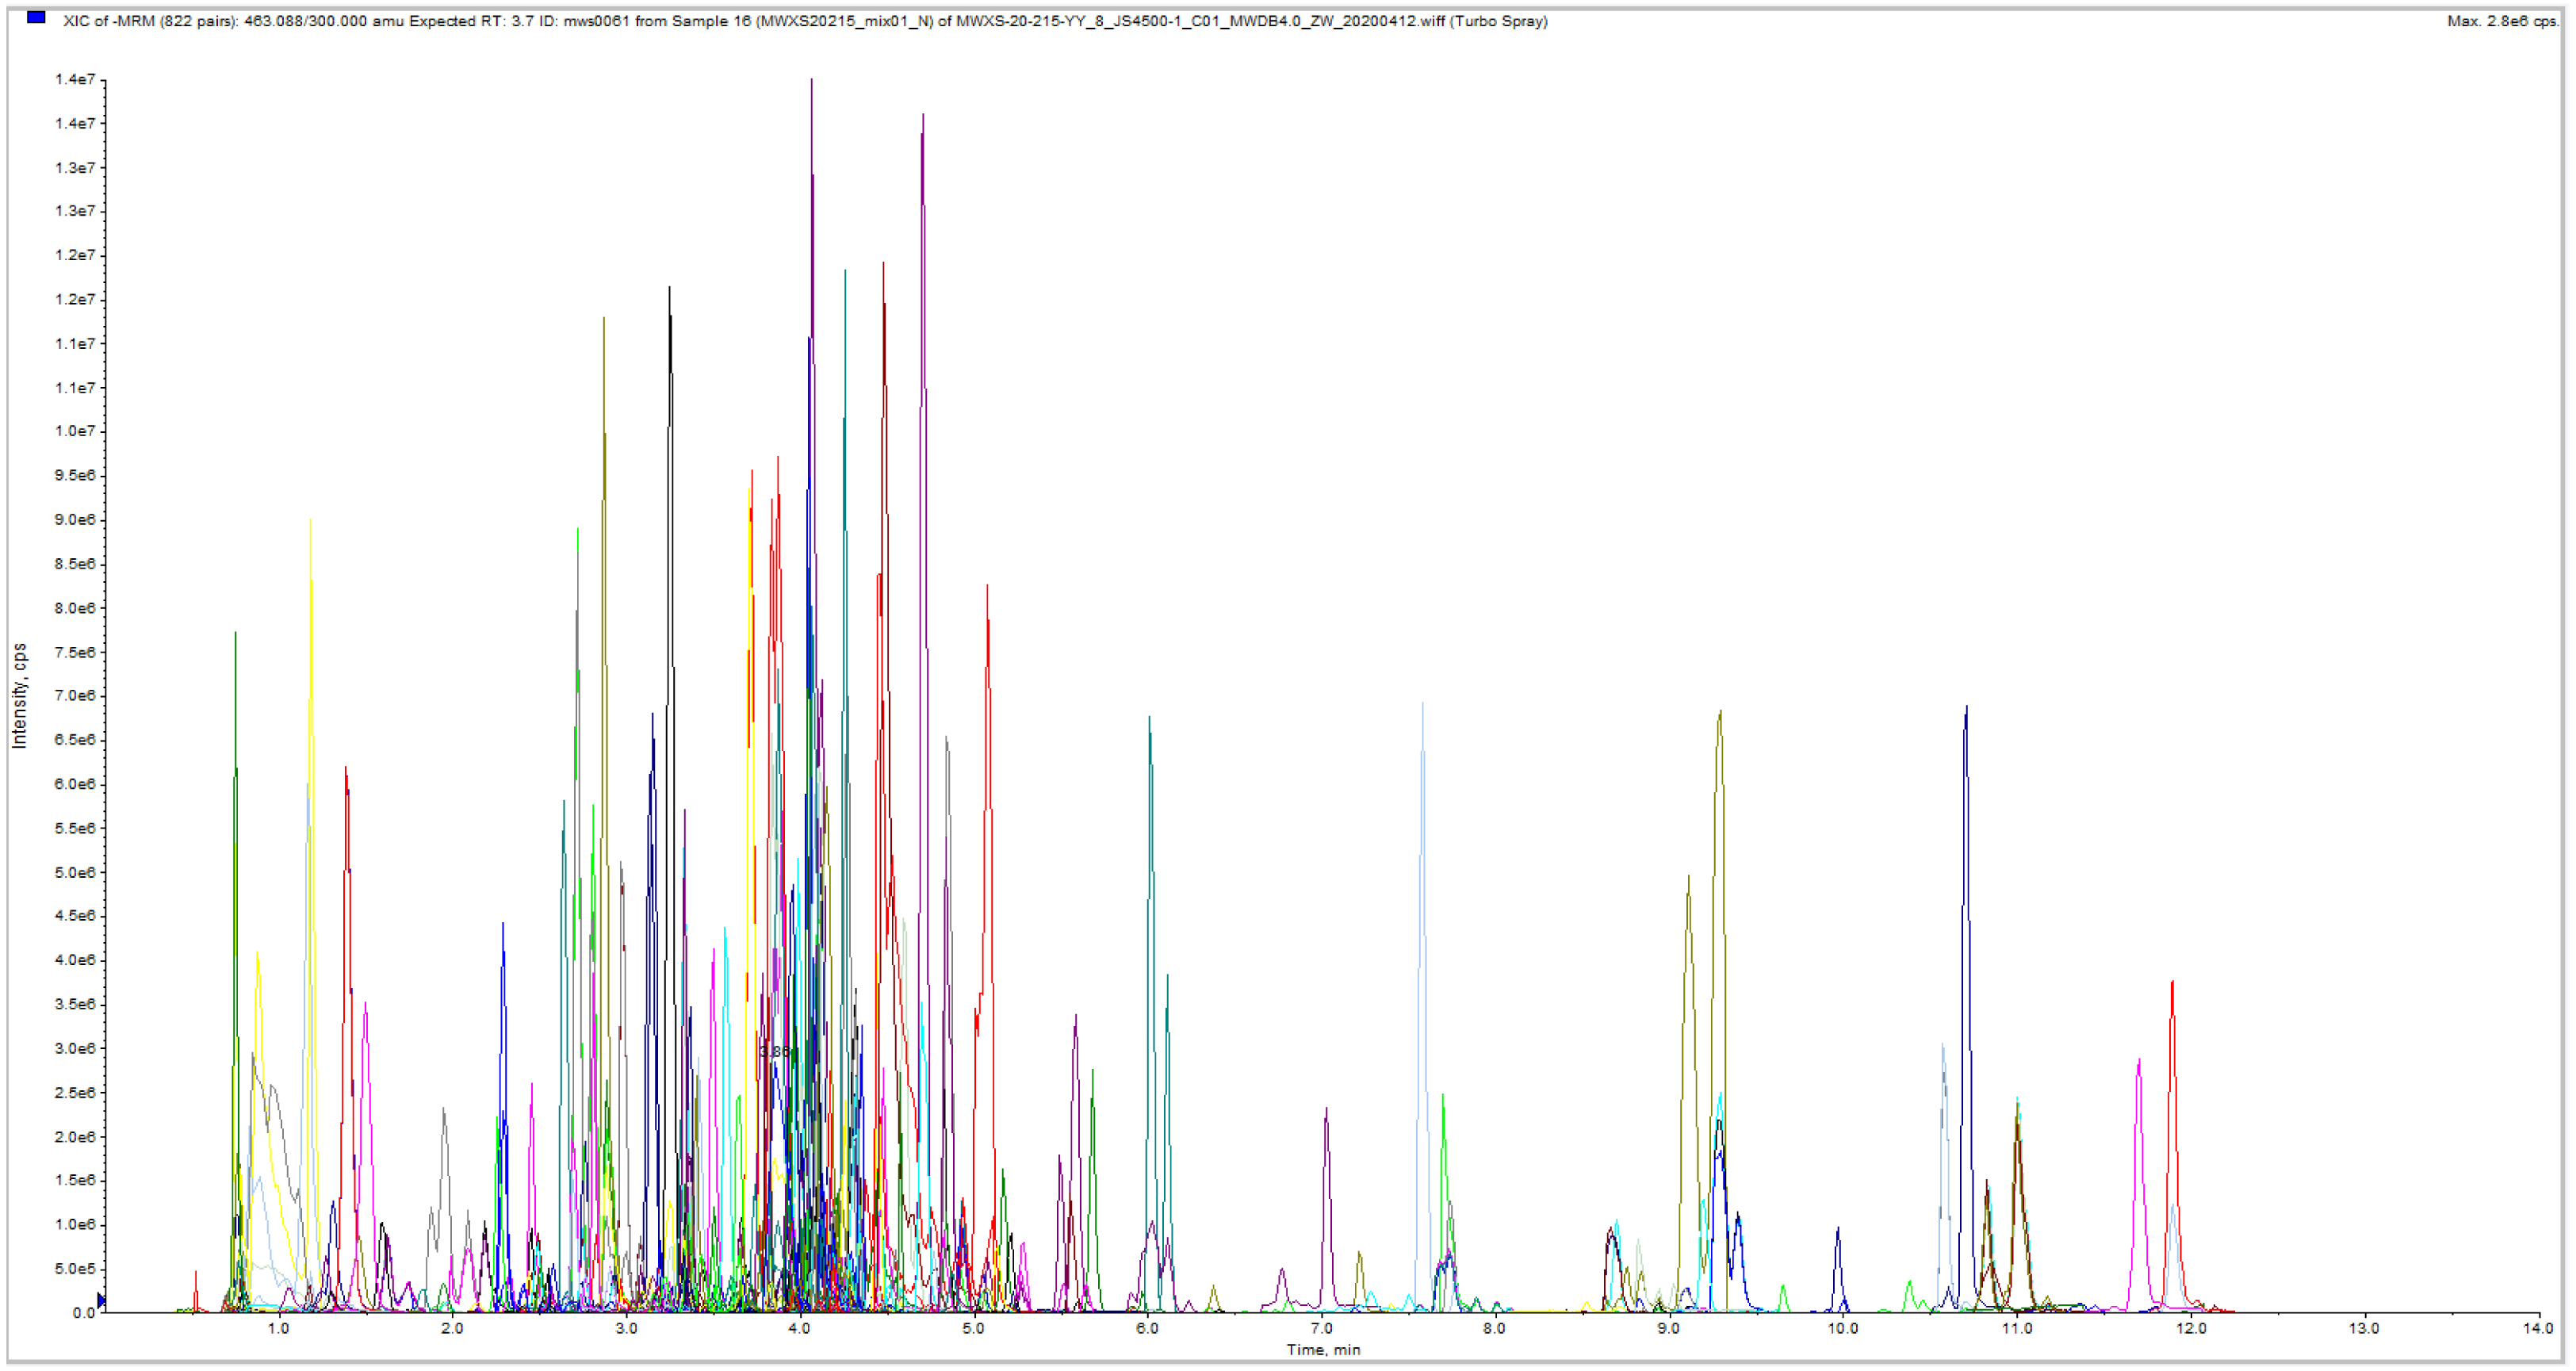
An AB4500 Q TRAP UPLC/MS/MS system, complete with an ESI Turbo Ion-Spray interface, was adopted for both LIT and Triple Quadrupole (QQQ) scanning. This system was operated by using Analyst 1.6.3 software (AB Sciex). The operational settings for the ESI source are as follows: ion source, turbo spray; source frequency of 550 °C; ion spray voltage (IS) 5,500 V (positive ion mode)/−4,500 V (negative ion mode); ion source gases I (GSI), II (GSII), and curtain gas (CUR) fixed at 50, 60, and 25.0 psi, respectively; and large collision-activated dissociation (CAD) value. To tune the device and calibrate the weight, polypropylene glycol liquids of 10 and 100 mol/L were used, respectively, in the QQQ and LIT modes. During MRM investigation, QQQ scans were obtained with the collision gas (nitrogen) adjusted to medium. Both DP and CE were further enhanced to support single MRM conversions. The MRM transitions for each session were tracked by eluting the metabolites during each interval (Fig. 1) (Fraga et al., 2010).

Figure 1: The multi-peak map of MRM metabolite detection.
Metabolite identification and quantification
MetWare databases were used. Match scores were given by using the MetDNA software developed by Zhu et al. (2013) and the Masterview software developed by AB Sciex (Toronto, Canada). The majority of the compounds in the database are standards. MRM information was collected from each standard (Fig. 1). For metabolite quantification, multiple reaction monitoring was performed. In the MRM mode, the quadrupole filtered the precursor ions of the target substance first, excluding the ions corresponding to other molecular weight substances for the preliminary elimination of interference. After the collision chamber was induced to ionize, the precursor ions were fragmented to obtain many fragment ions. Then, triple quadrupole filtering was conducted, with a distinctive fragment ion used to remove non-target ion interference for improving the accuracy of quantification and reproducibility. The peak area of all substance mass peaks was integrated after the data on metabolite mass spectrometry was collected from several samples. Besides, the peaks of the same metabolite in various samples were integrated and corrected.
Metabolite data analysis
Principal Component Analysis (PCA) was carried out with the statistically functional prcomp in R (http://www.r-project.org). The data was unit variance scaled before unsupervised PCA. The heatmaps of dendrograms were used to present the sample and the hierarchical clustering results of metabolites. The correlation function in R can be used to calculate the Pearson correlation coefficients between samples, which are displayed in the form of heatmaps. The differential metabolites designated among groups were identified by VIP >= 1 and absolute Log2FC (fold change) >= 1. Obtained from OPLS-DA outcome, VIP values include two plots of score and permutation as formed with R package Metabo Analyst R. The statistic was log transfer (log2) and mean centering before OPLS-DA. A permutation test (200 permutations) was performed to stop overfitting. Pathway database (http://www.kegg.jp/kegg/pathway.html) was used to make explanation using the KEGG Compound database (http://www.kegg.jp/kegg/compound/). Then, metabolite sets enrichment analysis was conducted, and the significance of pathways with heavily regulated metabolites was determined according to the p-values of the hypergeometric test.
Statistical analysis
Through Excel (Microsoft Excel 2016, Microsoft, Redmond, WA, USA), a statistical analysis was carried out. The statistics are presented as means ± standard deviations. The least significant difference (p < 0.05) was used to assess the level of statistical significance.
Results
Widely targeted metabolome profiling of D. delavayi fruit
To better understand the variation in nutritional values between unripe D. delavayi and ripe D. delavayi, ‘GW’ and ’GX’ were applied for the metabolic profiling based on UPLCMS/MS. With a total of 727 distinct metabolites identified in all samples, they were classified into 11 categories according to metabolite structure, as shown in Table 1. A significant number of these metabolites are suspected to be responsible for fruit development (53 amino acids and derivatives, 72 phenolic acids, 12 tannins, 29 organic acids). Among these 11 compounds, phenolic acids (72 types) and flavonoids (111 types) were considerably more abundant than the others.
| Class | Number of Compounds |
|---|---|
| Amino acids and derivatives | 53 |
| Phenolic acids | 72 |
| Nucleotides and derivatives | 33 |
| Flavonoids | 111 |
| Lignans and Coumarins | 18 |
| Others | 46 |
| Tannins | 12 |
| Alkaloids | 18 |
| Terpenoids | 24 |
| Organic acids | 29 |
| Lipids | 61 |
Multivariate analyses of determined metabolites
In total, 477 metabolites were analyzed through PCA analysis (S1). The first principal component (PC1) accounted for 65.63% of the variance, whereas the second principal component (PC2) accounted for 26.26% of the variance (Fig. 2A), indicating a significant difference between GW and GX. The heatmap of all metabolites was created to visualize the variations between GW and GX (Fig. 2B). PCA and the heatmap reveal the significant variations in metabolites between the two developmental stages.
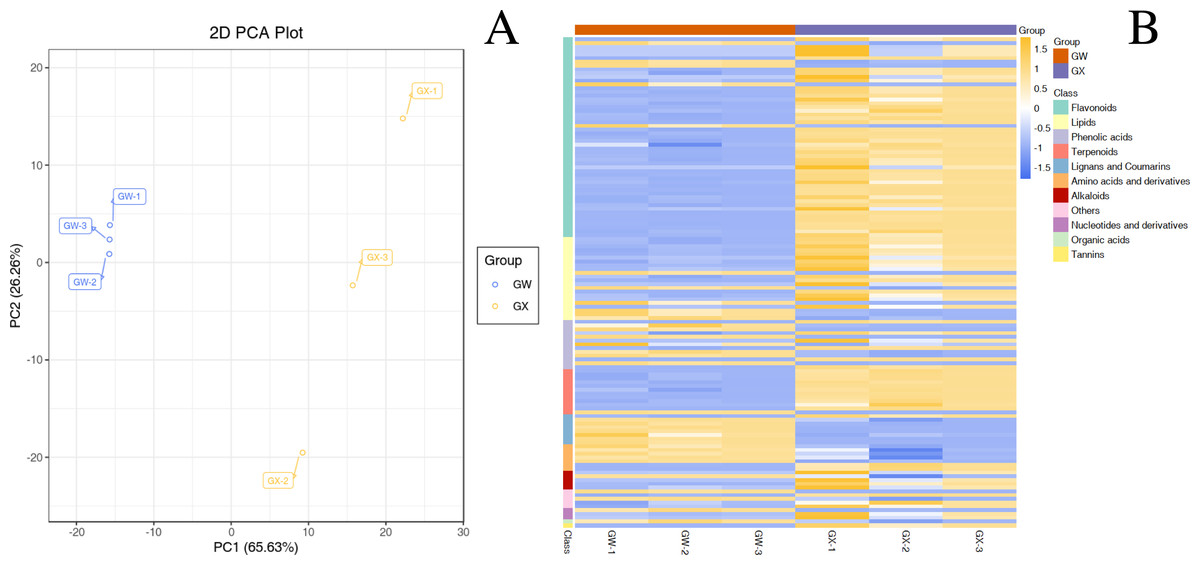
Figure 2: Differential chemotype metabolites between ‘GW’ and ‘GX’.
The numbers 1, 2, and 3 indicate three biological replicates. (A) PCA analysis of metabolites identified from ‘GW’ and ‘GX’ (B) Cluster analysis of metabolites from samples of ‘GW’ and ‘GX’. The colour indicates the level of accumulation of each metabolite, from low (green) to high (red).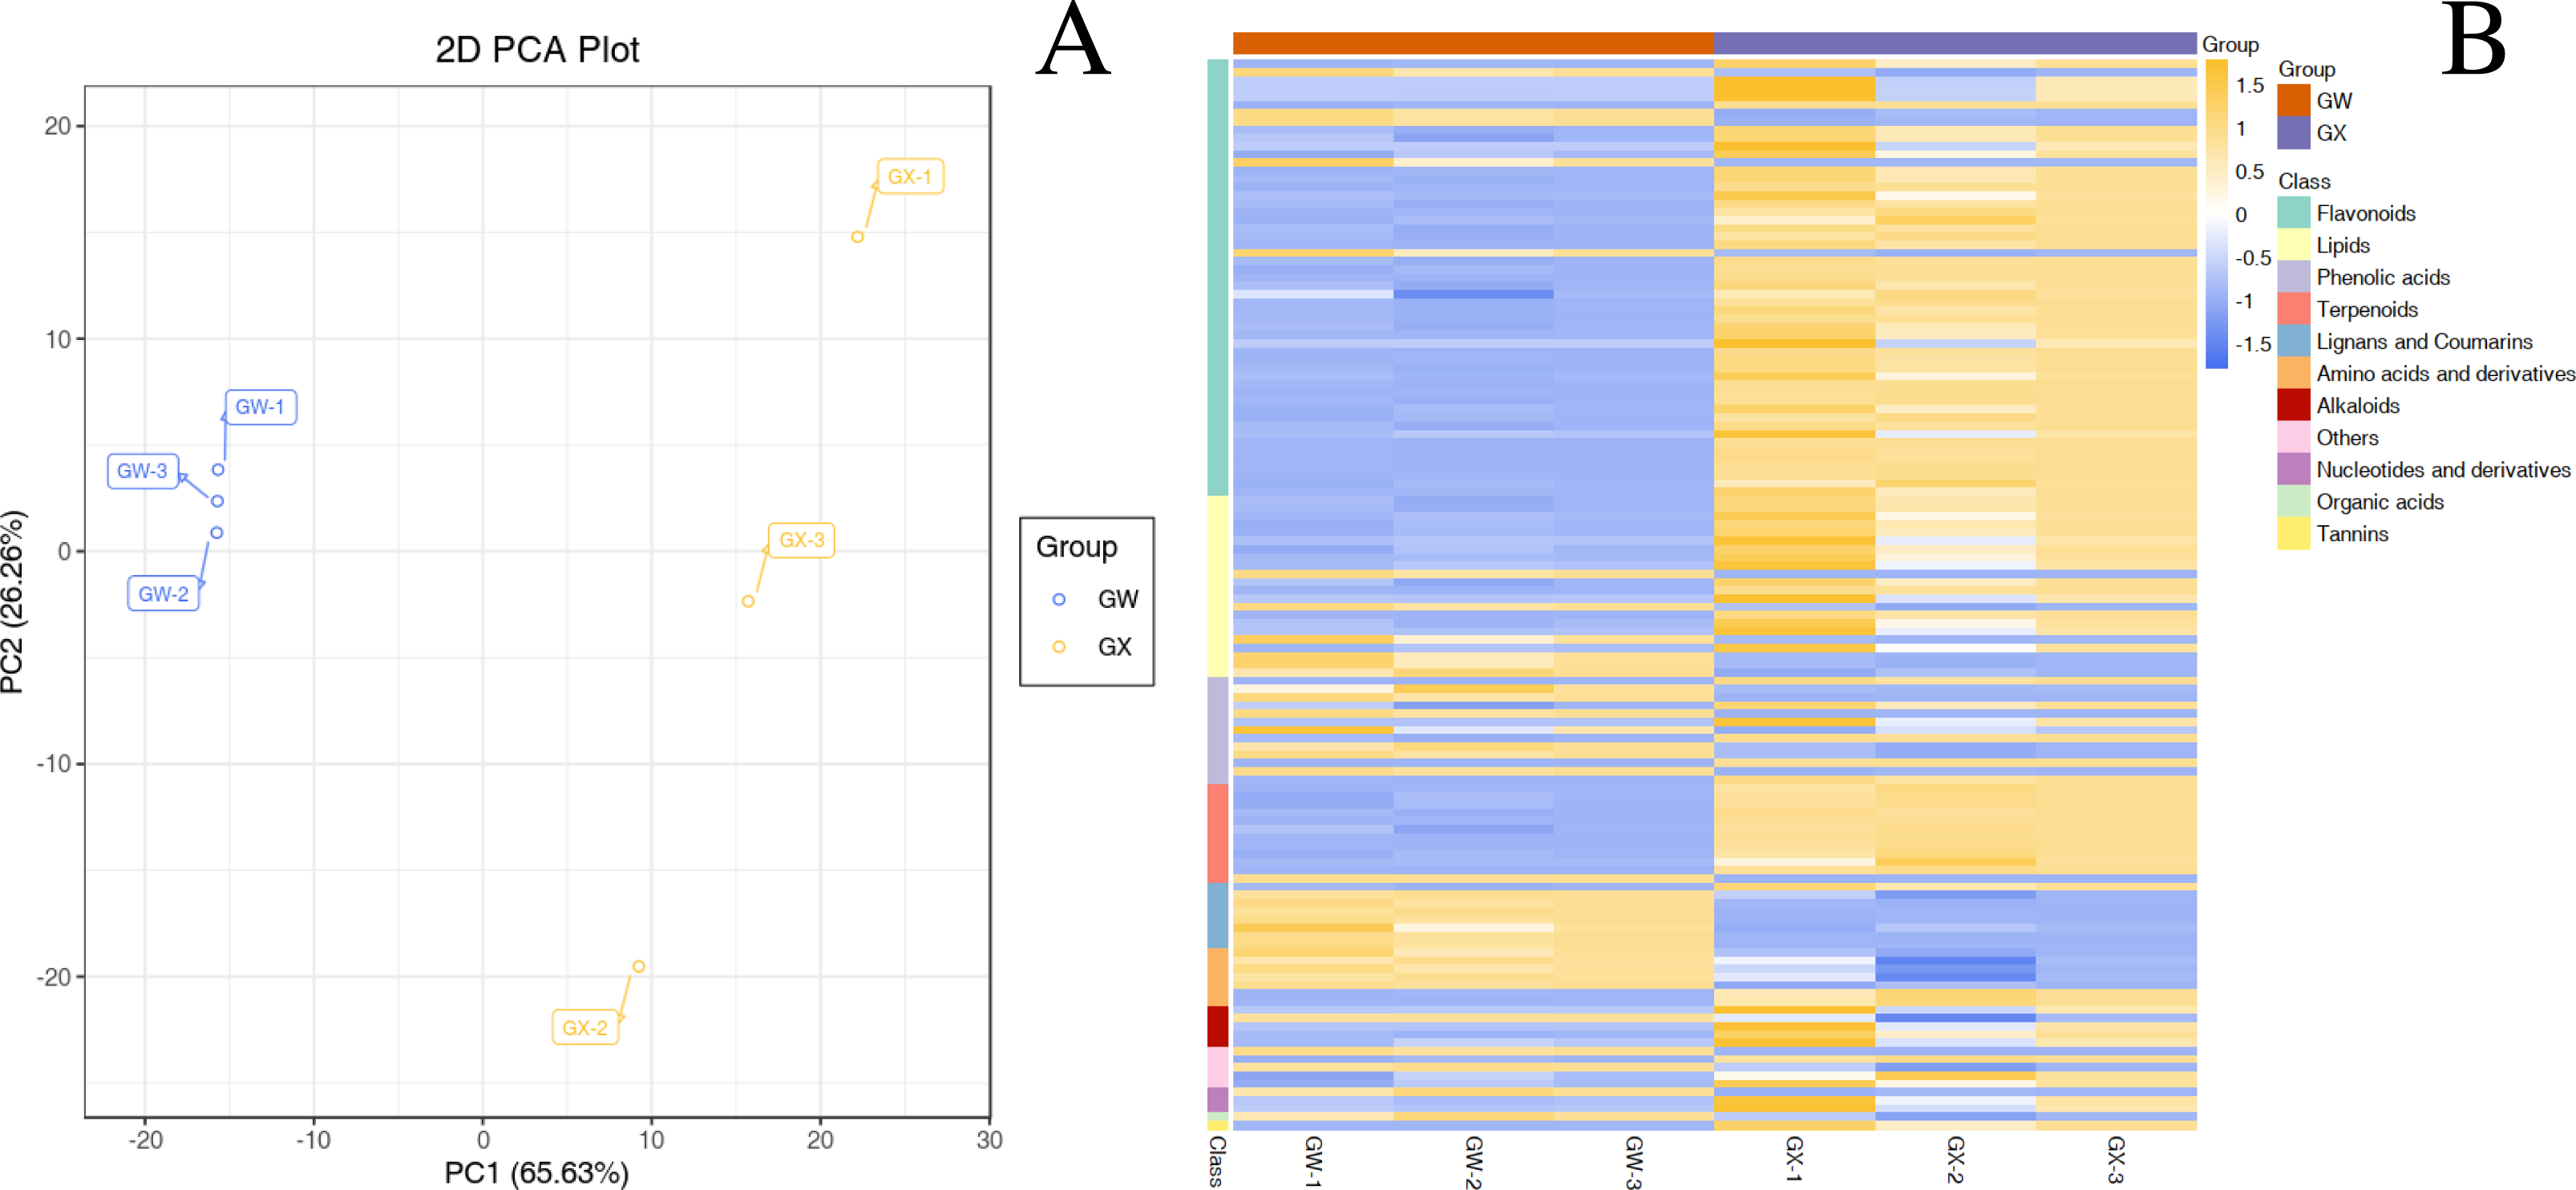
By identifying the differential metabolites between GX and GW, it can be found out that metabolites with fold change ≥2 or ≤0.5 and the VIP values greater than 1. There are a total of 130 differentiated metabolites, of which 94 are up-regulated and 36 are down-regulated (Fig. 3A). The 130 metabolites can be divided into 11 different categories, with phenolic acids, flavonoids, terpenoids, and lipids in the majority (Fig. 3B).
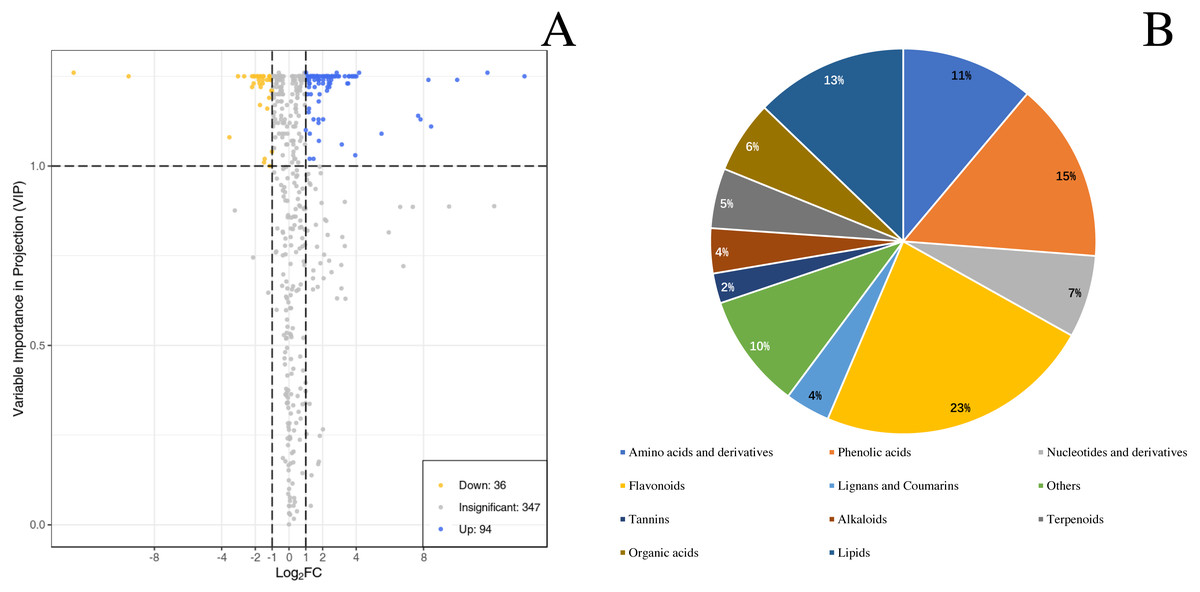
Figure 3: Differential metabolites between ‘GW’ and ‘GX’.
(A) Volcano plot of the 124 metabolites identified. (B) Pie chart depicting the categories of the differential metabolites identified between ‘GW’ and ‘GX’.
Differential metabolite KEGG classification and enrichment analysis
The metabolic pathways of 130 differential metabolites were mapped to the KEGG database (S2). Despite few metabolites classified as genetic information processing and environmental information processing, the majority of metabolites were categorized into ‘metabolism’ (Fig. 4A). As revealed by the enrichment analysis of biological pathways associated with two nutrient metabolisms (“pantothenate and CoA biosynthesis” and “flavone and flavonol biosynthesis”), there were significant differences between unripe and ripe D. delavayi: p < 0.05 (Fig. 4B).

Figure 4: KEGG enrichment map of differential metabolites form ‘GW’ and ‘GX’.
(A) KEGG differential enrichment classification map. The x axis indicates the proportion and number of metabolites annotated to the pathway, and the y axis indicates name of the KEGG metabolic pathway; (B) Statistics of KEGG enrichment. The x axis indicates the rich factor corresponding to each pathway, and the y axis indicates name of the KEGG metabolic pathway. The color of the point represents the p-values of the enrichment analysis. The size and color of bubbles represent the number and degree of enrichment of different metabolites.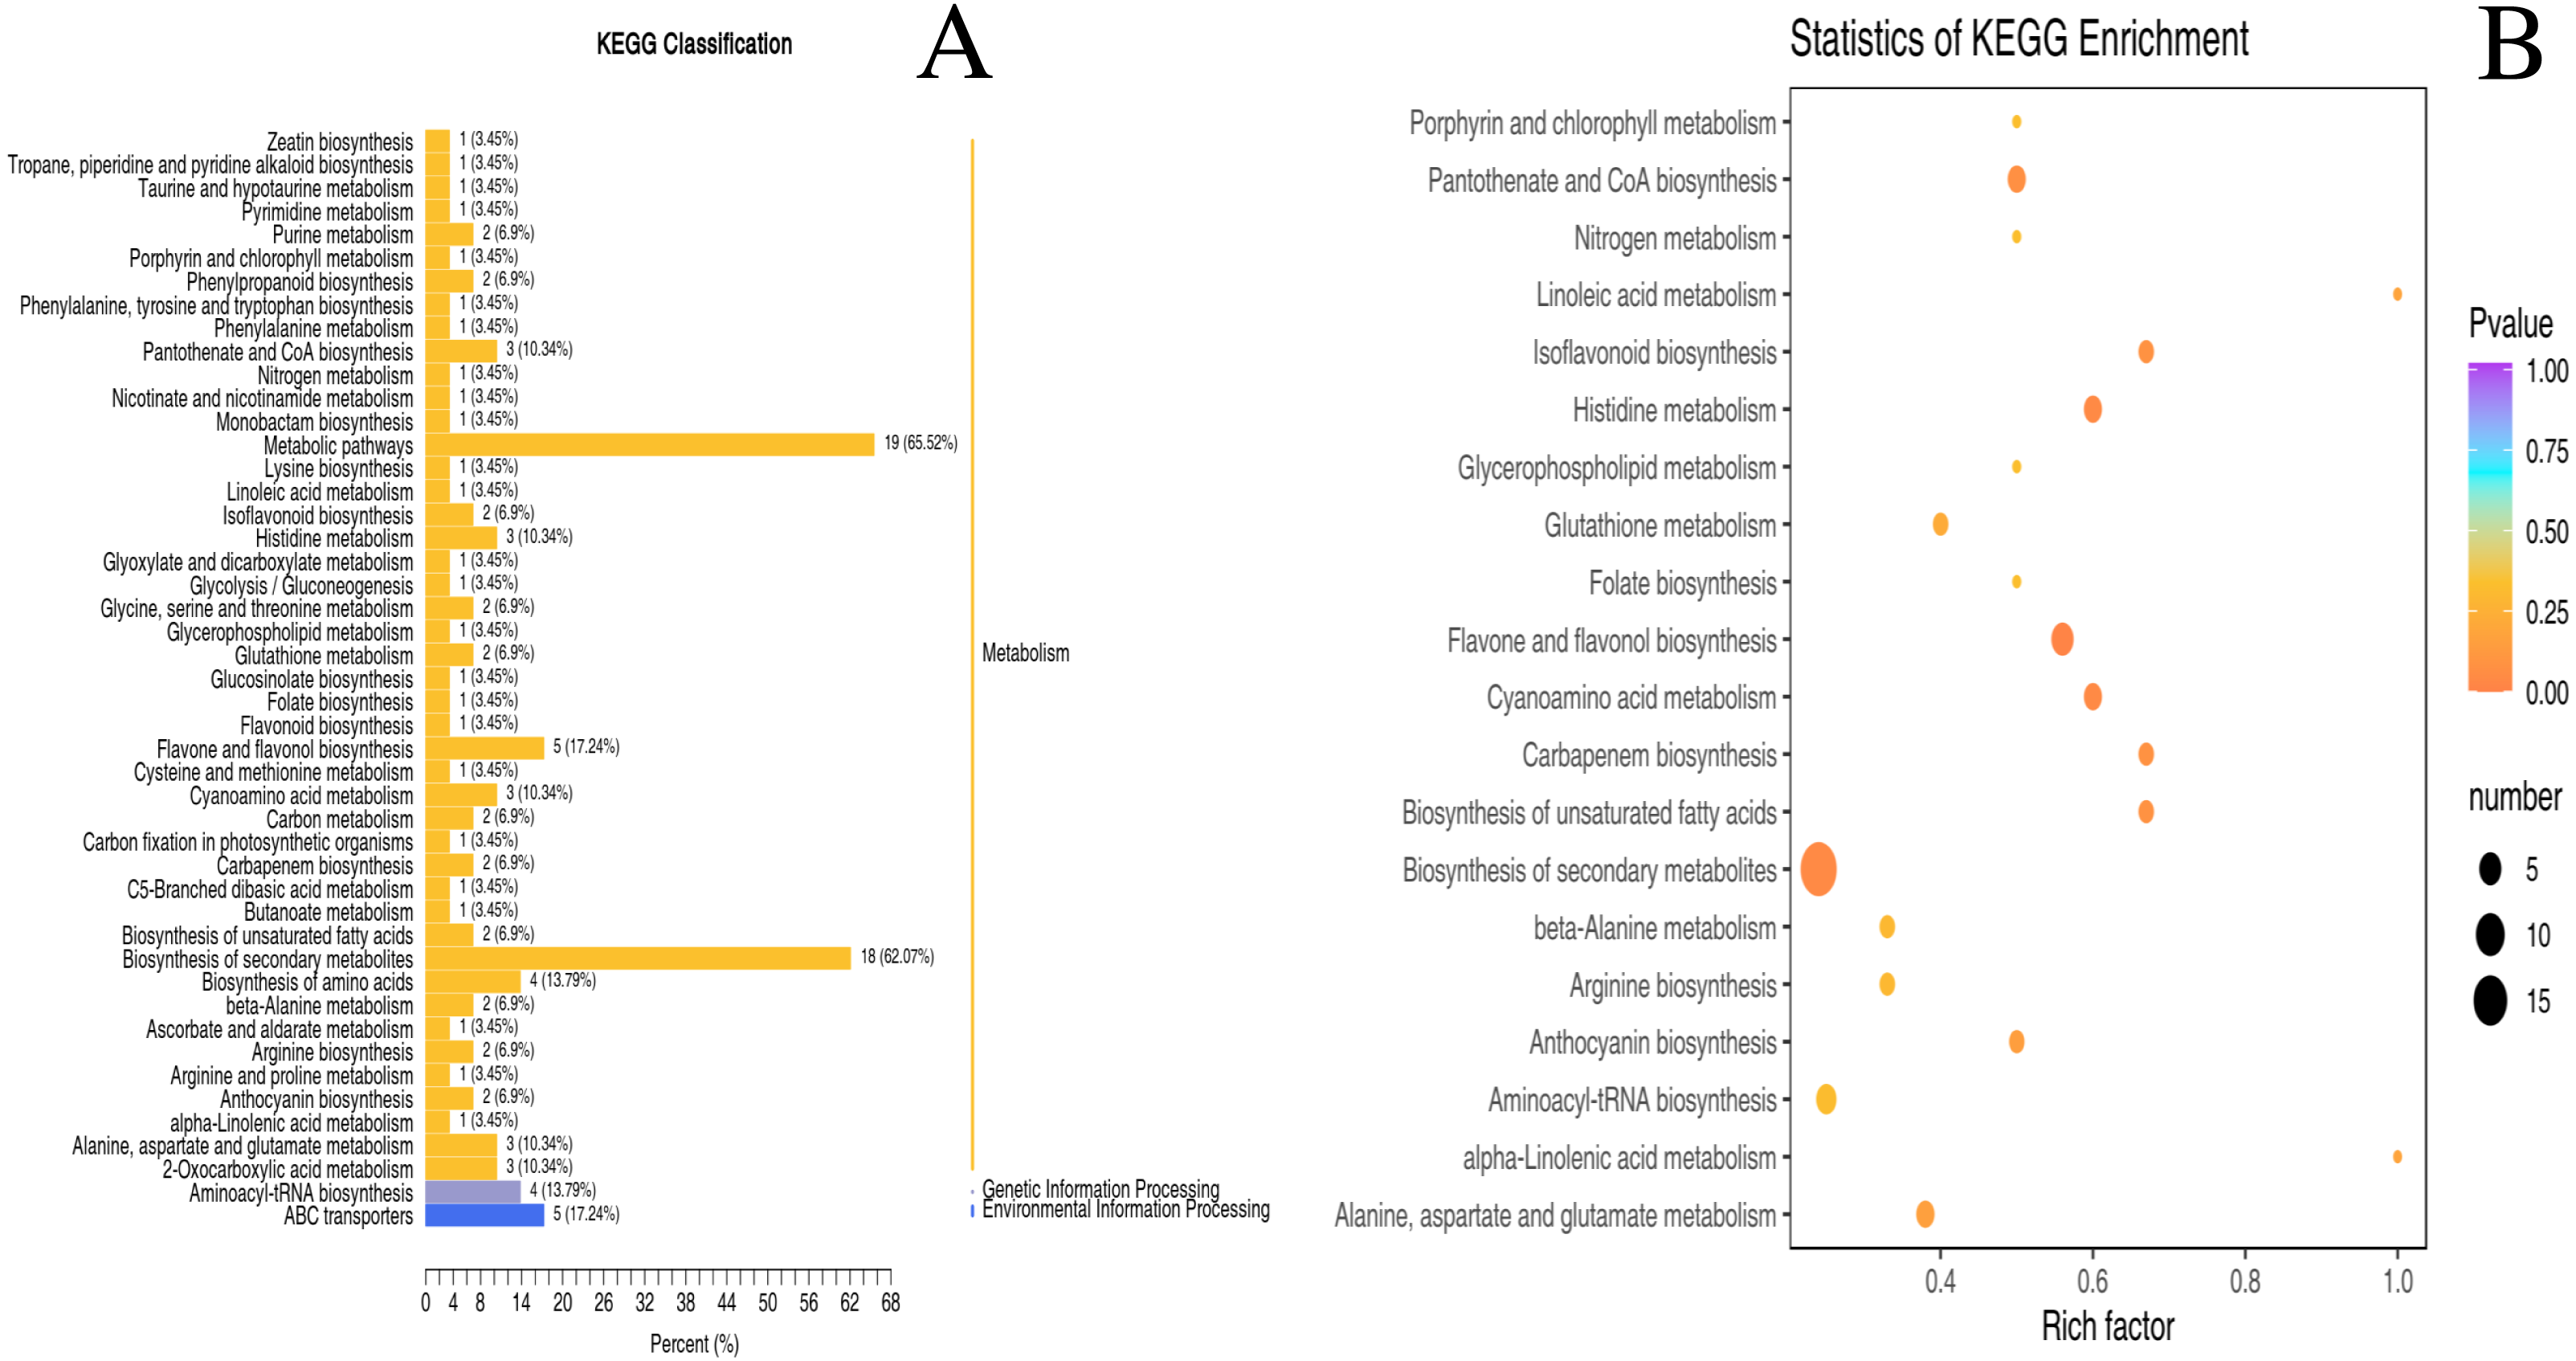
Amino acids and derivatives, phenolic acids, organic acids
Concerning the types of metabolites that may affect the flavour of D. delavayi, both ‘GW’ and ‘GX’ contained amino acids and their derivatives, with L-glutamic acid and L-phenylalanine in the majority. According to fold change and VIP values, seven differential metabolites were selected. The concentrations of acetyltryptophan and n-acetyl-dl-tryptophan were significantly higher in ‘GX’, whereas the content of other five amino acids in ‘GW’ was lower than in ‘GX’ (Fig. 5), despite no significant change (Table 2).

Figure 5: Differences in the contents of 9 metabolites in GW (left) and GX (right).
| Class | Compounds | Peak area | Fold change | VIP( ≥1) | Type | |
|---|---|---|---|---|---|---|
| GW | GX | |||||
| Amino acids and derivatives | L-Asparagine | 1,830,000 ± 1,370,000 | 260,000 ± 14,600 | 0.086 | 1.08 | down |
| L-AsparticAcid | 1,120,000 ± 1,040,000 | 763,000 ± 313,000 | 0.498 | 1.04 | down | |
| L-Glutamic acid | 19,500,000 ± 17,500,000 | 9,930,000 ± 5,220,000 | 0.409 | 1.16 | down | |
| L-Phenylalanine | 5,100,000 ± 4,790,000 | 2,880,000 ± 652,000 | 0.358 | 1.01 | down | |
| 1-Methylhistidine | 124,000 ± 119,000 | 41,400 ± 29,100 | 0.290 | 1.24 | down | |
| Acetyltryptophan | 679,000 ± 568,000 | 7,100,000 ± 5,320,000 | 9.957 | 1.25 | up | |
| N-Acetyl-DL-tryptophan | 188,000 ± 179,000 | 1,380,000 ± 1,110,000 | 6.800 | 1.25 | up | |
| Phenolic acids | 4-Aminobenzoic acid | 222,000 ± 222,000 | 736,000 ± 677,000 | 3.183 | 1.25 | up |
| 3,4-Dihydroxybenzaldehyde | 69,600 ± 42,900 | 18,300 ± 16,800 | 0.312 | 1.22 | down | |
| Vanillin | 998,000 ± 859,000 | 278,000 ± 271,000 | 0.296 | 1.25 | down | |
| Methyl-(2,4-dihydroxyphenyl) acetate | 5,560 ± 3,810 | 11,000 ± 9,190 | 2.156 | 1.20 | up | |
| Sinapinaldehyde | 542,000 ± 494,000 | 124,000 ± 120,000 | 0.236 | 1.25 | down | |
| Salicin | 10,400 ± 4,590 | 4,310 ± 2,480 | 0.453 | 1.00 | down | |
| 5-(2-Hydroxyethyl)-2-O-glucosylohenol | 304,000 ± 272,000 | 760,000 ± 735,000 | 2.596 | 1.25 | up | |
| 1-O-Galloyl- β-D-glucose | 3,250,000 ± 2,900,000 | 1,540,000 ± 1,350,000 | 0.470 | 1.24 | down | |
| 3-O-Caffeoylshikimic acid | 173,000 ± 159,000 | 78,200 ± 69,500 | 0.445 | 1.25 | down | |
| 1-O-(3,4-dihydroxy-5-methoxy-benzoyl)- β-D-glucoside | 32,400 ± 32,100 | 585,000 ± 580,000 | 18.048 | 1.26 | up | |
| Glucosyringic Acid | 2,640,000 ± 2,510,000 | 1,180,000 ± 1,130,000 | 0.448 | 1.25 | down | |
| Quillaic acid | 288,000 ± 270,000 | 2,220,000 ± 1,980,000 | 7.527 | 1.25 | up | |
| Organic acids | Phosphoenolpyruvic acid | 101,000 ± 87,200 | 52,600 ± 38,100 | 0.482 | 1.21 | down |
A total of 72 phenolic acids were identified in ‘GW’ and ‘GX’ (Table 1), of which 12 exhibited significant differences in accumulation. 1-O-(3,4-dihydroxy-5-methoxy-benzoyl)-β-D-glucoside accumulated in significantly higher concentrations in ‘GX’ than in ‘GW’ (Fig. 5). However, only one of the 29 organic acids was identified as a differential metabolite (phosphoenolpyruvic acid), with ‘GX’ showing a considerably higher cumulative concentration of phosphoenolpyruvic acid than ‘GW’ (Table 2).
Flavonoids and terpenoids
What is noteworthy is the primary source of nutrients in D. delavayi, in addition to the metabolites. Flavonoids were found to have the largest number of unique metabolites. In GW and GX, only four flavonoids were down-regulated, while the remaining 47 flavonoids were up-regulated to varying degrees (Table 3). The three flavonoids that were up-regulated to the most significant extent include 5,7,8,4′-tetramethoxyflavone (348.620 fold), nobiletin (226.216 fold), and tangeretin (204.974 fold) (Fig. 5). These three differential metabolites were all associated with nobiletin and tangeretin and were detected to have higher concentrations in ‘GX’ than in ‘GW. ‘GX’ contained a substantially larger amount of flavonoids than GW.
| Class | Compounds | Peak area | Fold Change | VIP (≥1) | Type | |
|---|---|---|---|---|---|---|
| GW | GX | |||||
| Dihydroflavone | Liquiritin | 704,000 ± 638,000 | 253,000 ± 210,000 | 0.345 | 1.25 | down |
| Dihydroflavonol | Dihydroquercetin (Taxifolin) | 193,000 ± 162,000 | 50,700 ± 32,300 | 0.234 | 1.23 | down |
| Hesperetin 5-O-glucoside | 458,000 ± 424,000 | 969,000 ± 903,000 | 2.122 | 1.25 | up | |
| Anthocyanins | Rosinidin O-hexoside | 57,200 ± 43,900 | 18,500 ± 15,800 | 0.339 | 1.24 | down |
| Cyanidin-3-O-(6″-p-Coumaroylglucoside) | 267,000 ± 219,000 | 1,120,000 ± 997,000 | 4.358 | 1.25 | up | |
| Delphinidin-3-O- (6″-p-Coumaroylglucoside) | 1,470,000 ± 1,050,000 | 6,620,000 ± 6,130,000 | 5.058 | 1.25 | up | |
| Flavonoid | 5,7,8,4′-Tetramethoxyflavone | 760 ± 733 | 513,000 ± 7,560 | 348.620 | 1.11 | up |
| Nobiletin | 28,300 ± 18,000 | 10,200,000 ± 282,000 | 226.216 | 1.13 | up | |
| Kaempferol-3-arabinopyranoside | 151,000 ± 143,000 | 385,000 ± 381,000 | 2.605 | 1.25 | up | |
| Pinocembrin 7-O- β-D-glucoside (Pinocembroside) | 171,000 ± 158,000 | 59,900 ± 56,100 | 0.352 | 1.25 | down | |
| Luteolin-4′-O- β-D-glucoside* | 2,750,000 ± 2,470,000 | 7,720,000 ± 6,430,000 | 2.711 | 1.25 | up | |
| Isoscoparin | 132,000 ± 109,000 | 407,000 ± 367,000 | 3.216 | 1.25 | up | |
| Chrysoeriol-5-O-hexoside | 3,900,000 ± 3,810,000 | 12,700,000 ± 11,600,000 | 3.146 | 1.25 | up | |
| Taxifolin-3′-O- β-D-glucoside | 1,110,000 ± 1,090,000 | 2,500,000 ± 2,280,000 | 2.173 | 1.25 | up | |
| Chrysoeriol-O-acetylhexoside | 348,000 ± 335,000 | 1,350,000 ± 1,320,000 | 3.906 | 1.25 | up | |
| Isorhamnetin O-malonylglucoside | 124,000 ± 109,000 | 294,000 ± 242,000 | 2.304 | 1.24 | up | |
| Kaempferol-7-O-neohesperidoside | 106,000 ± 104,000 | 513,000 ± 489,000 | 4.771 | 1.25 | up | |
| Quercetin-3-O- β-D-xylopyranosyl- (1 →2)- β-D-galactopyranoside | 63,300 ± 47,400 | 342,000 ± 198,000 | 4.880 | 1.22 | up | |
| Quercetin 3-O-(6″-trans-p-Coumaroyl)- β-D-galactopyranoside | 6,460 ± 6,250 | 46,200 ± 44,600 | 7.142 | 1.26 | up | |
| Luteolin-8-C-hexosyl-O-hexoside | 81,700 ± 67,100 | 388,000 ± 379,000 | 5.157 | 1.25 | up | |
| Kaempferol-3,7-di-O- β-D-glucopyranoside | 24,100 ± 17,500 | 124,000 ± 88,500 | 5.104 | 1.24 | up | |
| Flavonols | Tangeretin | 15,000 ± 10,200 | 5,010,000 ± 158,000 | 204.974 | 1.14 | up |
| Kaempferol-7-O-rhamnoside | 32,000 ± 29,400 | 70,900 ± 60,100 | 2.134 | 1.24 | up | |
| Kaempferol-3-O-rhamnoside (Afzelin)(Kaempferin) | 50,200 ± 37,000 | 108,000 ± 90,600 | 2.276 | 1.22 | up | |
| 3,5,6,7,8,3′,4′-Heptamethoxyflavone | 2,930 ± 2,610 | 239,000 ± 11,100 | 45.138 | 1.09 | up | |
| Kaempferol-3-O-glucoside (Astragalin)* | 1,720,000 ± 1,670,000 | 5,060,000 ± 4,950,000 | 2.951 | 1.25 | up | |
| Kaempferol-3-O- β-D-glucuronide | 26,200 ± 21,900 | 152,000 ± 78,400 | 4.791 | 1.21 | up | |
| Quercetin-3-O- β- D-glucoside(Isoquercitrin)* | 3,800,000 ± 3,410,000 | 9,690,000 ± 7,230,000 | 2.348 | 1.23 | up | |
| Quercetin-3-O- β-D-Galactoside (Hyperin)* | 3,790,000 ± 3,390,000 | 8,000,000 ± 7,530,000 | 2.163 | 1.25 | up | |
| Myricetin 3-O-galactoside | 16,300 ± 6,940 | 138,000 ± 129,000 | 11.481 | 1.23 | up | |
| Kaempferol-3-O-(6″-acetyl)-glucoside | 742,000 ± 579,000 | 3,200,000 ± 3,170,000 | 4.826 | 1.25 | up | |
| Quercetin-3-O-(6″-O-acetyl)-galactoside | 4,270,000 ± 2,500,000 | 20,300,000 ± 16,800,000 | 5.472 | 1.23 | up | |
| Quercetin-3-O-(2″-acetyl)- β-D-glucuronide | 26,000 ± 13,400 | 42,100 ± 36,900 | 2.005 | 1.10 | up | |
| Kaempferol-3-O-(6″-malonyl)-glucoside | 258,000 ± 230,000 | 888,000 ± 846,000 | 3.553 | 1.25 | up | |
| Quercetin-7-O-(6′-O-malonyl)- β-D-glucoside | 128,000 ± 118,000 | 424,000 ± 366,000 | 3.211 | 1.25 | up | |
| Quercetin-3-O-(6″-O-malonyl)-glucoside | 71,700 ± 55,500 | 375,000 ± 368,000 | 5.839 | 1.25 | up | |
| ”Myricetin-3-O-(6″-malony)glucoside” | 3,140 ± 2,530 | 40,100 ± 27,700 | 11.951 | 1.25 | up | |
| Tiliroside | 5,490 ± 4,820 | 148,000 ± 10,500 | 15.382 | 1.03 | up | |
| Kaempferol-3-O-rutinoside(Nicotiflorin) | 570,000 ± 526,000 | 2,400,000 ± 2,150,000 | 4.148 | 1.25 | up | |
| Quercetin-3-O-rutinoside (Rutin) | 3,760,000 ± 3,110,000 | 17,200,000 ± 15,500,000 | 4.753 | 1.25 | up | |
| 6-Hydroxykaempferol-7,6-O-Diglucoside | 82,700 ± 74,700 | 622,000 ± 614,000 | 7.853 | 1.25 | up | |
| 6-Hydroxykaempferol-3,6-O-Diglucoside | 48,900 ± 46,500 | 289,000 ± 273,000 | 5.891 | 1.25 | up | |
| Quercetin-5-O-malonylhexosyl-hexoside | 18,800 ± 16,700 | 274,000 ± 269,000 | 15.272 | 1.25 | up | |
| Quercetin-7-O-malonylhexosyl-hexoside | 27,600 ± 20,200 | 157,000 ± 116,000 | 5.704 | 1.24 | up | |
| Quercetin-O-rutinoside-hexose | 9,150 ± 6,340 | 133,000 ± 93,900 | 14.669 | 1.25 | up | |
| Flavonoid carbonoside | Isohemiphloin | 28,700 ± 21,500 | 74,200 ± 49,500 | 2.463 | 1.20 | up |
| 8-C-Hexosyl-hesperetin O-hexoside | 20,000 ± 15,700 | 213,000 ± 208,000 | 11.794 | 1.25 | up | |
| Flavanols | Gallocatechin-Gallocatechin | 21,300 ± 17,800 | 113,000 ± 113,000 | 5.775 | 1.25 | up |
| Isoflavones | Calycosin | 62,100 ± 59,700 | 292,000 ± 208,000 | 4.105 | 1.24 | up |
| Sissotrin | 1,930 ± 1,350 | 25,700 ± 19,400 | 13.740 | 1.25 | up | |
| 2′-Hydoxy,5-methoxy Genistein-O-rhamnosyl-glucoside | 43,200 ± 37,900 | 131,000 ± 60,100 | 2.357 | 1.09 | up | |
Terpenoids are also the important metabolites contained in D. delavayi fruit, as revealed in this study. A majority of terpenoids found to be clearly different between ‘GW’ and ‘GX’ were triterpenes (Table 4). In GW, only one triterpene (3-o-trans-feruloyl euscaphic acid) was down-regulated, while the others were up-regulated. The three triterpenes that were up-regulated most significantly include rutundic acid (6.539 fold), myrianthic acid (6.245 fold) and euscaphic acid (4.597 fold) (Fig. 5). These findings indicate an increase in flavonoids and terpenoids.
| Class | Compounds | Peak area | Fold change | VIP( ≥1) | Type | |
|---|---|---|---|---|---|---|
| GW | GX | |||||
| Terpenoids (Triterpene) | Sanguisorbigenin | 41,300 ± 41,200 | 92,000 ± 84,200 | 2.135 | 1.25 | up |
| 2,3-Dihydroxy 5(6),12(13) diene ursolic acid | 159,000 ± 136,000 | 363,000 ± 346,000 | 2.400 | 1.25 | up | |
| Camaldulenic acid | 3,360,000 ± 2,870,000 | 8,010,000 ± 7,680,000 | 2.518 | 1.25 | up | |
| 3 β,19 α- Dihydroxyolean-12-en-28-oic acid | 27,500 ± 25,500 | 54,800 ± 52,900 | 2.031 | 1.25 | up | |
| Rosamultic acid | 1,510,000 ± 1,500,000 | 3,060,000 ± 3,050,000 | 2.031 | 1.26 | up | |
| Ursolic acid-OCH3 | 2,030,000 ± 1,550,000 | 4,200,000 ± 4,000,000 | 2.291 | 1.23 | up | |
| Rutundic acid | 60,600 ± 58,100 | 391,000 ± 385,000 | 6.539 | 1.25 | up | |
| Euscaphic acid | 116,000 ± 107,000 | 525,000 ± 502,000 | 4.597 | 1.25 | up | |
| Arjunic Acid | 191,000 ± 167,000 | 541,000 ± 477,000 | 2.844 | 1.25 | up | |
| 1 β,2 α,3 α,19 α-Tetrahydroxyurs-12 -en-28-oic acid | 15,800 ± 15,500 | 79,600 ± 47,300 | 4.060 | 1.23 | up | |
| Myrianthic acid | 25,700 ± 24,900 | 163,000 ± 153,000 | 6.245 | 1.25 | up | |
| 3-O-Trans-feruloyl euscaphic acid | 51,700 ± 50,300 | 6,630 ± 5,880 | 0.123 | 1.25 | down | |
Discussion
So far, the widely targeted metabolite identification analysis based on UPLC-MS/MS has been conducted for the large-scale metabolite identification of numerous plant species (Oikawa et al., 2015; Wang et al., 2017). The existing research of D. delavayi focuses mainly on only a few metabolites, such as the determination of tannins (Tiep et al., 2018), the extraction of flavonoids (Deng et al., 2014), and the validation of the biological activity (Mao, Li & Li, 2006). In the present study, the UPLC-MS/MS technique was applied to understand the metabolomic differences between unripe D. delavayi and ripe D. delavayi and to conduct the most comprehensive survey of fruit metabolites. Finally, a total of 477 metabolites were identified, among which there were 130 distinct metabolites between unripe and ripe fruit. The data provide a comprehensive analysis of metabolic changes between unripe D. delavayi and ripe D. delavayi. This lays a foundation for the metabolic studies of fruit quality. More importantly, the findings of this study provide reference for fruit tree breeding and contribute new ideas to the planting of high-quality fruit.
Herein, the organic acid content was found lower in unripe D. delavayi than in ripe D. delavayi. This is likely attributable to the fact that most fruits require the consumption of organic acids as a respiratory substrate during ripening, which provides sufficient energy for fruit development (Merewitz et al., 2012; Sui et al., 2017). Notably, the sugar content rises as the fruit matures (Zhao et al., 2016). This phenomenon is reflected as the preferential conversion of starch by external photoassimilates into sugar (Qiu et al., 2020). However, the sugar content remained basically unchanged in ripe and unripe D. delavayi, which is most likely due to D. delavayi being distributed in the low-altitude arid regions in southwest Yunnan (Zhao et al., 2012), and the inhibited sugar synthesis by drought stress during fruit development (Wang et al., 2018). However, a further research is required to reveal the metabolic sugar mechanism of D. delavayi.
In comparison to other Rosaceae fruits, D. delavayi has a higher tannin content (Ben Salem et al., 2017). Tannins are considered to produce anti-inflammatory and antioxidant effects (Parveen et al., 2018), which enhances the anti-inflammatory effects of D. delavayi (Xukun et al., 2014). Therefore, it is applicable as a fruit supplement to improve human health. The pattern of change in amino acid content in D. delavayi is similar to tomato and Loquat (Xu et al., 2019; Polak et al., 2021). In addition, ripe fruit contains more amino acids than unripe fruit, which is likely due to greater maturity and longer daylight hours (Snowden et al., 2015; Zou et al., 2020).
According to our findings, D. delavayi contains plenty of flavonoids and triterpenoids, of which the flavonoids related to nobiletin and tangeretin is most significantly up-regulated. Prior research has demonstrated that these compounds contribute significantly to the colour change of fruit pericarp (Wang et al., 2020; Zhang et al., 2020). Therefore, it is hypothesized in this study that this is one of the reasons why ripe D. delavayi is red or yellow. During the ripening of D. delavayi, the triterpenoids exhibit a similar upward trend to jujube triterpenoids (Song et al., 2020), as discovered in this study. Triterpenoids promote the biosynthesis of the fruit cuticle, which thickens the cuticle during ripening (Snowden et al., 2015). This enhances the protection against biotic and abiotic stresses during ripening, which ensures the integrity of fruit during development (Tafolla-Arellano et al., 2017; Li et al., 2020).
KEGG enrichment analysis was conducted to reveal the most significant differences between ripe and unripe metabolites from the phenolic pathway (flavonoid biosynthesis and flavonol biosynthesis) (GX and GW). A vast majority of the up-regulated compounds as enriched in these pathways have antioxidative and anti-inflammatory properties (e.g., isoquercitrin and astragalin) (Ferrer et al., 2008), which is consistent with the result of prior research on the medicinal quality of D. delavayi. Meanwhile, this provides a reference for future research on the physiology of D. delavayi during development.
Conclusion
Herein, the metabolome is applied to conduct a comprehensive analysis of the metabolic changes between unripe D. delavayi and ripe D. delavayi, which lays a foundation for the metabolic studies of fruit quality. These distinct metabolites are predominantly involved in the biosynthesis and synthesis of secondary metabolites, such as pantothenic acid, flavonoids, and amino acids. Notably, these metabolites are closely related to the medicinal properties of D. delavayi. The findings of the study shed new light on the breeding of fruit trees and the planting of high-quality fruits.