
TMUB1 expression is associated with the prognosis of colon cancer and immune cell infiltration
- Published
- Accepted
- Received
- Academic Editor
- Vladimir Uversky
- Subject Areas
- Cell Biology, Molecular Biology, Gastroenterology and Hepatology, Oncology
- Keywords
- TMUB1, Bioinformatics analysis, Colon cancer, Immune cell infiltration, Clinic prognosis
- Copyright
- © 2023 Lu et al.
- Licence
- This is an open access article distributed under the terms of the Creative Commons Attribution License, which permits unrestricted use, distribution, reproduction and adaptation in any medium and for any purpose provided that it is properly attributed. For attribution, the original author(s), title, publication source (PeerJ) and either DOI or URL of the article must be cited.
- Cite this article
- 2023. TMUB1 expression is associated with the prognosis of colon cancer and immune cell infiltration. PeerJ 11:e16334 https://doi.org/10.7717/peerj.16334
Abstract
Background
TMUB1 is a transmembrane protein involved in biological signaling and plays an important role in the stability and transcription of P53. However, its role in tumor remains unknown.
Methods
Using R language, the expression level of 33 cancer spectrum TMUB1 was analyzed by the public database TCGA, GEO and HPA, the differential expressed gene (DEG) screening and protein interaction (PPI) network was constructed, and the differential genes of TMUB1 in colon cancer were identified. The relevant signaling pathways were identified by gene functional annotation and enrichment analysis. The ssGSEA algorithm in GSVA were used for immune infiltration analysis. The Kaplan-Meier analysis, univariate and multivariate Cox regression analysis, nomogram and calibration map analysis were constructed to evaluate the correlation between TMUB1 expression and clinical prognosis. The expression levels of TMUB1 in intestinal cancer cell lines as well as in 10 intestinal cancer tissues were verified by qPCR experiments.
Results
Through the bioinformatics analysis of multiple databases and preliminary experimental studies, we found that the expression of TMUB1 was significantly increased in colon cancer tumors, and was correlated with the clinical N stage, pathological grade, lymphatic metastasis and BMI of colon cancer. TMUB1 may be involved in the regulation of the malignant progression of colon cancer. Meanwhile, patients with high expression of TMUB1 mRNA had worse OS and DSS, and TMUB1 expression was an independent prognostic factor for OS and DSS. It was further found that highly expressed TMUB1 tissues showed low levels of immune infiltration and stromal infiltration.
Conclusion
We reported the expression level of TMUB1 in colon cancer and analyzed its potential prognostic value in colon cancer through the bioinformatics analysis and preliminary experimental studies. The high expression of TMUB1 is a negative prognostic factor for colon cancer patients. TMUB1 may be a potential target for colon cancer.
Introduction
Colon adenocarcinoma (COAD), the most prevalent histological subtype of colon cancer, primarily affects the intestinal mucosa and metastasises to nearby organs (Wu et al., 2020). Although patients with early colon cancer who underwent radical resection had a 5-year survival rate of more than 90%, most patients were diagnosed with late or metastasised cancer, resulting in a 5-year survival rate that was reduced to 10% (Shah et al., 2016). There has been a significant advancement in the clinical management of colon cancer, which is currently managed through surgery, radiation, chemotherapy, and targeted therapy. However, the patient prognosis is still poor due to late diagnosis, rapid development, and high transfer frequency (Hao et al., 2020). Therefore, exploring the molecular mechanism of colon cancer and determining new biomarkers for survival assessment and targeted therapy are priorities.
Transmembrane and ubiquitin-like (UBL) domain-containing 1 protein (TMUB1), also known as hepatocyte odd protein shuttling, is an encoding protein found in the proliferation process of the liver. TMUB1 comprises 245 amino acids, including a nuclear export signal (NES) at the amino-terminal and a ubiquitin-like region (UBL; 121–175 aa) (Chen et al., 2019). TMUB1 is a transmembrane protein, the N-terminal has a cross-membrane structural domain, and the C-terminal has two cross-membrane structures (Della-Fazia et al., 2021).
It has been reported that TMUB1 can be shuttled between nucleus and cytoplasm and may be transmitted in this way by the nucleus’ biological signals (Castelli et al., 2020). TMUB1’s brain function and its cross-membrane ubiquitin protein are the subjects of most research in the central nervous system (Della-Fazia et al., 2021). Using the Cancer Genome Atlas (TCGA database), Della-Fazia et al. (2021) found increased messenger ribonucleic acid (mRNA) levels of TMUB1 in 17 cancer groups and 21 cancers. It was also reported higher TMUB1 levels in cancerous tissue (colorectal cancer, stomach cancer, and oesophageal cancer) compared with healthy tissues of the digestive system (Della-Fazia et al., 2020). However, research on the biological function of TMUB1 is warranted, and its role in terms of the tumor and mechanism in colon cancer requires further study. In this study, we comprehensively evaluated the prognostic value of TMUB1 expression in COAD patients from the Cancer Genome Atlas (TCGA) database. In addition, TMUB1 expression in COAD was validated using data from GEO database and HPA database. In addition, we performed GSEA function and pathway analyses to further understand the biological mechanism of TMUB1 in the pathogenesis of COAD. We also investigated the correlation between tumbler expression and gene alterations and methylation. In addition, the association of TMUB1 in tumor microenvironment and immune cell infiltration was analyzed. The possible molecular mechanism of TMUB1 interaction with tumorigenesis and tumor immunity was comprehensively analyzed and discussed.
Materials and Methods
Acquisition of bioinformatics analysis data
The TCGA database project (https://portal.gdc.cancer.gov/) was used to download colon cancer (colon) identified by high-throughput sequencing RNA data (each 1 million base fragments (fragments per kilobase million (FPKM) format) and the corresponding clinical pathological information data. Herein, RNA sequencing data was converted from the FPKM format to the transcripts per million reads format. The study was conducted in accordance with TCGA recommendations, and informed consent was obtained before data collection. The Gene Expression Omnibus (GEO) database (http://www.ncbi.nlm.nih.gov/geo/) of the National Centre for Biotechnology Information was used in this study. A colon cancer sample group and a control group (healthy tissue, adjacent non-cancer tissue), with at least 10 samples in each group, were included in the study. Finally, four gene expression profiles (GSE83889, GSE9348, GSE23878, and GSE47756) were selected. R (version 3.6.3) was used for data normalisation and statistical analysis and visualisation. The HPA database (https://www.proteinatlas.org/) retrieved TMUB1 genes for normal colorectal tissue and colorectal cancer tissue. The Institutional Review Board of Shunde Hospital Southern Medical University (The First People’s Hospital of Shunde), approved this study with the approval number 20210730.
Clinical significance of TMUB1 expression in colon cancer
Receiver operating characteristic (ROC) analysis was used to compare TMUB1 expression in colon cancer and the adjacent tissues, and the predictive value of TMUB1 in colon cancer diagnosis was tested. The clinical prognostic information of patients with colon cancer included overall survival (OS) and disease-specific survival (DSS). The prognosis was analysed using Kaplan–Meier (K–M) analysis and univariate and multivariate Cox regression analysis. R package: Survival (version 3.2.10) was used for statistical analysis of survival data (Liu et al., 2018). R package (rms) was used to construct, analyse, and visualise lipograms and calibration diagrams.
Integration of differentially expressed gene screening and construction of a protein–protein interaction (PPI) network
RNA sequencing data in level 3 HTSeq-Counts format for differentially expressed gene (DEG) was identified using R package DESeq2 (version 1.26.0) and ggploT2 (version 3.3.3) (Love, Huber & Anders, 2014). A protein–protein interaction (PPI) network was constructed by analysing the molecular interactions in the TMUB1 protein list through the STRING database (https://cn.string-db.org/), and the relationship of the protein network was displayed (Szklarczyk et al., 2019). R package (igraph) was used for visualisation (Mora & Donaldson, 2011).
TMUB1 functional annotation and Kyoto Encyclopaedia of Genes and Genomes pathway analysis
Gene Ontology (GO) functional annotation and Kyoto Encyclopaedia of Genes and Genomes (KEGG) pathway enrichment analysis were performed for TMUB1. Statistical analysis and visualisation were performed using version R3.6.3. Enrichment analysis was performed using clusterProfiler (version 3.14.3), and visualisation was performed using ggploT2 (Yu et al., 2012).
TMUB1 differential GSEA
Herein, R package’s clusterProfiler was used to perform GSEA to clarify significant functional and pathway differences between the high TMUB1 and low TMUB1 groups. Data sets from MSigDB after the adjustment of P < 0.05 error detection rate, false discovery rate of P < 0.25, and enrichment of standardised scores (—NES—) > 1 were considered significantly enriched.
Correlation analysis of TMUB1 immune infiltration
Immune infiltration analysis of TMUB1 was performed using the single-sample GSEA algorithm in R package, Gene Set Variation Analysis (Bindea et al., 2013). Twenty-four types of infiltrating immune cells were obtained. The correlation between TMUB1 and the enrichment scores of the 24 types of immune cells was analysed using Spearman’s correction method. The enrichment scores of TMUB1 high and low expression groups were analysed using the Wilcoxon rank-sum test.
Cell culture
Human intestinal epithelial cells (NCM460) were cultured in Roswell Park Memorial Institute 1640, comprising 10% foetal bovine serum. Human intestinal carcinoma cells (SW480, RKO, HCT116, LoVo, and HT29) were cultured in Dulbecco’s modified Eagle medium with 10% foetal bovine serum and were incubated at 37 °C, under 5% CO2 and 95% humidity. All cells were procured from CAS Cell Bank.
Tissue specimens
Cancer tissue and adjacent tissue samples were collected from 10 cases. All clinical samples were stored in a liquid nitrogen tank after quick-freezing within 40 min in vitro. All tissue samples used for total RNA extraction had RNA protectants added to them. All tumor samples were approved by the ethics committee of our university, and informed consent was obtained from all patients and received written informed consent from participants of the study. A clinicopathological diagnosis of colorectal cancer was confirmed in the included specimens.
RNA extraction
Total RNA was extracted from tissues using TRIzol reagent (TaKaRa, Tokyo, Japan) as per the manufacturer’s instructions. PrimeScript RT reverse transcription kit (#RR047A, TaKaRa, Tokyo, Japan) was used to reverse transcribe the extracted RNA. The amount of isolated RNA was detected using the SYBR green polymerase chain reaction (PCR) kit (#RR820A, TaKaRa, Tokyo, Japan). Quantitative reverse transcription (qRT)-PCR was performed using the cfX-96 coupled real-time fluorescence quantitative system (No. 788BR07388 Bio-Rad, Hercules, CA, USA).
The primer sequences used were as follows:
5′-CTACCTCATGAAGATCCTCACCGA-3′(beta-actin, forward)
5′-TTCTCCTTAATGTCACGCACGATT’ (beta-actin, reverse)
5′-GTGTCCACGAGAGTCGGTC’ (TMUB1, forward)
5′-AGGGCCGGTACTGGATCTG-3′(TMUB1, reverse)
Statistical methods
Statistical analysis was performed using GraphPad Prism 8. The two sets of data were compared using an unpaired two-tail test. The chi-square test and rank-sum test were used to compare parameters. The correlation between variables was evaluated using Spearman’s correlation analysis. The relationship between the TMUB1 expression level and clinical features was analysed using univariate logistic regression. P < 0.05 was considered statistically significant (*, P < 0.05; **, P < 0.01; ***, P < 0.001).
Results
TMUB1 expression in colon cancer and other tumors
The TCGA database showed that TMUB1 mRNA levels were highly expressed in different tumors. Among the 33 tumor types, TMUB1 was significantly overexpressed in 23 tumors (Fig. 1A), particularly in gastrointestinal tumors (cholangiocarcinoma, colon adenocarcinoma, oesophageal carcinoma, liver hepatocellular carcinoma, rectum adenocarcinoma, and stomach adenocarcinoma). Similarly, TMUB1 was found to be significantly overexpressed in gastrointestinal tumors in paired samples (Fig. 1B). Particularly, TMUB1 expression was significantly higher in colon cancer tumors than in pericancerous tissues (Fig. 1C) and in paired tumors than in normal tissues (N = 41) (Fig. 1D).
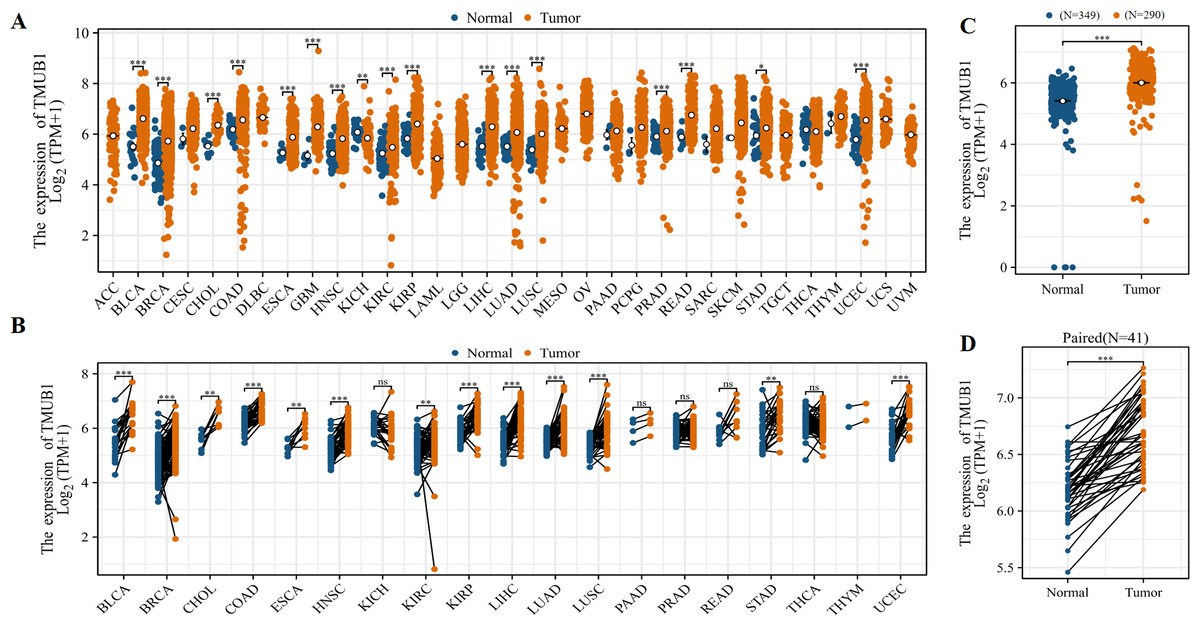
Figure 1: Expression of TMUB1 in colon cancer and other tumors.
(A) Expression of TMUB1 in pan-carcinoma. (B) Expression of TMUB1 in pancancerous paired samples. (C) Expression of TMUB1 in COAD. (D) Expression of TMUB1 in COAD paired samples. (*P < 0.05; ** P < 0.01; *** P < 0.001; ns P > 0.05, vs Normal).
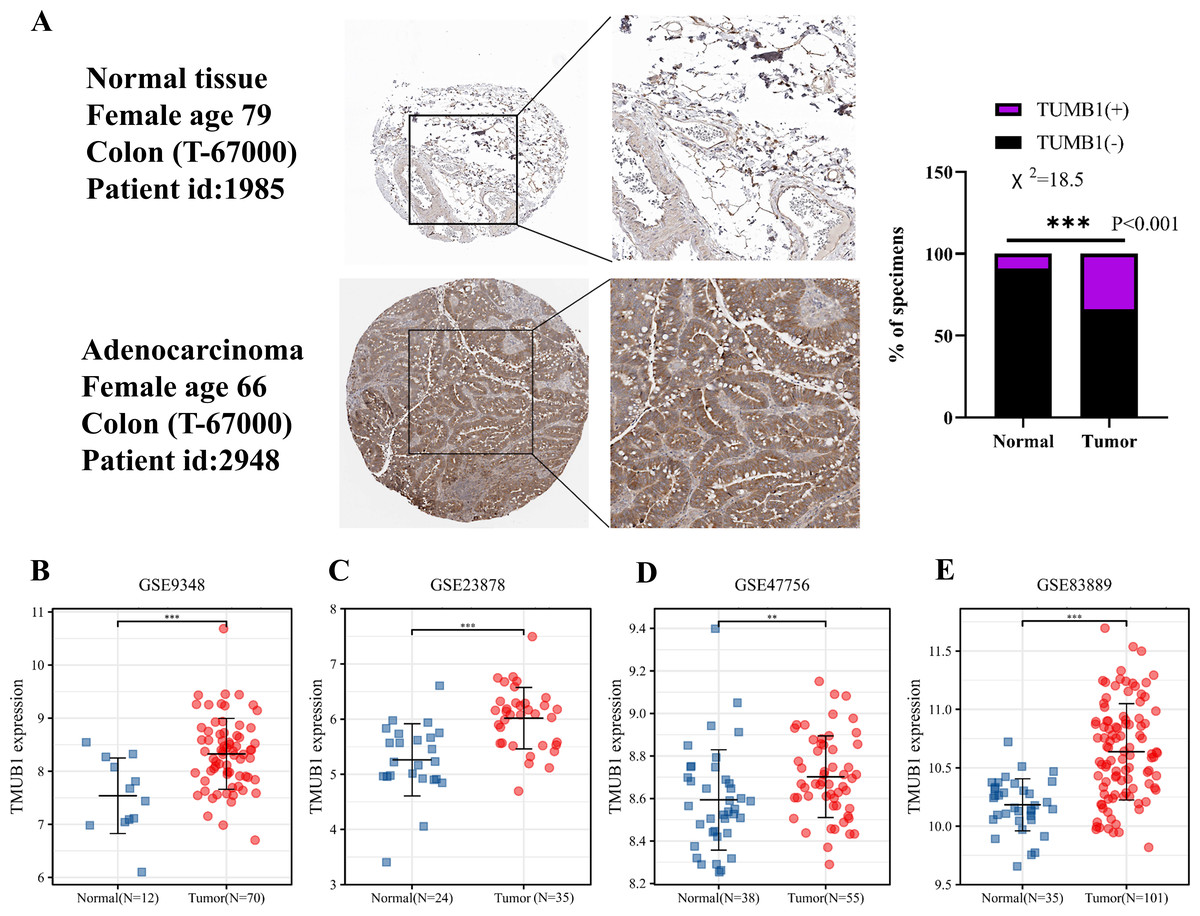
Figure 2: Expression of TMUB1 in HPA database and GEO database.
(A) TMUB1 protein was significantly overexpressed in colon cancer tissues according to HPA database (*** P < 0.001). (B) (E) Expression of TMUB1 in GEO database. (B) GSE9348 (*** P < 0.001); (C) GSE23878 (*** P < 0.001); (D) GSE47756 (** P < 0.01); (E) GSE83889 (*** P < 0.001).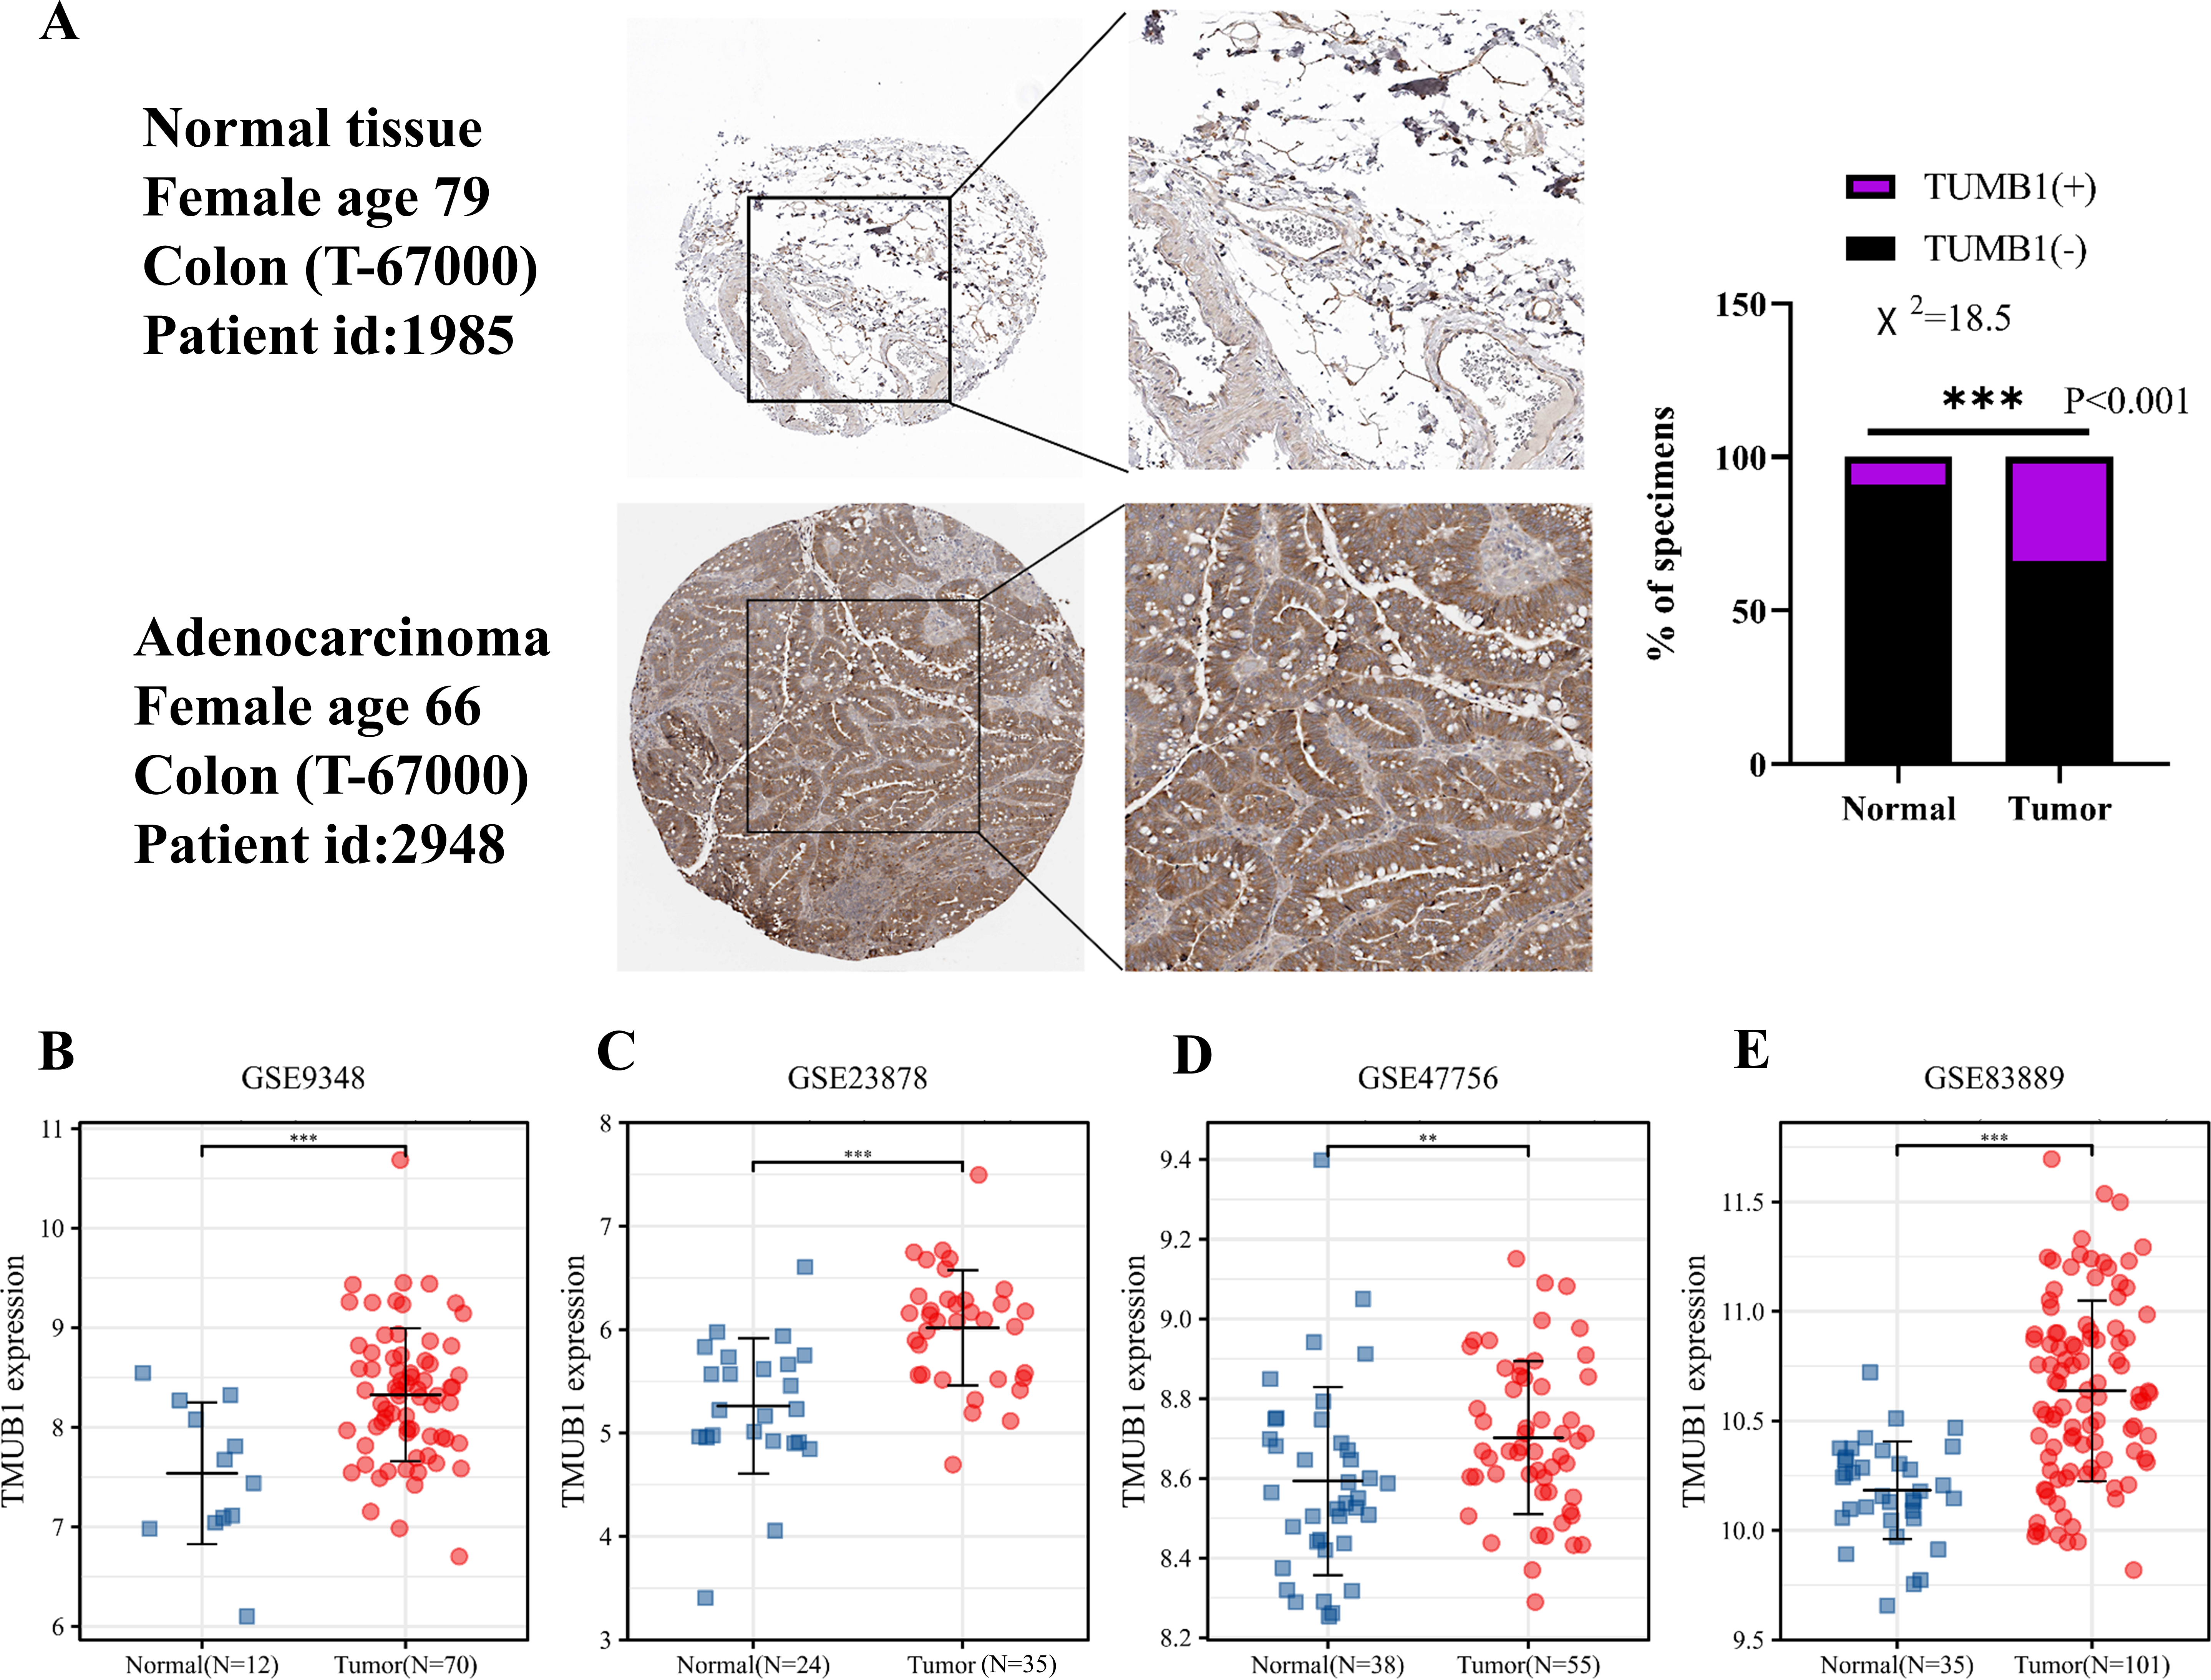
TMUB1 expression in the HPA and GEO databases
The HPA database revealed that TMUB1 was significantly overexpressed in colon cancer tissues. In the HPA database, deeper immunohistochemical staining of cancer tissues compared with normal tissues was observed, suggesting that TMUB1 was significantly overexpressed in colon cancer tissues (Fig. 2A). The GEO database data sets (GSE9348, GSE23878, GSE47756, and GSE83889) revealed that TMUB1 expression in colon cancer was significantly higher than that in normal tissues (Figs. 2B–2E).
Clinical characteristics of TMUB1 in COAD and prediction of its diagnostic and prognostic value
| Characteristic | Low expression of TMUB1 | High expression of TMUB1 | p |
|---|---|---|---|
| n | 239 | 239 | |
| Gender, n (%) | 0.647 | ||
| Female | 116 (24.3%) | 110 (23%) | |
| Male | 123 (25.7%) | 129 (27%) | |
| Age, n (%) | 0.020 | ||
| ≤65 year | 110 (23%) | 84 (17.6%) | |
| >65 year | 129 (27%) | 155 (32.4%) | |
| Weight, n (%) | 0.543 | ||
| ≤90 kg | 117 (42.9%) | 72 (26.4%) | |
| >90 kg | 48 (17.6%) | 36 (13.2%) | |
| T stage, n (%) | 0.168 | ||
| T1 | 2 (0.4%) | 9 (1.9%) | |
| T2 | 44 (9.2%) | 39 (8.2%) | |
| T3 | 160 (33.5%) | 163 (34.2%) | |
| T4 | 32 (6.7%) | 28 (5.9%) | |
| N stage, n (%) | 0.207 | ||
| N0 | 151 (31.6%) | 133 (27.8%) | |
| N1 | 51 (10.7%) | 57 (11.9%) | |
| N2 | 37 (7.7%) | 49 (10.3%) | |
| M stage, n (%) | 0.012 | ||
| M0 | 178 (42.9%) | 171 (41.2%) | |
| M1 | 22 (5.3%) | 44 (10.6%) | |
| Pathologic stage, n (%) | 0.025 | ||
| Stage I | 42 (9%) | 39 (8.4%) | |
| Stage II | 103 (22.1%) | 84 (18%) | |
| Stage III | 66 (14.1%) | 67 (14.3%) | |
| Stage IV | 22 (4.7%) | 44 (9.4%) | |
| Perineural invasion, n (%) | 1.000 | ||
| No | 84 (46.4%) | 51 (28.2%) | |
| Yes | 29 (16%) | 17 (9.4%) | |
| Lymphatic invasion, n (%) | 0.001 | ||
| No | 152 (35%) | 114 (26.3%) | |
| Yes | 68 (15.7%) | 100 (23%) | |
| CEA level, n (%) | 0.921 | ||
| ≤5 μg/L | 96 (31.7%) | 100 (33%) | |
| >5 μg/L | 51 (16.8%) | 56 (18.5%) | |
| BMI, n (%) | 0.446 | ||
| <25 kg/m2 | 57 (22.3%) | 30 (11.7%) | |
| ≥25 kg/m2 | 101 (39.5%) | 68 (26.6%) |
We studied the clinicopathological features of TMUB1 expression in COAD patients with differential topoisomerase II β-binding protein 1 interacting checkpoint and replication regulator expression, as shown in Table 1. The value of TMUB1 in the differential diagnosis of COAD was proven using the ROC curve. An area under the curve (AUC) of 0.845 indicated that TMUB1 was highly sensitive and specific in diagnosing colon cancer (Fig. 3A). K–M analysis verified the prediction of clinical survival using TMUB1, with a statistical significance in OS (Fig. 3B) (hazard ratio (HR) =1.98, P = 0.002) and DSS (Fig. 3C) (HR =2.23, P = 0.003). A poor prognosis was observed in colon cancer patients with a high TMUB1 expression than in those with a low TMUB1 expression. Table 2 presents the correlation between TMUB1 expression and the clinicopathological features analysed using logistic regression. High TMUB1 expression was associated with a high risk ratio in M-stage COAD (odds ratio (OR) = 2.082 [1.210–3.675], P = 0.009), clinicopathological advanced stage (OR = 1.487 [1.029–2.153], P = 0.035), and lymphatic metastasis.
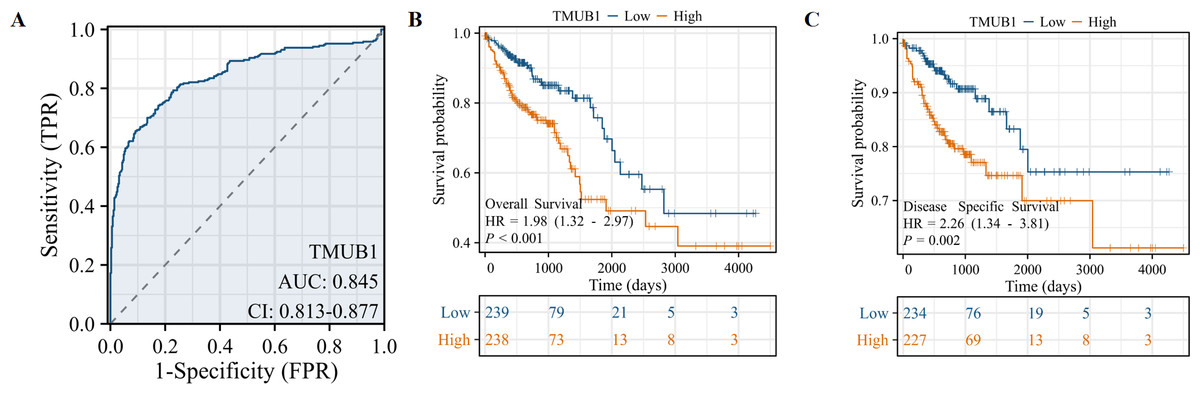
Figure 3: Prediction of TMUB1 in the diagnosis and prognosis of COAD.
(A) The value of TMUB1 in the diagnosis of COAD was tested by ROC curve (AUC = 0.845). (B) Prediction of OS survival (HR = 1.98, P = 0.002). (C) Prediction of DSS survival (HR = 2.23, P = 0.003).
| Characteristics | Total (N) | Odds ratio (OR) | P value |
|---|---|---|---|
| T stage (T3&T4 vs. T1&T2) | 477 | 0.953 (0.606–1.498) | 0.836 |
| N stage (N1&N2 vs. N0) | 478 | 1.368 (0.949–1.975) | 0.094 |
| M stage (M1 vs. M0) | 415 | 2.082 (1.210–3.675) | 0.009 |
| Pathologic stage (Stage III&Stage IV vs. Stage I&Stage II) | 467 | 1.487 (1.029–2.153) | 0.035 |
| Perineural invasion (YES vs. NO) | 181 | 0.966 (0.476–1.916) | 0.921 |
| Lymphatic invasion (YES vs. NO) | 434 | 1.961 (1.327–2.911) | <0.001 |
The significance of TMUB1 in the clinical prognosis using univariate Cox regression analysis
The results of the univariate Cox regression analysis results based on the OS (Fig. 4A) and Table S1 showed that high TMUB1 expression was associated with a higher risk of clinically adverse prognostic factors. TMUB1 was a significant risk factor for clinical T3 and T4 stages (HR = 3.072, P = 0.004); N1 and N2 (HR = 2.592, P < 0.001); M1 (HR = 4.193, P < 0.001); Stages III and IV (HR = 2.947, P < 0.001); the presence of lymphatic invasion (HR = 2.450, P < 0.001). The prognosis based on the DSS has the same results (Fig. 4B). Further multivariate Cox regression analysis of the OS showed (Fig. 4C) revealed that high TMUB1 expression was an independent risk factor for OS (HR = 1.917, P = 0.009). Similarly, high TMUB1 expression was observed in clinical T3 and T4 stages (HR = 3.332, P = 0.047), M1 (HR = 1.906, P = 0.03), and stages II and IV (HR =4.232, P = 0.021). Another independent risk factor was the presence of lymphatic invasion (HR = 1.771, P = 0.034). TMUB1 had a significant predictive power for DSS (Fig. 4D, Table S2).
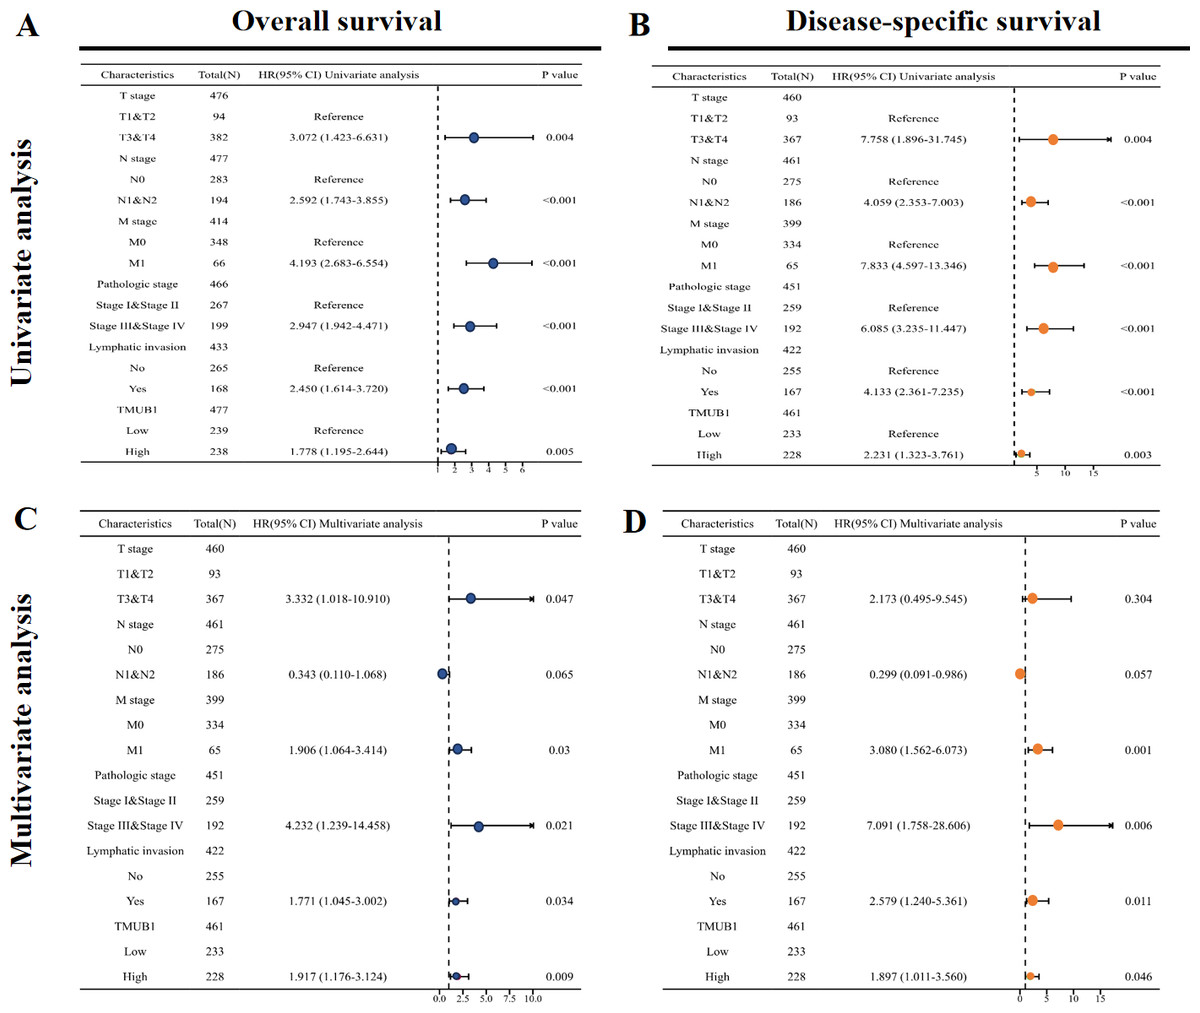
Figure 4: Significance of univariate and multivariate Cox regression analysis for clinical prognosis of TMUB1.
(A) Univariate Cox regression analysis based on OS. (B) Univariate Cox regression analysis based on DSS. (C) Multivariate Cox regression analysis based on OS. (D) Multivariate Cox regression analysis based on DSS.
The predictive value of TMUB1 in the diagnosis and prognosis of colon cancer
Clinical T stage, M stage, pathological stage, lymphatic metastasis, and TMUB1 expression were constructed, and calibration curves were drawn to test the validity of the OS rolograms. The results revealed that the c-index of the OS rate of colon cancer was 0.747 (Fig. 5A). This helped predict the OS rate of colon cancer at 1 and 3 years in addition to predicting the prediction OS rate at 5 years (Figs. 5B, 5C, and 5D). Similarly, the M stage, the pathological stage, lymphatic metastasis, and TMUB1 expression were used to construct the linear DSS prediction graph, and the c-index was 0.813 (Fig. 5E). Calibration curves revealed relatively accurate predictions of the clinical outcomes at 1, 3, and 5 years (Figs. 5F, 5G, and 5H). Similarly, in Fig. S1, DSS is also well predicted (Fig. S1).
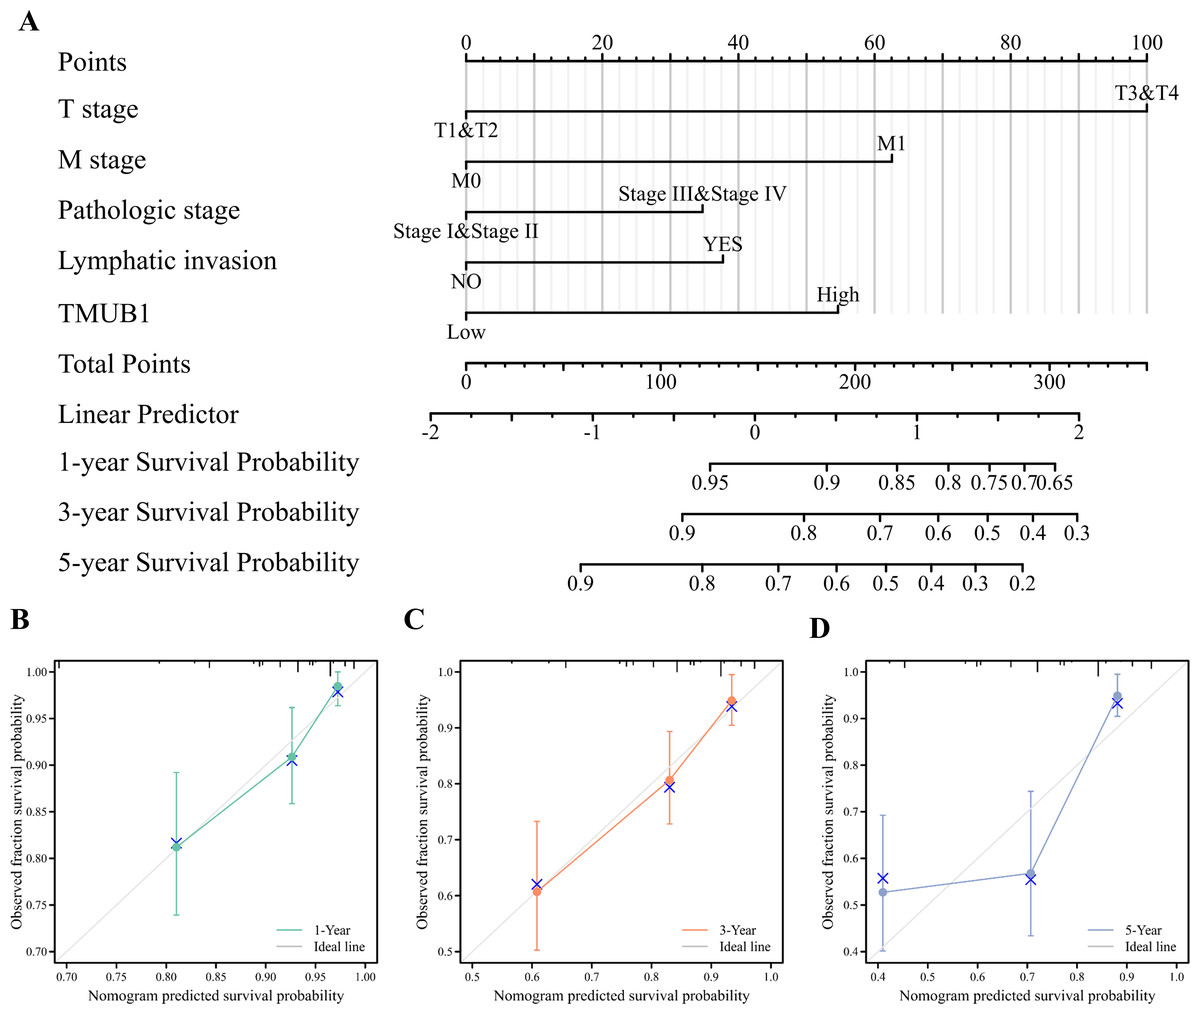
Figure 5: The predictive value of TMUB1 in the diagnosis and prognosis of colon cancer.
(A) Prognostic nomogram of TMUB1 based on overall survival. (B–D) Calibration curves of overall survival at year 1, year 3, and year 5. (E) Prognostic nomogram of TMUB1 based on OS. (F–H) Calibration curves of disease-specific survival at year 1, 3, and 5.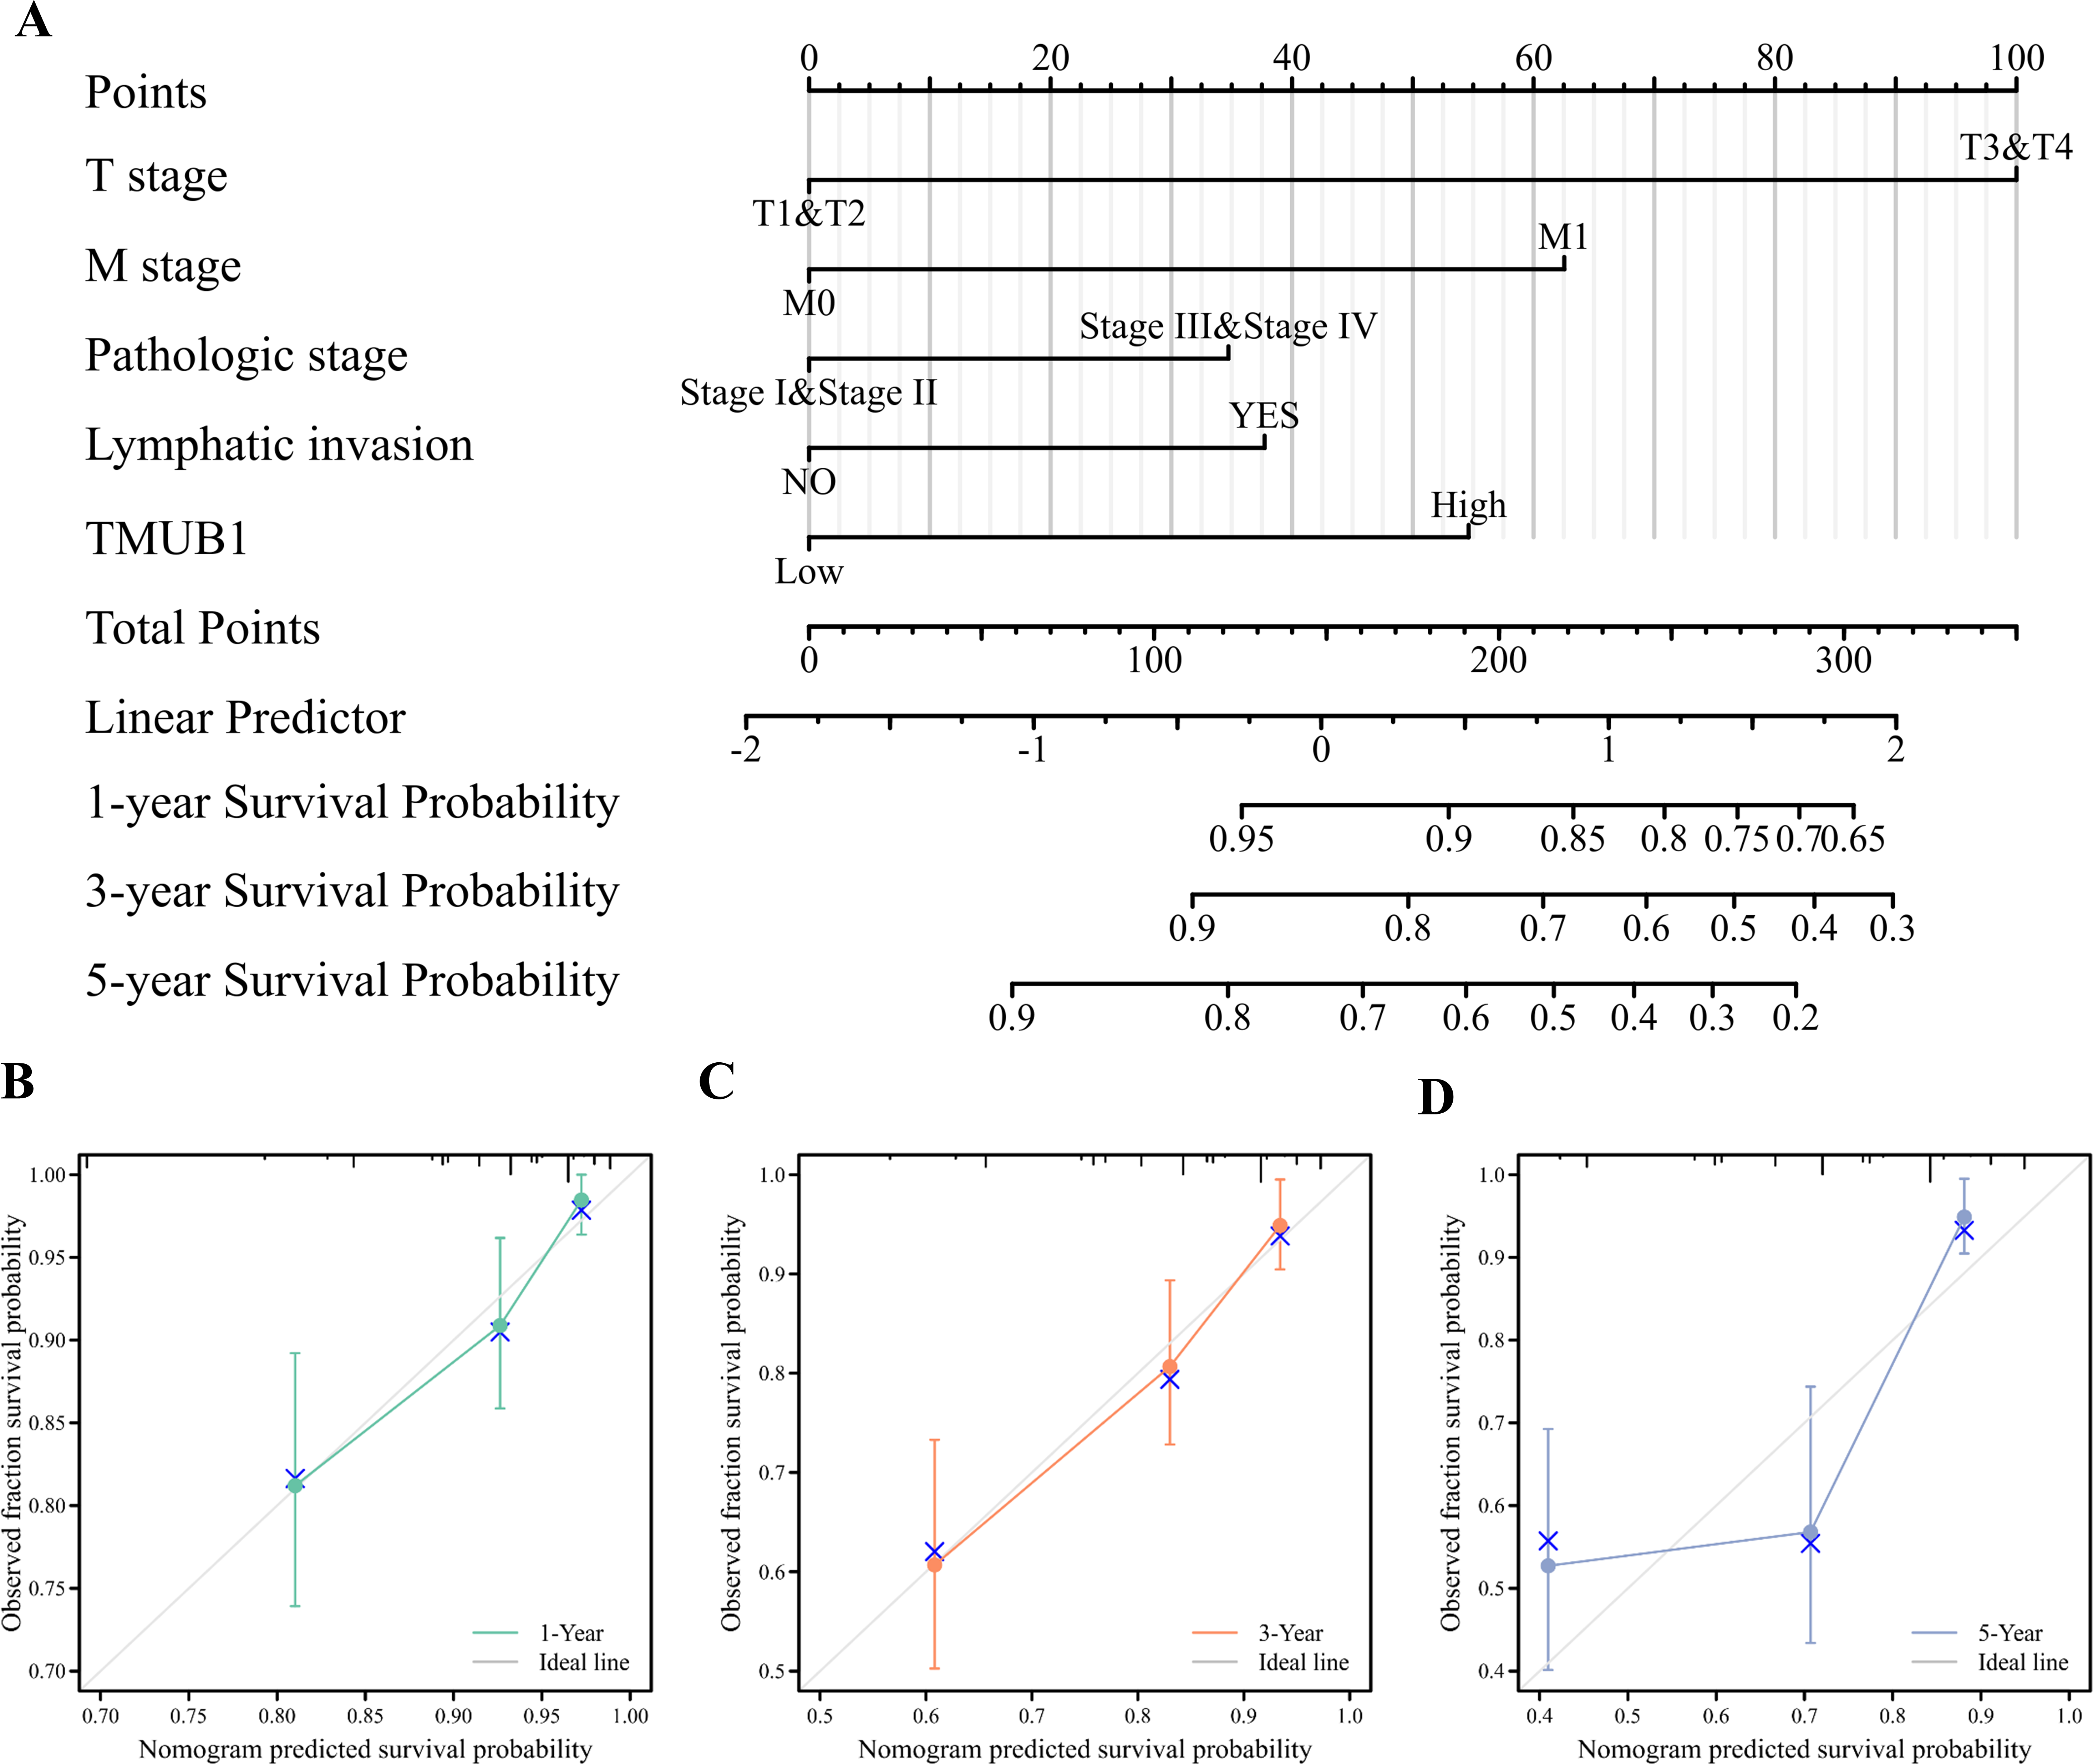
TMUB1 in the clinical prognosis subgroup of colon cancer
The prognostic subgroups of TMUB1 in terms of colon cancer OS and DSS were further evaluated. In the clinical subgroup K–M OS analysis, clinical T3 and T4 staging (HR = 2.35, P = 0.001), pathological stage (HR = 1.95, P = 0.010), age (HR = 2.08, P = 0.003), body mass index (BMI) (HR = 3.21, P = 0.011), and body weight (HR = 8.71, P = 0.041) revealed a poor prognosis of TMUB1 with high expression (Fig. 6A). Similarly, in the clinical subgroup K–M DSS analysis, clinical T3 and T4 staging (HR = 2.61, P = 0.001), N1 and N2 (HR = 2.06, P = 0.018), pathological staging (HR = 2.49, P = 0.003), and age (HR = 2.27, P = 0.015) revealed a prognosis of TMUB1 with high expression (Fig. 6B).
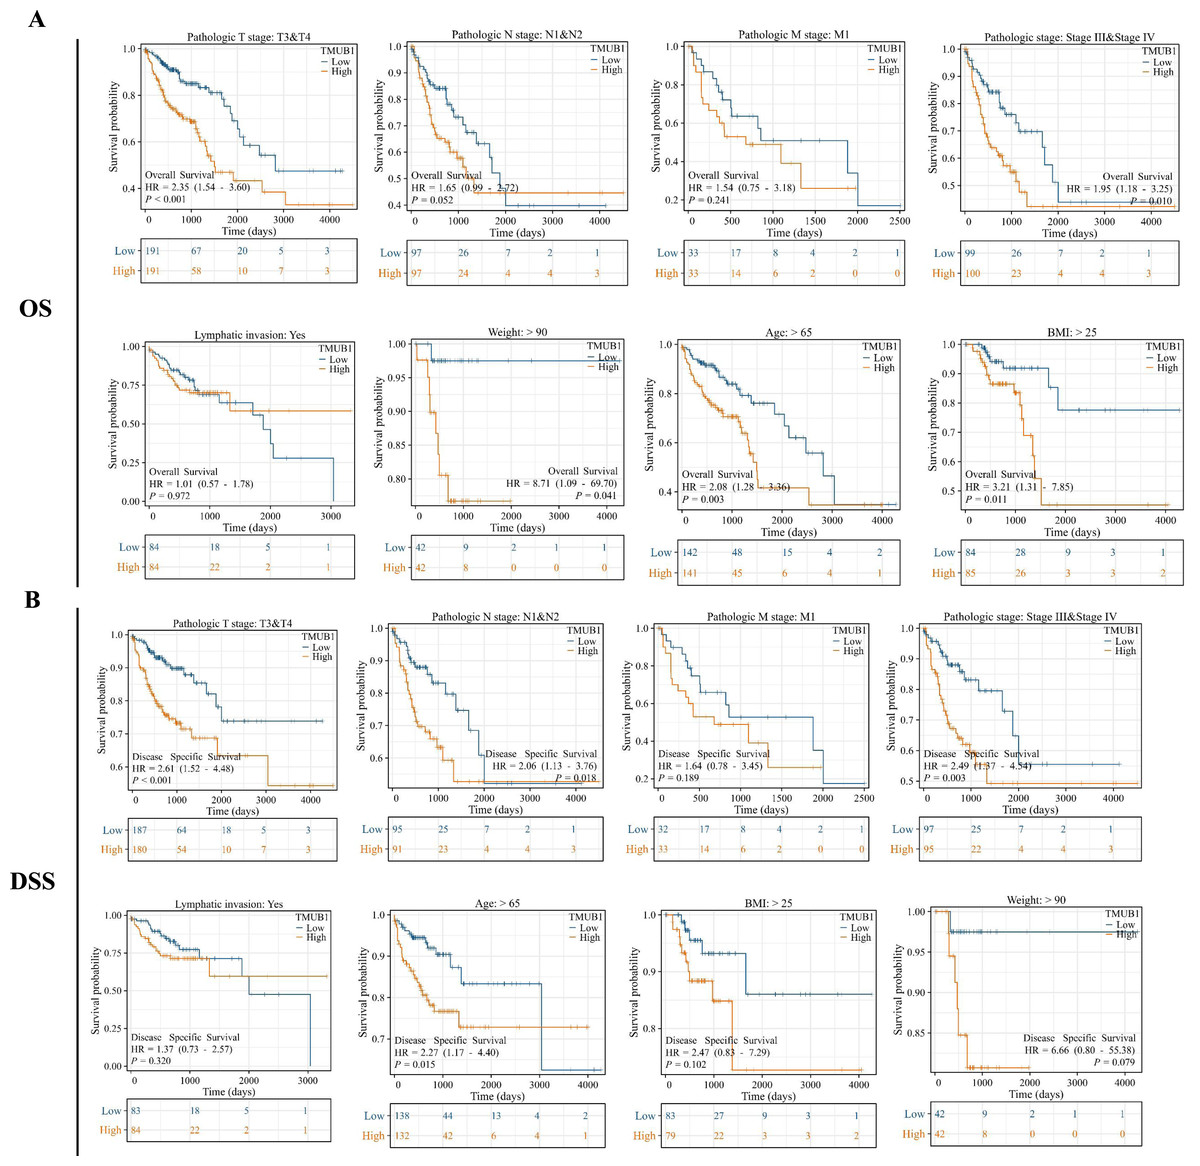
Figure 6: TMUB1 prediction of clinical subgroup diagnosis and prognosis of colon cancer.
(A) Clinical subgroup K–M analysis of overall survival; (B) Clinical subgroup K–M analysis of disease-specific survival.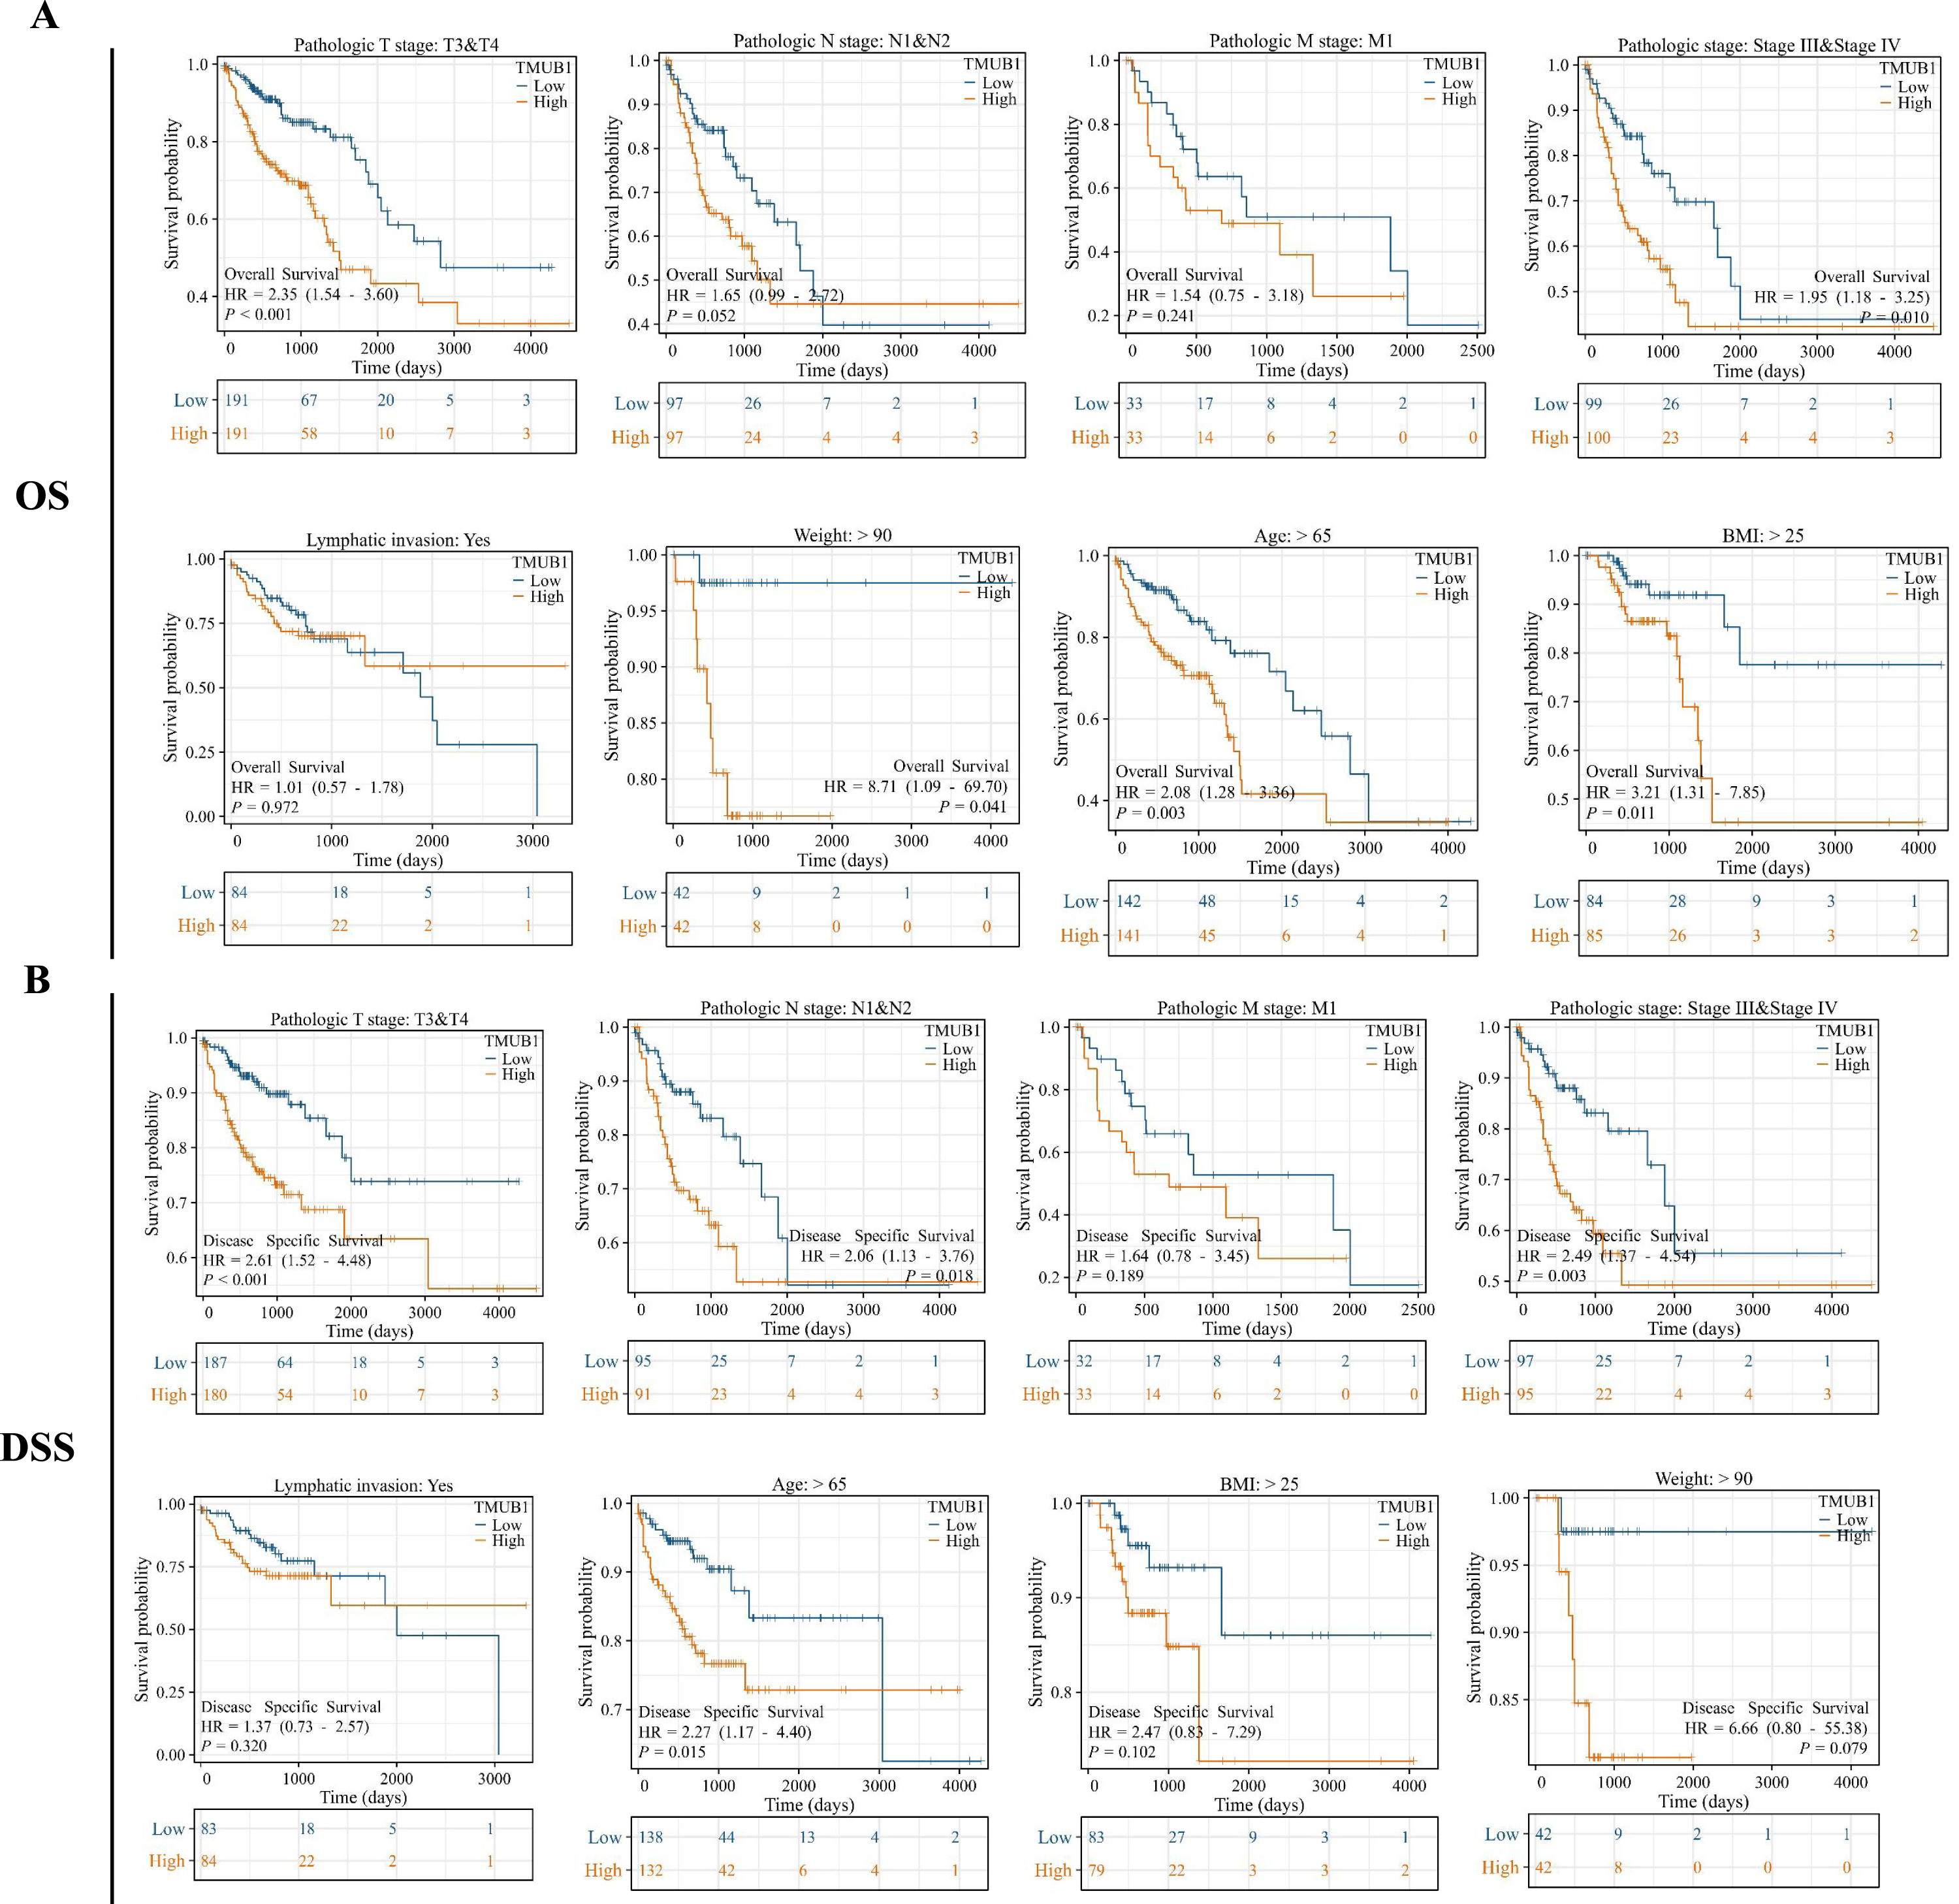
DEGs, co-expressed genes, and a PPI network of TMUB1 in the TCGA in colon cancer
Variance analysis with volcanic figure illustrated —log2 (FC)— > 1 and p.adj < 0.05. Number of molecules at the threshold of 0.05. Volcano shows meet —log2 (FC)— > 1 & p.adj < 0.05. The 0.05 threshold had 1172 ids. Under this threshold, 128 ids had high expression (logFC positive) and 1,044 ids had low expression (logFC negative) (Fig. 7A). The top 10 genes positively and negatively associated with TMUB1 are illustrated in the co-expression heat map (Fig. 7B). The top 20 interacting proteins associated with TMUB1 by constructing PPI protein interaction networks are as follows: transmembrane protein (TMEM) 126A, autocrine motility factor receptor, family with sequence similarity 3 metabolism-regulating signalling molecule C, TMEM209, endoplasmic reticulum lipid raft-associated protein (ERLIN) 2, glutamate receptor interacting protein 1, saccharopine dehydrogenase, calcium-modulating ligand, ERLIN1, ring finger protein 139, TMEM53, protein interacting with C kinase-1, cleft lip and palate transmembrane protein 1, ubiquitin-associated domain-containing protein 2, fas associated factor family member 2, calsyntenin 3, E3 ubiquitin-protein ligase synoviolin, chromosome 17 opening reading frame 62, NCLN, and nurium (Fig. 7C).
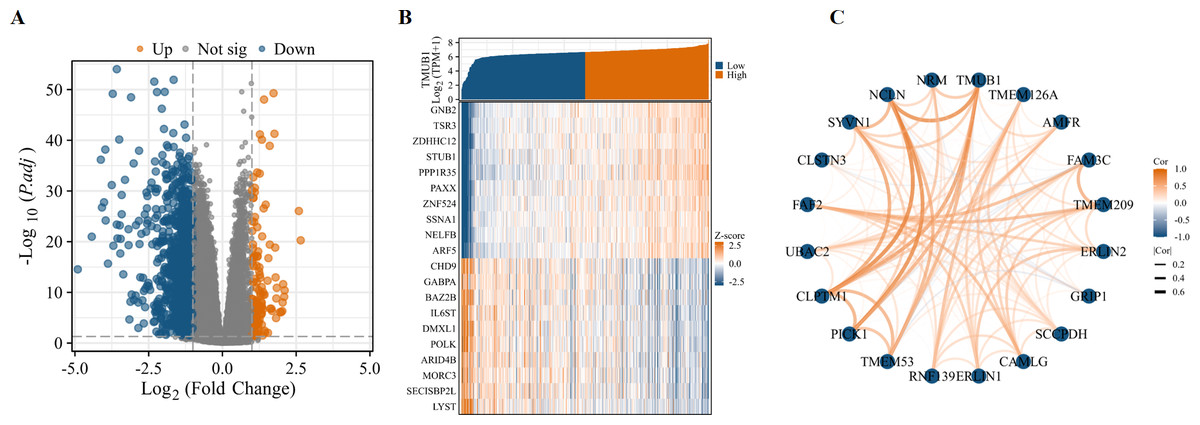
Figure 7: Differentially expressed genes and PPI network of TMUB1 in colon cancer.
(A) Differential genes for TMUB1 in colon cancer, as shown in the volcano map. (B) TMUB1 co-expressing gene; (C) TMUB1-related top 20 interacting proteins in the PPI network.
Functional enrichment analysis of TMUB1
By identifying differential genes, functional annotation analyses were performed, including bioprocess, cellular component, and molecular function of three types of GO and the KEGG pathway enrichment analyses. The findings of the GO analysis revealed that TMUB1 was involved in ion transport, ion channel regulation, intercellular adhesion, and extracellular matrix composition (Fig. 8A). The KEGG analysis revealed that the neuroactive ligand–receptor interaction pathway, the calcium signalling pathway, the cyclic adenosine monophosphate signalling pathway, and the extracellular matrix (ECM)-receptor signalling pathways such as the interaction pathway were significantly enriched (Fig. 8B). The following TMUB1-related signalling pathways were identified by GSEA through comparative differential gene analysis: the insulin pathway, bladder cancer, glutathione metabolism, deoxyribonucleic acid (DNA) methylation, signalling by notch, and cell cycle checkpoints (Fig. 8C).
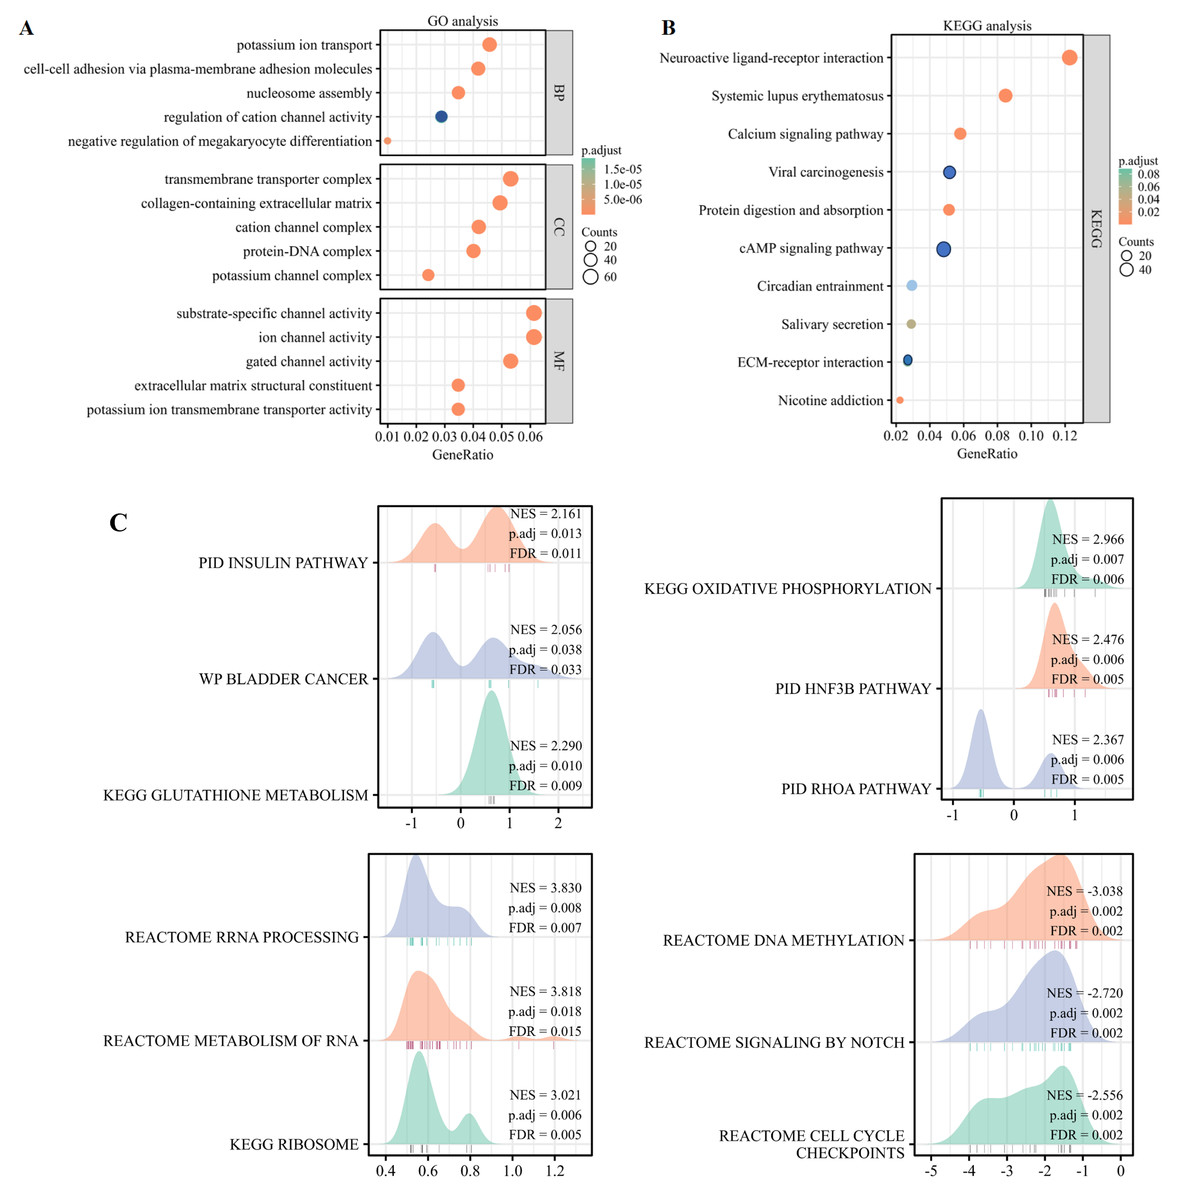
Figure 8: Functional enrichment analysis of TMUB1.
(A) Gene Ontology analysis of TMUB1 in colon cancer; (B) KEGG analysis of TMUB1 in colon cancer; (C) TMUB1-related signaling pathway recognized by GSEA.
Correlation analysis of TMUB1 immune function in colon cancer
The degree of TMUB1 immune infiltration in colon cancer was examined, and it was discovered that TMUB1 was associated with a variety of immune cells. Figure 9A shows that TMUB1 was positively correlated with CD56bright natural killer cells and other cells (R = 0.268, P < 0.001), and negatively correlated with T helper cells (R = − 0.407, P < 0.001), central memory T (Tcm) cells (R = − 0.387, P < 0.001), and macrophages (R = −0.238, P < 0.001). The immune infiltration and matrix scores were evaluated after TMUB1 was divided into high-low expression groups, and the results revealed that the immune infiltration and matrix component scores of high-expression TMUB1 were lower (Fig. 9B). Meanwhile, high-expression TMUB1 in colon cancer showed lower infiltration levels in T helper cells, Tcm cells, T helper 2 (Th2) cells, and macrophages (Fig. 9C).
Figure 9: Correlation analysis of immune function of TMUB1.
(A) TMUB1 and immune cell infiltration; (B) Scores of TMUB1 and immune invasion and stromal invasion; (C) Comparison chart of different immune cell groups.
TMUB1 methylation level in colon cancer
We assessed the TMUB1 methylation levels in colon cancer. The results revealed lower levels of methylation in colon cancer compared with normal tissues (Fig. 10A). Through Illumina methylation 450 (high-throughput methylation chip detection platform) and Spearman’s correlation analysis, it was observed that in RNA sequencing data of colon cancer, TMUB1 expression was negatively correlated with the beta corresponding to the methylation probe CG7847101 (R = − 0.329, P < 0.001) (Fig. 10B). Among other features, lower TMUB1 methylation levels in colon cancer were observed in TP53 mutations, adenocarcinoma categories, clinicopathological stage III/VI, and increased age (Figs. 10C–10F).
Figure 10: Methylation levels of TMUB1 in different features of colon cancer.
(A) Methylation level of TMUB1 in colon cancer (normal VS tumor); (B) The expression of TMUB1 was correlated with the methylation probe CG7847101; (C) TMUB1 methylation and TP53 mutation in colon cancer; (D) TMUB1 methylation level and colon cancer tissue type; (E) TMUB1 methylation level and pathological stage in colon cancer; (F) TMUB1 methylation level and age group in colon cancer.
qRT-PCR for verifying TMUB1 expression levels in different colorectal cancer cell lines and tissues
To determine their expression levels in comparison to normal intestinal epithelial cells, human intestinal epithelial cells (NCM460) and human intestinal carcinoma cells (SW480, HCT116, RKO, LoVo, and HT29) were cultured. It was found that TMUB1 expression in most intestinal carcinoma cells was higher than that in normal NCM460 cells (Fig. 11A). At the same time, paired colorectal cancer tissues from 10 patients were collected. Of the 10 paired colorectal cancer tissues (Fig. 11B), eight pairs had TMUB1 expression levels higher than normal, while the remaining two pairs showed no difference (NATs: Normal Tissue Around tissues; tumor tissue).
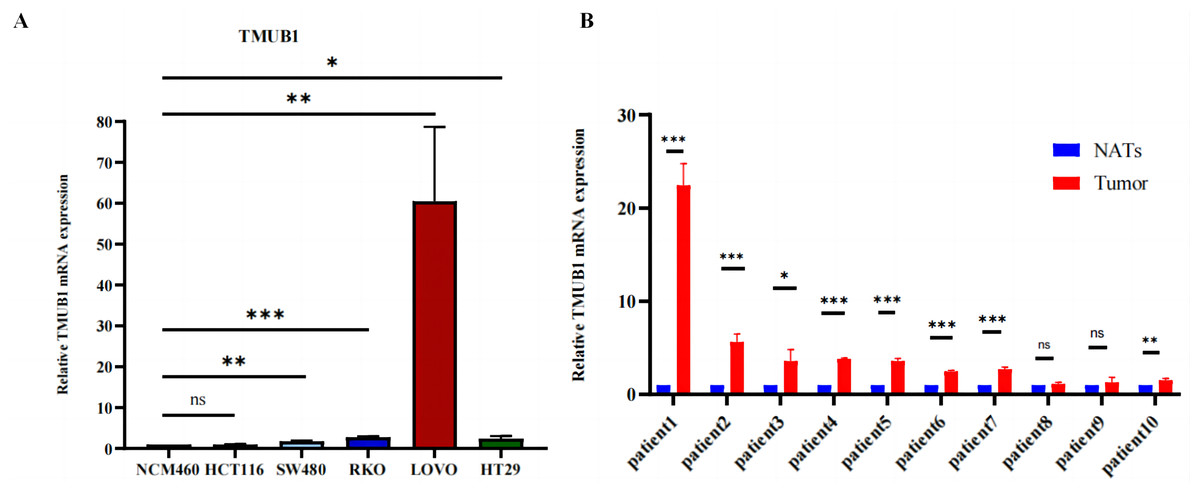
Figure 11: The expression level of TMUB1 mRNA.
(A) The expression of TMUB1 in SW480, HCT116, CACO2, RKO, LOVO and HT29 cells was higher than that in NCM460 cells. (B) The expression level of TMUB1 in 8 of 10 paired colorectal cancer tissues was higher than that in normal tissues. (A) * P < 0.05; ** P < 0.01; *** P < 0.001; ns P < 0.05, vs NCM460; (B) *P < 0.05; ** P < 0.01; *** P < 0.001; ns P < 0.05, vs normal tissues.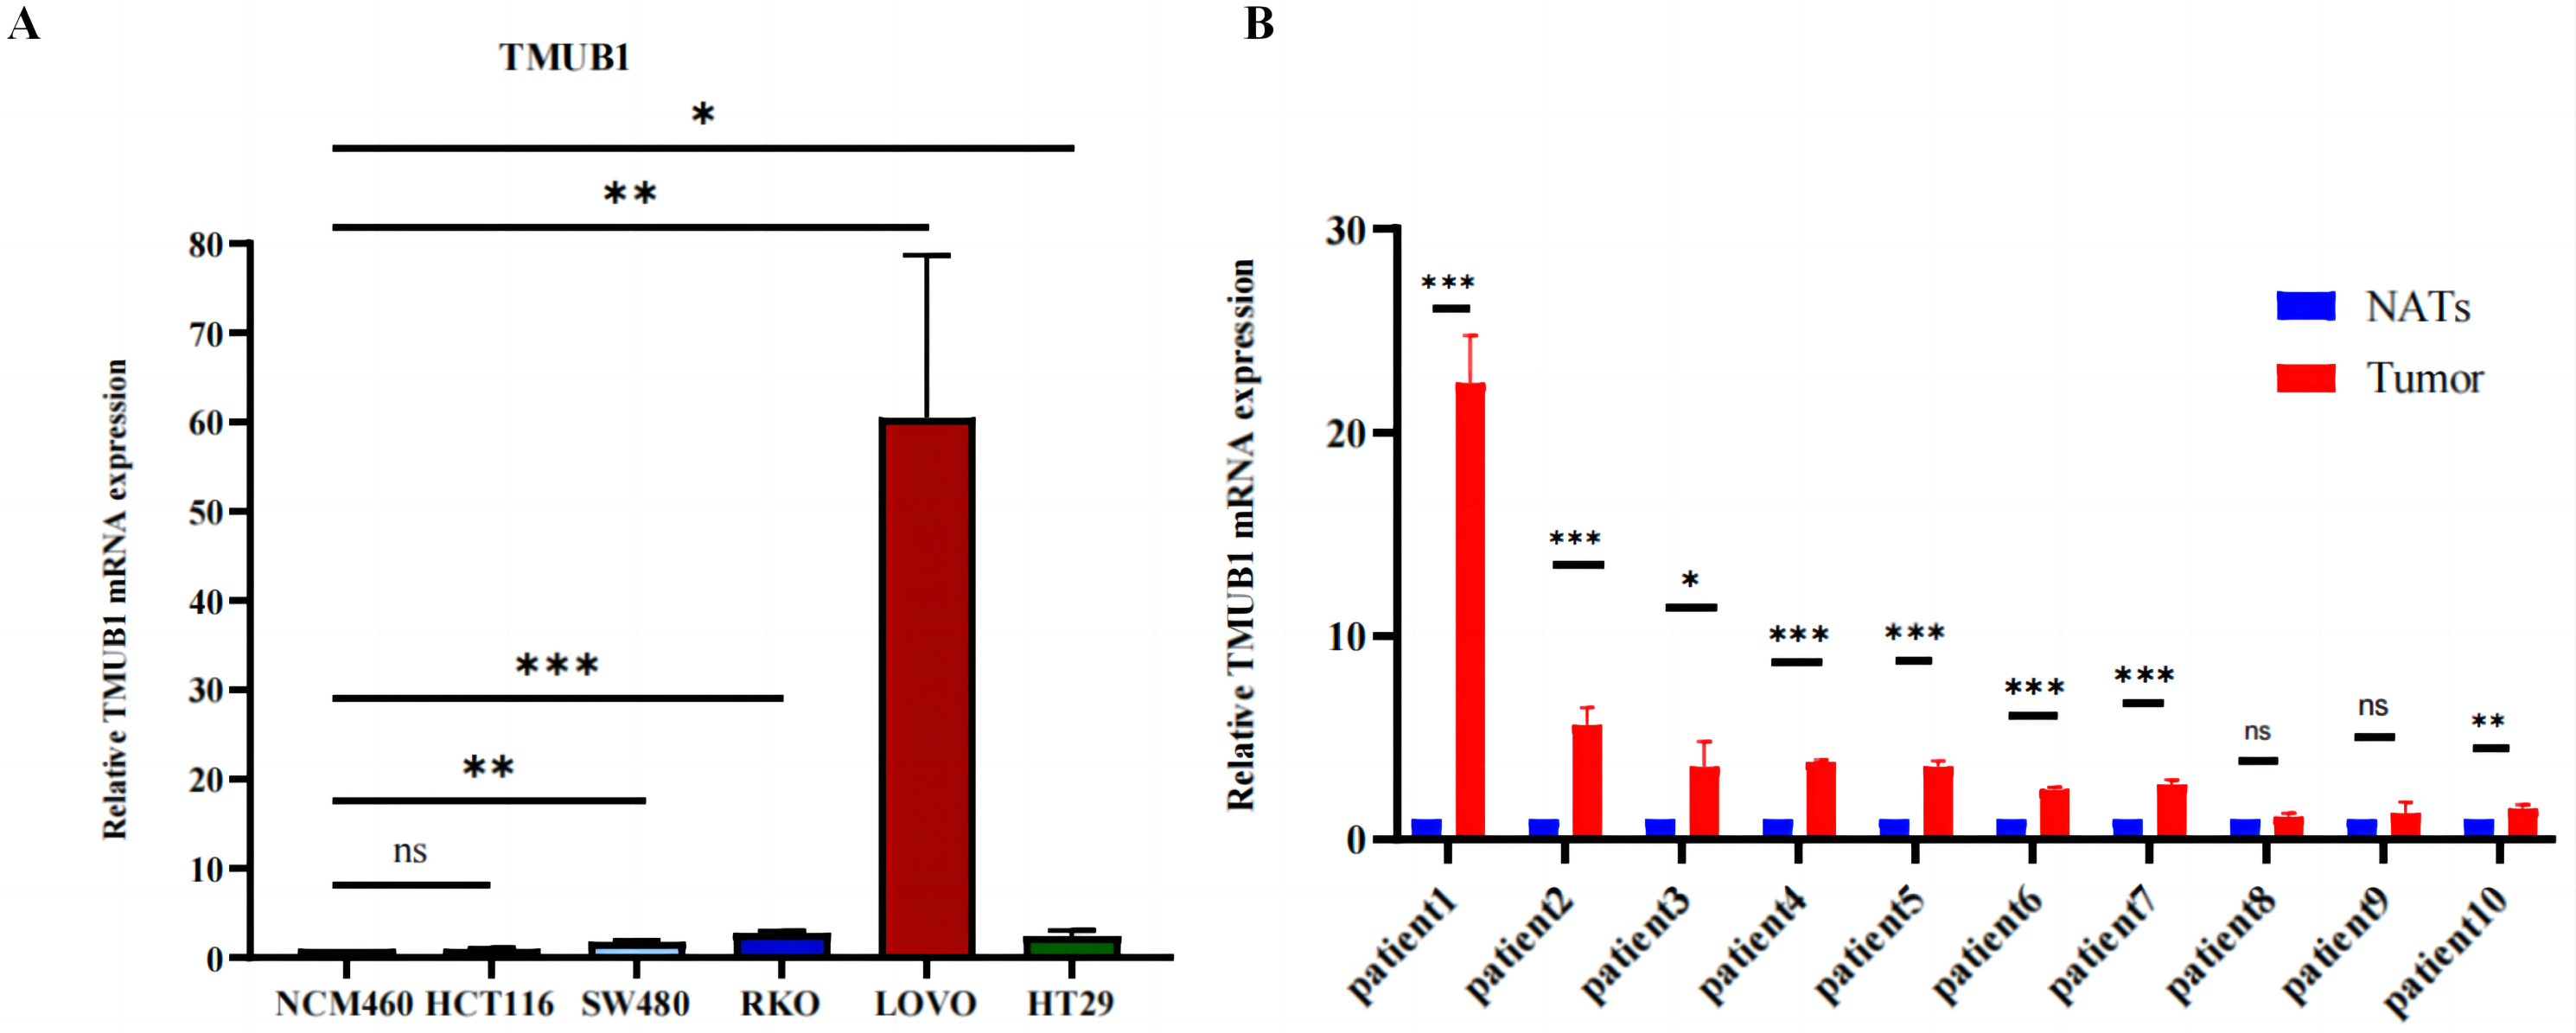
Discussion
COAD is a common malignant tumor. With current treatments, the therapeutic effect of COAD is far from satisfactory. Therefore, the search for stable potential biomarkers is essential to predict prognosis and guide individualized treatment. In this study, TMUB1 was significantly overexpressed in most tumors in the TCGA data. Further analysis showed that TMUB1 expression was significantly increased in colon cancer tumors. This result was also confirmed in GEO (colon cancer independent datasets GSE83889, GSE164191, etc.) and HPA data. ROC analysis of TMUB1 expression may be a good diagnostic marker in colon cancer with an AUC of over 0.8. In further analysis of prognosis and clinical features, we found that TMUB1 had a poor OS in COAD and was positively correlated with the stage of malignant progression. TMUB1 is a promising prognostic marker for colon cancer based on its significant up-regulation in COAD, high diagnostic properties, and poor prognosis.
We compared various colorectal cancer cell lines with normal intestinal cells and detected their mRNA expression levels to verify the TMUB1 expression level. Higher TMUB1 expression levels were reported in human colorectal cancer (SW480, RKO, LoVo, and HT29) cells compared with that of the normal (NCM460) cells. No difference was observed in HCT116 cells. Based on the findings from 10 paired colon cancer tissues, it was reported that TMUB1 expression in cancer tissues was higher than that in the adjacent tissues. This finding was consistent with the expression level in our TCGA and GEO databases, and further research to understand its mechanism in colon cancer is warranted.
Furthermore, researchers suggested that TMUB1 is overexpressed in liver regeneration, shuttling between the nucleus and cytoplasm (Chen et al., 2019). Further analysis of function loss and function gain in human hepatocytes showed that TMUB1 inhibited signal transducer and activator of transcription 3 (STAT3) phosphorylation and STAT3 signalling activation, thereby confirming the inhibitory effect of TMUB1 overexpression on hepatocyte proliferation (Castelli et al., 2020). Hao et al. (2022) founded that high expression of TMUB1 was strongly associated with poor prognosis in colorectal cancer patients, which was consistent with our findings. Meanwhile, we focused on the expression profile, clinicopathological correlation and clinical significance of TMUB1 by analyzing the TCGA-colon cancer dataset, and verified the expression level of TMUB1 in colon cancer in cells and colon cancer tissues. Further we refined the validation that high expression of TMUB1 was associated with the prognosis of colon cancer patients. It is suggested that high expression of TMUB1 may be associated with poor prognosis of colon cancer patients. Other studies have revealed that TMUB1 is crucial for the stability and transcription of P53. It is found that TMUB1 can not only increase P53 stability but also locate P53 in the mitochondria and promote mitochondrial apoptosis, indicating that TMUB1 is crucial for controlling p53 stability and cytoplasmic accumulation (Della-Fazia et al., 2020). In addition, TMUB1 was crucial for controlling important tumor suppressors such as nucleophosmin and auxin response factors (Bellet et al., 2020).
However, TMUB1 was reported to be a poor risk factor for colon cancer in our study. Therefore, we predicted its possible function and signalling pathway in tumors by enrichment analysis to better understand its potential function in colon cancer. TMUB1 was found to be significantly enriched in ion channel composition, cell adhesion, ECM composition, and ECM interaction in GO and the KEGG analysis. There have been many studies on tumor ECM remodelling, stromal cell infiltration, and ECM fibrogenesis causing tumor cell invasion and metastasis; however, several issues are yet to be resolved (Wishart et al., 2020). ECM fibrogenesis is expected to become a new type of anti-tumor metastasis target, but the mechanism of ECM fibrogenesis mediating tumor metastasis is still insufficient. For example, how tumor cells use ECM fibrogenesis to regulate the motility and adhesion of the tumor itself, and what are the differences between the arrangement and combination of different collagen molecules on tumor metastasis. Thus, TMUB1 has the potential as a drug target for ECM development. The DNA methylation signalling pathway has gained attention in recent years among the multiple signalling pathways identified by GSEA (Widschwendter et al., 2017). Herein, we observed that TMUB1 methylation level in colon cancer was lower in P53 mutation, adenocarcinoma category, clinicopathological stage III/VI, and increased age. Low-level methylation helps detect early precancerous lesions (Witte, Plass & Gerhauser, 2014), thereby indicating that TMUB1 has the potential to be used as a biomarker for the early diagnosis and treatment of colon cancer.
Additionally, we analysed the potential relationship between TMUB1 expression and immune cell infiltration. High-level TMUB1 expression was associated with low-level immune and stromal infiltrations. TMUB1 was reported to be negatively correlated with T helper cells, Th2 cells, Tcm cells, and macrophages. T helper cells are crucial in the pathogenesis of inflammatory bowel disease (IBD) and promote inflammatory responses in IBD and colitis-related colon cancer (Pramanik et al., 2018; Ansaldo et al., 2019). Th2 cells mainly secrete interleukin (IL)-4, IL-10, and IL-13 to promote humoral immunity (Wibowo et al., 2021). A reduced Th1/Th2 ratio has been reported to promote tumor growth, enhance tumor immune evasion function, and promote tumor metastasis and progression through abnormal secretion of related cytokines. Currently, the mechanism of the Th1/Th2 ratio imbalance in tumorigenesis and progression is still unclear, and further research is warranted (Na et al., 2020). Comparing Tcm cells to effector memory T cells and effector T cells, several studies have found that Tcm cells have superior persistence and antitumor immunity. Overall, we anticipate learning the molecular pathways that control memory T cell formation, which will be essential for developing rational approaches to optimise cancer immunotherapy (Liu, Sun & Chen, 2020).
Herein, we reported the expression level of TMUB1 in colon cancer and analyzed its potential prognostic value in colon cancer through the bioinformatics analysis and preliminary experimental studies. TMUB1 may have great potential as a tumor marker for diagnosing colon cancer. High TMUB1 expression shows low immune cell infiltration, and we have made some predictions about the function of the gene itself and the specific signalling pathway; however, further research is required to confirm these results. In conclusion, our findings suggest that TMUB1 overexpression is an independent adverse prognostic factor for COAD. P53 and DNA methylation signaling pathways may be the key signaling pathways regulated by TMUB1 in OCAD. In addition, TMUB1 mediates immune cell infiltration in the tumor microenvironment. This study shows that TMUB1 as a prognostic biomarker for COAD highlights its potential as a predictive biomarker and immunotherapeutic target.
Supplemental Information
The predictive value of TMUB1 in the diagnosis and prognosis of colon cancer
(A) Prognostic nomogram of TMUB1 based on overall survival. (B–D) Calibration curves of overall survival at year 1, year 3, and year 5. (E) Prognostic nomogram of TMUB1 based on OS. (F, G, H) Calibration curves of disease-specific survival at year 1, 3, and 5.