
A dynamic nomogram for predicting 28-day mortality in septic shock: a Chinese retrospective cohort study
- Published
- Accepted
- Received
- Academic Editor
- Arindam Basu
- Subject Areas
- Emergency and Critical Care, Epidemiology, Infectious Diseases
- Keywords
- Prediction model, 28-day mortality, Septic shock
- Copyright
- © 2024 Xu et al.
- Licence
- This is an open access article distributed under the terms of the Creative Commons Attribution License, which permits using, remixing, and building upon the work non-commercially, as long as it is properly attributed. For attribution, the original author(s), title, publication source (PeerJ) and either DOI or URL of the article must be cited.
- Cite this article
- 2024. A dynamic nomogram for predicting 28-day mortality in septic shock: a Chinese retrospective cohort study. PeerJ 12:e16723 https://doi.org/10.7717/peerj.16723
Abstract
Background
Septic shock is a severe life-threatening disease, and the mortality of septic shock in China was approximately 37.3% that lacks prognostic prediction model. This study aimed to develop and validate a prediction model to predict 28-day mortality for Chinese patients with septic shock.
Methods
This retrospective cohort study enrolled patients from Intensive Care Unit (ICU) of the Second Affiliated Hospital, School of Medicine, Zhejiang University between December 2020 and September 2021. We collected patients’ clinical data: demographic data and physical condition data on admission, laboratory data on admission and treatment method. Patients were randomly divided into training and testing sets in a ratio of 7:3. Univariate logistic regression was adopted to screen for potential predictors, and stepwise regression was further used to screen for predictors in the training set. Prediction model was constructed based on these predictors. A dynamic nomogram was performed based on the results of prediction model. Using receiver operator characteristic (ROC) curve to assess predicting performance of dynamic nomogram, which were compared with Sepsis Organ Failure Assessment (SOFA) and Acute Physiology and Chronic Health Evaluation II (APACHE II) systems.
Results
A total of 304 patients with septic shock were included, with a 28-day mortality of 25.66%. Systolic blood pressure, cerebrovascular disease, Na, oxygenation index (PaO2/FiO2), prothrombin time, glucocorticoids, and hemodialysis were identified as predictors for 28-day mortality in septic shock patients, which were combined to construct the predictive model. A dynamic nomogram (https://zhijunxu.shinyapps.io/DynNomapp/) was developed. The dynamic nomogram model showed a good discrimination with area under the ROC curve of 0.829 in the training set and 0.825 in the testing set. Additionally, the study suggested that the dynamic nomogram has a good predictive value than SOFA and APACHE II.
Conclusion
The dynamic nomogram for predicting 28-day mortality in Chinese patients with septic shock may help physicians to assess patient survival and optimize personalized treatment strategies for septic shock.
Introduction
Septic shock belongs to a subclass of sepsis where potential circulatory, cellular, and metabolic abnormalities are related to higher mortality rates than sepsis alone (Guarino et al., 2023). In adults, septic shock can be diagnosed with the clinical standards of hypotension requiring vasopressor treatment to keep average blood pressure (BP) 65 mmHg or higher and having a serum lactate level higher than two mmol/L following adequate fluid resuscitation (Heng et al., 2023). Sepsis and septic shock are associated with high mortality and substantial morbidity. More than 25–30% of patients with sepsis die from the condition, with hospital mortality for septic shock approaching 40–60% (Cecconi et al., 2018; Lakbar et al., 2022). The incidence of sepsis and septic shock has continued to increase (Chiu & Legrand, 2021). Septic shock occurs in more than 230,000 US patients each year, with more than 40,000 US deaths annually (Seymour & Rosengart, 2015). The overall mortality of septic shock in China was 37.3%, which was much higher than that of North America and Europe countries (Liu et al., 2022). Hence, predicting the mortality of septic shock is of great significant to improve survival outcomes in patients with septic shock.
Conventional scoring systems such as the Acute Physiology and Chronic Health Evaluation II (APACHE II) (Choudhuri et al., 2020) and Sepsis Organ Failure Assessment (SOFA) (Devia Jaramillo & Ibáñez Pinilla, 2022) have been used to predict mortality and multi-organ dysfunction. At present, inflammatory molecule osteopontin (OPN) plasma levels at day 1 were identified by Carbone et al. (2020) as a predictor of both 28- and 90-day mortality among patients with septic shock. Hsu, Yang & Tsai (2021) found that lymphocyte to monocyte ratio (LMR) could be used to predict mortality risk in cirrhotic patients with septic shock. A ‘MAVIC’ model incorporating quantitative vasopressor usage was proposed in the American population with septic shock to predict 28-day and 1-year mortality (Vallabhajosyula et al., 2018). Albumin (ALB), base excess, and respiratory rate was used to develop a prediction model for 28-day mortality of severe sepsis and septic shock patients (Seo et al., 2016). For Chinese patients, limited models are established.
In recent years, nomogram has gained widespread utilization in prognosticating various diseases (Yuan et al., 2023; Mei et al., 2022). A nomogram offers several advantages. Firstly, it enables clinicians to visually assess the numerical probability of a patient’s clinical event, thereby helping clinicians make better decisions. Secondly, its user-friendly nature enhances prediction accuracy (Li et al., 2023). Thus, in this study, we intended to develop and validate a dynamic nomogram for predicting 28-day mortality using a contemporary cohort of Chinese patients with septic shock, thereby helping physicians to assess patient survival and optimize personalized treatment strategies for septic shock.
Methods
Study design and population
This retrospective cohort study enrolled patients from the Intensive Care Unit (ICU) of the Second Affiliated Hospital, School of Medicine, Zhejiang University between December 2020 and September 2021. Inclusion criteria: (1) patients diagnosed with septic shock based on The Third International Consensus Definitions for Sepsis and Septic Shock (Sepsis-3); (2) patients aged ≥18 years; (3) patients surviving more than 48 h in the ICU; and (4) patients with complete clinical data. Exclusion criteria: (1) patients with autoimmune diseases; (2) patients undergoing organ transplantation or immunosuppressive therapy; (3) patients with advanced malignant tumor; (4) pregnant women; or (5) patients referred or transferred to other hospitals. This study has been approved by the Institutional Review Board of Second Affiliated Hospital, School of Medicine, Zhejiang University (No. 2021(0955)). The need for written informed consent was waived due to retrospective nature of the study.
Outcome variables and follow-up
The primary outcome was 28-day mortality, which was measured from ICU admission to 28 days after the admission. The included patients were followed up by inspection during ICU stay. The follow-up was terminated in October 2021, and the follow-up duration was 28 days.
Data collection
Patient data were extracted from electronic and paper medical records (Seo et al., 2016; Vallabhajosyula et al., 2018): (1) demographic data and physical condition data on admission: sex, age (years), body mass index (BMI, kg/m2), past medical history (hypertension, chronic lung disease, diabetes, chronic kidney disease, heart disease, chronic liver disease, cardiovascular disease, chronic bronchitis), comorbidities (malignancy, coronary artery disease, dyslipidemia, atrial fibrillation, chronic liver disease, chronic obstructive pulmonary disease (COPD), cerebrovascular disease, peripheral vascular disease), infection site (the urinary system, bloodstream, gastrointestinal tract, gallbladder, and others), coma degree (normal state, mild coma, moderate coma, severe coma), systolic blood pressure (SBP, mmHg), diastolic blood pressure (DBP, mmHg), heart rate (times/min), respiratory rate (times/min), body temperature (°C), urine volume (mL); (2) laboratory data on admission: neutrophil to lymphocyte ratio (NLR), systemic immune-inflammation index (SII), blood routine (hemoglobin (Hb, g/L), red blood cell (RBC, 1012/L), platelet (PLT, 109/L), hematocrit (HCT, L/L)), blood biochemistry (liver function: alanine aminotransferase (ALT, U/L), aspartate aminotransferase (AST, U/L), total bilirubin (TBIL, µmol/L), albumin (ALB, g/L); renal function: blood urea nitrogen (BUN, mmol/L), creatinine (Cr, µmol/L), uric acid (UA, µmol/L); ion: potassium (mmol/L), sodium (mmol/L), chlorine (mmol/L), calcium (mmol/L); blood glucose (GLU, mmol/L)), inflammatory marker (C-reactive protein (CRP, mg/L), procalcitonin (PCT, µg/L), white blood cell (WBC, 109/L)), blood gas analysis (lactic acid (LAC, mmol/L), blood pH, oxygenation index (PaO2/FiO2), blood oxygen saturation (SaO2, %)), coagulation function (activated partial thromboplastin time (APTT, s), thrombin time (TT, s), prothrombin time (PT, s), fibrinogen (FIB, g/L)), immunological indicator (immunoglobulin G (IgG, mg/dL), complement C3 (g/L), complement C4 (mg/L)); (3) treatment method: fluid resuscitation, vasoactive drugs, glucocorticoids, mechanical ventilation, hemodialysis. Data on length of ICU stay (h) were also collected. Coma degree was assessed by the Glasgow Coma Scale (GCS) from three aspects: eye opening (maximum 4 points), verbal response (maximum 5 points) and motor response (maximum 6 points) (Mehta & Chinthapalli, 2019). The lower the total score, the more serious the coma: 15 points indicated normal state, 13–14 points indicated mild coma, 9–12 points indicated moderate coma, and 3–8 points indicated severe coma.
Construction and validation of prediction nomogram
The included patients were divided into training and testing sets in a ratio of 7:3 using completely random sampling. The prediction model was developed in the training set, and subsequently validated using the testing set. Univariate logistic regression was adopted to screen for potential predictors, and stepwise regression was further used to screen for predictors in the training set. Based on these predictors, a prediction model was constructed for predicting 28-day mortality in patients with septic shock. The prediction model was visualized by constructing a nomogram to estimate the probability of 28-day all-cause mortality in patients diagnosed with septic shock. The receiver operator characteristic curve (ROC) was used to assess the predicting performance of constructed prediction model. Additionally, the area under the receiver operating characteristic curve (AUC), accuracy, sensitivity, specificity, positive predictive value (PPV), and negative predictive value (NPV) were calculated for the model in both the training and testing sets, which were then compared with those for the SOFA and APACHE II systems.
Statistical analysis
Measurement data with normal distribution were described as mean ± standard deviation (Mean ± SD), and the t test was used for inter-group comparisons; measurement data with skewed distribution were shown as median and quartiles (M (Q1, Q3)), and the Wilcoxon rank sum test was applied for comparisons between the two groups. Enumeration data were described using the number of cases and constituent ratio (n (%)), and comparisons between groups were performed using the chi-square test or Fisher’s exact test. Missing values were filled with medians. For between-group difference analysis, patients were divided into survivor and non-survivor groups. As for the association between variables and 28-day all-cause mortality, the odds ratios (ORs) and 95% confidence intervals (CIs) were calculated. All statistical tests were two-sided, and P < 0.05 was deemed statistically significant. SAS 9.4 (SAS Institute Inc., Cary, NC, USA) was employed for statistical analysis.
Results
Patient characteristics
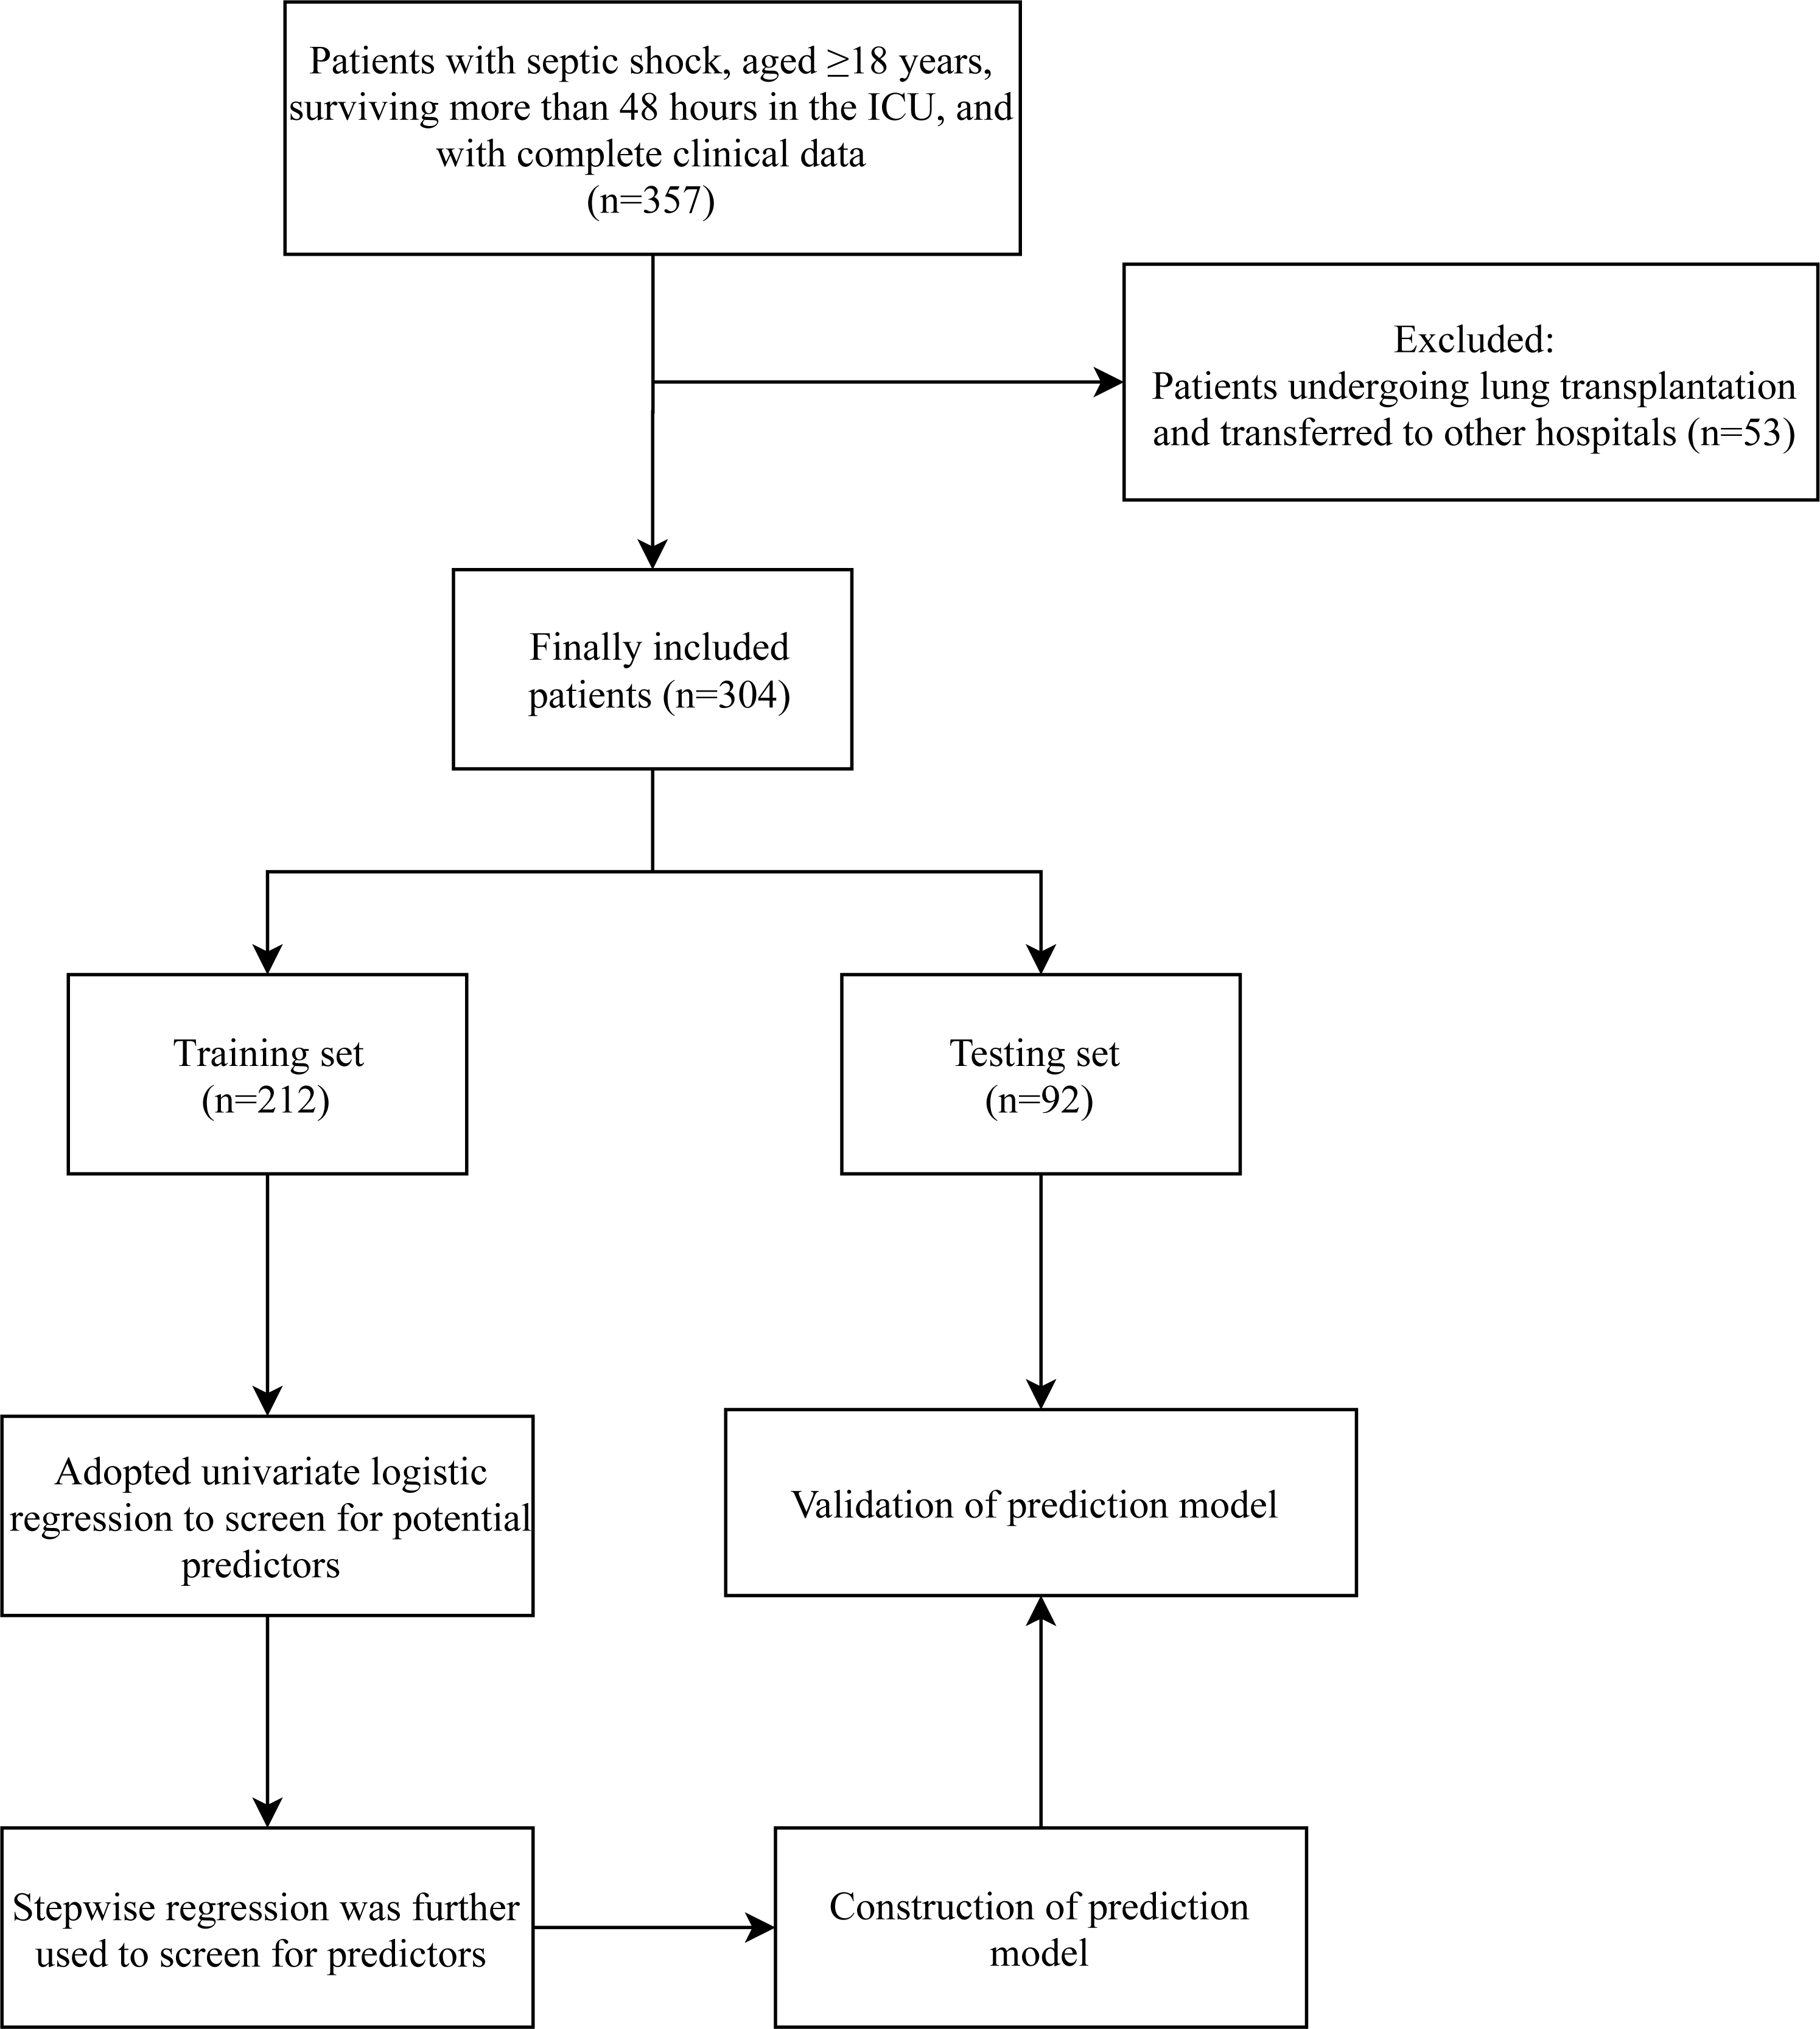
After excluding 53 patients undergoing lung transplantation and transferred to other hospitals, 304 patients with septic shock were included in this study, with 226 (74.34%) in the survivor group and 78 (25.66%) in the non-survivor group. Figure 1 presents the flow chart of patient selection. The average age and BMI of the included patients were 59.70 ± 15.94 years and 23.01 ± 3.99 kg/m2, respectively. There were 207 (68.09%) male patients, and 97 (31.91%) female patients. These included patients had an average SBP and DBP of 127.10 ± 28.58 and 70.64 ± 16.54 mmHg, respectively. The characteristics of these patients are shown in Table 1. Significant differences were observed in age, chronic lung disease, SBP, DBP, heart rate, atrial fibrillation, cerebrovascular disease, NLR, AST, ALB, BUN, Cr, Cl, CRP, PCT, LAC, oxygenation index (PaO2/FiO2), SaO2, PT, C3, glucocorticoids, mechanical ventilation, and hemodialysis between survivor and non-survivor groups.

Figure 1: Flowchart of patient selection.
| Variables | Total (n = 304) | Survivor group (n = 226) | 28-day mortality group (n = 78) | Statistics | P |
|---|---|---|---|---|---|
| Sex, n (%) | χ2= 1.200 | 0.273 | |||
| Male | 207 (68.09) | 150 (66.37) | 57 (73.08) | ||
| Female | 97 (31.91) | 76 (33.63) | 21 (26.92) | ||
| Age, years, Mean ± SD | 59.70 ± 15.94 | 58.08 ± 16.43 | 64.38 ± 13.46 | t= −3.36 | <0.001 |
| BMI, kg/m2, Mean ± SD | 23.01 ± 3.99 | 23.17 ± 3.80 | 22.56 ± 4.49 | t=1.17 | 0.244 |
| Hypertension, yes, n (%); | 119 (39.14) | 84 (37.17) | 35 (44.87) | χ2= 1.445 | 0.229 |
| Chronic lung disease, yes, n (%); | 14 (4.61) | 6 (2.65) | 8 (10.26) | – | 0.010 |
| Diabetes, yes, n (%); | 44 (14.47) | 29 (12.83) | 15 (19.23) | χ2= 1.918 | 0.166 |
| Chronic kidney disease, yes, n (%); | 12 (3.95) | 8 (3.54) | 4 (5.13) | – | 0.512 |
| Heart disease, yes, n (%); | 26 (8.55) | 16 (7.08) | 10 (12.82) | χ2= 2.444 | 0.118 |
| Chronic liver disease, yes, n (%); | 11 (3.62) | 7 (3.10) | 4 (5.13) | – | 0.482 |
| Cardiovascular disease, yes, n (%); | 15 (4.93) | 9 (3.98) | 6 (7.69) | – | 0.225 |
| Chronic bronchitis, yes, n (%); | 4 (1.32) | 1 (0.44) | 3 (3.85) | – | 0.053 |
| Malignancy, yes, n (%); | 46 (15.13) | 30 (13.27) | 16 (20.51) | χ2= 2.366 | 0.124 |
| Coronary artery disease, yes, n (%); | 13 (4.28) | 7 (3.10) | 6 (7.69) | – | 0.104 |
| Dyslipidemia, yes, n (%); | 6 (1.97) | 6 (2.65) | 0 (0.00) | – | 0.344 |
| Atrial fibrillation, yes, n (%); | 20 (6.58) | 11 (4.87) | 9 (11.54) | χ2= 4.199 | 0.040 |
| Chronic liver disease, yes, n (%); | 29 (9.54) | 18 (7.96) | 11 (14.10) | χ2= 2.532 | 0.112 |
| COPD, yes, n (%); | 17 (5.59) | 11 (4.87) | 6 (7.69) | – | 0.392 |
| Cerebrovascular disease, yes, n (%); | 64 (21.05) | 38 (16.81) | 26 (33.33) | χ2= 9.521 | 0.002 |
| Peripheral vascular disease, yes, (%); | 4 (1.32) | 4 (1.77) | 0 (0.00) | – | 0.576 |
| Infection site, n (%) | – | 0.497 | |||
| Urinary system | 4 (1.32) | 4 (1.77) | 0 (0.00) | ||
| Bloodstream | 18 (5.92) | 11 (4.87) | 7 (8.97) | ||
| Gastrointestinal tract | 4 (1.32) | 3 (1.33) | 1 (1.28) | ||
| Gallbladder | 6 (1.97) | 4 (1.77) | 2 (2.56) | ||
| Others | 272 (89.47) | 204 (90.27) | 68 (87.18) | ||
| Coma degree, n (%) | – | 0.100 | |||
| Normal state | 197 (64.80) | 155 (68.58) | 42 (53.85) | ||
| Mild coma | 7 (2.30) | 5 (2.21) | 2 (2.56) | ||
| Moderate coma | 82 (26.97) | 54 (23.89) | 28 (35.90) | ||
| Severe coma | 18 (5.92) | 12 (5.31) | 6 (7.69) | ||
| SBP, mmHg, Mean ± SD | 127.10 ± 28.58 | 129.53 ± 28.10 | 120.05 ± 28.99 | t = 2.55 | 0.011 |
| DBP, mmHg, Mean ± SD | 70.64 ± 16.54 | 71.88 ± 15.83 | 67.04 ± 18.08 | t = 2.25 | 0.025 |
| Heart rate, times/min, Mean ± SD | 93.76 ± 21.55 | 92.15 ± 21.08 | 98.42 ± 22.36 | t = − 2.23 | 0.027 |
| Respiratory rate, times/min, Mean ± SD | 19.54 ± 4.81 | 19.19 ± 4.33 | 20.56 ± 5.90 | t = − 1.89 | 0.062 |
| Body temperature, °C, Mean ± SD | 37.27 ± 0.80 | 37.27 ± 0.75 | 37.25 ± 0.94 | t = 0.17 | 0.868 |
| Urine volume, mL, M (Q1, Q3) | 1050.00 (600.00, 1700.00) | 1050.00 (600.00, 1720.00) | 1075.00 (490.00, 1590.00) | Z = − 0.129 | 0.897 |
| NLR, M (Q1, Q3) | 13.12 (7.49, 21.60) | 11.70 (6.98, 19.22) | 17.16 (10.43, 27.81) | Z = 3.212 | 0.001 |
| SII, M (Q1, Q3) | 1709.30 (820.62, 3467.08) | 1607.12 (775.33, 3126.23) | 2322.57 (941.13, 3937.21) | Z = 1.503 | 0.133 |
| Hb, g/L, Mean ± SD | 112.65 ± 28.83 | 113.27 ± 29.69 | 110.88 ± 26.29 | t = 0.63 | 0.530 |
| RBC, 1012 /L, Mean ± SD | 3.48 ± 0.85 | 3.52 ± 0.88 | 3.35 ± 0.75 | t = 1.56 | 0.121 |
| PLT, 109 /L, M (Q1, Q3) | 147.88 (94.50, 206.50) | 156.25 (101.67, 219.00) | 133.04 (86.00, 186.80) | Z = − 1.783 | 0.075 |
| HCT, L/L, Mean ± SD | 0.34 ± 0.09 | 0.34 ± 0.09 | 0.34 ± 0.08 | t = 0.65 | 0.517 |
| ALT, U/L, M (Q1, Q3) | 24.00 (14.00, 42.00) | 24.00 (13.00, 39.00) | 25.00 (15.00, 55.00) | Z = 1.420 | 0.156 |
| AST, U/L, M (Q1, Q3) | 31.00 (20.00, 73.50) | 29.34 (19.00, 65.00) | 39.00 (26.00, 108.00) | Z = 2.959 | 0.003 |
| TBIL, µmol/L, M (Q1, Q3) | 17.17 (11.85, 25.85) | 16.65 (11.60, 25.03) | 18.05 (12.30, 32.90) | Z = 1.162 | 0.245 |
| ALB, g/L, Mean ± SD | 30.45 ± 6.16 | 31.03 ± 6.07 | 28.79 ± 6.16 | t= 2.79 | 0.006 |
| BUN, mmol/L, M (Q1, Q3) | 7.00 (4.50, 11.00) | 6.45 (4.30, 10.30) | 8.65 (5.40, 12.30) | Z= 2.842 | 0.004 |
| Cr, µmol/L, M (Q1, Q3) | 71.50 (54.50, 108.00) | 68.00 (53.00, 97.00) | 86.00 (64.00, 131.00) | Z = 2.697 | 0.007 |
| UA, µmol/L, M (Q1, Q3) | 252.75 (173.00, 371.00) | 242.00 (178.00, 342.00) | 282.00 (167.00, 400.00) | Z = 0.889 | 0.374 |
| K, mmol/L, Mean ± SD | 3.82 ± 0.71 | 3.82 ± 0.70 | 3.83 ± 0.73 | t = − 0.13 | 0.894 |
| Na, mmol/L, Mean ± SD | 137.77 ± 6.27 | 137.36 ± 5.82 | 138.96 ± 7.34 | t = − 1.74 | 0.084 |
| Cl, mmol/L, Mean ± SD | 106.95 ± 6.50 | 106.42 ± 6.35 | 108.47 ± 6.73 | t = − 2.41 | 0.017 |
| Ca, mmol/L, Mean ± SD | 1.17 ± 0.26 | 1.17 ± 0.27 | 1.17 ± 0.22 | t = 0.06 | 0.949 |
| GLU, mmol/L, M (Q1, Q3) | 8.00 (6.66, 10.50) | 7.90 (6.70, 10.40) | 8.40 (6.62, 10.80) | Z = 0.601 | 0.548 |
| CRP, mg/L, M (Q1, Q3) | 65.93 (18.95, 144.60) | 55.15 (16.80, 118.70) | 108.05 (39.40, 200.20) | Z = 4.005 | <0.001 |
| PCT, µg/L, M (Q1, Q3) | 1.34 (0.25, 6.63) | 0.95 (0.21, 5.56) | 2.69 (0.95, 13.11) | Z = 3.845 | <0.001 |
| WBC, 109 /L, M (Q1, Q3) | 10.38 (7.13, 15.54) | 10.38 (7.45, 15.58) | 10.38 (6.35, 14.85) | Z = − 0.856 | 0.392 |
| LAC, mmol/L, M (Q1, Q3) | 1.70 (1.20, 2.70) | 1.70 (1.10, 2.40) | 2.20 (1.40, 4.10) | Z = 3.253 | 0.001 |
| Blood PH, Mean ± SD | 7.38 ± 0.10 | 7.38 ± 0.09 | 7.36 ± 0.11 | t = 1.75 | 0.084 |
| Oxygenation index (PaO2/FiO2), M (Q1, Q3) | 2.39 (1.70, 3.32) | 2.64 (1.91, 3.40) | 1.84 (1.22, 2.78) | Z = − 4.442 | <0.001 |
| SaO2, %, Mean ± SD | 97.24 ± 3.53 | 97.61 ± 2.83 | 96.16 ± 4.91 | t = 2.46 | 0.016 |
| APTT, s, M (Q1, Q3) | 40.15 (34.30, 47.40) | 39.35 (34.10, 47.30) | 42.15 (35.10, 48.60) | Z = 1.640 | 0.101 |
| TT, s, M (Q1, Q3) | 16.50 (15.55, 18.20) | 16.50 (15.50, 18.00) | 16.65 (15.60, 18.90) | Z = 1.268 | 0.205 |
| PT, s, M (Q1, Q3) | 15.10 (13.90, 17.00) | 14.90 (13.80, 16.70) | 15.60 (14.30, 17.60) | Z= 2.483 | 0.013 |
| FIB, g/L, M (Q1, Q3) | 3.73 (2.59, 5.23) | 3.59 (2.55, 5.06) | 4.44 (2.99, 5.61) | Z = 1.718 | 0.086 |
| IgG, mg/dL, M (Q1, Q3) | 9.33 (7.26, 11.80) | 9.37 (7.38, 11.80) | 9.28 (6.69, 11.80) | Z = − 0.757 | 0.449 |
| C3, g/L, M (Q1, Q3) | 0.79 (0.62, 0.98) | 0.82 (0.65, 1.02) | 0.72 (0.51, 0.92) | Z = − 2.624 | 0.009 |
| C4, mg/L, M (Q1, Q3) | 187.25 (141.00, 243.50) | 191.84 (144.00, 246.00) | 168.00 (128.00, 229.00) | Z = − 1.568 | 0.117 |
| Fluid resuscitation, yes, n (%) | 297 (97.70) | 221 (97.79) | 76 (97.44) | – | 1.000 |
| Vasoactive drugs, yes, n (%) | 300 (98.68) | 223 (98.67) | 77 (98.72) | – | 1.000 |
| Glucocorticoids, yes, n (%) | 251 (82.57) | 177 (78.32) | 74 (94.87) | χ2=11.038 | <0.001 |
| Mechanical ventilation, yes, n (%) | 270 (88.82) | 192 (84.96) | 78 (100.00) | χ2=13.212 | <0.001 |
| Hemodialysis, yes, n (%) | 124 (40.79) | 70 (30.97) | 54 (69.23) | χ2=35.141 | <0.001 |
| Length of ICU stay, h, M (Q1, Q3) | 190.00 (90.00, 336.00) | 178.00 (74.00, 336.00) | 193.00 (96.00, 384.00) | Z = 0.424 | 0.672 |
Notes:
- BMI
-
body mass index
- COPD
-
chronic obstructive pulmonary disease
- SBP
-
systolic blood pressure
- DBP
-
diastolic blood pressure
- NLR
-
neutrophil to lymphocyte ratio
- SII
-
systemic immune-inflammation index
- Hb
-
hemoglobin
- RBC
-
red blood cell
- PLT
-
platelet
- HCT
-
hematocrit
- ALT
-
alanine aminotransferase
- AST
-
aspartate aminotransferase
- TBIL
-
total bilirubin
- ALB
-
albumin
- BUN
-
blood urea nitrogen
- Cr
-
creatinine
- UA
-
uric acid
- GLU
-
blood glucose
- CRP
-
C-reactive protein
- PCT
-
procalcitonin
- WBC
-
white blood cell
- LAC
-
lactic acid
- SaO2
-
blood oxygen saturation
- APTT
-
activated partial thromboplastin time
- TT
-
thrombin time
- PT
-
prothrombin time
- FIB
-
fibrinogen
- IgG
-
immunoglobulin G
- ICU
-
Intensive Care Unit
Predictors for 28-day mortality in septic shock
According to univariate logistic regression, age, chronic lung disease, SBP, DBP, heart rate, atrial fibrillation, cerebrovascular disease, coma degree, TBIL, ALB, Na, Cl, CRP, LAC, oxygenation index (PaO2/FiO2), SaO2, PT, C3, glucocorticoids, and hemodialysis were associated with the risk of 28-day mortality among patients with septic shock (all P <0.05) (Table 2). Further, stepwise regression in the training set identified SBP, cerebrovascular disease, Na, oxygenation index (PaO2/FiO2), PT, glucocorticoids, and hemodialysis as the predictors for 28-day mortality of septic shock patients.
| Variables | OR (95%CI) | P |
|---|---|---|
| Sex | ||
| Male | Ref | |
| Female | 0.70 (0.39–1.26) | 0.238 |
| Age | 1.03 (1.01–1.04) | 0.005 |
| BMI | 0.97 (0.90–1.03) | 0.304 |
| Hypertension, yes; | 1.30 (0.77–2.20) | 0.334 |
| Chronic lung disease, yes; | 4.31 (1.45–12.87) | 0.009 |
| Diabetes, yes; | 1.53 (0.76–3.09) | 0.230 |
| Chronic kidney disease, yes; | 1.51 (0.44–5.18) | 0.509 |
| Heart disease, yes; | 1.99 (0.86–4.59) | 0.107 |
| Chronic liver disease, yes; | 1.74 (0.49–6.11) | 0.389 |
| Cardiovascular disease, yes; | 2.07 (0.71–6.01) | 0.183 |
| Chronic bronchitis, yes; | 9.25 (0.95–90.27) | 0.056 |
| Malignancy, yes; | 1.74 (0.89–3.41) | 0.105 |
| Coronary artery disease, yes; | 2.68 (0.87–8.24) | 0.085 |
| Dyslipidemia, yes; | 0.00 (0.00-Inf) | 0.987 |
| Atrial fibrillation, yes; | 2.63 (1.04–6.61) | 0.040 |
| Chronic liver disease, yes; | 1.96 (0.88–4.35) | 0.100 |
| COPD, yes; | 1.38 (0.46–4.10) | 0.566 |
| Cerebrovascular disease, yes; | 2.57 (1.43–4.63) | 0.002 |
| Peripheral vascular disease, yes; | – | 0.984 |
| Infection site | ||
| Urinary system | Ref | |
| Bloodstream | – | 0.983 |
| Gastrointestinal tract | – | 0.984 |
| Gallbladder | – | 0.984 |
| Others | – | 0.984 |
| Coma degree | ||
| Normal state | Ref | |
| Mild coma | 1.51 (0.28–8.08) | 0.629 |
| Moderate coma | 1.89 (1.06–3.36) | 0.030 |
| Severe coma | 1.89 (0.67–5.34) | 0.230 |
| SBP | 0.99 (0.98–1.00) | 0.020 |
| DBP | 0.98 (0.97–1.00) | 0.039 |
| Heart rate | 1.01 (1.00–1.02) | 0.046 |
| Respiratory rate | 1.05 (1.00–1.11) | 0.076 |
| Body temperature | 0.94 (0.68–1.30) | 0.693 |
| Urine volume | 1.00 (1.00–1.00) | 0.503 |
| NLR | 1.02 (1.00–1.03) | 0.052 |
| SII | 1.00 (1.00–1.00) | 0.092 |
| Hb | 1.00 (0.99–1.01) | 0.513 |
| RBC | 0.77 (0.56–1.06) | 0.106 |
| PLT | 1.00 (0.99–1.00) | 0.099 |
| HCT | 0.39 (0.02–7.49) | 0.536 |
| ALT | 1.00 (1.00–1.00) | 0.678 |
| AST | 1.00 (1.00–1.00) | 0.231 |
| TBIL | 1.01 (1.00–1.02) | 0.018 |
| ALB | 0.94 (0.90–0.99) | 0.010 |
| BUN | 1.02 (0.99–1.05) | 0.205 |
| Cr | 1.00 (1.00–1.00) | 0.869 |
| UA | 1.00 (1.00–1.00) | 0.598 |
| K | 1.02 (0.71–1.48) | 0.896 |
| Na | 1.04 (1.00–1.09) | 0.046 |
| Cl | 1.05 (1.01–1.10) | 0.014 |
| Ca | 0.86 (0.30–2.44) | 0.780 |
| GLU | 1.03 (0.95–1.11) | 0.485 |
| CRP | 1.01 (1.00–1.01) | <0.001 |
| PCT | 1.01 (1.00–1.02) | 0.114 |
| WBC | 0.98 (0.94–1.02) | 0.311 |
| LAC | 1.14 (1.05–1.23) | 0.001 |
| Blood PH | 0.10 (0.01–1.35) | 0.083 |
| Oxygenation index (PaO2/FiO2) | 0.58 (0.44–0.75) | <0.001 |
| SaO2 | 0.90 (0.84–0.97) | 0.005 |
| APTT | 1.01 (1.00–1.01) | 0.264 |
| TT | 1.00 (0.99–1.01) | 0.599 |
| PT | 1.03 (1.00–1.07) | 0.036 |
| FIB | 1.08 (0.95–1.23) | 0.236 |
| IgG | 0.98 (0.91–1.05) | 0.534 |
| C3 | 0.29 (0.11–0.78) | 0.015 |
| C4 | 1.00 (1.00–1.00) | 0.394 |
| Fluid resuscitation, yes | 0.84 (0.16–4.41) | 0.834 |
| Vasoactive drugs, yes | 1.01 (0.10–9.85) | 0.994 |
| Glucocorticoids, yes | 4.98 (1.73–14.32) | 0.003 |
| Mechanical ventilation, yes | – | 0.980 |
| Hemodialysis, yes | 4.83 (2.76–8.45) | <0.001 |
| Length of ICU stay | 1.00 (1.00–1.00) | 0.342 |
Notes:
- BMI
-
body mass index
- COPD
-
chronic obstructive pulmonary disease
- SBP
-
systolic blood pressure
- DBP
-
diastolic blood pressure
- NLR
-
neutrophil to lymphocyte ratio
- SII
-
systemic immune-inflammation index
- Hb
-
hemoglobin
- RBC
-
red blood cell
- PLT
-
platelet
- HCT
-
hematocrit
- ALT
-
alanine aminotransferase
- AST
-
aspartate aminotransferase
- TBIL
-
total bilirubin
- ALB
-
albumin
- BUN
-
blood urea nitrogen
- Cr
-
creatinine
- UA
-
uric acid
- GLU
-
blood glucose
- CRP
-
C-reactive protein
- PCT
-
procalcitonin
- WBC
-
white blood cell
- LAC
-
lactic acid
- SaO2
-
blood oxygen saturation
- APTT
-
activated partial thromboplastin time
- TT
-
thrombin time
- PT
-
prothrombin time
- FIB
-
fibrinogen
- IgG
-
immunoglobulin G
- ICU
-
Intensive Care Unit
- OR
-
odds ratio
- CI
-
confidence interval
Construction and validation of dynamic nomogram
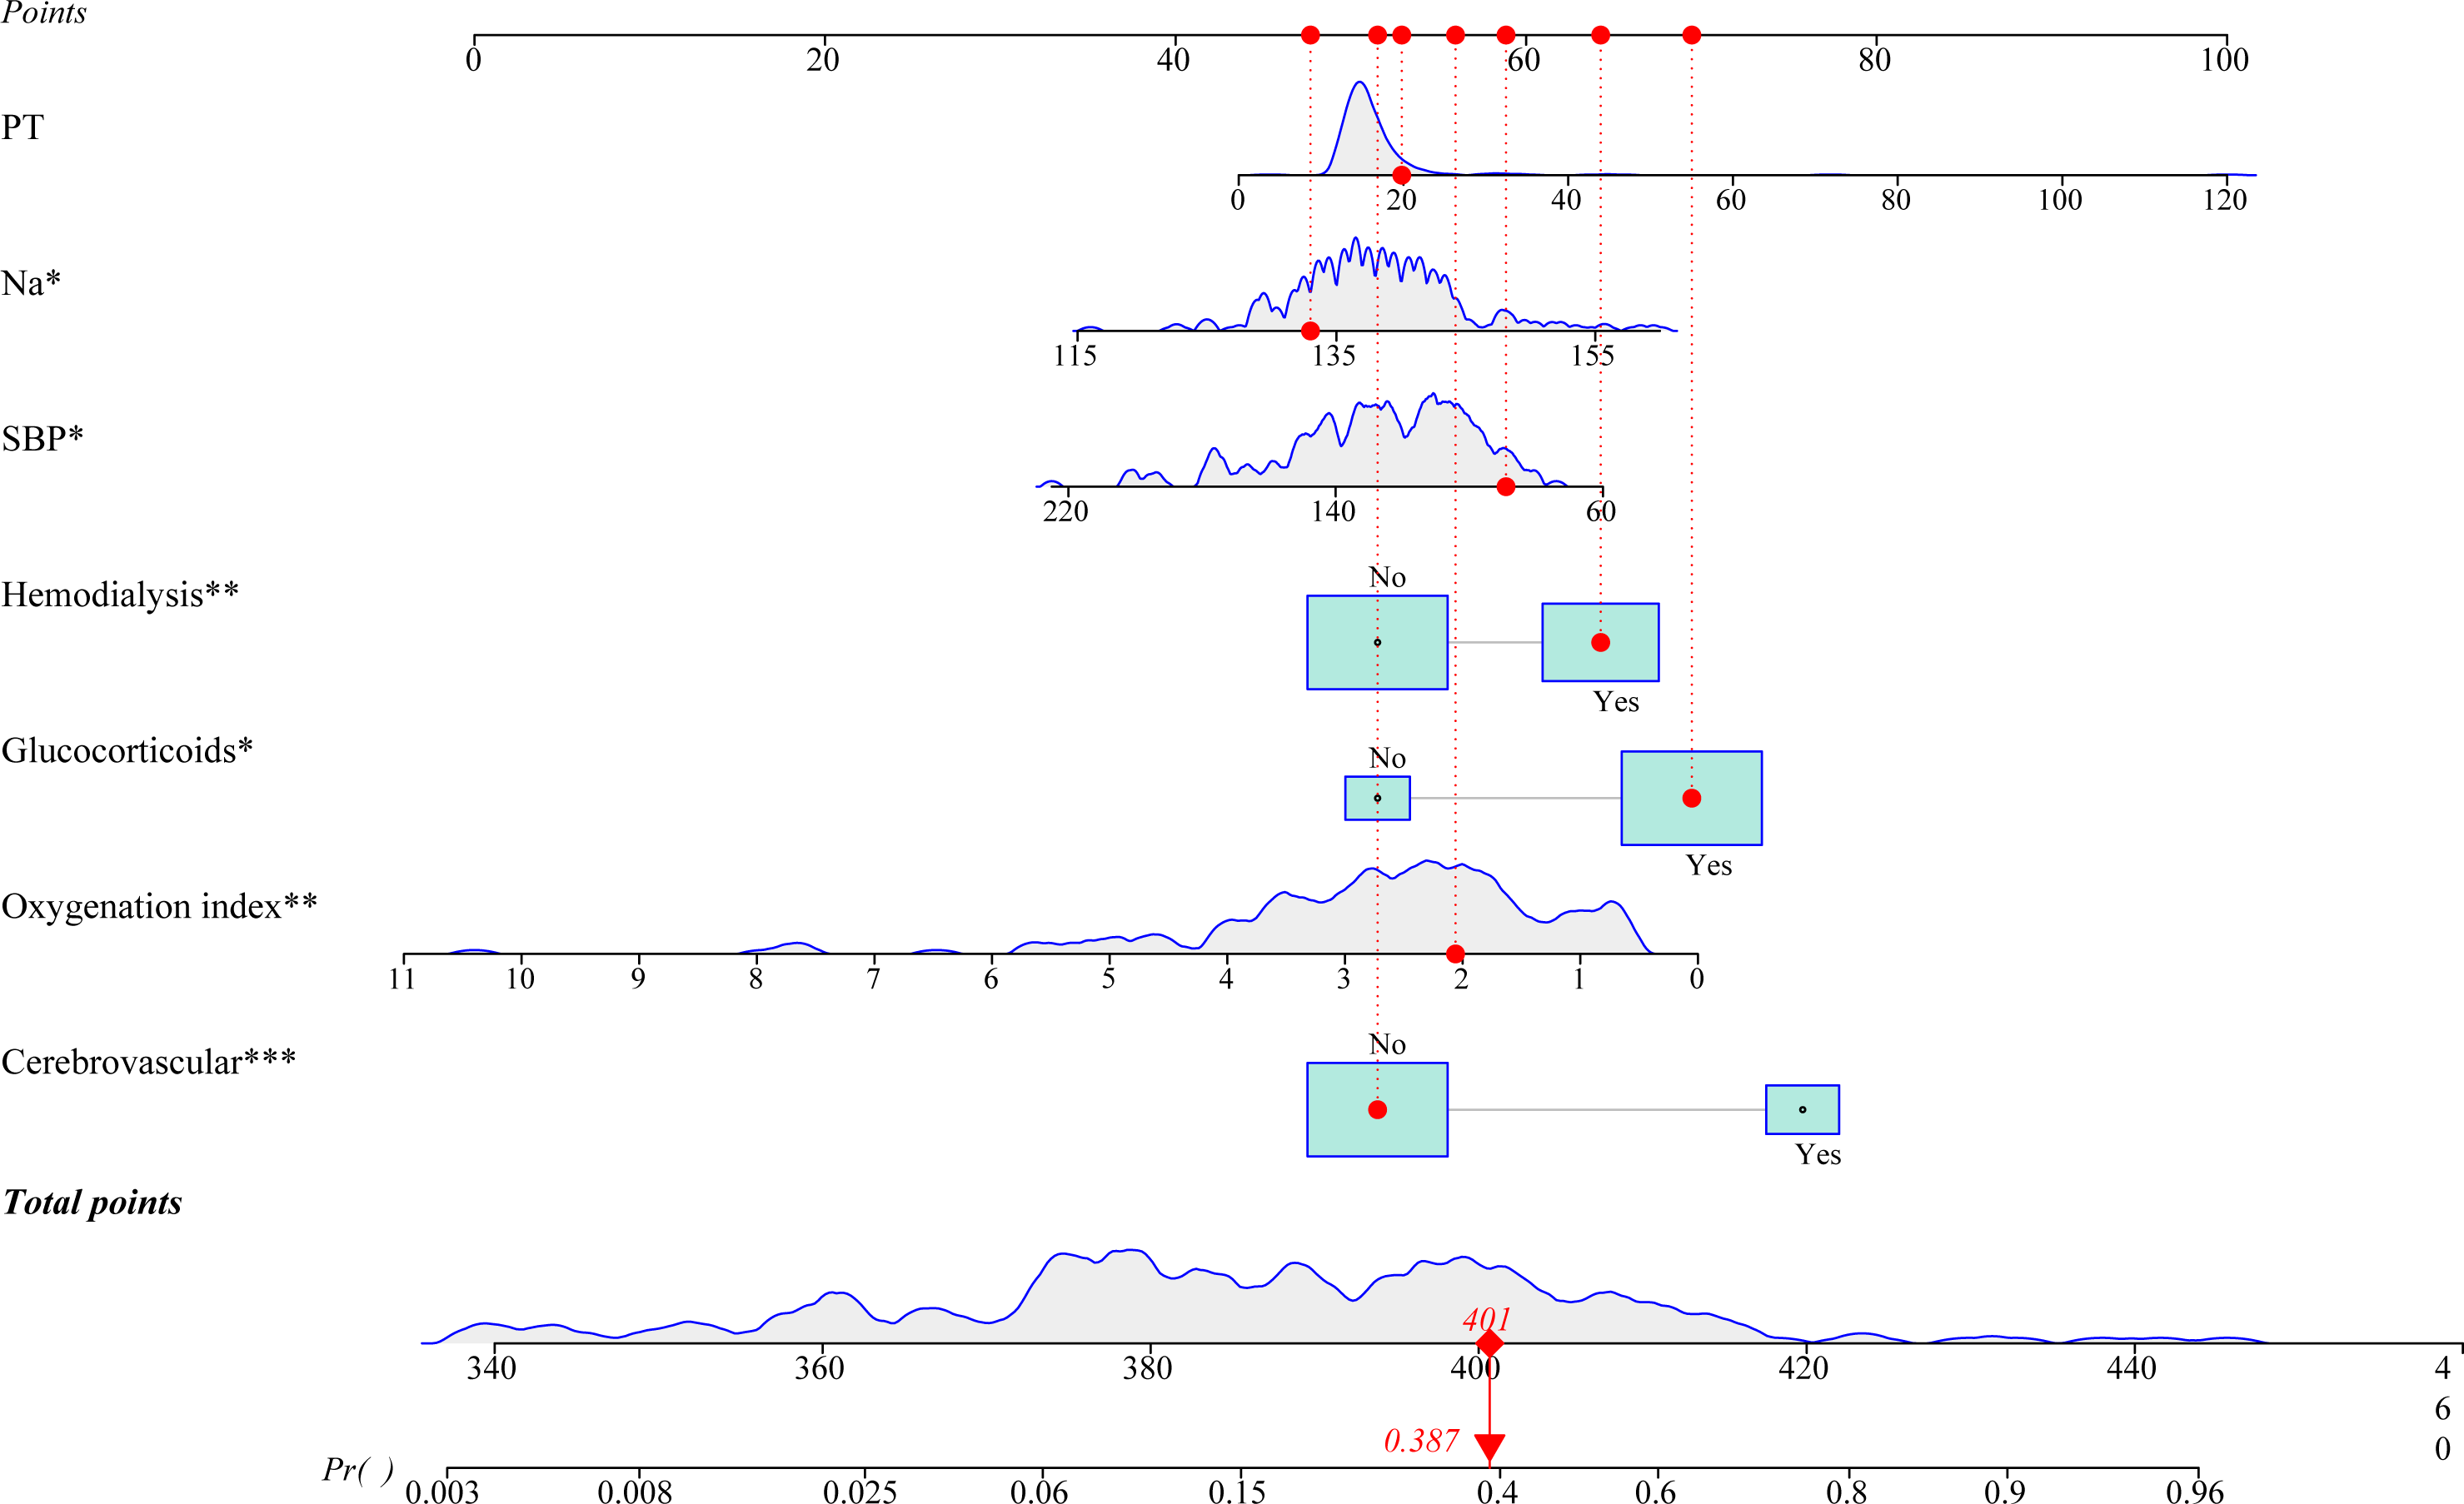
A prediction model integrating SBP, cerebrovascular disease, Na, oxygenation index (PaO2/FiO2), PT, glucocorticoids, and hemodialysis was established to prediction the probability of 28-day all-cause mortality in patients diagnosed with septic shock. As shown in Fig. 2, we plotted a nomogram for visualizing the prediction model. The predicted probability of 28-day mortality was easy to obtain by entering the corresponding values for each predictor. For example, a 60-year-old man had a SBP of 89 mmHg, a Na level of 133.00 mmol/L, an oxygenation index of 2.06, and PT of 19.8 s. He did not have cerebrovascular disease, and was treated with glucocorticoids and hemodialysis. Based on the dynamic nomogram application, the predicted probability of 28-day mortality in this patient was 0.387 (Fig. 3). An online dynamic nomogram is presented for convenient clinical application: https://zhijunxu.shinyapps.io/DynNomapp/.
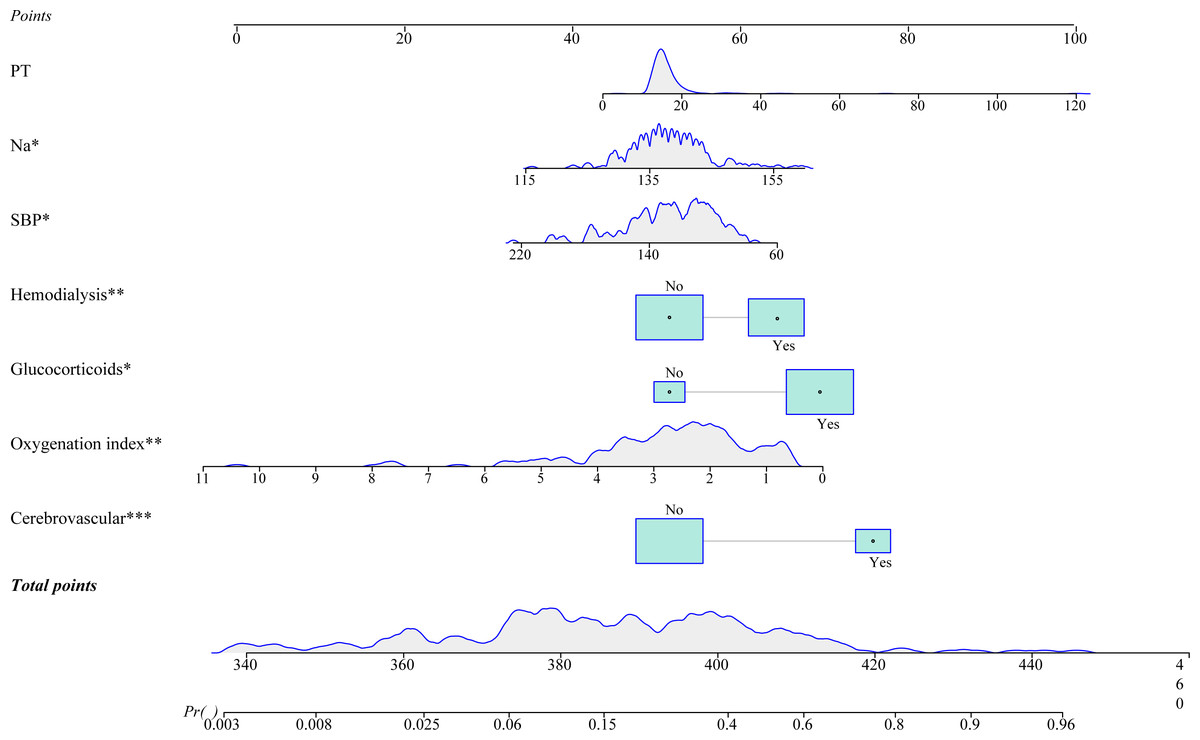
Figure 2: A nomogram for predicting 28-day mortality for Chinese patients with septic shock.
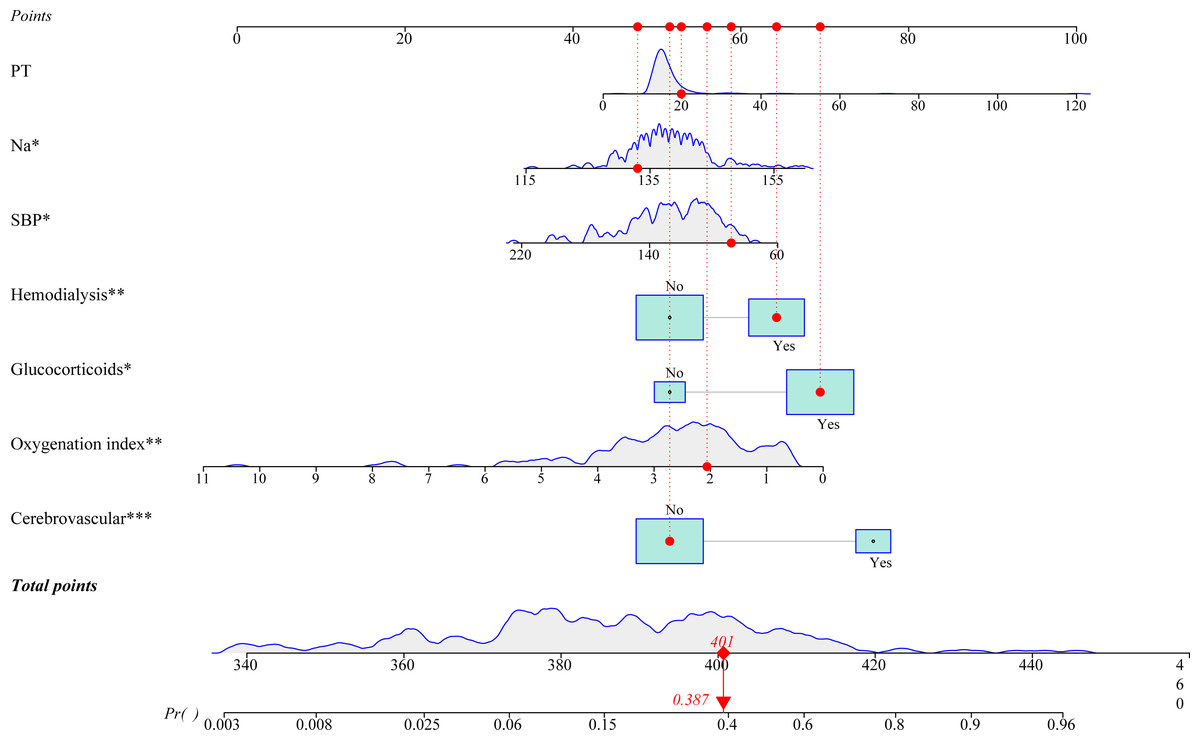
Figure 3: An example for the application of this developed nomogram.
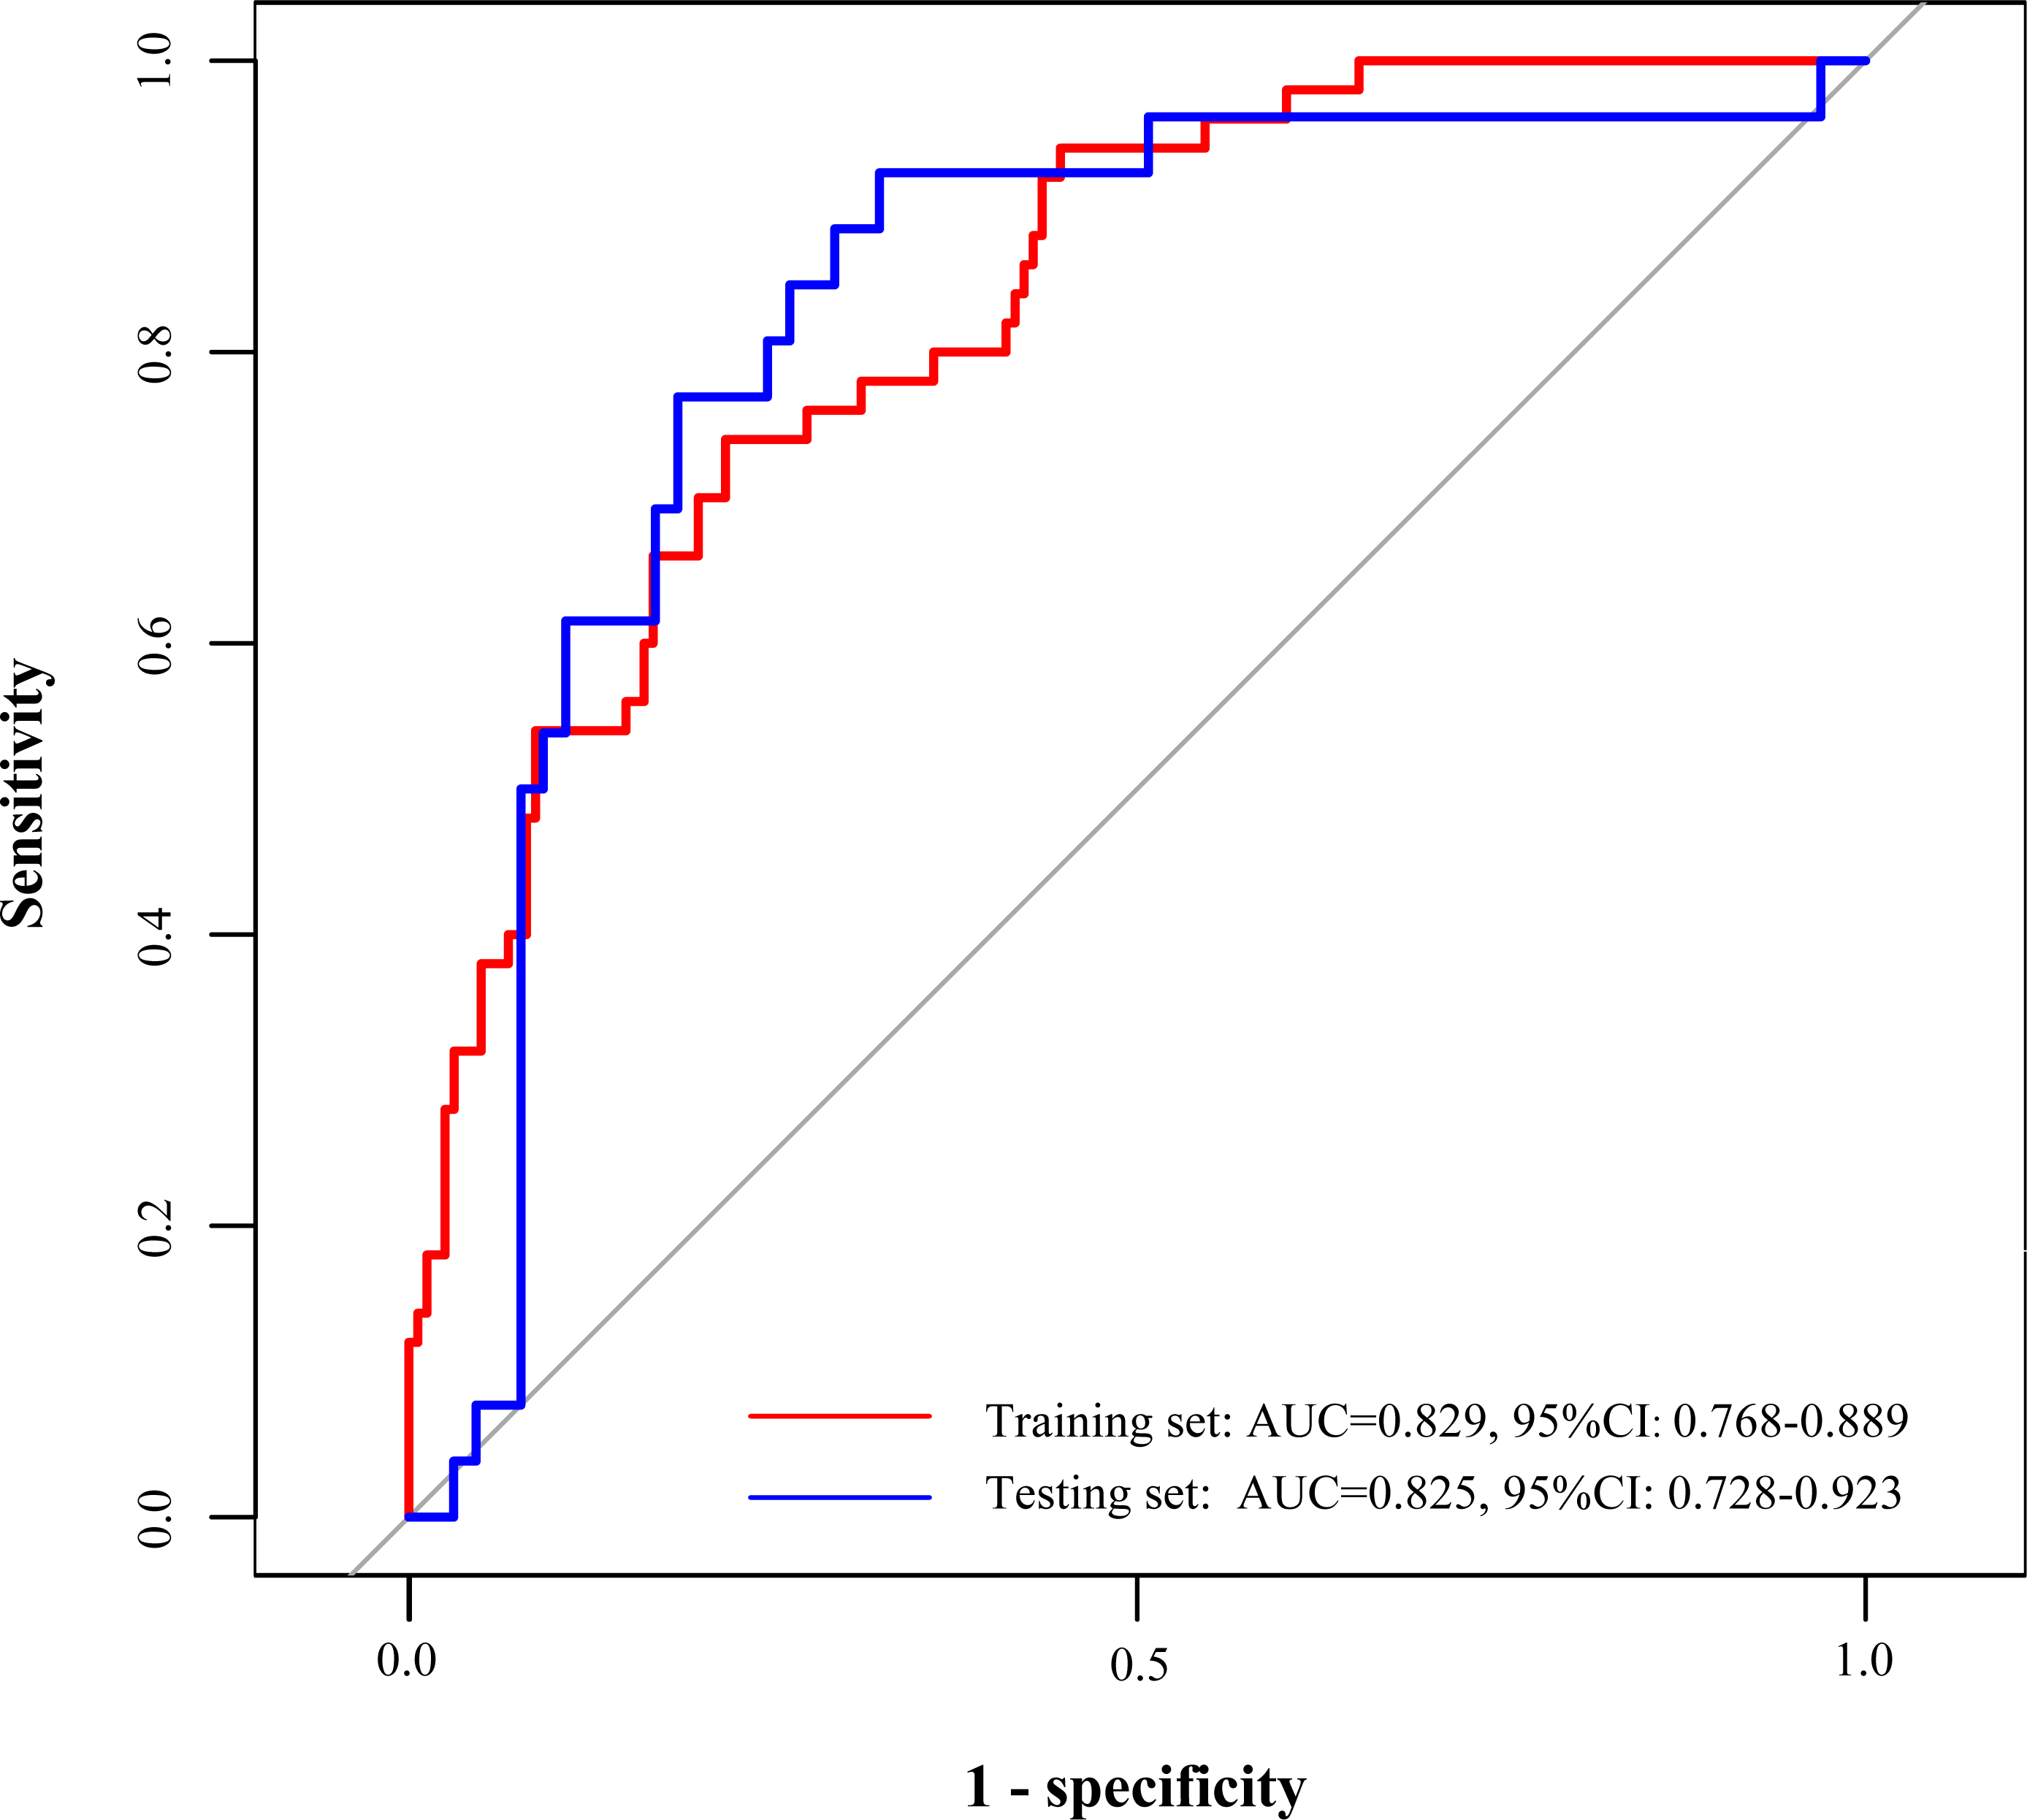
The ROC curves were utilized in this study to evaluate the predictive ability of the developed prediction model, as demonstrated in Table 3. In the training set, the area under the curve (AUC) of ROC curves for this developed model was 0.829 (95% CI [0.768–0.889]), which were higher compared with SOFA (AUC =0.732, 95% CI [0.649–0.814]) and APACHE II (AUC =0.713, 95% CI [0.634–0.791]), respectively. Similarly, in the testing set, the AUC of the developed model was 0.825 (95% CI [0.728–0.923]), which were also higher than SOFA (AUC =0.707, 95% CI [0.584–0.830]) and APACHE II (AUC =0.718, 95% CI [0.601–0.835]) (Table 3, Fig. 4). In addition, the accuracy, sensitivity, specificity, PPV, and NPV of this model 0.773 (95% CI [0.710–0.827]), 0.783 (95% CI [0.719–0.846]), 0.740 (95% CI [0.618–0.862]), 0.514 (95% CI [0.398–0.629]), 0.906 (95% CI [0.858–0.955]) in the training set, and the accuracy, sensitivity, specificity, PPV, and NPV of this model were 0.747 (95% CI [0.645–0.833]), 0.677 (95% CI [0.563–0.791]), 0.923 (95% CI [0.821–1.000]), 0.533 (95% CI [0.388–0.679]), and 0.957 (95% CI [0.898–1.000]), respectively in the testing set.
| Datasets | AUC | Accuracy | Sensitivity | Specificity | PPV | NPV |
|---|---|---|---|---|---|---|
| Our model | ||||||
| Training set | 0.829 (0.768–0.889) | 0.773 (0.710–0.827) | 0.783 (0.719–0.846) | 0.740 (0.618–0.862) | 0.514 (0.398–0.629) | 0.906 (0.858–0.955) |
| Testing set | 0.825 (0.728–0.923) | 0.747 (0.645–0.833) | 0.677 (0.563–0.791) | 0.923 (0.821–1.000) | 0.533 (0.388–0.679) | 0.957 (0.898–1.000) |
| SOFA | ||||||
| Training set | 0.732 (0.649–0.814) | 0.692 (0.625–0.754) | 0.677 (0.605–0.749) | 0.740 (0.618–0.862) | 0.416 (0.313–0.518) | 0.893 (0.839–0.948) |
| Testing set | 0.707 (0.584–0.830) | 0.747 (0.645–0.833) | 0.862 (0.778–0.946) | 0.462 (0.270–0.653) | 0.571 (0.360–0.783) | 0.800 (0.706–0.894) |
| APACHE II | ||||||
| Training set | 0.713 (0.634–0.791) | 0.678 (0.610–0.740) | 0.665 (0.592–0.738) | 0.720 (0.596–0.844) | 0.400 (0.299–0.501) | 0.884 (0.827–0.941) |
| Testing set | 0.718 (0.601–0.835) | 0.670 (0.564–0.765) | 0.631 (0.513–0.748) | 0.769 (0.607–0.931) | 0.455 (0.307–0.602) | 0.872 (0.777–0.968) |
Notes:
- SOFA
-
Sepsis Organ Failure Assessment
- APACHE II
-
Acute Physiology and Chronic Health Evaluation II
- AUC
-
area under the receiver operating characteristic curve
- PPV
-
positive predictive value
- NPV
-
negative predictive value
Our model: integrated systolic blood pressure, cerebrovascular disease, Na, oxygenation index (PaO2/FiO2), prothrombin time, glucocorticoids, and hemodialysis;
SOFA: a quantitative scoring index that dynamically characterizes sepsis-associated organ dysfunction, encompassing respiratory system, coagulation system, liver function, cardiovascular system, central nervous system, and renal function.
APACHE II: incorporated the age score, acute physiology score, and chronic health status score.

Figure 4: Receiver operator characteristic curves of the prediction model in the training and testing sets.
Discussion
The current study developed and validated a nomogram to predict 28-day mortality among patients with septic shock in China. SBP, cerebrovascular disease, Na, oxygenation index (PaO2/FiO2), PT, glucocorticoids, and hemodialysis were found to be predictors of 28-day mortality in septic shock patients, which were combined to establish the nomogram. By the comparison of ROC curves, this developed model had a good predictive ability than SOFA and APACHE II in 28-day mortality prediction of Chinese patients with septic shock.
Seo et al. (2016) developed a 28-day mortality prediction model (nomogram) for Koreans with severe sepsis and/or septic shock with ALB, base excess, and respiratory rate, which exhibited a validated AUC value of 0.754. In the USA, a MAVIC was proposed including quantitative vasopressor usage, and showed greater ability to predict 28-day death than the APACHE-III and SOFA scores (AUC: 0.73 versus 0.66 and 0.60) in septic shock (Vallabhajosyula et al., 2018). For Chinese patients, a prediction model for the 28-day mortality of individuals with severe sepsis or septic shock was constructed by Wang et al. (2017), whereas there is no specific model for 28-day mortality among septic shock patients. Several studies were carried out in the Chinese population to investigate the predictors of 28-day mortality in septic shock. For instance, the combination of Pcv-aCO(2)/Ca-cvO(2) and lactate clearance rate was reported to be superior to a single parameter in the 28-day death risk of patients with septic shock (Gao, Li & Cao, 2018). Huang et al. (2013) found that in contrast to CRP and WBC, PCT had higher sensitivity for 28-day survival prediction. Further, this study focused on the population with septic shock, and combined multiple parameters to build a prediction model for 28-day mortality. After validation, our model demonstrated good discrimination, which was superior to the SOFA and APACHE II in predicting 28-day mortality. It is worth mentioning that an online dynamic nomogram was constructed (https://zhijunxu.shinyapps.io/DynNomapp/). This online dynamic nomogram is a user-friendly tool for clinicians to visually and quickly assess the risk based on the disease characteristics of their patients. Our nomogram has the capability to effectively identify patients with septic shock at high risk of 28-day poor outcome. In real-world clinical settings, clinicians could utilize a nomogram to easily get the numerical probability of 28-day mortality of patients with septic shock based on patients’ clinical indicators, and then early personalized intervention may be conducted to improve prognoses in septic shock.
SBP, cerebrovascular disease, Na, oxygenation index (PaO2/FiO2), PT, glucocorticoids, and hemodialysis were utilized herein for prediction model development. Of these predictors, cerebrovascular disease contributed the most to the model, followed by glucocorticoids, and hemodialysis. In a previous study including patients with sepsis or septic shock, cerebrovascular disease was identified as a predictor for shorter survival (Schmidt et al., 2020). It is common to use glucocorticoids in critically ill patients (Gibbison et al., 2017). Glucocorticoids are used as immunosuppressants (Veterans Administration Systemic Sepsis Cooperative Study Group, 1987), and applied as non-catecholamine vasoconstrictors for patients who do not respond to high-dose vasopressors (so-called low-dose hydrocortisone (<400 mg/day)) in sepsis (Annane et al., 2010; Gordon et al., 2014). Patients with glucocorticoid deficiency related to their critical illness can also be treated with glucocorticoids (Marik et al., 2008; Molenaar et al., 2011). In this paper, we included glucocorticoid use as a predictor of 28-day mortality for septic shock patients, which enriched the role of glucocorticoids in septic shock. A previous review reported that long-term low-dose glucocorticoid treatment reduced the risk of 28-day mortality by 24% in septic shock (Boyer et al., 2006). Hemodialysis was also regarded as predictive of 28-day mortality in septic shock. Suh, Kim & Kim (2021) identified hemodialysis as a risk factor for 30-day mortality in adult candidemia patients. A study by Clark et al. (2016) found that chronic dialysis patients with septic shock had similar in-hospital mortality to those non-dialysis patients. More investigations are required to verify the predictive value of hemodialysis.
This study proposed a prediction model of 28-day mortality in Chinese patients with septic shock for the first time, which was easy to use. Overall, the model exhibited a greater prediction performance than the SOFA and APACHE II. In clinical practice, clinicians can make early intervention decisions in reference to this user-friendly model, so as to improve prognoses. Some limitations should be noted. First, the study was retrospective and single-centered, which may result in limited generalization. Second, the model was constructed based on the baseline data of indicators, without considering the impact of changes in indicators on mortality.
Conclusion
SBP, cerebrovascular disease, Na, oxygenation index (PaO2/FiO2), PT, glucocorticoids, and hemodialysis were found to be predictors of 28-day mortality in septic shock patients, which were combined to establish the dynamic nomogram (https://zhijunxu.shinyapps.io/DynNomapp/). This dynamic nomogram was validated to have better discrimination, accuracy, specificity, and NPV than the SOFA and APACHE II in 28-day mortality prediction of Chinese patients with septic shock. In the future, we will conduct external validation at other centers to verify actual clinical effectiveness of the developed nomogram.