Genetic variability and population structure of two sympatric cownose rays Rhinoptera (Myliobatiformes, Rhinopteridae) in the Western Atlantic Ocean
- Published
- Accepted
- Received
- Academic Editor
- Servet Doğdu
- Subject Areas
- Aquaculture, Fisheries and Fish Science, Biogeography, Conservation Biology, Genetics, Molecular Biology
- Keywords
- Phylogeography, Environmental association, Gene diversity, Conservation genetics, Gene divergence
- Copyright
- © 2024 Palacios Barreto et al.
- Licence
- This is an open access article distributed under the terms of the Creative Commons Attribution License, which permits unrestricted use, distribution, reproduction and adaptation in any medium and for any purpose provided that it is properly attributed. For attribution, the original author(s), title, publication source (PeerJ) and either DOI or URL of the article must be cited.
- Cite this article
- 2024. Genetic variability and population structure of two sympatric cownose rays Rhinoptera (Myliobatiformes, Rhinopteridae) in the Western Atlantic Ocean. PeerJ 12:e17700 https://doi.org/10.7717/peerj.17700
Abstract
Cownose rays Rhinoptera bonasus and R. brasiliensis, are species distributed along the coastal waters from eastern United States, Gulf of Mexico to Brazil. This study represents the most extensive evaluation to date of the genetic diversity and population genetic structure of R. bonasus across its distribution, and it is the first to investigate the population genetics of R. brasiliensis. We analyzed sequences of COI and Cytb genes for Rhinoptera bonasus (COI: 230, Cytb: 108) and R. brasiliensis (COI: 181, Cytb: 105) to investigate the genetic diversity and their relationship with environmental variables, genetic structure, as well as demographic parameters. We found that benthic temperature and current velocity were the most important environmental variables in genetic diversity. The global population structure reveals the presence of significant population genetic structure in both species. Bayesian clusters in BAPS were consistent with the segregation pattern observed for haplotype networks based on COI and Cytb markers for both species, which may respond to philopatry and temperature. These results will further improve management and conservation efforts for these species of ecological and economic importance.
Introduction
Despite increased genetic studies over the past decade, only approximately 10% of elasmobranchs have had their population genetic structure, genetic diversity, and demographic history examined (Domingues, Hilsdorf & Gadig, 2018a). These investigations reveal that populations for most species are genetically distinct entities globally, acquiring relevance in delineating the levels of genetic diversity (Keeney et al., 2005; Karl et al., 2011; Clarke et al., 2015; Fields et al., 2016; Richards, DeBiasse & Shivji, 2019). As a consequence, it is important to manage each population separately to reduce the risk of depletion in their genetic resources (Kenchington, 2003). However, effective implementation of genetic data into management plans for cartilaginous fish remains a challenging task.
The cownose ray Rhinoptera bonasus is found extensively in the Northwestern, Western Central, and Southwestern Atlantic Oceans, stretching from Massachusetts, USA to Uruguay (Last et al., 2016), but excluding the southern Gulf of Mexico (Palacios-Barreto et al., 2017). Contrastingly, the Brazilian cownose ray R. brasiliensis inhabits the Western Central and Southwestern Atlantic Oceans, spanning from the Gulf of Mexico to Brazil (Last et al., 2016). Recent research has expanded the distribution of R. brasiliensis into the Northwestern Atlantic along Florida’s eastern coast (Weber et al., 2021).
Even though cownose rays are often observed near the surface, individually or in large groups (with larger groups numbering in the tens of thousands of rays), their feeding habits are primarily benthic (Rogers et al., 1990; Blaylock, 1993). Cownose rays are highly migratory, and transient, with seasonal residence in bays, estuaries, and the mouth of coastal rivers (Smith & Merriner, 1987; Blaylock, 1993; Grusha, 2005). Massive aggregations of these species are believed to correspond to large-scale migrations, due to seasonal changes in water temperature, salinity, or feeding patterns (Schwartz, 1964, 1990; Smith & Merriner, 1987; Blaylock, 1993; Peterson et al., 2001; Goodman, Conn & Fitzpatrick, 2011; Bangley et al., 2021).
Adults exhibit seasonal variations in habitat use, with distinct areas dedicated to breeding during the summer and feeding in the winter. The breeding cycle is either annual, as observed in studies by Fisher (2010) and Ajemian & Powers (2016), or biennial, as suggested by Pérez-Jiménez (2011). Pregnant females migrate to nursery areas to give birth, usually estuaries or small bays. Although some of these areas have been identified for several populations in the northern hemisphere (Neer & Thompson, 2005; Collins, Huepel & Simpfendorfer, 2008; Fisher, Call & Grubbs, 2013; Ajemian & Powers, 2016), information on potential nursery areas or biology of R. bonasus and R. brasiliensis in the southern hemisphere is limited (Rangel, Rodrigues & Moreira, 2018).
Differences in life history and migratory behavior between R. bonasus populations in the western Atlantic and the Gulf of Mexico suggest a pattern of population isolation related to the spatial separation of populations (Smith & Merriner, 1986; Neer & Thompson, 2005; Pérez-Jiménez, 2011). Using mitochondrial sequences, Carney et al. (2017) and Weber (2022) revealed that the structure identified in R. bonasus was consistent with the separation between the Atlantic and Gulf of Mexico populations. Additionally, Weber (2022) failed to find strong evidence of population structure for R. brasiliensis between the northern Gulf of Mexico and the southwestern Atlantic, which may have been an artifact resulting from small sample sizes used. Whereas Souza et al. (2021), using microsatellite markers, detected significant genetic differentiation along the coast of Brazil. However, for R. brasiliensis very little is known about the habitat use and ecology of this species and its impact on the species’ genetic diversity (Carlson et al., 2020b). Both species are classified as Vulnerable on the International Union for Conservation of Nature (IUCN) Red List of Threatened Species (Carlson et al., 2020a, 2020b).
Understanding the spatial distribution of genetic diversity in these two species of cownose rays across their geographical ranges enables us to identify patterns of concordance in the Western Atlantic and help to identify major geographic areas serving as reservoirs of genetic diversity. Most population genetic studies have relied on mitochondrial molecular markers to estimate gene diversity and population structure of elasmobranchs (Domingues, Hilsdorf & Gadig, 2018a; Phillips, Devloo-Delva & McCall, 2021). This is because Mitochondrial DNA (mtDNA) is maternally inherited, facilitating the tracking of maternal lineages. Also, due to its small size, highly conserved structure, limited recombination, and variable evolutionary rates across different gene regions, mtDNA is a valuable tool for understanding population histories and phylogeographic patterns (Domingues, Hilsdorf & Gadig, 2018a; Sun et al., 2021). Our study evaluates the genetic diversity, population structure, and genetic connectivity of Rhinoptera bonasus and R. brasiliensis from the Western North Atlantic to South America, including the Gulf of Mexico. Our main objectives are to provide a comprehensive description of genetic patterns among different groups of individuals and, to investigate the distribution of genetic variation within and between populations and its relationship with environmental variables. Additionally, we aim to expand the genetic data and compare it with previous studies to cover a broader range along the distribution of both species.
Materials and Methods
Sample collection and DNA extraction
We acquired tissue samples from specimens collected (as bycatch by artisanal fisheries and research sampling efforts) at different localities from the western Atlantic Ocean coast to southeastern Brazil. The specimens analyzed in this study were collected by personnel from several research institutions: samples from waters in the USA were obtained through collaborations with the Florida Fish and Wildlife Conservation Commission through the Fisheries-Independent Monitoring program. Samples from Mexico and Colombia were obtained and identified by author Palacios-Barreto from artisanal fisheries, and those from Brazil in Bertioga were gathered by researchers collaborators of this article, under authorization from IBB-UNESP CEUA No. 1662170524. Morphological dental features such as the number of rows of tooth plates, were used to distinguish between the two species: R. bonasus typically exhibits seven rows in each jaw, whereas R. brasiliensis typically has nine rows in each jaw (Last et al., 2016). Additionally, DNA-based species identification methods were employed. A similarity test was conducted between our sequences and reference libraries in GenBank® (Sayers et al., 2018) using similarity scores (e.g., BLAST) (Altschul et al., 1990), with the species name assigned to the sequence showing the highest similarity.
We analyzed samples from a total of 208 cownose ray individuals, of which 103 were identified as R. bonasus (Fig. 1), collected from the Tropical Northwest Atlantic (TNA): IR, Indian River Lagoon (n = 13); CH, Charlotte Harbor (n = 6); TB, Tampa Bay (n = 21); Colombia: Co, Manaure (n = 13); warm temperate Northwest Atlantic (WTNA): CK, Cedar Key (n = 14); AB, Apalachicola Bay (n = 8), and warm temperate Southwestern Atlantic (WTSA): SP, Bertioga (n = 28). The remaining 105 specimens were representative of R. brasiliensis (Fig. 1), which were obtained from the warm temperate Northwest Atlantic (WTNA): CK, Cedar Key (n = 1); tropical Northwest Atlantic (TNA): CC, Cape Canaveral (n = 10); IR, Indian River Lagoon (n = 2); Tampa Bay (n = 1); TT, Tampico (n = 2); TV, Tamiahua (n = 8); CV, Chachalacas (n = 29); CS, Seybaplaya (n = 32); Q, Chiquilá (n = 9); Colombia: Co, Ciénaga (n = 2), and warm temperate Southwestern Atlantic (WTSA): SP, Bertioga (n = 10). All tissue samples were preserved in 95% ethanol until extraction. Additionally, the mtDNA COI dataset was complemented with 100 sequences of R. bonasus from five locations (IR, CH, TB, CK, and AB) and 12 sequences of R. brasiliensis from two locations (IR and CK), obtained in previous studies (Florida Fish and Wildlife Conservation Commission, Fish and Wildlife Research Institute). In addition, we included mitochondrial COI, and Cytb genes available in GenBank (Table S1). Whole-genome DNA (gDNA) was isolated using the traditional phenol:chloroform: isoamyl alcohol (25:24:1 v/v) protocol (Sambrook, Fritsch & Maniatis, 1989). The DNA was resuspended in 50 μL TE buffer 1X (pH 8) and stored at 4 °C for posterior procedures. Field species identification was confirmed using mitochondrial sequence data of mitochondrial cytochrome c oxidase subunit I (COI) subunit I (Ward et al., 2005).
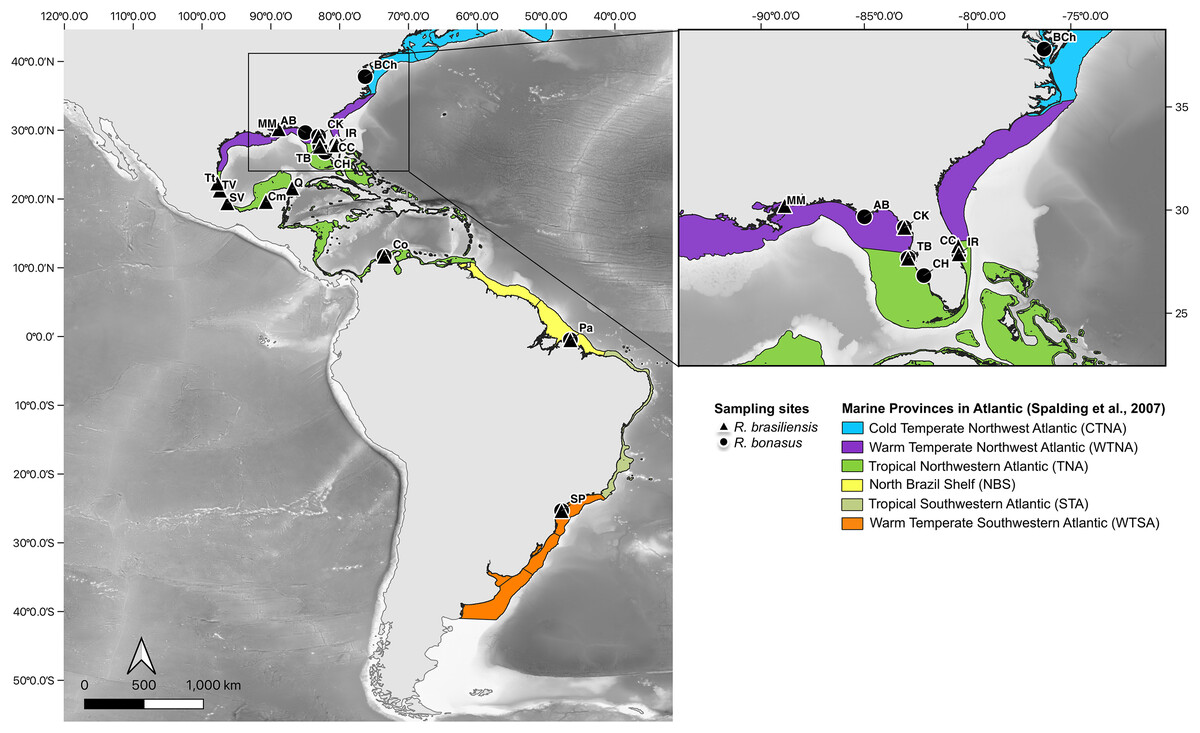
Figure 1: Sampling sites for R. bonasus and R. brasiliensis.
Sampling sites of R. bonasus (Δ) and R. brasiliensis (●). In colors represent the six marine provinces present in the study area, which are based on the biogeographic bioregionalization of coastal and shelf areas proposed by Spalding et al. (2007). Map created using the free and open source QGIS.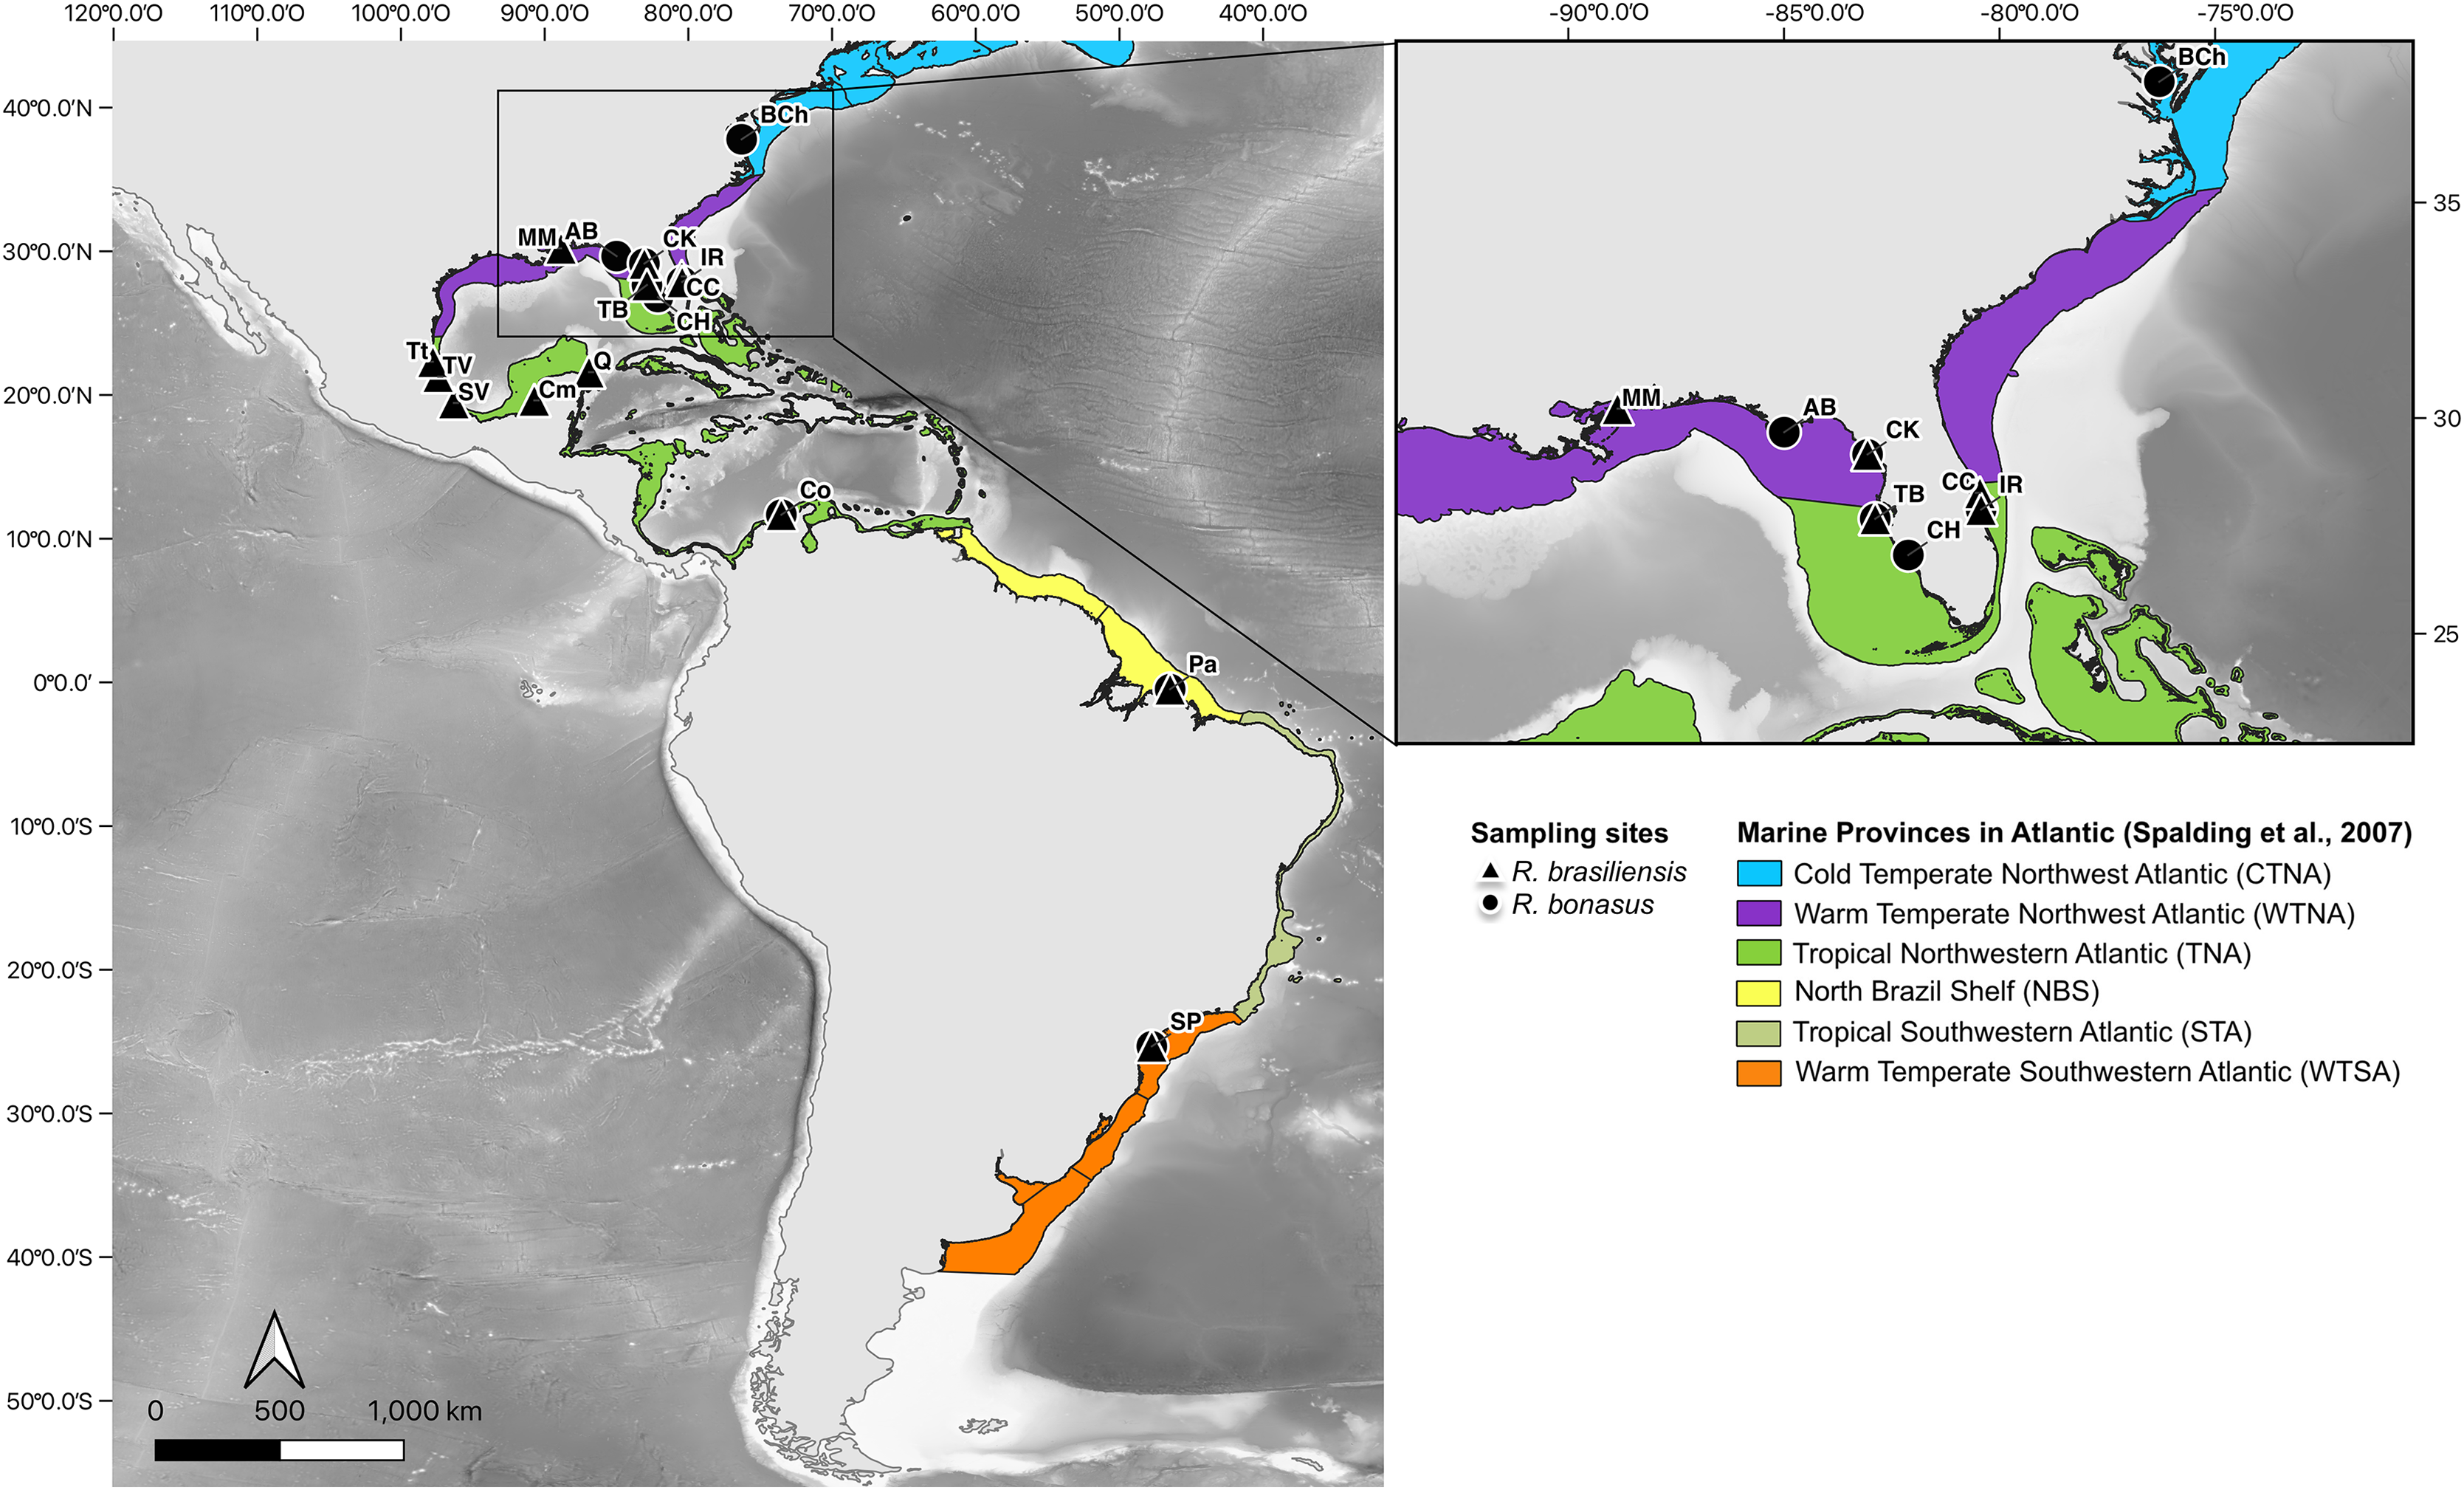
Mitochondrial DNA sequencing
We amplified partial sequences of two mitochondrial (mtDNA) genes: cytochrome oxidase subunit I (COI) and cytochrome b (Cytb) were amplified by Polymerase Chain Reactions (PCR) using the primers: FishF1 (5′-TCAACCAACCACAAAGACATTGGCAC-3′), FishR1 (5′-TAGACTTCTGGGTGGCCAAAGAATCA-3′) (Ward et al., 2005) for COI whereas the primers described by McDowell & Fisher (2013); the RbCytbF (5′-GGCCTHTTYCTRGCTATACACTACACAC-3′), RbCytbR (5′-AGGGRTGGAATGGRATTTT-3′), were for Cytb. The PCR occurred in 15 μL of the final volume containing 1.5 mM of MgCl2, 0.2 mM of each dNTP, 10 pm/μL of each primer, and 1 U Taq DNA polymerase and 1 μL of DNA template (20 ng/μL). For the mitochondrial COI gene, we set thermal profiles as follows: initial denaturation of 95 °C for 2 min, 35 cycles at 94 °C for 30 s, 54 °C for 1 min, 72 °C for 1 min, and a final extension at 72 °C for 10 min. For the Cytb gene, the conditions were: initial denaturation of 94 °C for 3 min, 35 cycles at 94 °C for 1 min, 56 °C for 1 min, 72 °C for 1 min, and a final extension at 72 °C for 7 min. We visualized all PCR products by 1.5% agarose gel electrophoresis, then were sequenced (including amplicon purification) by MacroGen (MacroGen Inc., Seoul, South Korea). GenBank accession numbers for each COI and Cytb haplotypes are listed in supporting information (Table S2; accession numbers OR710910–OR710922). All sequences were analyzed and edited in BioEdit v7.0.5.3 (Hall, 1999) and then aligned using the MUSCLE algorithm (Edgar, 2004) in Mega 6.0.
Genetic clustering
We use a Bayesian Analysis of Population Structure approach implemented in BAPS v. 5.4 (Corander et al., 2008), to identify distinct mitochondrial genetic clusters by assigning individuals to populations. For that, we used a clustering mixture analysis with linked loci, K = 1–5 with 20 replicates and 100 iterations for each run (Corander & Marttinen, 2006; Corander et al., 2008).
Genetic diversity and spatial distribution
The indices of genetic diversity, such as the number of polymorphic sites (S), number of haplotypes (H), haplotype diversity (hd), and nucleotide diversity (π), were estimated for each locality separately, then all were estimated considering the grouping determined by BAPS (Table S3), and subsequently for the entire set of individuals of each species, using DnaSP v.5.1 (Librado & Rozas, 2009). For each molecular marker, we constructed the haplotype networks through the median-joining method (Bandelt, Forster & Röhl, 1999) included in PopART (Leigh & Bryant, 2015). To better predict the pattern of genetic diversity distribution of each genetic group identified with BAPS, we applied the hypothesis of continuous population spreading by interpolating haplotype diversity (hd) data from each locality to adjacent areas along their known geographic distribution. The hd values of each genetic group were interpolated by the Kriging method (geostatistical interpolation method that creates a smooth surface even when sampling is spatially unequally, Oliver & Webster, 1990) in QGIS® v.3.22 software; then, surface maps of the interpolated hd for each group were made, representing the spatial patterns of the genetic groups inferred by BAPS.
Population structure analyses
The population differentiation through an analog of Wright’s pairwise FST fixation index (ΦST), and the Analysis of Molecular Variance (AMOVA) (Excoffier, Smouse & Quattro, 1992) were conducted to examine the null hypothesis of panmixia, these analyses were evaluated among all sampling sites and BAPS clustering results using Arlequin 3.5 (Excoffier & Lischer, 2010) with 10,000 permutations and α = 0.05. For R. bonasus three grouping scenarios were considered: (1) by biogeographic bioregionalization of Coastal and Shelf Areas proposed by Spalding et al. (2007) (Fig. 1) which, five of six provinces were represented (cold temperate Northwest Atlantic (CTNA), warm temperate Northwest Atlantic (WTNA), tropical Northwestern Atlantic (TNA), North Brazil Shelf (NBS) and warm temperate Southwestern Atlantic (WTSA)). (2) Previous genetic groups identified in the Northwest Atlantic × Northern Gulf of Mexico by Carney et al. (2017) and (3) considering the clustering determined by BAPS. For R. brasiliensis only scenarios corresponding to Spalding bioregionalization and results from BAPS were considered (scenarios 1 and 3, respectively). All P-values were corrected by the FDR method (Benjamini & Hochberg, 1995).
Environmental association analyses
To assess the correlation between oceanic landscape features with the genetic diversity of cownose rays, the environmental variables, maximum and minimum benthic (B) and surface (S) values of temperature (BTmax, BTmin, STmax, STmin), salinity (BSmax, BSmin, SSmax, SSmin), dissolved oxygen (BOmax, BOmin, SOmax, SOmin), current velocity (BCVmax, BCVmin, SCVmax, SCVmin) and bathymetry (BAT) were downloaded from the Bio-ORACLE database (https://www.bio-oracle.org). Spearman correlations were run to avoid autocorrelation among them (Table S4). We used ecological modeling based on canonical correspondence analysis (CCA) to combine genetic and oceanographic data (Jombart, Pontier & Dufour, 2009) with ‘cca’ function in a vegan package in R (Oksanen et al., 2022). For that, we use scaled haplotypic (hd) and nucleotide diversity (π) considering the genetic groups detected by BAPS for R. bonasus and R. brasiliensis, and non-correlated scaled oceanic variables.
Historical demography analyses
The demographic history of cownose rays was inferred from several approaches: mismatch distribution analysis, neutrality tests Fu’s (1996) Fs and Ramos-Onsins & Rozas’s (2002) R2 implemented in DNAsp v.5.1 (Librado & Rozas, 2009). The goodness of fit between the observed data and the expected mismatch distribution under each demographic scenario was evaluated with Harpending’s (1994) raggedness (r) index in ARLEQUIN (Rogers & Harpending, 1992). Each demographic scenario was run with 10,000 bootstrap replicates.
Results
Mitochondrial DNA sequencing
We analyzed COI sequences of 551 base pairs (bp) from a total of 230 sequences of Rhinoptera bonasus and 181 sequences of R. brasiliensis (including GenBank accession numbers OR710910–OR710922). Additionally, we obtained a fragment of 423 bp from the Cytb locus, including 108 sequences from R. bonasus and 105 sequences from R. brasiliensis. The concatenated databases (COI+Cytb) reduced the number of individuals and the number of locations of R. bonasus and R. brasiliensis, rendering the information inconclusive. Consequently, the results of subsequent analyses are not presented.
Genetic clustering
The clustering analysis conducted by BAPS revealed several coexisting genetic groups, indicative of well-differentiated groups within the same locality, for both genes and species (Figs. 2A, 2B, 2E, 2F). For R. bonasus, five groups were identified with COI: three overlapping groups among the cold, warm, and tropical biogeographic provinces of the Northwestern Atlantic, including Chesapeake Bay (BCh), Indian River Lagoon (IR), Charlotte Harbor (CH), Tampa Bay (TB), Cedar Key (CK), and Apalachicola Bay (AB); the fourth group encompassed localities in Colombia and northern Brazil (Tropical Northwestern Atlantic and North Brazil Shelf), while the fifth group corresponded to the São Paulo locality in the warm temperate Southwestern Atlantic biogeographic province (Figs. 2A, 3, Table S3). Cytb results indicated a similar pattern to COI: two geographically overlapping genetic groups in the Northwest Atlantic, from Chesapeake Bay to Apalachicola Bay, and one group in the tropical Southwest Atlantic encompassing localities in Colombia and São Paulo (Figs. 2B, 4, S1).
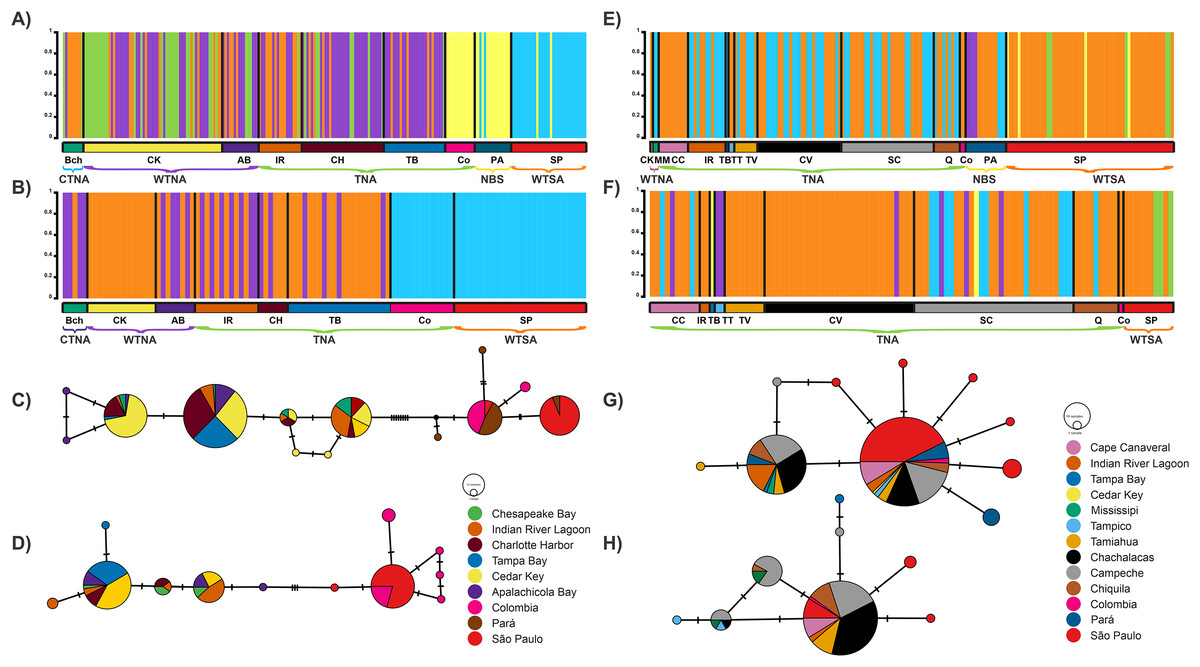
Figure 2: Bayesian analyses.
Plots from Bayesian analysis of population structure inferred with BAPS based on a fragment of the mitochondrial genes for Rhinoptera species: Rhinoptera bonasus COI (A) and Cytb (B). For R. brasiliensis COI (E) Cytb (F). Each color represents one distinct haplogroup (cluster), collection sites are separated by black lines. Statistical Median-joining haplotype network for Rhinoptera species: Rhinoptera bonasus COI (C) and Cytb (D). For R. brasiliensis COI (G) Cytb (H). Circles sizes are proportional to the number of individuals containing a given haplotype/location. Circles are colored to reflect the frequency of the haplotype in each designed geographic region (sampling sites), connecting lines represent single mutational steps, and small solid black circles represent hypothetical missing haplotypes not sampled.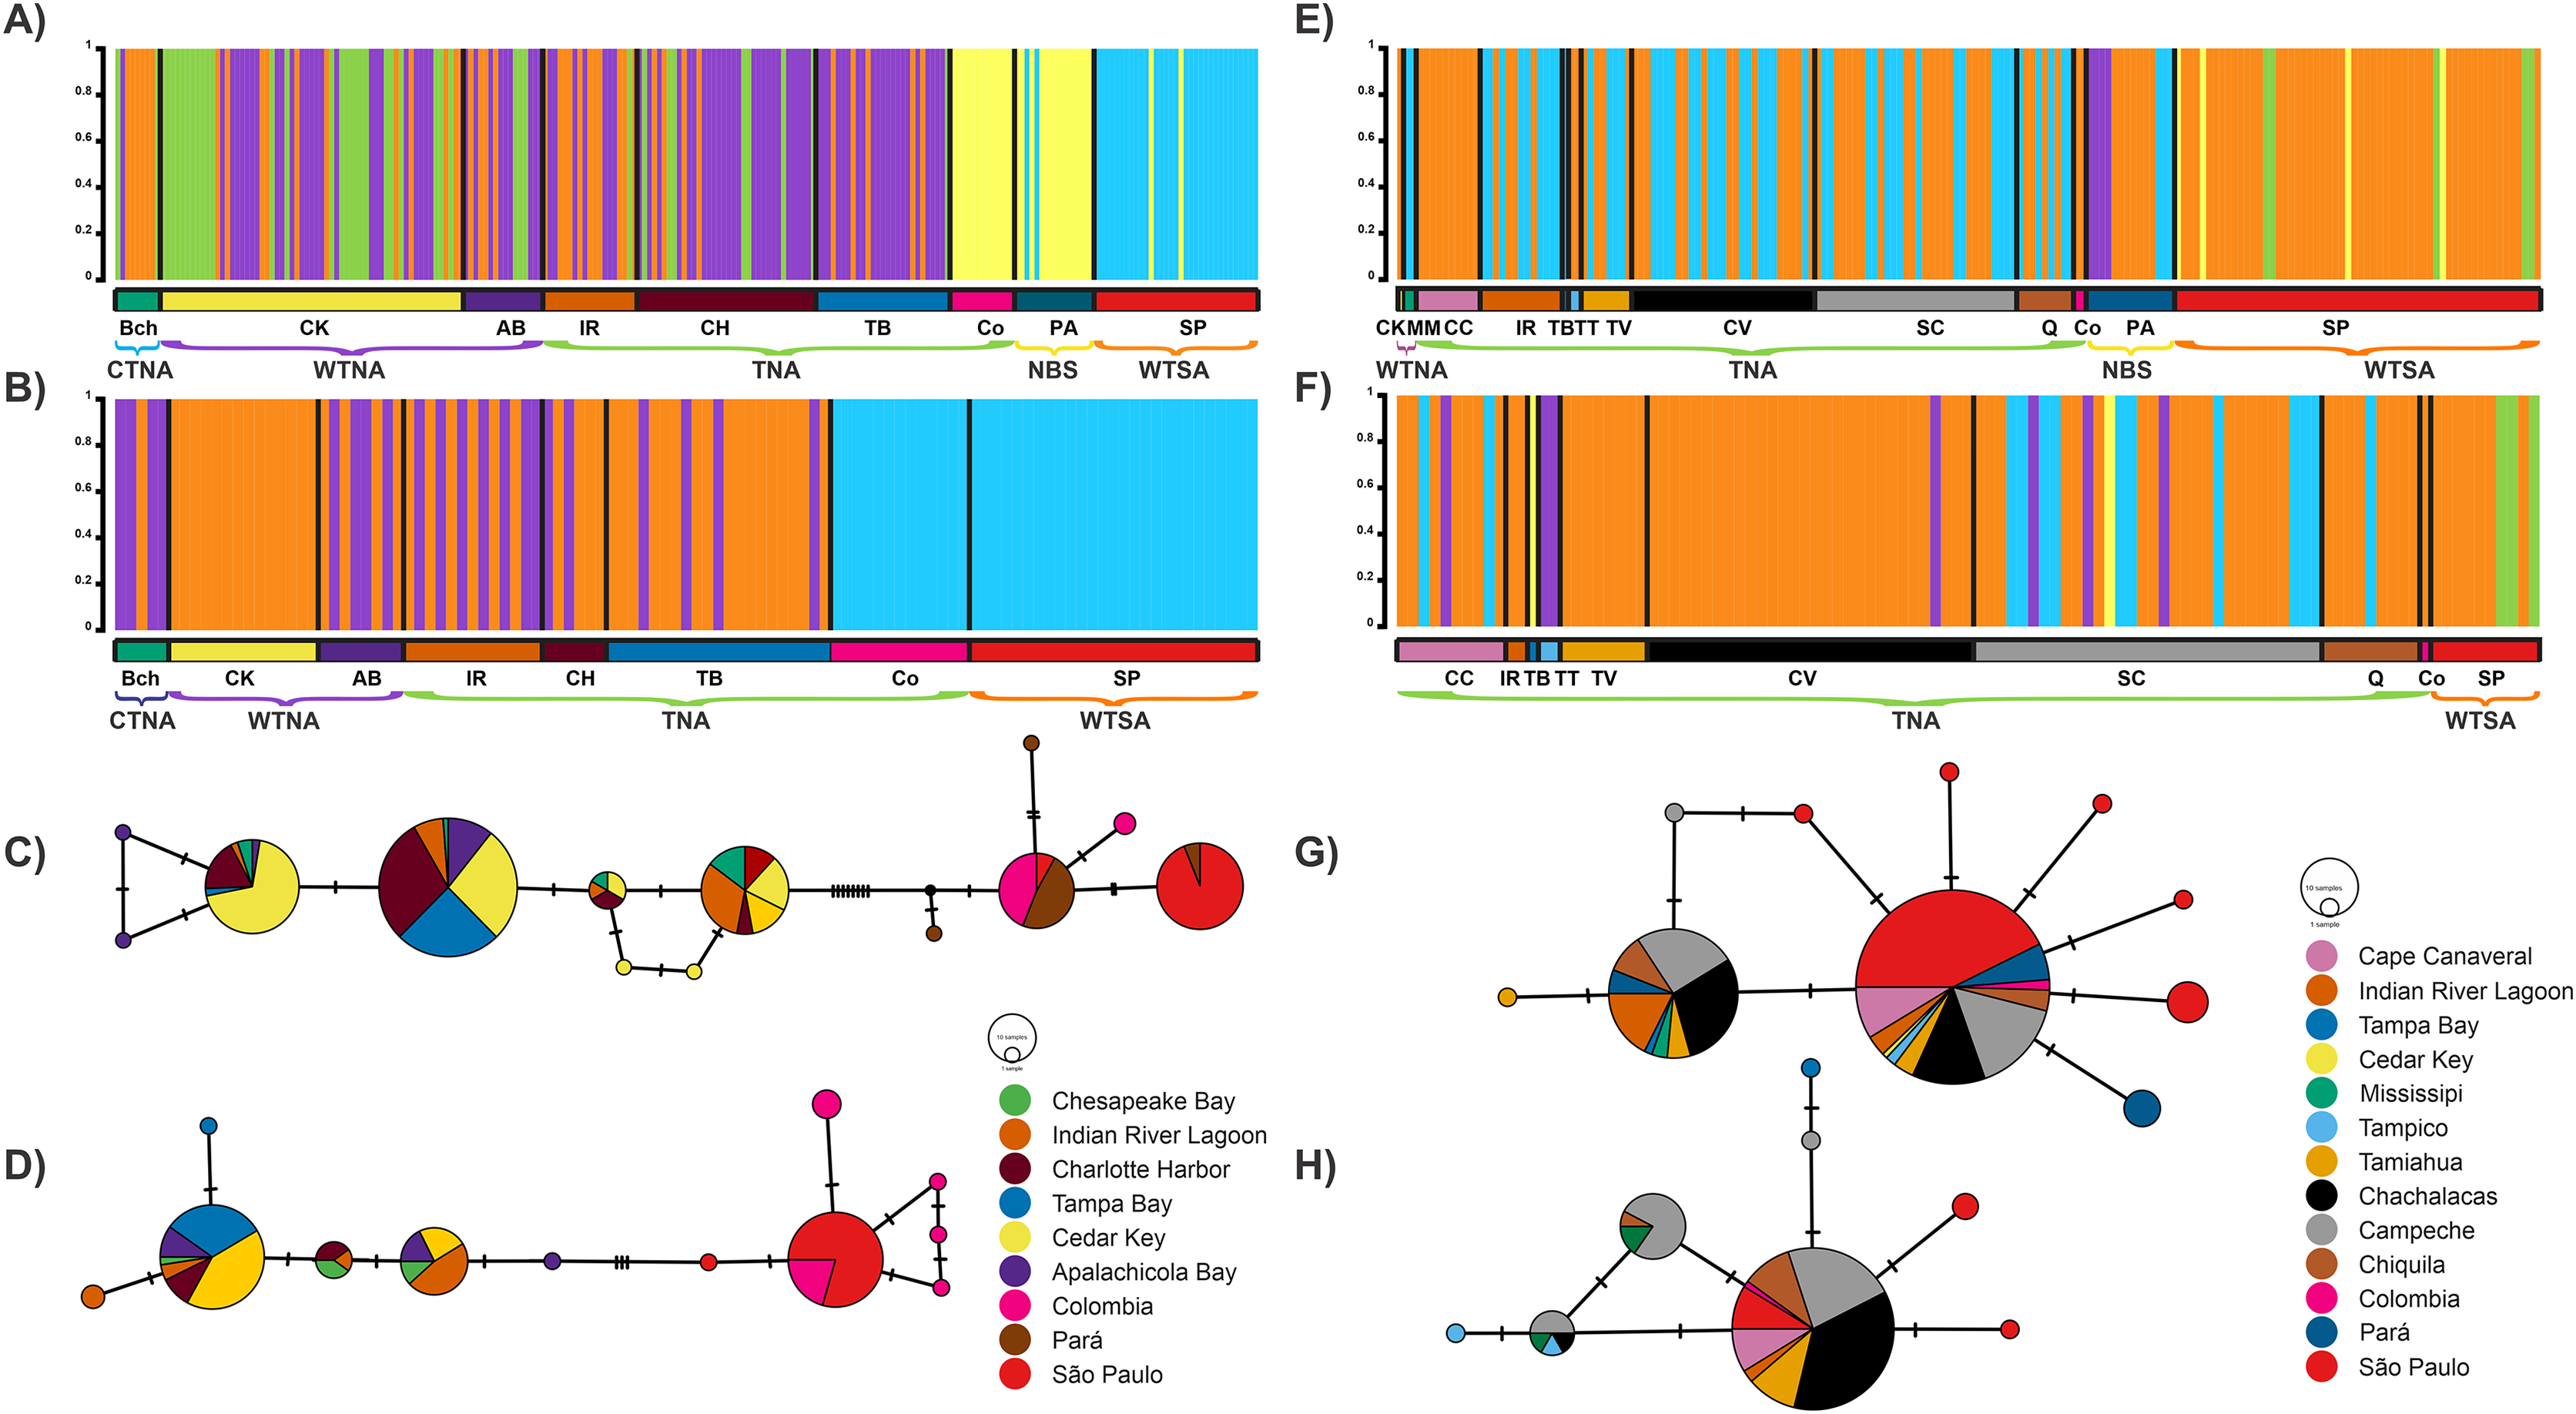
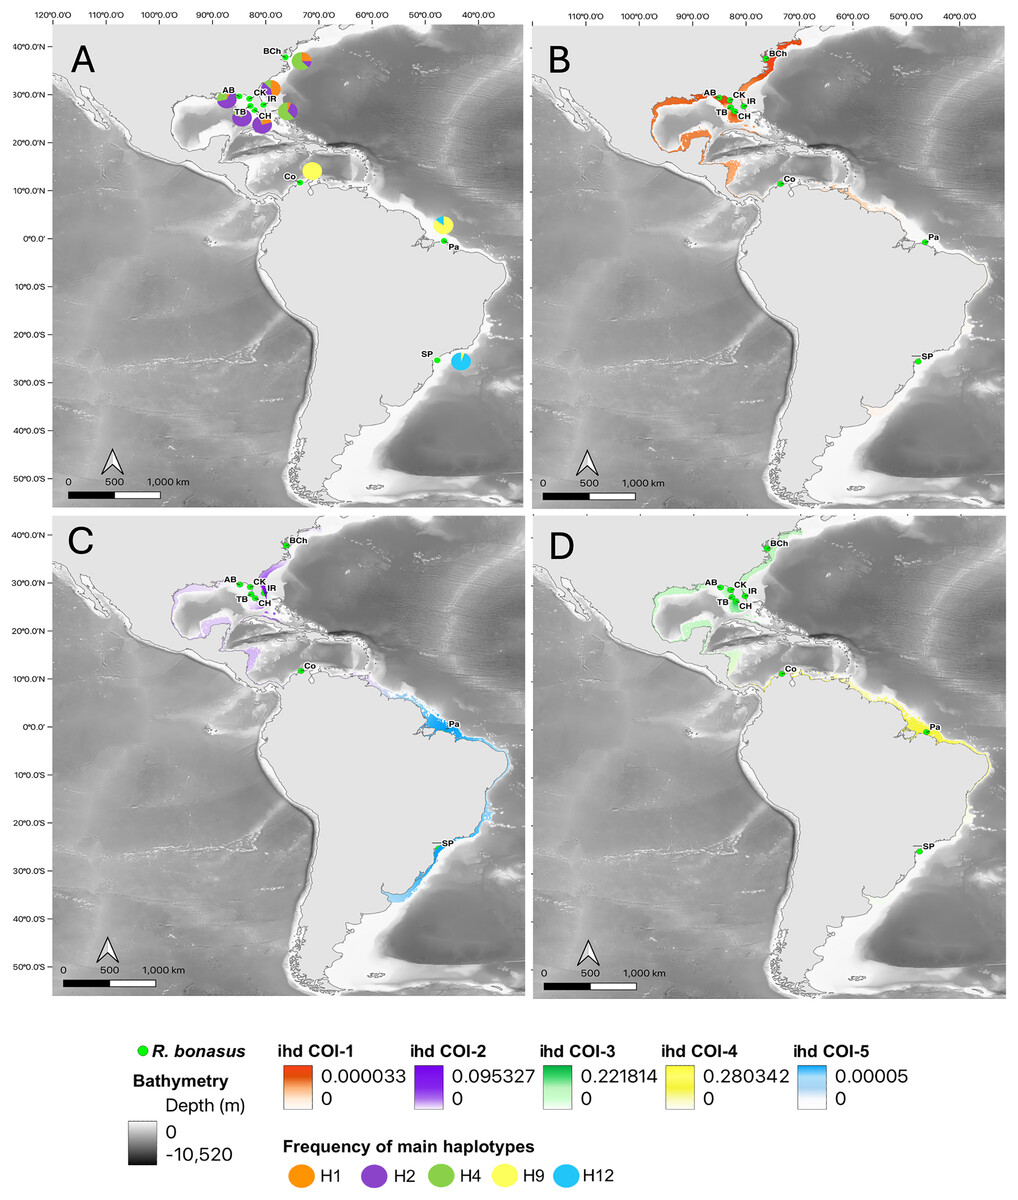
Figure 3: Haplotype frequencies and interpolated diversity of R. bonasus for COI.
Rhinoptera bonasus sampling sites (●) in Western Atlantic. (A) The frequency of the most important haplotypes for the COI gene, (B–D) The interpolated haplotype diversity (ihd) of the five COI genetic groups (ihd COI 1–5) detected by BAPS. Map created using the free and open source QGIS.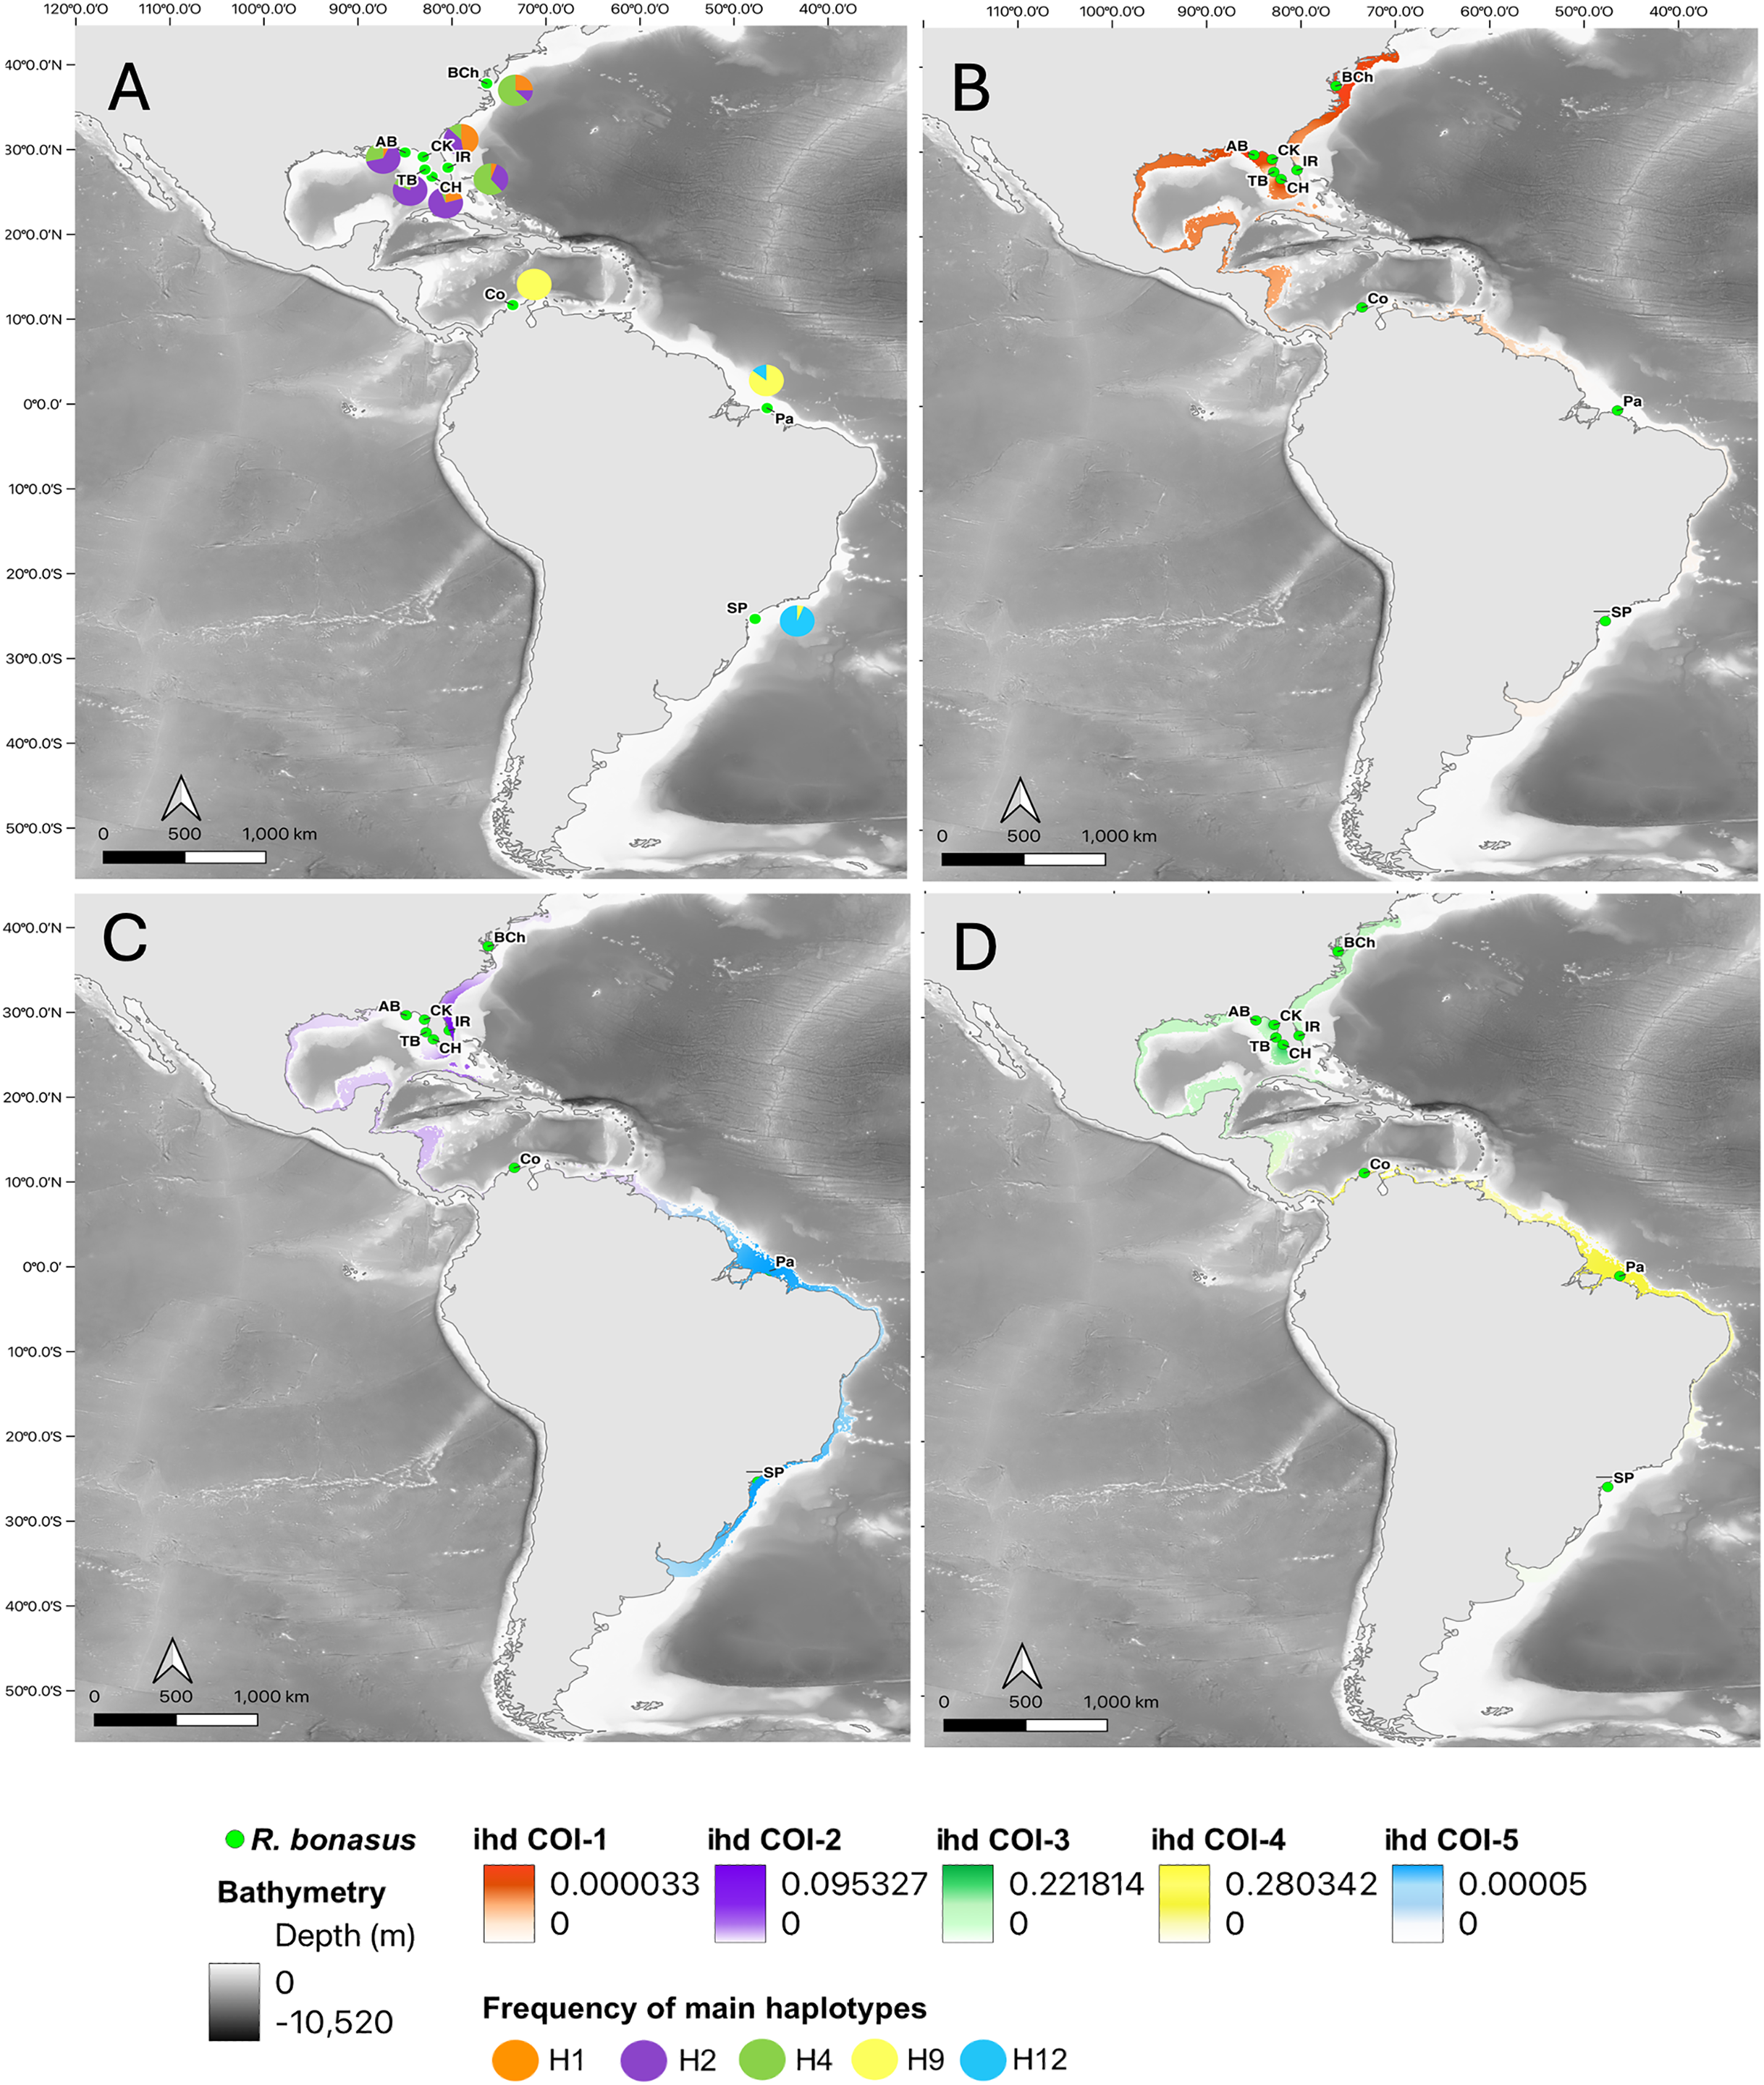
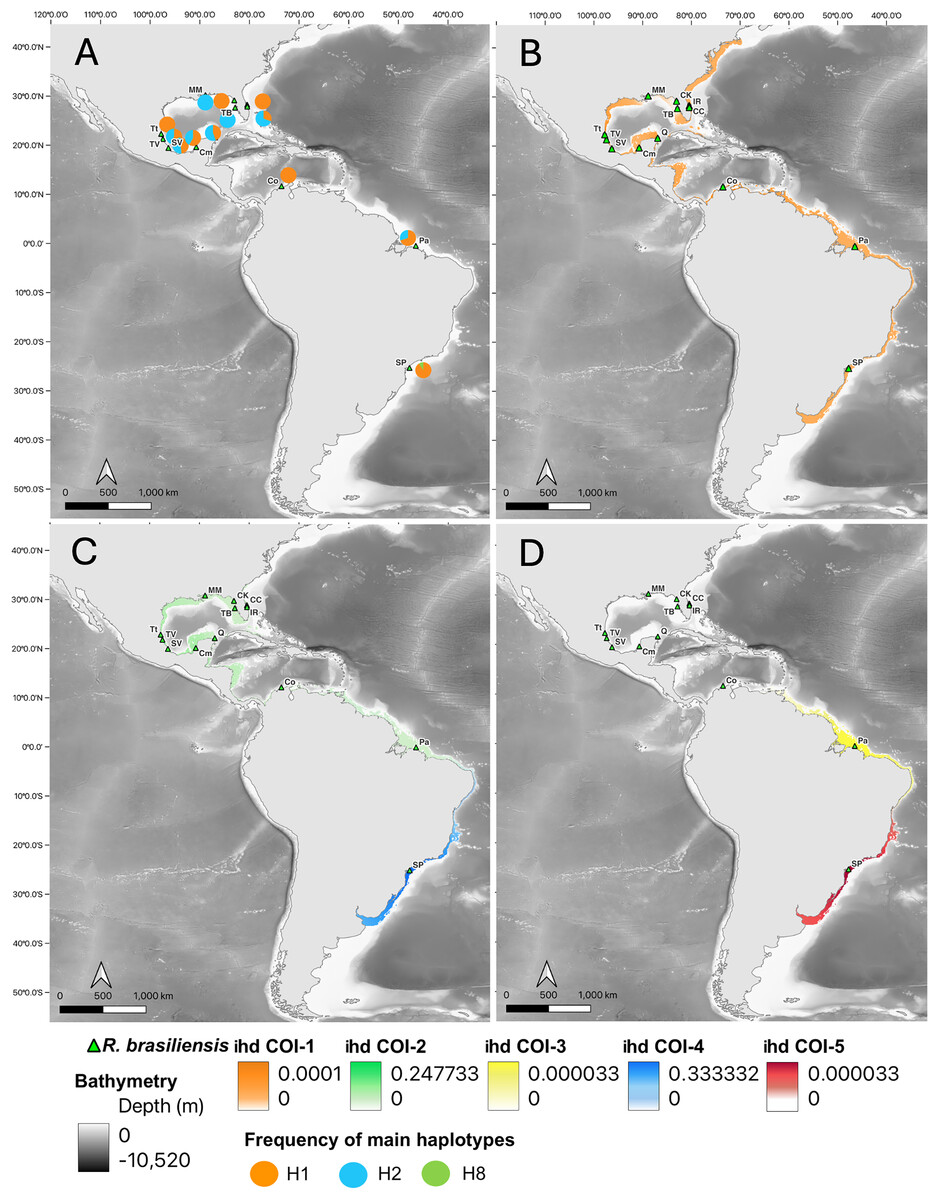
Figure 4: Haplotype frequencies and interpolated diversity for R. brasiliensis in COI.
Rhinoptera brasiliensis sampling sites (▴) in the Western Atlantic. (A) The frequency of the most important haplotypes of the COI gene, (B–D) The interpolated haplotypic diversity (ihd) of the five COI genetic groups (ihd COI 1–5) detected by BAPS. Map created using the free and open source QGIS.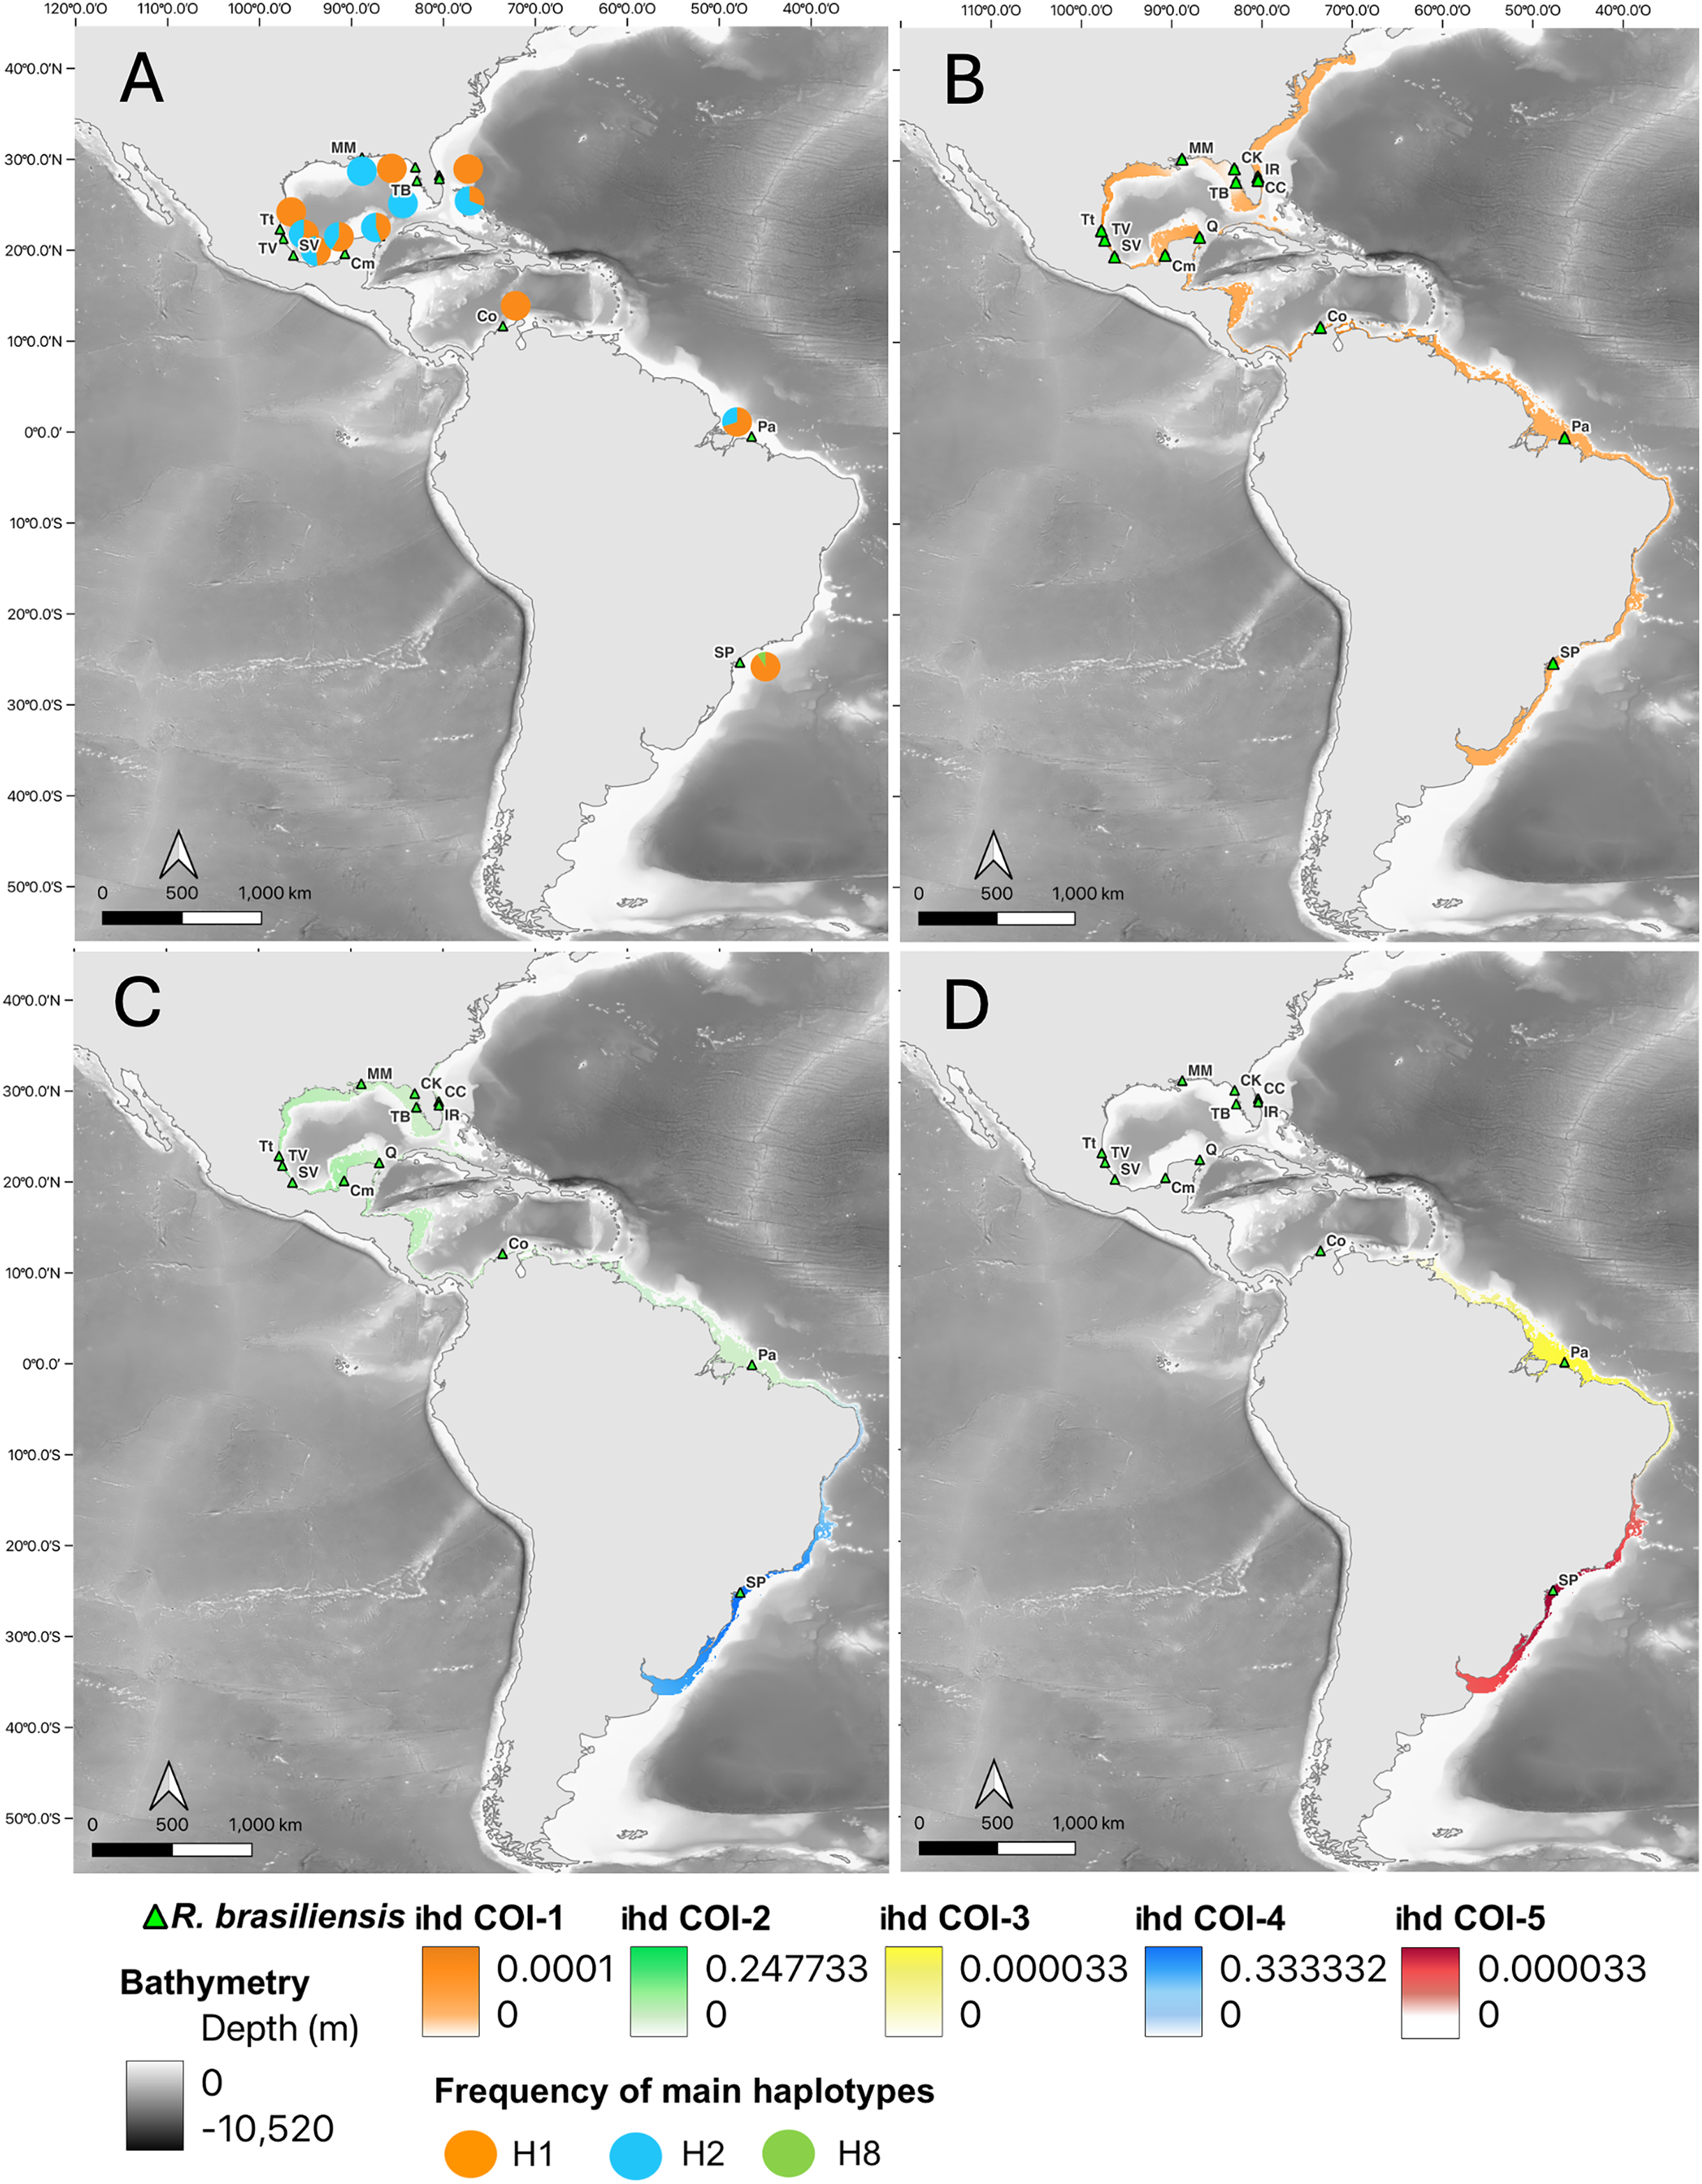
For R. brasiliensis, coexisting genetic group patterns were observed at broader scales than for R. bonasus. With COI, a group was identified spanning from Cape Canaveral (northernmost locality) to São Paulo (southernmost locality), the second extending from Indian River Lagoon (Florida) to Pará (Brazil), the third comprising only individuals from Pará (North Brazil Shelf biogeographic province), and two groups from São Paulo (Figs. 2E, 4, Table S3). Clustering obtained with Cytb did not exhibit a clear geographic pattern, as several coexisting groups were found, primarily in Gulf of Mexico localities; however, one group from the São Paulo locality was well-differentiated, although some individuals exhibited 100% similarity with individuals (n = 7) from the north (from Cape Canaveral and the Gulf of Mexico) (Fig. 2F, Table S3).
Genetic diversity
Haplotype diversity (hd) and nucleotide diversity (π) values were higher in R. bonasus as compared to R. brasiliensis for both genes.
Rhinoptera bonasus. The COI dataset exhibited 19 polymorphic sites, resulting in 11 haplotypes whereas the Cytb gene exhibited 11 polymorphic sites and 12 haplotypes (Table 1). Haplotype diversity (hd) was highest when assessed among localities, whereas, within the genetic groups generated by BAPS (Table S3), lower variation was observed among overlapping localities. The overall haplotype diversity (hd) among localities was 0.780 ± 0.016 for the COI gene and 0.735 ± 0.026 for the Cytb gene. Regarding nucleotide diversity (π), the overall value was 0.0140 ± 0.016 for the COI gene and 0.00848 ± 0.00030 for the Cytb gene (Table 1).
| Locality | Code | N | S | H | hd ± sd | π ± sd | N | S | H | hd ± sd | π ± sd |
|---|---|---|---|---|---|---|---|---|---|---|---|
| R. bonasus | COI | Cytb | |||||||||
| Chesapeake Bay | BCh | 9 | 3 | 4 | 0.694 ± 0.147 | 0.0028 ± 0.0006 | 5 | 2 | 3 | 0.800 ± 0.164 | 0.0023 ± 0.0006 |
| Indian River Lagoon | IR | 19 | 3 | 4 | 0.591 ± 0.088 | 0.0021 ± 0.0003 | 13 | 3 | 4 | 0.615 ± 0.136 | 0.0029 ± 0.0006 |
| Charlotte Harbor | CH | 36 | 3 | 4 | 0.487 ± 0.087 | 0.0012 ± 0.0002 | 6 | 1 | 2 | 0.533 ± 0.172 | 0.0012 ± 0.0004 |
| Tampa Bay | TB | 27 | 3 | 3 | 0.373 ± 0.101 | 0.0012 ± 0.0003 | 21 | 2 | 2 | 0.324±0.108 | 0.0015 ± 0.0005 |
| Cedar Key | CK | 61 | 4 | 6 | 0.658 ± 0.035 | 0.0020 ± 0.0002 | 14 | 1 | 2 | 0.143 ± 0.119 | 0.0003 ± 0.0002 |
| Apalachicola Bay | AB | 16 | 3 | 3 | 0.625 ± 0.093 | 0.0020 ± 0.0004 | 8 | 3 | 3 | 0.679 ± 0.122 | 0.0032 ± 0.0006 |
| Manaure, Colombia | Co | 13 | 1 | 2 | 0.282 ± 0.142 | 0.0005 ± 0.0002 | 13 | 3 | 5 | 0.692 ± 0.119 | 0.0022 ± 0.0005 |
| Pará, Brazil | Pa | 16 | 6 | 4 | 0.442 ± 0.145 | 0.0018 ± 0.0006 | 0 | 0 | 0 | ||
| Sao Paulo, Brazil | SP | 33 | 2 | 2 | 0.117 ± 0.073 | 0.0004 ± 0.0002 | 28 | 1 | 2 | 0.071 ± 0.065 | 0.0001 ± 0.0001 |
| Total | 230 | 19 | 11 | 0.780 ± 0.016 | 0.0140 ± 0.016 | 108 | 11 | 12 | 0.735 ± 0.026 | 0.0084 ± 0.0003 | |
| R. brasiliensis | COI | Cytb | |||||||||
|---|---|---|---|---|---|---|---|---|---|---|---|
| Cape Canaveral | CC | 10 | 0 | 1 | 0.000 ± 0.000 | 0.0000 ± 0.0000 | 10 | 1 | 3 | 0.511 ± 0.164 | 0.0012 ± 0.0003 |
| Indian River Lagoon | IR | 13 | 1 | 2 | 0.462 ± 0.110 | 0.0008 ± 0.0002 | 2 | 0 | 1 | 0.000 ± 0.000 | 0.0000 ± 0.0000 |
| Tampa Bay | TB | 1 | 0 | 0 | 0.000 ± 0.000 | 0.0000 ± 0.0000 | 1 | 0 | 0 | 0.000 ± 0.000 | 0.0000 ± 0.0000 |
| Cedar Key | CK | 1 | 0 | 0 | 0.000 ± 0.000 | 0.0000 ± 0.0000 | |||||
| Mississipi | MM | 2 | 0 | 1 | 0.000 ± 0.000 | 0.0000 ± 0.0000 | |||||
| Tampico Mexico | TT | 2 | 0 | 1 | 0.000 ± 0.000 | 0.0000 ± 0.0000 | 2 | 1 | 2 | 1.000 ± 0.500 | 0.0023 ± 0.0011 |
| Tamihaua, Mexico | TV | 8 | 2 | 3 | 0.679 ± 0.122 | 0.0014 ± 0.0003 | 8 | 0 | 1 | 0.000 ± 0.000 | 0.0000 ± 0.0000 |
| Chachalacas, Mexico | CV | 29 | 1 | 2 | 0.517 ± 0.026 | 0.0009 ± 0.0000 | 30 | 1 | 2 | 0.067 ± 0.061 | 0.0001 ± 0.0001 |
| Seybaplaya, Mexico | CS | 32 | 2 | 3 | 0.534 ± 0.045 | 0.0010 ± 0.0001 | 32 | 2 | 4 | 0.595 ± 0.064 | 0.0014 ± 0.0001 |
| Chiquila, Mexico | Q | 9 | 1 | 2 | 0.556 ± 0.090 | 0.0010 ± 0.0001 | 9 | 1 | 2 | 0.222 ± 0.166 | 0.0005 ± 0.0003 |
| Ciénaga, Colombia | Co | 2 | 0 | 0 | 0.000 ± 0.000 | 0.0000 ± 0.0000 | 1 | 0 | 0 | 0.000 ± 0.000 | 0.0000 ± 0.0000 |
| Pará, Brazil | PA | 14 | 2 | 3 | 0.670 ± 0.082 | 0.0015 ± 0.0002 | |||||
| Sao Paulo, Brazil | SP | 58 | 5 | 6 | 0.283 ± 0.075 | 0.0005 ± 0.0001 | 10 | 2 | 3 | 0.511 ± 0.164 | 0.0013 ± 0.0004 |
| Total | 181 | 8 | 10 | 0.518 ± 0.031 | 0.0011 ± 0.0000 | 105 | 6 | 8 | 0.404 ± 0.057 | 0.0010 ± 0.0001 | |
Note:
Diversity indexes obtained for each mitochondrial fragment. Number of individuals (N), polymorphic sites (S), number of haplotypes (H), haplotype diversity (hd), nucleotide diversity (π).
The spatial relation of mitochondrial haplotypes from both loci revealed two primary phylogroups. Notably, there were exclusive haplotypes for Colombia and Brazil, which were separated from the CTNA, WTNA, and TNA biogeographic provinces by eight mutational steps in the COI gene and interestingly, there were shared haplotypes between Colombia and Brazil (Fig. 2A). In contrast, the separation occurred with only three mutational steps in the Cytb gene (Fig. 2B).
The interpolation of haplotype diversity (ihd) allowed us to visualize the geographical patterns of the genetic groups detected by BAPS. For COI, the genetic group with the highest ihd was group 4 (Colombia and northern Brazil, ihd = 0.28, Fig. 3B), for the overlapping groups in the northwest Atlantic (from Chesapeake to Apalachicola Bays) it was group 3 (ihd = 0.22, Fig. 3), while group 5 (Brazil) obtained low ihd values (ihd = 0.0005, Fig. 3D). For Cytb, the two overlapping genetic groups in the Northwest Atlantic showed similar values of ihd (ihd = 0,22 and ihd = 0.23, respectively, Fig. S1) and the group that includes Colombia and São Paulo had the highest ihd (ihd = 0.687, Fig. S1).
Rhinoptera brasiliensis. The COI sequences from 181 individuals revealed the presence of eight polymorphic sites, resulting in 10 haplotypes. In contrast, the fragment from the Cytb locus displayed six polymorphic sites, corresponding to eight haplotypes (Table 1).
Like R. bonasus, in R. brasiliensis, a higher haplotype diversity (hd) was observed across localities (Table S3), compared to the genetic groups generated in BAPS when clustering with overlapping localities. Considering the overall dataset, both markers exhibited low haplotype (hd COI = 0.518 ± 0.031; hd Cytb = 0.404 ± 0.057) and nucleotide diversities (π COI = 0.0011 ± 0.0000; π Cytb = 0.0010 ± 0.0001).
In general, the mtDNA haplotype network showed limited haplotype exchange between distant locations and a close relationship among haplotypes within the same localities or areas. Analysis of haplotype networks based on the COI gene (Fig. 2G) revealed the presence of two major haplotypes, encompassing all sampled localities. Conversely, the haplotype network constructed using the Cytb gene exhibited a dominant haplotype encompassing most localities, except for the Tampa Bay and Tampico localities (Fig. 2H).
The ihd of COI, for overlapped groups on a broad scale (from the US to Brazil), ranged from ihd = 0.0001 (group 1, Fig. 4B), to ihd = 0.247 (group 2, Fig. 4C). In São Paulo were identified two overlapped groups whose ihd was contrasting (group 4: ihd = 0.33 and group 5: ihd= 0.00003, Figs. 4C, 4D). Finally, the third group located in Pará, (Brazil) had the lowest idh (ihd= 0.00003, Fig. 4D). For Cytb, the broadly overlapped genetic groups range from ihd = 0.0001 (groups 1 and 4, Fig. S2) to ihd= 0.22 (group 2, Fig. S2). However, the presence of one group mainly inside the Gulf of Mexico (group 3) had the highest ihd (ihd = 0.98, Fig. S1) while the most southern group (group 5 in São Paulo) had ihd = 0.22 (Fig. S2C).
Population structure
The global population structure reveals the presence of significant population genetic structure in both species. Bayesian clusters in BAPS were consistent with the segregation pattern observed for haplotype networks based on COI and Cytb markers for both species.
The optimal scenario from this Bayesian clustering analysis defined K = 5 genetic groups for the COI gene, while for the Cytb gene, the best scenario was K = 3 for R. bonasus (Figs. 2A, 2B). In contrast, in R. brasiliensis, it defined a K = 5 for both genes (Figs. 2E, 2F).
For R. bonasus, the pairwise ΦST analysis revealed significant genetic differentiation primarily between the southeastern ecoregion, with the various groups from the Northern Gulf of Mexico and the Western North Atlantic region. However, a high genetic differentiation can be observed even between closely sampled regions (Table 2). When assessing divergence between regions, the pairwise ΦST estimates resulted in highly significant differences among these five biogeographic provinces (Table S4).
| BCh | IR | CH | TB | CK | AB | Co | PA | SP | ||
|---|---|---|---|---|---|---|---|---|---|---|
| COI | BCh | 0.001 | 0.017 | 0.081 | 0.476 | 0.001 | 0.000 | 0.000 | 0.000 | |
| IR | 0.385 | 0.000 | 0.232 | 0.002 | 0.154 | 0.000 | 0.000 | 0.000 | ||
| CH | 0.151 | 0.208 | 0.093 | 0.000 | 0.004 | 0.000 | 0.000 | 0.000 | ||
| TB | 0.132 | 0.028 | 0.050 | 0.068 | 0.285 | 0.000 | 0.000 | 0.000 | ||
| CK | −0.02 | 0.263 | 0.203 | 0.090 | 0.000 | 0.000 | 0.000 | 0.000 | ||
| AB | 0.331 | 0.026 | 0.106 | 0.010 | 0.275 | 0.000 | 0.000 | 0.000 | ||
| Co | 0.537 | 0.661 | 0.466 | 0.535 | 0.545 | 0.584 | 0.353 | 0.000 | ||
| PA | 0.453 | 0.598 | 0.420 | 0.467 | 0.480 | 0.530 | 0.006 | 0.000 | ||
| SP | 0.726 | 0.765 | 0.564 | 0.695 | 0.694 | 0.692 | 0.823 | 0.718 | ||
| Cytb | BCh | 0.604 | 0.258 | 0.022 | 0.002 | 0.299 | 0.006 | 0.000 | ||
| IR | −0.01 | 0.007 | 0.001 | 0.000 | 0.164 | 0.000 | 0.000 | |||
| CH | 0.099 | 0.332 | 0.120 | 0.078 | 0.283 | 0.001 | 0.000 | |||
| TB | 0.371 | 0.4035 | 0.109 | 0.186 | 0.194 | 0.000 | 0.000 | |||
| CK | 0.566 | 0.565 | 0.199 | 0.048 | 0.017 | 0.000 | 0.000 | |||
| AB | 0.021 | 0.068 | 0.085 | 0.081 | 0.298 | 0.000 | 0.000 | |||
| Co | 0.266 | 0.346 | 0.370 | 0.519 | 0.590 | 0.314 | 0.001 | |||
| SP | 0.791 | 0.797 | 0.835 | 0.818 | 0.904 | 0.769 | 0.299 |
Note:
BCh, Chesapeake Bay; IR, Indian River Lagoon; CH, Charlotte Harbor; TB, Tampa Bay; CK, Cedar Key; AB, Apalachicola Bay; Co, Colombia; SP, Southern Brazil. Pairwise ΦST values (below diagonal) and p values (above diagonal). Values in bold indicate significant values (p < 0.05). Pairwise ΦST estimates between sample sites of Rhinoptera bonasus. Analysis based on mitochondrial DNA COI and Cytb.
After FDR correction, the hierarchical AMOVA revealed a statistically significant population structure for most of the scenarios tested for both markers. The highest percentage of variation was recorded among populations within groups when scenarios 1 and 2 grouped by biogeographic provinces (scenario 1) and separation of the Northwest Atlantic from the northern Gulf of Mexico proposed by Carney et al. (2017) (scenario 2). Conversely, scenario 3 (groups detected by BAPS) showed the highest percentage of variation among groups for both genes (Table 3).
| Gene | Structuring hypothesis | Source of variation | Percentage of variation | Fixation index | p value |
|---|---|---|---|---|---|
| Rhinoptera bonasus | |||||
| COI | Scenario 1: 5 groups (biogeographic provinces) | Among groups | 4.73 | FCT 0.0473 | 0.3488 ± 0.0044 |
| CTNA × WTNA × TNA × NBS × WTSA | Among populations within groups | 83.75 | FSC 0.8791 | 0.0000 ± 0.0000 | |
| Within populations | 11.52 | FST 0.8848 | 0.0000 ± 0.0000 | ||
| Scenario 2: 5 groups (Carney et al., 2017) | Among groups | 20.52 | FCT 0.2051 | 0.0595 ± 0.0020 | |
| Northwest Atlantic × Northern Gulf of Mexico × Co × NBS × WTSA | Among populations within groups | 68.7 | FSC 0.8643 | 0.0000 ± 0.0000 | |
| Within populations | 10.79 | FST 0.8921 | 0.0000 ± 0.0000 | ||
| Scenario 3: 5 groups (detected by BAPS) | Among groups | 89.58 | FCT 0.8957 | 0.0000 ± 0.0010 | |
| Group 1 × Group 2 × Group 3 × Co+NBS × WTSA | Among populations within groups | 0.59 | FSC 0.0567 | 0.3184 ± 0.0040 | |
| Within populations | 9.83 | FST 0.9016 | 0.0000 ± 0.0000 | ||
| Cytb | Scenario 1: 4 groups (biogeographic provinces) | Among groups | 8.66 | FCT 0.0865 | 0.3685 ± 0.0157 |
| CTNA × WTNA × TNA × WTSA | Among populations within groups | 65.15 | FSC 0.7132 | 0.0000 ± 0.0000 | |
| Within populations | 26.19 | FST 0.7380 | 0.0000 ± 0.0000 | ||
| Scenario 2: 4 groups (Carney et al., 2017) | Among groups | 35.31 | FCT 0.3531 | 0.0417 ± 0.0060 | |
| Northwest Atlantic × Northern Gulf of Mexico × Co × WTSA | Among populations within groups | 39.86 | FSC 0.6162 | 0.0000 ± 0.0000 | |
| Within populations | 24.83 | FST 0.7517 | 0.0000 ± 0.0000 | ||
| Scenario 3: 3 groups (detected by BAPS) | Among groups | 68.32 | FCT 0.6832 | 0.0000 ± 0.0000 | |
| Group 1 × Group 2 × Co+WTSA | Among populations within groups | 9.44 | FSC 0.2979 | 0.0000 ± 0.0000 | |
| Within populations | 22.24 | FST 0.7776 | 0.0000 ± 0.0000 | ||
| Rhinoptera brasiliensis | |||||
| COI | Scenario 1: 4 groups (biogeographic provinces) | Among groups | −21.86 | FCT -0.2186 | 0.7497 ± 0.0124 |
| WTNA × TNA × NBS × WTSA | Among populations within groups | 114.35 | FSC 0.9384 | 0.0000 ± 0.0000 | |
| Within populations | 7.51 | FST 0.9249 | 0.0000 ± 0.0000 | ||
| Scenario 3: 5 groups (detected by BAPS) | Among groups | 96.02 | FCT 0.9602 | 0.0000 ± 0.0000 | |
| Group 1 × Group 2 × NBS × WTSA1 × WTSA2 | Among populations within groups | −0.12 | FSC -0.0296 | 0.3928 ± 0.0123 | |
| Within populations | 4.1 | FST 0.9590 | 0.0000 ± 0.0000 | ||
| Cytb | Scenario 1: 2 groups (biogeographic provinces) | Among groups | −33.92 | FCT -0.3391 | 0.5718 ± 0.0165 |
| TNA × WTSA | Among populations within groups | 117.47 | FSC 0.8771 | 0.0000 ± 0.0000 | |
| Within populations | 16.45 | FST 0.8355 | 0.0000 ± 0.0000 | ||
| Scenario 3: 3 groups (detected by BAPS) | Among groups | 91.39 | FCT 0.9139 | 0.0000 ± 0.0000 | |
| Group1 × TNA1 × TNA2 × TNA3 × WTSA | Among populations within groups | 1.81 | FSC 0.2106 | 0.5718 ± 0.0160 | |
| Within populations | 6.8 | FST 0.9320 | 0.0000 ± 0.0000 | ||
Note:
Fixation indexes defined as FST, the permutation of haplotypes among populations among groups; FSC, the permutation of haplotypes among populations within groups; FCT, the permutation of populations among groups; p-value, the marginal significance within a statistical hypothesis test representing the probability of the occurrence of a given event; cold temperate Northwest Atlantic (CTNA), warm temperate Northwest Atlantic (WTNA), tropical Northwestern Atlantic (TNA), North Brazil Shelf (NBS), warm temperate Southwestern Atlantic (WTSA). Groups detected by BAPS review supplemental table. Values in bold font indicate significant values (p < 0.05) after FDR correction. Hierarchical analyses of molecular variance (AMOVA) of Rhinoptera bonasus and R. brasiliensis, based on mitochondrial COI, and Cytb, datasets.
For R. brasiliensis, pairwise ΦST values show several significant differences among closely located populations for each gene (Table 4). However, when evaluating divergence between biogeographic provinces, samples from the WTSA province differ significantly from all other provinces, as observed with the COI gene (Table S4).
| CC | IR | TB | CK | MM | TT | TV | CV | CS | Q | Co | PA | SP | ||
|---|---|---|---|---|---|---|---|---|---|---|---|---|---|---|
| COI | CC | 0.004 | 0.999 | 0.999 | 0.014 | 0.999 | 0.020 | 0.004 | 0.010 | 0.011 | 0.999 | 0.039 | 0.779 | |
| IR | 0.634 | 0.999 | 0.999 | 0.518 | 0.169 | 0.366 | 0.353 | 0.185 | 0.666 | 0.147 | 0.013 | 0.000 | ||
| TB | 1.000 | −0.500 | 0.999 | 0.999 | 0.296 | 0.999 | 0.999 | 0.419 | 0.999 | 0.321 | 0.538 | 0.073 | ||
| CK | 0.000 | 0.333 | 1.000 | 0.338 | 0.999 | 0.999 | 0.999 | 0.999 | 0.999 | 0.999 | 0.999 | 0.999 | ||
| MM | 1.000 | −0.071 | 0.000 | 1.000 | 0.337 | 0.588 | 0.478 | 0.198 | 0.507 | 0.333 | 0.134 | 0.002 | ||
| TT | 0.000 | 0.456 | 1.000 | 0.000 | 1.000 | 0.603 | 0.499 | 0.552 | 0.444 | 0.999 | 0.999 | 0.999 | ||
| TV | 0.385 | −0.013 | −0.314 | −0.314 | 0.054 | 0.054 | 0.765 | 0.637 | 0.789 | 0.611 | 0.124 | 0.000 | ||
| CV | 0.381 | 0.006 | −0.071 | 0.000 | 0.166 | 0.212 | −0.055 | 0.620 | 0.999 | 0.466 | 0.017 | 0.000 | ||
| CS | 0.270 | 0.064 | 0.039 | −0.217 | 0.236 | 0.076 | −0.047 | −0.020 | 0.716 | 0.505 | 0.029 | 0.000 | ||
| Q | 0.518 | −0.060 | −0.250 | −0.000 | 0.086 | 0.242 | −0.100 | −0.075 | −0.047 | 0.487 | 0.079 | 0.000 | ||
| Co | 0.000 | 0.456 | 1.000 | 0.000 | 1.000 | 0.000 | 0.054 | 0.212 | 0.076 | 0.242 | 0.999 | 0.999 | ||
| PA | 0.155 | 0.291 | 0.251 | −0.604 | 0.395 | −0.129 | 0.109 | 0.189 | 0.135 | 0.159 | −0.129 | 0.000 | ||
| SP | −0.026 | 0.591 | 0.742 | −0.922 | 0.761 | −0.297 | 0.412 | 0.419 | 0.326 | 0.473 | −0.297 | 0.233 | ||
| Cytb | CC | 1.000 | 1.000 | 0.046 | 0.103 | 0.013 | 0.836 | 0.397 | 1.000 | 0.030 | ||||
| IR | −0.121 | 1.000 | 0.341 | 1.000 | 1.000 | 0.526 | 1.000 | 1.000 | 0.999 | |||||
| TB | 0.754 | 1.000 | 0.333 | 0.103 | 0.029 | 0.032 | 0.100 | 1.000 | 0.093 | |||||
| TT | 0.500 | 0.667 | 0.714 | 0.021 | 0.004 | 0.009 | 0.019 | 1.000 | 0.016 | |||||
| TV | 0.154 | 0.000 | 1.000 | 0.906 | 1.000 | 0.046 | 1.000 | 1.000 | 0.467 | |||||
| CV | 0.260 | −0.332 | 0.967 | 0.922 | −0.062 | 0.000 | 0.409 | 1.000 | 0.021 | |||||
| CS | −0.043 | −0.034 | 0.733 | 0.509 | 0.164 | 0.239 | 0.168 | 1.000 | 0.005 | |||||
| Q | 0.019 | −0.321 | 0.895 | 0.774 | −0.014 | 0.024 | 0.061 | 1.000 | 0.419 | |||||
| Co | −0.600 | 0.000 | 1.000 | 0.333 | 0.000 | −1.000 | −0.408 | −1.000 | 1.000 | |||||
| SP | 0.143 | −0.250 | 0.758 | 0.651 | 0.045 | 0.176 | 0.198 | 0.048 | −0.852 |
Note:
CC, Cape Canaveral; IR, Indian River Lagoon; CH, Charlotte Harbor; TB, Tampa Bay; CK, Cedar Key; AB, Apalachicola Bay; TT, Tampico; TV, Tamihaua; CV, Chachalacas; SC, Seybaplaya; Q, Chiquila, Co, Colombia; SP, Southern Brazil. Pairwise ΦST values (below diagonal) and p values (above diagonal). Values in bold and red indicate significant values (p < 0.05). Pairwise ΦST estimates between sample sites of Rhinoptera brasiliensis. Analysis based on mitochondrial DNA COI and Cytb.
Out of the two scenarios tested in the hierarchical AMOVA, only scenario 1, where groups were generated based on biogeographic provinces, obtained the highest percentage of variation among populations within groups, while scenario 2 (groups determined by BAPS) exhibited the highest percentage of variation among groups (Table 3).
Environmental association analyses
A total of 17 oceanic variables corresponding to benthic and surface environments were consulted, of which eight variables were excluded due to their high autocorrelation (Table S4). The relationship of genetic diversity (hd and π, of each gene for both species) with the nine uncorrelated environmental variables evaluated with the canonical correspondence analysis (CCA) indicated that for R. bonasus a strong relationship (98% explained variance) of the hd Cytb with latitude (Lat) and π Cytb with minimum surface salinity and longitude (SSMIN, Long). For hd and π of COI showed a strong correlation with the maximum values of maximum benthic temperature (BTMAX) and minimum benthic current velocity (BCVMIN, Fig. 5A). For R. brasiliensis the 99% of explained variance in CCA biplots indicated that surface and benthic current velocity (SCVMAX, BCVMIN, and BCVMAX, Fig. 5A) are the main environmental variables that explain the hd and π in for Cytb and COI.
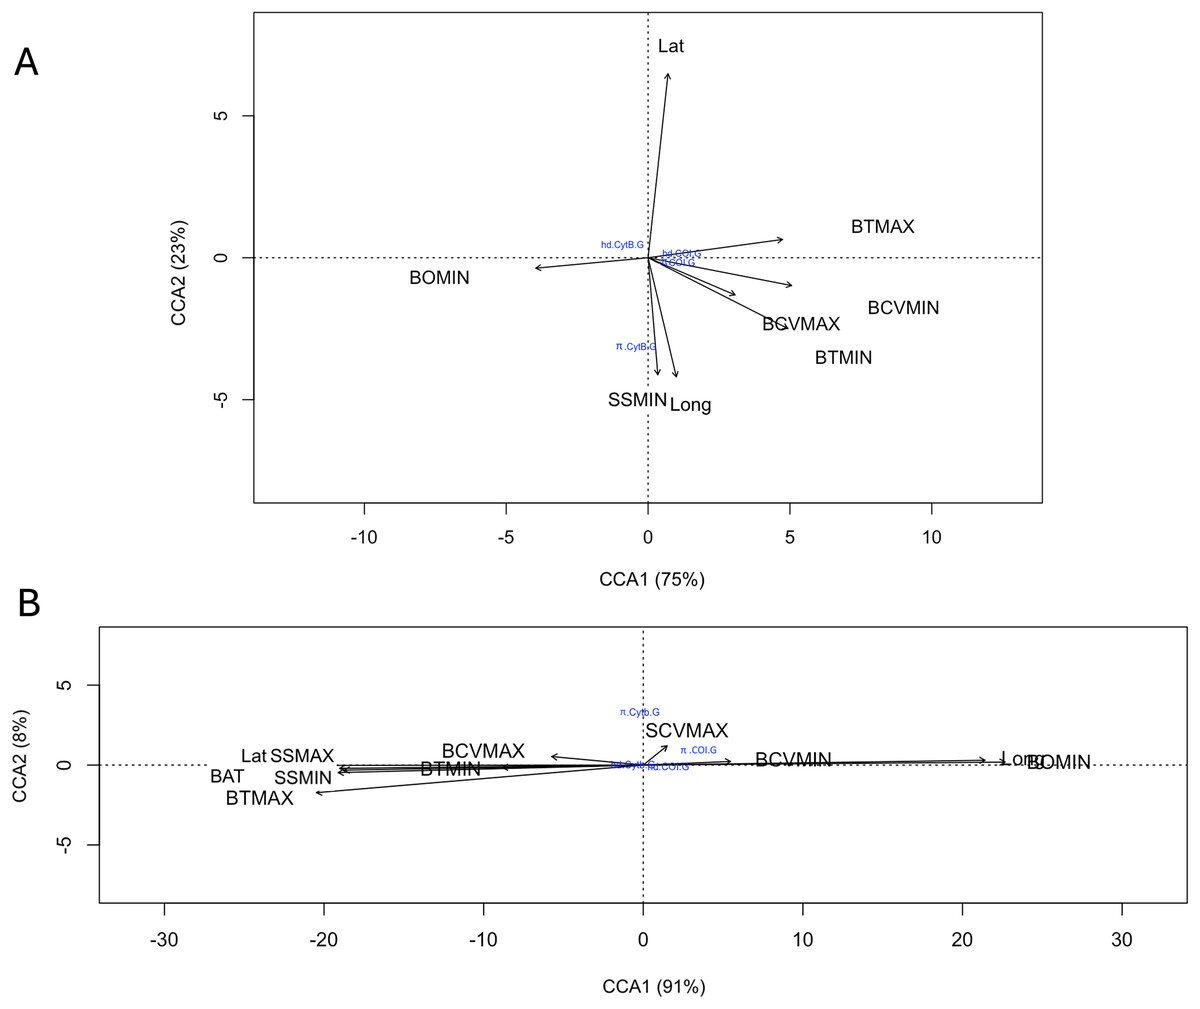
Figure 5: Canonical correspondence analysis (CCA) that evaluates the relationship among COI and Cytb genetic diversity (haplotype (hd) and nucleotide diversity (π)) with nine uncorrelated environmental variables for R. bonasus (A) and R. brasiliensis (B).
Environmental variables abreviation: bathymetry (BAT); minimum (BTMIN) and maximum (BTMAX) benthic temperature; minimum benthic dissolved oxygen (BOMIN), minimum (BCVMIN) and maximum benthic (BCVMAX) current velocity, minimum (SSMIN) and maximum (SSMAX) surface salinity; and maximum surface current velocity (SCVMAX).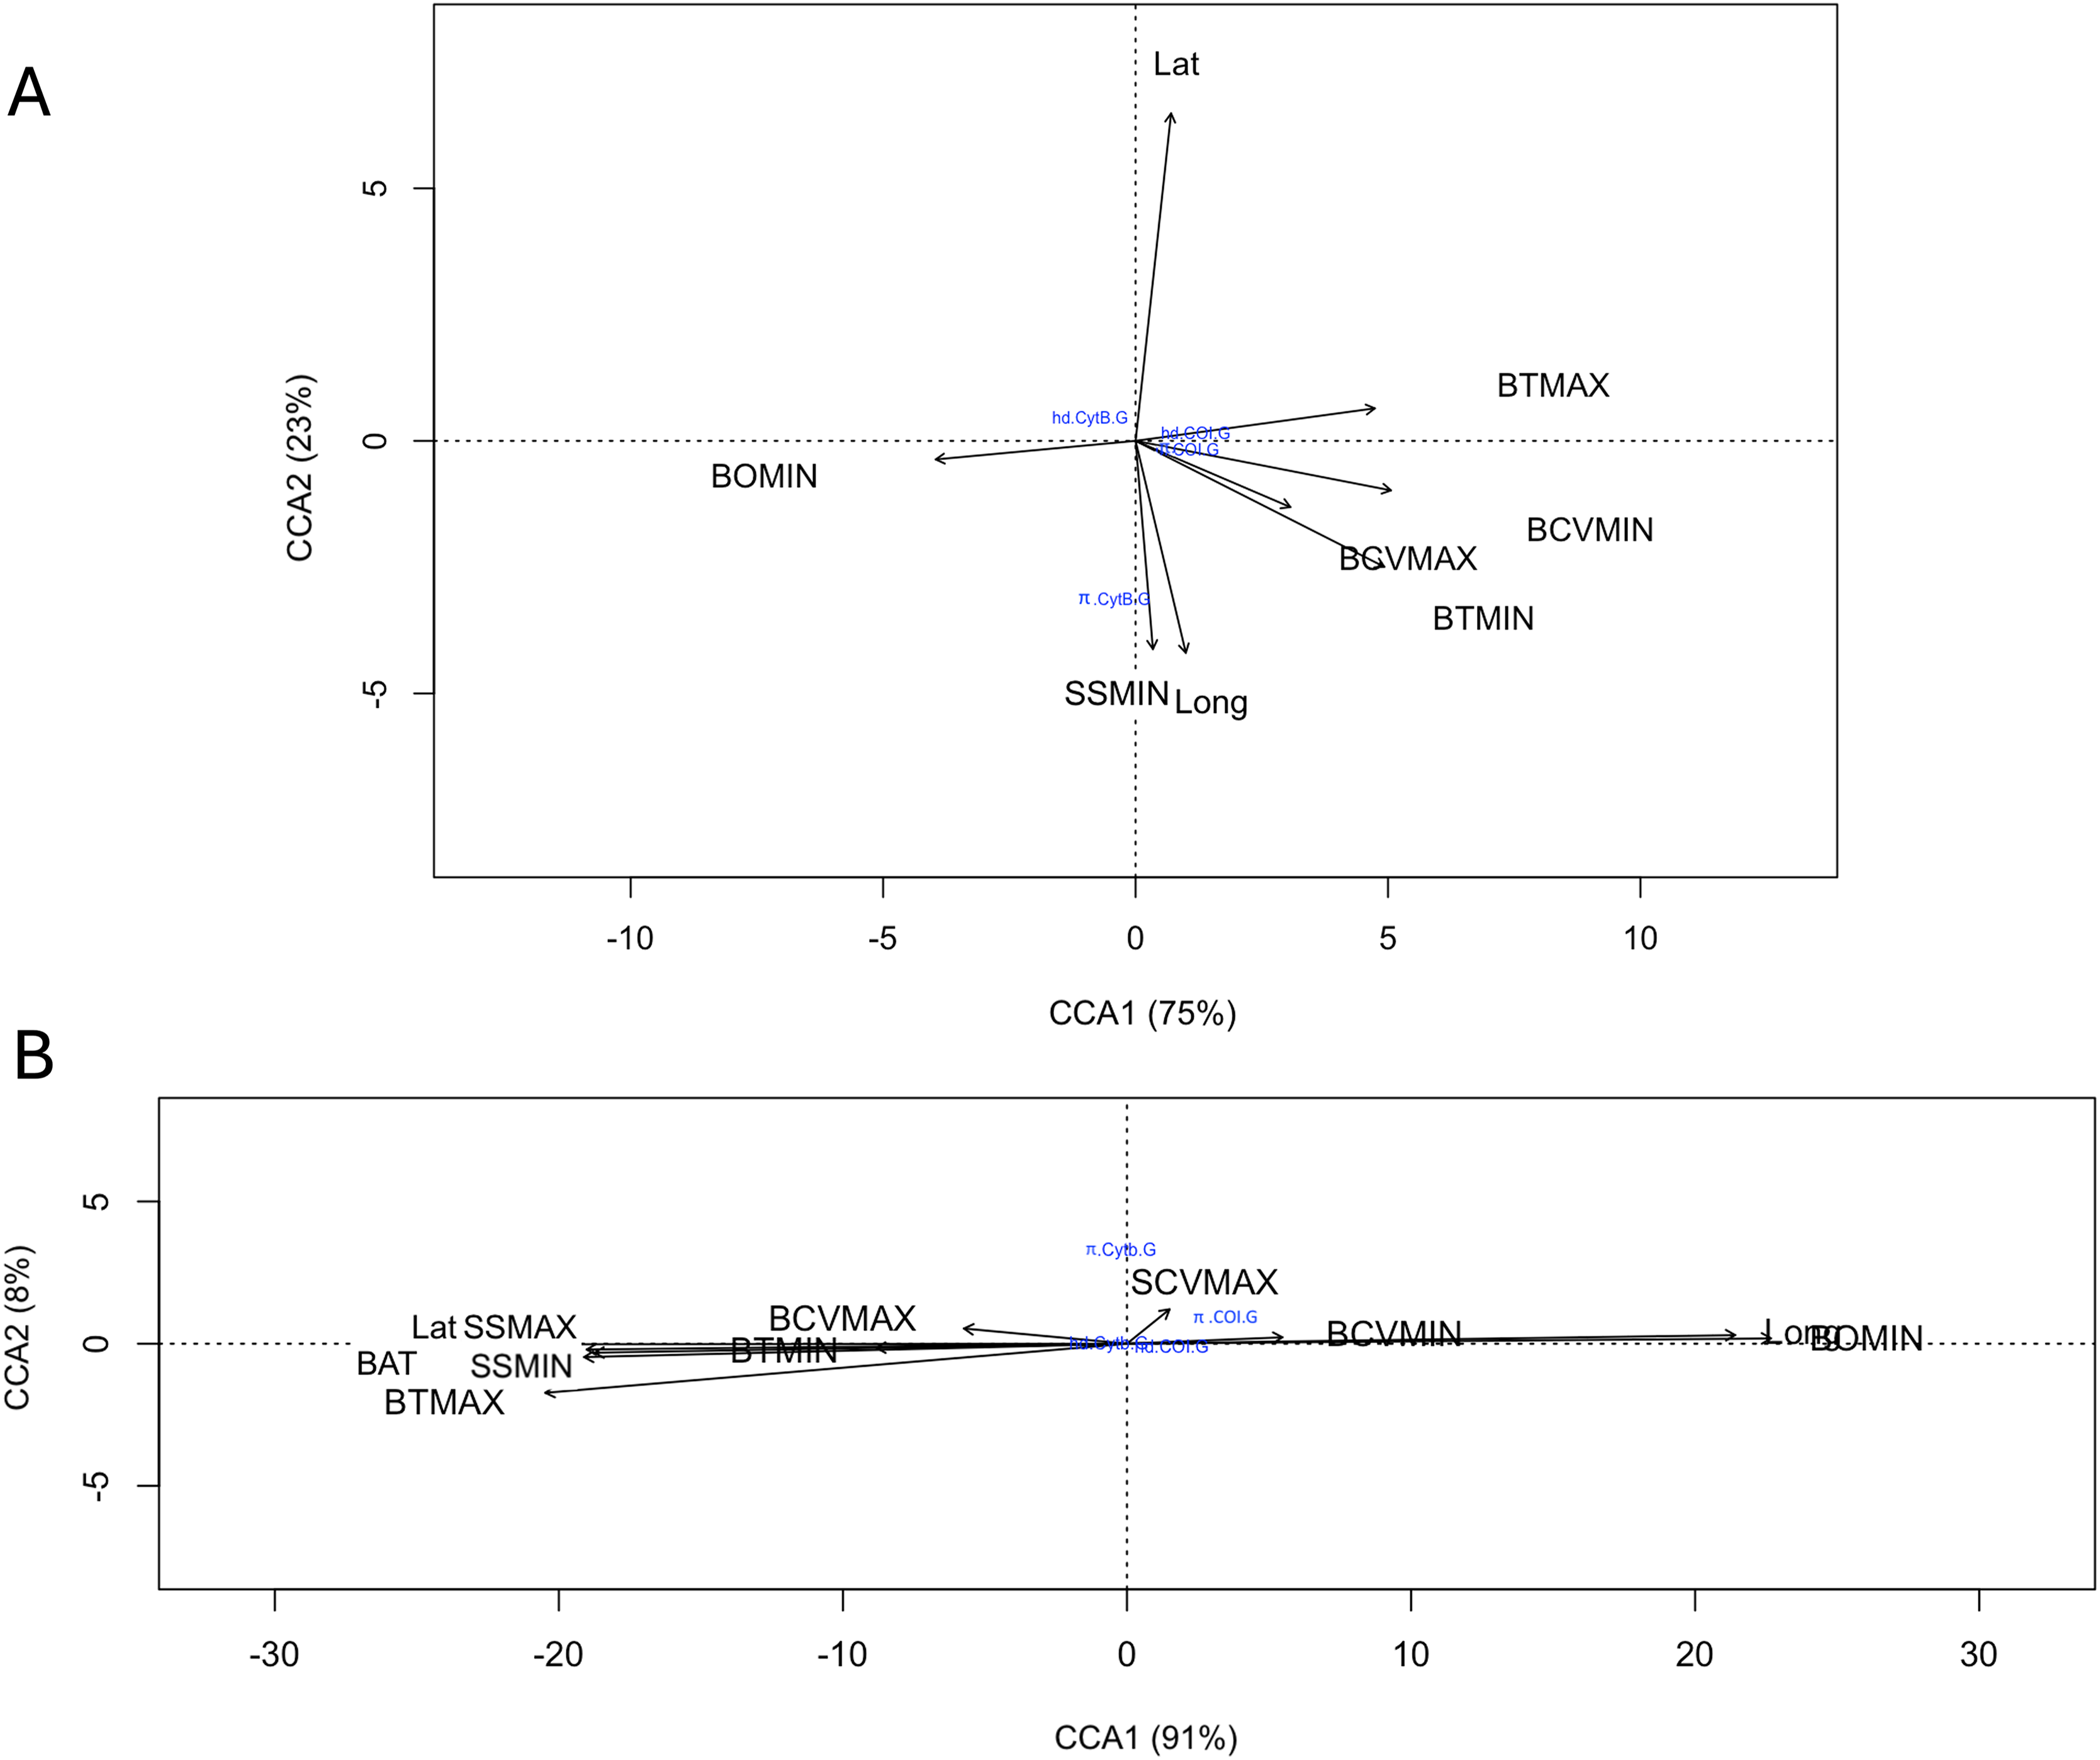
Demographic analysis
The demographic analysis, considering all samples or groups, did not reveal evidence of a sudden population expansion. Tajima’s (1989) neutrality tests yielded significant values only in the biogeographic province NBS: Tajima’s (1989) D COI = −1.593 (p < 0.043) for R. bonasus, while the Roza R2 tests were significant only in WTSA (R2 COI = 0.058, p < 0.000). For R. brasiliensis, Tajima’s (1989) neutrality values were significant only in the biogeographic province WTSA (D COI = −1.701, p < 0.012). However, Fu’s Fs statistic was significant in WTSA (Fs = −5.019, p < 0.001), and for all samples (Fs = −6.223, p < 0.008) for COI, while for Cytb it was significant in TNA (Fs = −2.868, p < 0.039), and for all samples (Fs = −5.489, p < 0.008) (Table S7). The mismatch distribution plot showed a unimodal distribution for both species and both mitochondrial DNA marker fragments (Figs. 4, S3–S6).
Discussion
This study represents the most extensive evaluation of the genetic diversity and population genetic structure of R. bonasus and R. brasiliensis across their distributional ranges. The recent increase in the distribution of R. brasiliensis has led to greater overlap with the ranges of R. bonasus (Jones et al., 2017; Palacios-Barreto et al., 2017; Weber et al., 2021), emphasizing the importance of fostering greater interest in the population genetics research of this species complex given its ecological and economic significance.
Genetic clustering
Bayesian assignment algorithms have recently emerged as a tool for inferring genetic structuring (Corander & Tang, 2007). These algorithms assign individuals to populations (without assuming predefined populations) only through genetic information, which is a significant advantage compared to methods requiring a priori-defined groups. Through this analysis, we identified a mixture of individuals among locations within the CTNA, WTNA, and TNA biogeographic provinces. Dispersal patterns in elasmobranchs are determined by habitat and life history traits in combination with marine landscape characteristics and biogeography (Phillips, Devloo-Delva & McCall, 2021). This is evidenced by the genetic clustering found with BAPS and the diverse outcomes obtained, which will be further discussed later.
Genetic diversity
Similar to the previous analysis conducted by Carney et al. (2017) on R. bonasus, where they utilized the same molecular markers, we observed similarities in the moderate levels of haplotype diversity between locations for both studies. However, R. bonasus in the São Paulo locality exhibited very low values of genetic diversity in both genes. The occurrence of zero values in certain locations within the groups identified by BAPS may be attributed to an artifact resulting from the small sample size and low variation within this mixture of subgroups from the locations.
All studied locations of cownose rays showed low nucleotide diversities for both mitochondrial fragments, highlighting the limited number of polymorphic sites present in the sequences. However, when comparing levels of genetic diversity with other ray species, R. brasiliensis exhibits one of the lowest nucleotide diversities recorded (Domingues, Hilsdorf & Gadig, 2018a; Weber, 2022; Kottillil et al., 2023), additionally, extremely low values were also found in Mediterranean electric rays (Melis et al., 2023), with nucleotide diversity of 0.001. Despite this, genetic diversity estimates of cownose rays fall within the average range estimated for rays in general. Additionally, the low genetic diversity of elasmobranchs has previously been associated with bottlenecks, and it is known that the slow rates of evolution of elasmobranch mitochondrial genes are lower compared to other vertebrates (Martin, Naylor & Palumbi, 1992). As a result, genetic diversity accumulates slowly in populations (Domingues, Hilsdorf & Gadig, 2018a).
Population structure
In this study, we incorporated samples covering locations representing the majority of the distribution of both species, compared to previous studies. We found that in R. bonasus in the Northwestern Atlantic, there are coexisting genetic groups, with discrete differences observed between the two biogeographic provinces of the Northwest Atlantic and northern Gulf of Mexico, resembling findings reported by Carney et al. (2017). The significant genetic differences observed among mtDNA lineages may also arise from a potential geographic or ecological barrier restricting gene flow between populations in the Gulf of Mexico and the North Atlantic, or from a combination of factors including philopatry or site fidelity.
The matrilineal population structure of R. bonasus in this region could potentially be interpreted as a signature of biparental reproductive philopatry, where males also return to the same area for mating purposes (Pearce et al., 2021; Phillips, Devloo-Delva & McCall, 2021). R. bonasus is known to exhibit biparental philopatry in the northwest Atlantic, where males and females travel to the Chesapeake Bay every summer to give birth and mate (Fisher, Call & Grubbs, 2013). This shows that, in some species, males who devote their efforts to reproductive philopatry may gain more from increased fitness than previously believed. This could be due to the need to optimize the number of opportunities for mating with reproductively active females (Pearce et al., 2021; Phillips, Devloo-Delva & McCall, 2021). As demonstrated by Benavides et al. (2011) and Chapman et al. (2015), philopatry can produce population structure in elasmobranchs and prevent reproductive mixing even in cases of significant migration. According to Feldheim et al. (2014), species whose distributions are significantly fragmented or patchy due to the scarcity of nursery environments may experience specialized natal philopatry. This phenomenon has been reported in species with affinity to riverine sites, which can function as nurseries (e.g. bull shark Carcharhinus leucas, Laurrabaquio-A et al., 2019) and largetooth sawfish Pristis pristis (Phillips et al., 2011; Feutry et al., 2015) with use of coastal rivers and associated estuarine habitats as their breeding grounds. As with cownose rays, this could explain the presence of different haplotypes where multiple shared haplotypes exist, including the most abundant ones, but with different frequencies (see Figs. 3, 4).
Migratory species connect physically dispersed habitats, making understanding their migrations crucial for management and conservation. Rhinoptera bonasus, despite its widespread range, has been researched mostly along the Atlantic coast of the United States, where individuals venture into estuaries for feeding, pupping, and mating purposes (Fisher, Call & Grubbs, 2013). Water temperature is one of the most important factors for migrations to take place since it was found that the temperature tolerance range of R. bonasus is 15 °C to 31 °C (Bangley et al., 2021; Goodman, Conn & Fitzpatrick, 2011). During the spring and summer, these rays occupy estuaries in the northern part of their range, but as fall and winter arrive, they migrate southward (Last et al., 2016). Notably, research conducted by Ogburn et al. (2018) has reported resident, ranging, and migratory behavioral states, even in those individuals generally classified as non-migratory (resident and ranging) in summer and winter, and migratory (migratory) in spring and fall, exhibit consistent site fidelity to their summer habitats, indicating a potential philopatric tendency as these estuaries serve as crucial nurseries. This philopatric migration pattern may contribute to the population structure observed here in the Northwestern Atlantic (Flowers et al., 2016; Carney et al., 2017; Souza et al., 2021).
Haline and thermal barriers, as well as ocean currents, play a crucial role in dispersal and gene flow at various spatial scales (Santos et al., 2006). In the Northwest Atlantic, there are areas with diverse environmental conditions, mainly in temperature, since two biogeographic provinces converge: the Cold Temperate (CTNA) and Warm Temperate Northwest Atlantic (WTNA, Fig. 1) as well the geographic barrier such as the Florida Peninsula, in particular, serves as a distinctive example of a barrier influenced by a combination of geographical and hydrological factors. This extensive landmass effectively separates the Gulf of Mexico from the Atlantic Ocean, transitioning from temperate to subtropical waters. This geographical feature is further accentuated by a narrow continental shelf along the Atlantic coast, coupled with the influence of strong currents streaming through the Florida Straits and into the Atlantic, as noted by Avise (1992) and Gold & Richardson (1998). In this zone, we found a notable difference between the minimum and maximum benthic temperature ranges in North Atlantic and Gulf of Mexico localities (Fig. S5), from Chesapeake Bay (BCh: BTMAX = 27.83 °C, BTMIN = 3.25 °C), Cedar Key (CK: BTMAX = 31.03 °C, BTMIN = 14.93 °C) to Mississippi (MM: BTMAX = 30.86 °C, BTMIN = 14.51 °C, Table S7), sites where the greatest genetic diversity was found at the locality level (BCh: hd ≥ 0.69, π ≥ 0.023; CK: hd ≥ 0.143; π ≤ 0.020, Table S3) and where two genetic groups of R. bonasus overlap (Fig. 3).
Ecological barriers among the three regions where divergent lineages were observed seem to be the most plausible explanation as it has been supported in earlier studies on various elasmobranchs species, for example the blacktip shark Carcharhinus limbatus (Keeney et al., 2005), the bonnethead shark Sphyrna tiburo (Escatel-Luna et al., 2015; Portnoy et al., 2015; Fields et al., 2016), the whitespotted eagle ray Aetobatus narinari (Sellas et al., 2015), and the southern stingray Hypanus americanus (Richards, DeBiasse & Shivji, 2019), indicating limited gene flow between these areas. Even among large coastal shark species, genetic differences at larger spatial scales between western North Atlantic and western South Atlantic populations have been reported using mitochondrial markers, for example scalloped hammerhead (Sphyrna lewini, Chapman, Pinhal & Shivji, 2009; Pinhal et al., 2020), bull shark (Carcharhinus leucas, Karl et al., 2011), Caribbean sharpnose shark, (Rhizoprionodon porosus, Mendonça, Oliveira & Gadig, 2011), nurse shark (Ginglymostoma cirratum, Karl, Castro & Garla, 2012), Brazilian sharpnose shark (Rhizoprionodon lalandii, Mendonça et al., 2013), silky shark (C. falciformis, Clarke et al., 2015; Domingues et al., 2018b), and lemon shark (Negaprion brevirostris, Ashe et al., 2015). The genetic population structure discovered for several species of elasmobranchs in the western Atlantic Ocean is consistent with their philopatric reproductive habits or coastal dependence. In line with these previous findings, our study also supports the presence of genetic divergence in our comparisons of mtDNA sequences from cownose rays in the Northwestern Atlantic and Brazil, but also although not consistently, within major regions as is the case of locations in the US waters of the Northwestern Atlantic probably related to philopatry.
In contrast, our findings for R. brasiliensis, despite significant FST and ΦST values suggesting the presence of structure, reveal shared haplotypes implying some extent of genetic exchange. Gene flow between the Gulf of Mexico and Caribbean locations appears to be high, as no significant differentiation was detected for any of the mtDNA markers examined, which seems to be due to the great vagility and migration patterns of this species. However, there is a noteworthy genetic differentiation between the two most distant sites (Cape Canaveral (CC) and Brazil (Br), located at the northern and southern extremes of the species’ distribution range. Indeed, both Rhinoptera species show genetic differentiation with individuals from Brazil compared to the most northerly distant locations. This genetic heterogeneity within cownose rays reflects their biological characteristics, such as a preference for shallow-coastal habitats, resulting in low or any migration movements between widely geographical areas. Omori & Fisher (2017) observed the overall trajectory revealed reasonable large-scale movement patterns, allowing for the potential that some rays may venture beyond the continental shelf briefly. However, prolonged stays in deeper waters appear improbable due to the rays’ strong affinity for the benthic substrate where they primarily feed.
For example, in the case of the populations of Brazil, the discharge of the Amazon River, which stretches thousands of kilometers across the Atlantic Ocean, may serve as an effective barrier between Brazil and other areas (Floeter, Rocha & Robertson, 2008; Pinhal et al., 2020), it is one of the most important barriers between the Caribbean and Brazilian coasts driving the differentiation of several species (Rocha, 2003), because of the Amazon River discharge that drastically alters the conditions (mainly in salinity and organic suspended matter, Phillips, Devloo-Delva & McCall, 2021). However, information about the migratory patterns of the Brazilian cownose ray (Rhinoptera brasiliensis) is currently lacking. Although these environmental factors could be influencing the matrilineal population structure of these cownose ray species, factors such as migratory behavior and habitat use patterns (e.g., the preference for specific habitats for reproduction) should be considered, which can also reduce genetic connectivity, even without the presence of physical barriers (or in combination when they exist, Avise et al., 1992; Pearce, 2007).
Souza et al. (2021), based on nuclear DNA markers, found significant genetic differentiation in the cownose ray R. bonasus between the Amazonian and southeastern ecoregions (Rio de Janeiro, São Paulo, and Santa Catarina), attributing this differentiation to reproductive philopatry. Additionally, a pattern of genetic structure related to isolation by distance was observed, suggesting that individuals may not disperse through long distances, similar to what has been observed in some shark species in the Atlantic Ocean. However, for these cownose ray species, this cannot be conclusively attributed exclusively to philopatric behavior but also to phylogeographic patterns. Furthermore, Rangel, Rodrigues & Moreira (2018), in Bertioga, São Paulo, identified a nursery area for both cownose ray species, because of the presence of pregnant females and neonates. Thus, reproductive behavior can significantly influence genetic patterns among active dispersal capabilities as with cownose rays. Therefore, its impact on connectivity regarding dispersal capacity, environmental tolerance, and the presence of physical barriers, remains a challenge.
Our findings suggest an ancestral genetic divergence based on mtDNA characteristics, possibly reflecting historical information. However, it is essential to conduct a more comprehensive investigation and compare it with contemporary analyses such as nuclear marker assessments. These comparisons can elucidate the effects of migration and sexual selection, allowing us to confidently affirm philopatric behaviors.
Environmental association analyses
Understanding the environmental parameters that drive habitat delimitation as well as genetic diversity patterns is essential for species management, especially in the context of climate change and the definition of conservation units. In this study, we found that benthic temperature and current velocity are the most important environmental variables in genetic diversity. In the Northwest Atlantic, where two contrasted biogeographic provinces exist (Cold Temperate and Warm Temperate), it has been documented that temperature is often the main driver of climatic migrations of fish and, therefore, of temporal changes in community structure and gene flow between populations (Peterson & Grubbs, 2023), in this area partial migration occurs when temperatures remain above 15 °C (Bangley et al., 2021;), we find that in the most northern localities such as Chesapeake Bay, the temperature range oscillates between 3.25 °C and 27.83 °C, so it is feasible that the individuals migrate to southerly locations with temperatures higher than 14 °C, areas where two populations of R. bonasus coexist (e.g. coastal Florida). This southward migration pattern has been reported by satellite tags (Omori & Fisher, 2017), where individuals migrate from the Chesapeake Bay along the coast to Florida during the fall, and although these authors agree with McDowell & Fisher (2013) in that the cownose rays in the Atlantic correspond to a separate stock from the Gulf of Mexico, our results indicate that a regional connection does exist, as we included a geographically broader genetic sampling design than reported by McDowell & Fisher (2013) and greater number of individuals sampled than the seven tags recovered by Omori & Fisher (2017), so it is important to evaluate migration patterns into and out of the Gulf of Mexico.
Demographic analysis
The distribution of pairwise sequence differences (mismatch) for populations of cownose rays Rhinoptera bonasus and R. brasiliensis for both fragments was unimodal, which could indicate recent demographic expansion or range expansion events (Rogers & Harpending, 1992). In this case, this information is analyzed alongside the values of the Fs test, indicating population expansion by the presence of excess rare variants. However, the values of the raggedness index were not significant to support the hypothesis of expanding populations. Other evidence of population expansion for R. brasiliensis included the significant negative values of the Fu’s (1996) Fs test for the entire sample set (Tajima, 1989) and the star-like topology in the haplotype network.
Conclusions
Our results offer new insights regarding cownose rays’ genetic diversity, population structure, and genetic connectivity indicating several coexisting genetic groups, indicative of well-differentiated groups within the same locality, for both genes and species. In relation to philopatry in the Northwestern Atlantic, there are coexisting genetic groups, with discrete differences observed between the two biogeographic provinces of the Northwest Atlantic and Northern Gulf of Mexico. The significant genetic differences observed among mtDNA lineages may be due to ecological aspects (such as temperature changes throughout the year) or behavioral aspects such as philopatry or site fidelity contributing to the population structure observed in the Northwestern Atlantic. In contrast, our findings for R. brasiliensis, despite significant FST and ΦST values suggesting the presence of structure, reveal shared haplotypes implying some extent of genetic exchange. Gene flow between the Gulf of Mexico and Caribbean locations appears to be high, as no significant differentiation was detected for any of the mtDNA markers examined, which seems to be due to the great vagility and migration patterns of this species. However, there is a noteworthy genetic differentiation between the two most distant sites (Cape Canaveral (CC) and Brazil (Br), located at the northern and southern extremes of the species’ distribution range. Indeed, both Rhinoptera species show genetic differentiation with individuals from Brazil compared to the most northerly distant locations. Although the mtDNA markers have been useful for assessing genetic structure in a variety of widely distributed teleost fishes and elasmobranchs, the use of nuclear markers with higher mutation rates (e.g., microsatellites or SNPs) can uncover genetic structure that this genetic marker was unable to find. According to our results, it is necessary to reinforce cownose ray conservation strategies to maintain and safeguard the genetic diversity of populations distributed within the range of these two species.
Supplemental Information
Haplotype frequencies and interpolated diversity for R. bonasus in Cytb.
Rhinoptera bonasus sampling sites (⬤) in Western Atlantic. (A) Shows the frequency of the most important haplotypes for the COI gene, (B-D) indicates the interpolated haplotype diversity (ihd) of the three Cytb genetic groups (ihd Cytb 1-3) detected by BAPS. Map created using the Free and Open Source QGIS.
Haplotype frequencies and interpolated diversity for R. brasiliensis in Cytb.
R. brasiliensis sampling sites (▲) in the Western Atlantic. (A) Shows the frequency of the most important haplotypes of the Cytb gene, (B-D) indicates the interpolated haplotypic diversity (ihd) of the five Cytb genetic groups (ihd COI 1-5) detected by BAPS. Map created using the Free and Open Source QGIS.
Distribution of mismatches in R. bonasus.
Mismatch distribution of Rhinoptera bonasus for cytochrome oxidase subunit I (COI).
Distribution of mismatches for R. bonasus in Cytb.
Mismatch distribution of Rhinoptera bonasus for cytochrome b (Cytb).
Distribution of mismatches for R. brasiliensis in COI.
Mismatch distribution of Rhinoptera brasiliensis for cytochrome oxidase subunit I (COI)
Distribution of mismatches for R. brasiliensis in Cytb.
Mismatch distribution of Rhinoptera brasiliensis for cytochrome b (Cytb).
Benthic temperature ranges for R. bonasus and R. brasiliensis.
Maximum (A) and mínimum (B) benthic temperature ranges in the distribution area of R. bonasus and R. brasiliensis. Map created using the Free and Open Source QGIS.
R. brasiliensis COI sequences.
Set of sequences of mtDNA COI for Rhinoptera brasiliensis unpublished
R. bonasus Cytb sequences.
Set of unpublished sequences of mtDNA Cytb for Rhinoptera bonasus
R. brasiliensis Cytb sequences.
Set of sequences of Cytb for Rhinoptera brasiliensis unpublushed
R. bonasus COI sequences.
Set of sequences of mtDNA COI for Rhinoptera bonasus unpublished