
Identification of 10 differentially expressed genes involved in the tumorigenesis of cervical cancer via next-generation sequencing
- Published
- Accepted
- Received
- Academic Editor
- Vladimir Uversky
- Subject Areas
- Bioinformatics, Genomics, Gynecology and Obstetrics, Oncology, Women’s Health
- Keywords
- Cervical cancer, Differentially expressed genes, Next-generation sequencing, The Cancer Genome Atlas
- Copyright
- © 2024 Xu et al.
- Licence
- This is an open access article distributed under the terms of the Creative Commons Attribution License, which permits using, remixing, and building upon the work non-commercially, as long as it is properly attributed. For attribution, the original author(s), title, publication source (PeerJ) and either DOI or URL of the article must be cited.
- Cite this article
- 2024. Identification of 10 differentially expressed genes involved in the tumorigenesis of cervical cancer via next-generation sequencing. PeerJ 12:e18157 https://doi.org/10.7717/peerj.18157
Abstract
Background
The incidence and mortality of cervical cancer remain high in female malignant tumors worldwide. There is still a lack of diagnostic and prognostic markers for cervical carcinoma. This study aimed to screen differentially expressed genes (DEGs) between normal and cervical cancer tissues to identify candidate genes for further research.
Methods
Uterine cervical specimens were resected from our clinical patients after radical hysterectomy. Three patients’ transcriptomic datasets were built by the next generation sequencing (NGS) results. DEGs were selected through the edgeR and DESeq2 packages in the R environment. Functional enrichment analysis, including GO/DisGeNET/KEGG/Reactome enrichment analysis, was performed. Normal and cervical cancer tissue data from the public databases TCGA and GTEx were collected to compare the expression levels of 10 selected DEGs in tumor and normal tissues. ROC curve and survival analysis were performed to compare the diagnostic and prognostic values of each gene. The expression levels of candidate genes were verified in 15 paired clinical specimens via quantitative real-time polymerase chain reaction.
Results
There were 875 up-regulated and 1,482 down-regulated genes in cervical cancer samples compared with the paired adjacent normal cervical tissues according to the NGS analysis. The top 10 DEGs included APOD, MASP1, ACKR1, C1QTNF7, SFRP4, HSPB6, GSTM5, IGFBP6, F10 and DCN. GO, DisGeNET and Reactome analyses revealed that the DEGs were related to extracellular matrix and angiogenesis which might influence tumorigenesis. KEGG enrichment showed that PI3K-Akt signaling pathway might be involved in cervical cancer tumorigenesis and progression. The expression levels of selected genes were decreased in tumors in both the public database and our experimental clinical specimens. All the candidate genes showed excellent diagnostic value, and the AUC values exceeded 0.90. Additionally, APOD, ACKR1 and SFRP4 expression levels could help predict the prognosis of patients with cervical cancer.
Conclusions
In this study, we selected the top 10 DEGs which were down-regulated in cervical cancer tissues. All of them had dramatically diagnostic value. APOD, ACKR1 and SFRP4 were associated with the survivals of cervical cancer. C1QTNF7, HSPB6, GSTM5, IGFBP6 and F10 were first reported to be candidate genes of cervical carcinoma.
Introduction
Cervical cancer is the fourth most frequently diagnosed malignant tumor in women worldwide, and it caused approximately 348,189 deaths in 2022 (Bray et al., 2024). It is one of the leading causes of death in regions such as Africa, Melanesia, South Central Asia and South Eastern Asia (Bray et al., 2024). Even in developed countries such as the USA, it is still estimated that there were 13,960 new cases and 4,310 deaths in 2023 (Siegel et al., 2023). High-risk human papillomavirus (HR-HPV) infection is the main pathogenic factor of cervical cancer. Other risk factors include smoking, immunosuppression, early sexual life, long-term use of oral contraceptives, a higher number of childbirths and so on (Bedell et al., 2020; Nagelhout et al., 2021). Generally, the early-stage cervical cancer patients can achieve a 4.5-year survival rate of 99.2% for open surgery and 99.0% for minimally invasive surgery (Salvo et al., 2022). However, the advanced and recurrent cervical cancer patients usually have poor prognoses.
The mechanism of the malignant transformation of cervical epithelial cells has not been clearly elucidated. When HR-HPV infect cervical epithelial cells and accomplish genomic integration, the E6 and E7 proteins derived from HPV inactivate the tumor suppressor genes p53 and pRb, respectively (Narisawa-Saito & Kiyono, 2007). Some major molecular pathways are involved in the deteriorative progression, including RAF/MEK/ERK, PI3K/AKT, EGFR/VEGFR, Wnt/β-catenin, apoptosis (such as Bcl-2 sub-family) and coupled membrane receptor signaling (Manzo-Merino et al., 2014). The interfering processes of cell proliferation, apoptosis, cell migration, cell invasion and angiogenesis contribute to the formation of cervical cancer. Besides, immune escape is another important factor of cervical cancer incidence (Kusakabe et al., 2023). It is reported that the inhibition of NF-κB, STAT1, IRF3, IRF1, MIP-3α and HLA class I resulted in the carcinogenesis of cervical cancer (Kusakabe et al., 2023). Volkova, Pashov & Omelchuk (2021) summarized cervical cancer biomarkers grouped by different tumorigenesis pathways. E6/E7 mRNA, p16INK4a and serum SCC-Ag were representative in clinical practice among them.
Following the rise of cervical cancer screening tests and HPV vaccines, the awareness of preventing cervical cancer has gradually strengthened in recent years. Since 2018, the WHO has set goals for elimination of cervical cancer worldwide. It is of vital importance to find sensitive and specific biomarkers to guide the diagnosis and prognosis of cervical cancer.
In this study, we aimed to screen significant DEGs between cervical cancer tissues and paired adjacent normal cervical tissues based on RNA sequencing data. Public transcriptomic data from The Cancer Genome Atlas Program (TCGA) and the Genotype-Tissue Expression Project (GTEx) were also taken into consideration to support our results. Meanwhile, we also performed confirmatory experiments to analyze the expression levels of the top 10 selected DEGs in another 15 pairs of normal and cervical cancer tissues, which included Apolipoprotein D (APOD), Mannose-Binding Lectin-Associated Serine Protease 1 (MASP1), Atypical Chemokine Receptor 1 (ACKR1), Complement C1q Tumor Necrosis Factor-Related Protein 7 (C1QTNF7), Secreted Frizzled Related Protein 4 (SFRP4), Heat Shock Protein Family B (Small) Member 6 (HSPB6), Glutathione S-Transferase Mu 5 (GSTM5), Insulin Like Growth Factor Binding Protein 6 (IGFBP6), Coagulation Factor X (F10) and Decorin (DCN). These findings may provide novel candidate genes for diagnosis and prognosis of cervical cancer.
Materials and Methods
Uterine cervical specimens
Uterine cervical specimens were separated immediately from the cervix of 18 cervical cancer patients after radical hysterectomy. The distance between cancer sample location and normal sample location was at least 2 cm. The patients were selected following the criteria below. Inclusion criteria: (1) Those who were eligible for this study and signed the informed consent; (2) Women aged 18–75 years; (3) Preoperative stage was IB1-IIA2, and surgery was the best treatment choice for them; (4) Those who had macroscopic cervical cancer tissues and adjacent normal tissues; (5) Those who were able to cooperate according to the research protocol. Exclusion criteria: (1) Pregnant or lactating women; (2) Preoperative stage was IIB or severe, and the preferred treatment was radiotherapy or chemotherapy; (3) Those whose cervical cancer tissues and adjacent normal tissues from the isolated uterine could not be distinguished; (4) Patients with severe circulatory, immune, or respiratory diseases; (5) Those who had other uncontrolled medical conditions that the researchers deem unsuitable for enrollment; (6) Any situation that the investigators considered may increase the risk to the subject or interfere with the results. Clinical information of the three patients whose specimens were used for RNA sequencing is shown in Table 1. Table 2 exhibited the key medical records of other 15 cases whose specimens were used for confirmatory experiments. The disease status was assigned according to the 2018 FIGO classification. Paired adjacent normal tissues and cancer tissues were stored long-term at −80 °C without any additive for subsequent experiments. The study was conducted in accordance with the principles of the Declaration of Helsinki. All the specimens were obtained after approval from the Ethics Committee of Seventh Medical Center of Chinese PLA General Hospital (S2023-025-01) and written informed consent was obtained from patients in the Department of Obstetrics and Gynecology of the Seventh Medical Center of PLA General Hospital.
| Age | HR-HPV type | Pathology | Stage | Operation | Neoadjuvant therapy | Postoperative therapy | |
|---|---|---|---|---|---|---|---|
| Patient 1 | 35 | 16 | Squamous cell carcinoma | IIA2 | Robot-assisted laparoscopic radical hysterectomy + bilateral salpingectomy + pelvic lymph node resection | N/A | Concurrent chemoradiotherapy |
| Patient 2 | 61 | 16 | Squamous cell carcinoma | IIA1 | Laparoscopic radical hysterectomy + bilateral salpingectomy + pelvic lymph node resection | N/A | N/A |
| Patient 3 | 46 | 16 | Squamous cell carcinoma | IB2 | Laparoscopic radical hysterectomy + bilateral adnexectomy + pelvic lymph node resection | N/A | Concurrent chemoradiotherapy |
| Age | HR-HPV type | Pathology | Molecular marker | Stage | Operation | Neoadjuvant therapy | Postoperative therapy | |
|---|---|---|---|---|---|---|---|---|
| Case 1 | 44 | 16 | Squamous cell carcinoma | p16 (+), p40 (+), Ki-67 (+), p53 (+), CK5/6 (+), EGFR (+), PD-L1 (CPS = 10) | IB3 | Robotic-assisted laparoscopic radical hysterectomy + bilateral salpingectomy + pelvic lymph node resection | Chemotherapy | Concurrent chemoradiotherapy |
| Case 2 | 52 | 16 | Squamous cell carcinoma | Ki-67 (+50%), p16 (+), p53 (+10%, mutant), CK5/6 (+), p40 (+), HER-2 (−), PD-L1 (CPS = 3), EGFR (+) | IB3 | Laparoscopic radical hysterectomy + bilateral adnexectomy + pelvic lymph node resection | N/A | Concurrent chemoradiotherapy |
| Case 3 | 63 | 16 | Squamous cell carcinoma | Ki-67 (+), p16 (+), p53 (+, wildtype), CK5/6 (+), p40 (+), HER-2 (1+), PD-L1 (CPS = 6) | IIIC2(p) | Robotic-assisted laparoscopic radical hysterectomy + bilateral adnexectomy + para-aortic and pelvic lymph node resection | N/A | Concurrent chemoradiotherapy |
| Case 4 | 64 | 18 | Adenosquamous carcinoma | p16 (+), p63 (+), p40 (+), PR (+), p53 (+, wildtype), PAX-2 (−), PTEN (−), Ki-67 (+), EGFR (+) | IIA1 | Robotic-assisted laparoscopic radical hysterectomy + bilateral adnexectomy + pelvic lymph node resection | N/A | N/A |
| Case 5 | 39 | 18 | Adenocarcinoma | p53 (+, wildtype), p16 (+), CD5/6 (+), p63 (−), CK7 (+), CK8/18 (+), CEA (−), PR (−), AB-PAS (+), p40 (+), PD-L1 (TC = 70%), EGFR (+), Ki-67 (+) | IIIC1(r) | Robotic-assisted laparoscopic radical hysterectomy + bilateral adnexectomy + para-aortic and pelvic lymph node resection (patient request) | Chemotherapy | Concurrent chemoradiotherapy |
| Case 6 | 46 | 18 | Adenosquamous carcinoma, focal small cell neuroendocrine carcinoma | AE1/AE3 (+), Vimentin(−), p16 (+), CEA (+), CK7 (+), CK5/6 (−), p40 (−), Syn (NEC+), CgA (−), Ki-67 (+), PR (−), CD10 (−), AB-PAS (+), PD-L1 (CPS < 1) | IB3 | Robotic-assisted laparoscopic radical hysterectomy + bilateral adnexectomy + para-aortic and pelvic lymph node resection | N/A | Radiotherapy |
| Case 7 | 68 | N/A | Adenosquamous carcinoma | p16 (+), CK5/6 (+), CK7 (+), p63 (+), CD117 (+), Ki-67 (+), p53(+), SMA (−), Calponin (−), Syn (−), CD56 (+) | IIA1 | Laparoscopic radical hysterectomy + bilateral adnexectomy + pelvic lymph node resection | N/A | Chemotherapy |
| Case 8 | 59 | 16 | Squamous cell carcinoma | p16 (+), S-100 (−) | IIA1 | Laparoscopic radical hysterectomy + bilateral adnexectomy + para-aortic and pelvic lymph node resection | N/A | Concurrent chemoradiotherapy |
| Case 9 | 46 | 16 | Squamous cell carcinoma | CK7 (+), p40 (+), Ki-67 (+), PD-L1 (CPS < 1), p53 (+, wildtype), p16 (+) | IB2 | Laparoscopic radical hysterectomy + bilateral adnexectomy + pelvic lymph node resection | N/A | Concurrent chemoradiotherapy |
| Case 10 | 47 | 16 | Squamous cell carcinoma | Ki-67 (+), p16 (+), p53 (+), CK5/6 (+), p40 (+) | IB2 | Laparoscopic radical hysterectomy + bilateral adnexectomy + pelvic lymph node resection | N/A | Radiotherapy |
| Case 11 | 61 | 16 | Squamous cell carcinoma | p40 (+), p16 (+), p63 (+), Ki-67 (+), PD-L1 (CPS = 40) | IIA1 | Laparoscopic radical hysterectomy + bilateral adnexectomy + pelvic lymph node resection | N/A | N/A |
| Case 12 | 36 | N/A | Squamous cell carcinoma | Ki-67 (+), p16 (+), p53 (+, wildtype), CK5/6 (+), CK7 (+), CAM5.2 (+), CEA (+) | IIA1 | Laparoscopic radical hysterectomy + bilateral salpingectomy + para-aortic and pelvic lymph node resection | N/A | Concurrent chemoradiotherapy |
| Case 13 | 42 | 16/58 | Gastric adenocarcinoma | PAX-8 (+), CK7 (+), ER (−), PR (−), CK20 (−), SATB2 (−), Ki-67 (+), p16 (−), MUC6 (+), MUC5AC (+), PD-L1 (CPS = 15), AB (+), PAS (+) | IB2 | Laparoscopic radical hysterectomy + bilateral adnexectomy + pelvic lymph node resection | N/A | Chemotherapy |
| Case 14 | 30 | 18 | Adenosquamous carcinoma | p16 (+), Ki-67 (+), p53 (+, wildtype), CK5/6 (+), p63 (+), CK7 (+), CK8/18 (+), PD-L1 (CPS = 90), p40 (+) | IB1 | Laparoscopic radical hysterectomy + bilateral salpingectomy + pelvic lymph node resection | N/A | N/A |
| Case 15 | 44 | 16 | Squamous cell carcinoma | p16 (+), Ki-67 (+), PD-L1 (CPS = 5), p53 (+, wildtype) | IB2 | Laparoscopic radical hysterectomy + bilateral salpingectomy + para-aortic and pelvic lymph node resection | N/A | N/A |
RNA sequencing dataset establishment
Total RNA of paired adjacent normal tissues and cancer tissues from three patients was extracted by Trizol (Invitrogen, Waltham, MA, USA) according to the manufacturer’s protocol. Therefore, we had three biological replicates. Three technical replicates were completed simultaneously. The extracted RNA of each sample was sequenced three times. Total amounts and integrity of RNA were assessed using the RNA Nano 6000 Assay Kit of the Bioanalyzer 2100 system (Agilent Technologies, Santa Clara, CA, USA). Then, total RNA was used as input material for the library preparation. Messenger RNA was purified from total RNA by using poly-T oligo-attached magnetic beads. After the construction of the library, the library was initially quantified by Qubit2.0 Fluorometer (Thermo Fisher Scientific Inc., Waltham, MA, USA), then diluted to 1.5 ng/μl, and the insert size of the library was detected by Agilent 2100 bioanalyzer. After insert size met the expectation, RT-qPCR was used to accurately quantify the effective concentration of the library (the effective concentration of the library is higher than that of 2 nM) to ensure the quality of the library. After the library was qualified, the different libraries were pooled according to the effective concentration and the target amount of data off the machine, then sequenced by the Illumina NovaSeq 6000 (Illumina, San Diego, CA, USA) (Fig. 1A). The end reading of 150 bp pairing is generated. Illumina Casava1.8 software (Illumina, San Diego, CA, USA) was used for basecalling. The basic principle of sequencing is to synthesize and sequence at the same time (Sequencing by Synthesis). After quality control for the reads, index of the reference genome (hg38) was built using Hisat2 (v2.0.5) and paired-end clean reads were aligned to the reference genome using Hisat2 (v2.0.5). FeatureCounts (v1.5.0-p3) was used to count the reads numbers mapped to each gene. The process of building RNA sequencing datasets was similar to what we described in our previous work (Zhao et al., 2018). Sequence data of this study have been deposited in the Gene Expression Omnibus (GEO) repository with the primary accession record GSE253690. The sequencing depth is 35.099995, and the statistical power of this experimental design calculated in R environment is 0.140838.
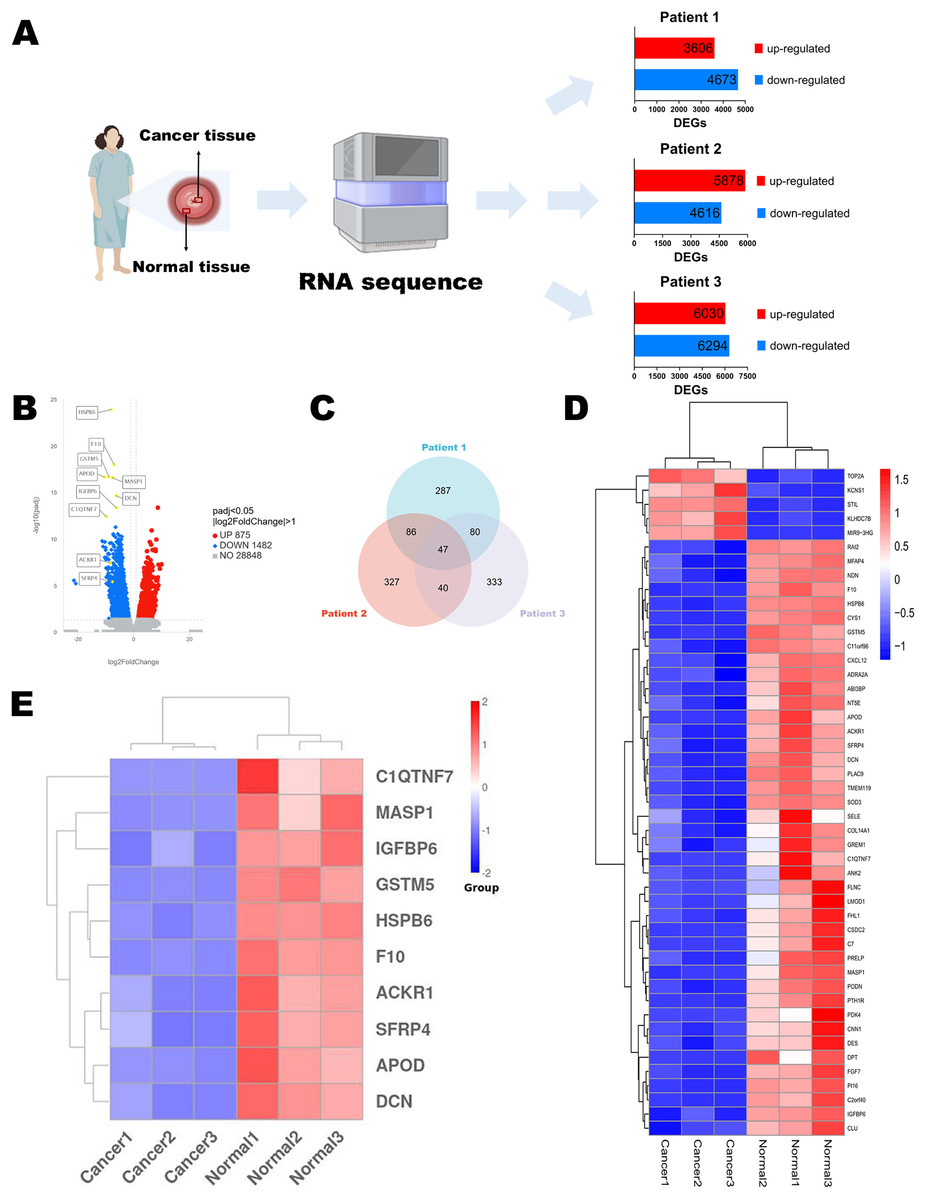
Figure 1: Identification of DEGs.
(A) Flow chart of RNA sequencing. (B) Volcano diagram of DEGs in RNA sequencing results of three paired normal and cervical cancer samples. (C) Venn diagram of the top 500 DEGs of each pair of normal and cervical cancer samples. (D) Heatmap of the 47 intersecting DEGs. (E) Heatmap of the top 10 genes in 47 DEGs. Statistical methods were Shapiro-Wilk normality test and Levene’s test. Figure 1A was created with BioRender.com.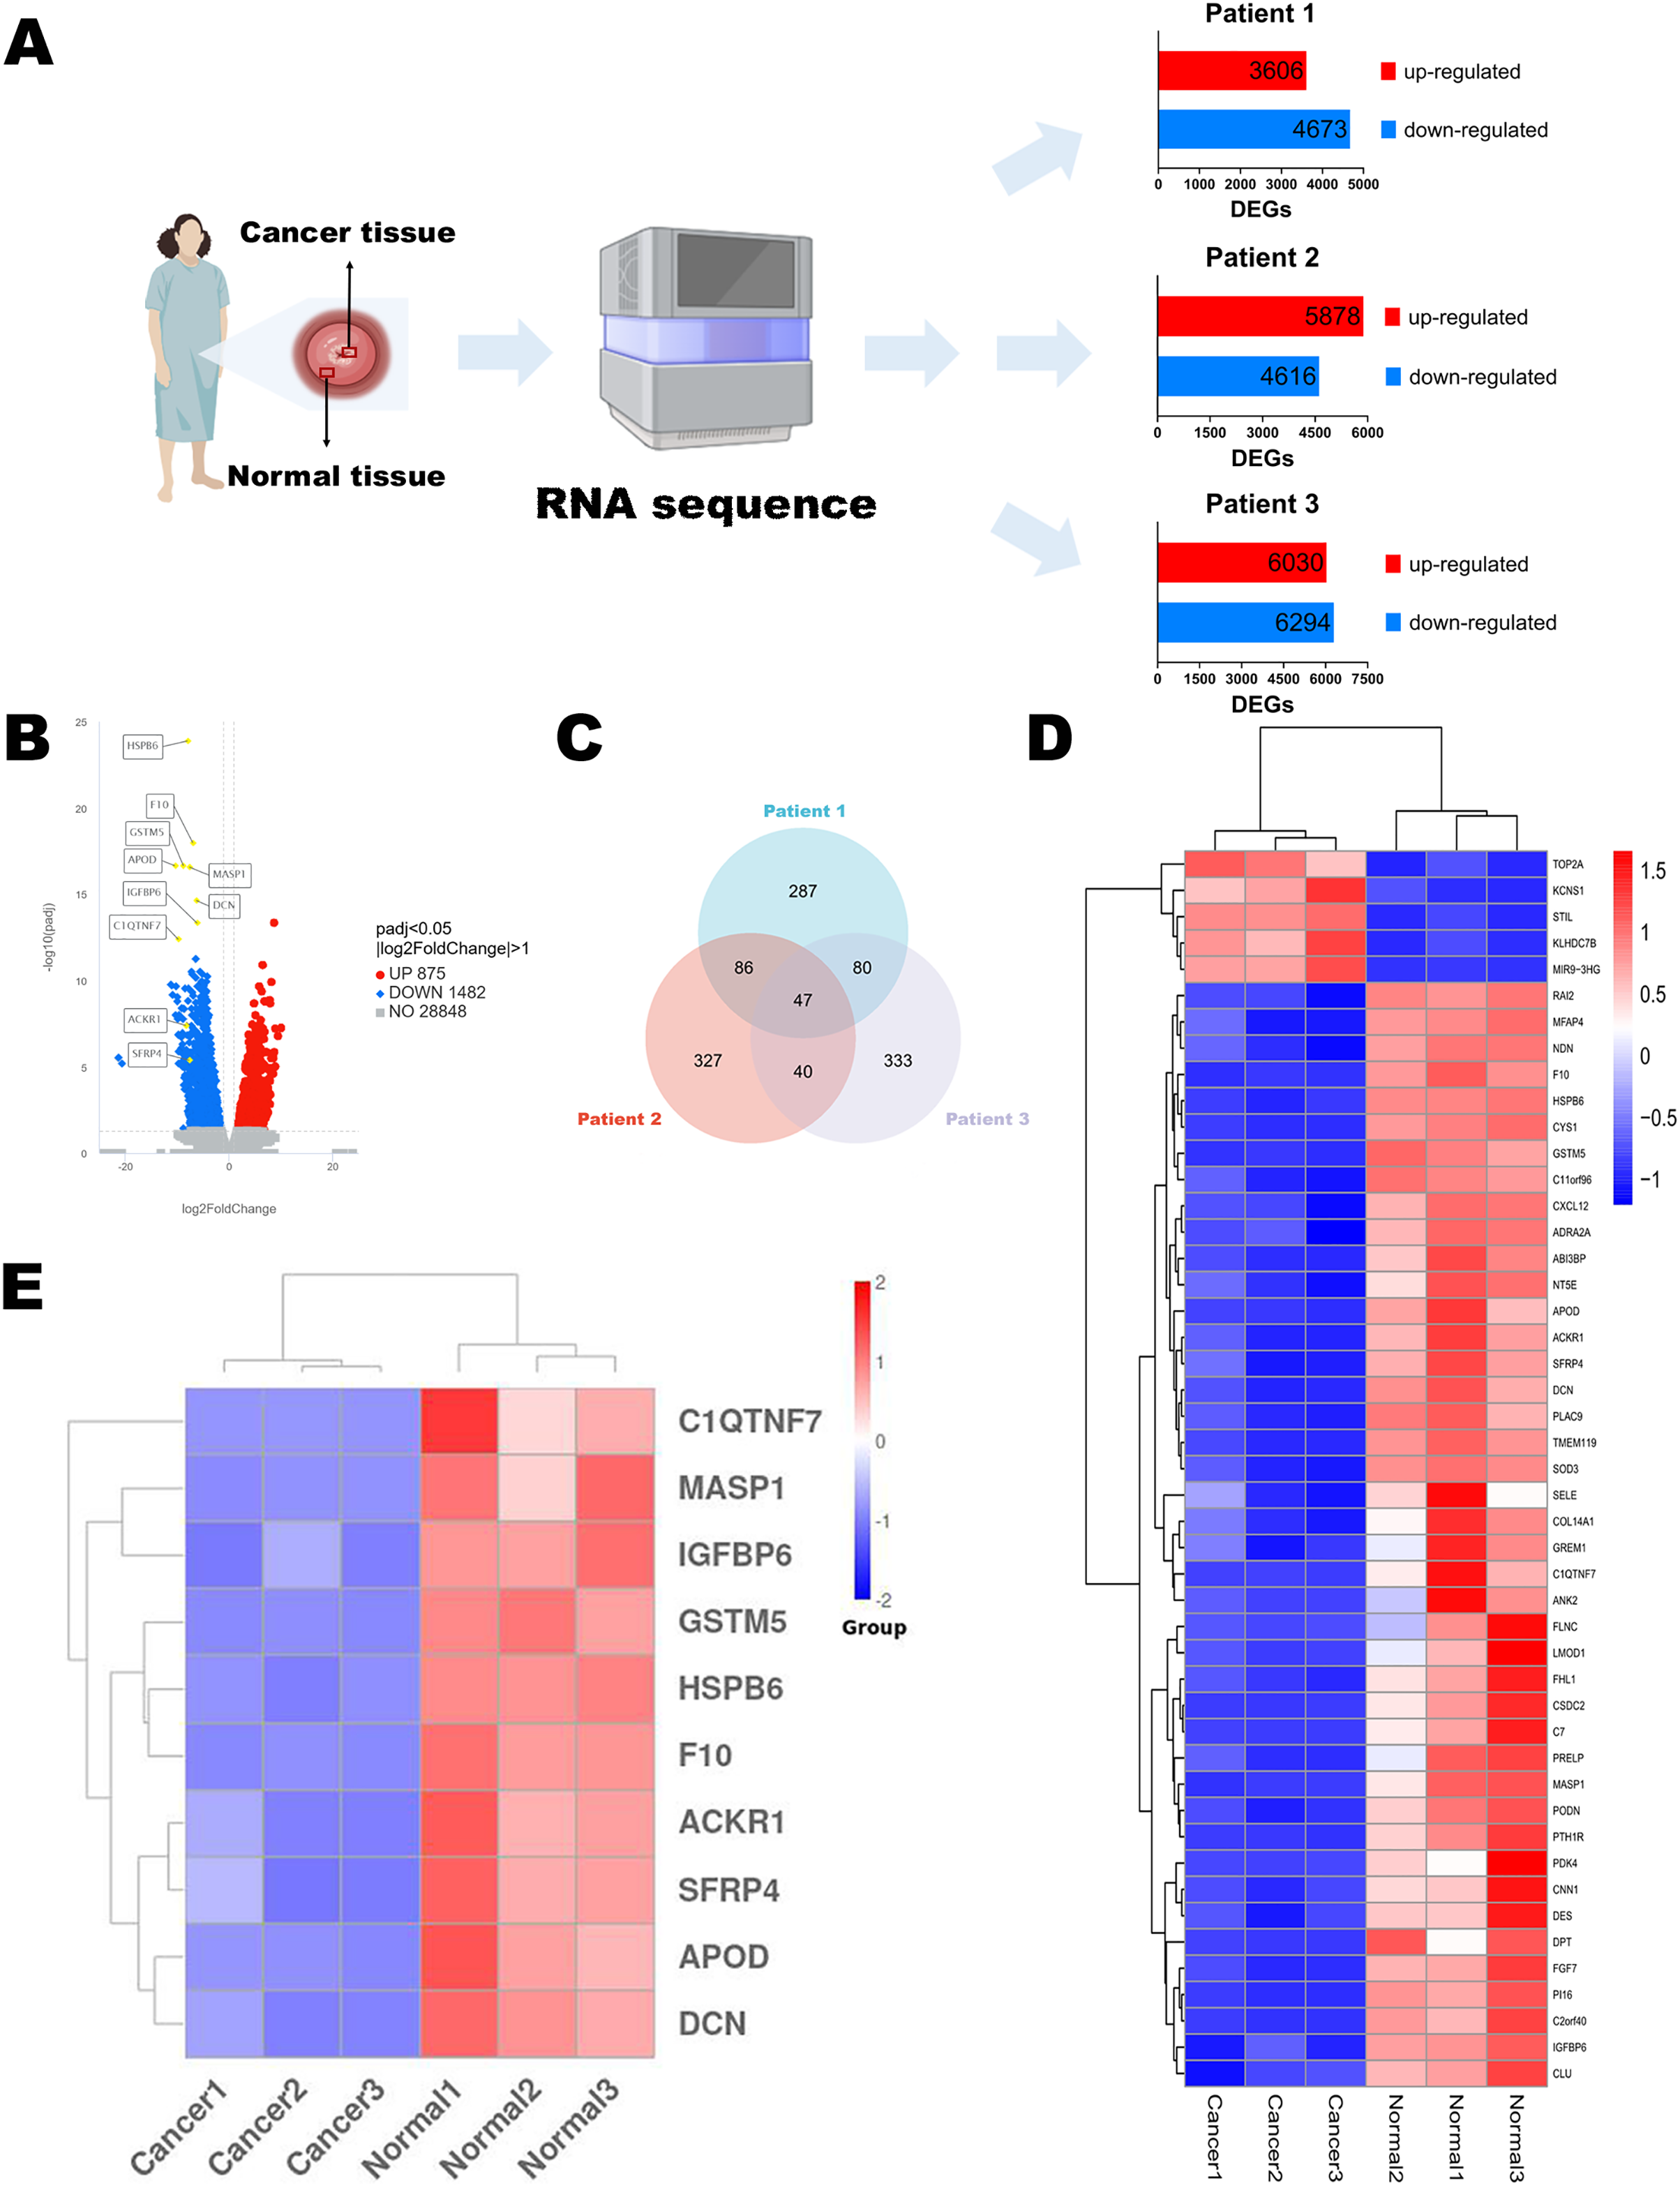
Identification of DEGs and functional enrichment analysis
Differential expression analysis of two groups (paired adjacent normal cervical tissues and cervical cancer tissues) of three patients was performed respectively using the edgeR package (Version 3.22.5) in the R environment (Version 4.2.1) as described in Robinson, McCarthy & Smyth (2010). The integrated DEGs union between normal group and cancer group of all three patients were analyzed using the DESeq2 package (Version 1.20.0) following the method in Love, Huber & Anders (2014) and shown in Volcano diagram. The resulting p-values were adjusted using the Benjamini and Hochberg’s approach for controlling the false discovery rate. We defined padj ≤ 0.05 and |log2(foldchange)| ≥ 1 as the thresholds for significantly differential expression. We selected the top 500 DEGs of each patient through edgeR package. There were 47 intersecting genes in Venn diagram, and we selected the top 10 genes for next-step public data and experimental analysis. The heatmap of 47 genes and 10 genes were plotted using pheatmap package and ggplot2 package (Version 3.3.6).
The integrated DEGs union of the 3 patients were used for enrichment analysis. Gene Ontology (GO) enrichment analysis was implemented by the clusterProfiler R package (Version 3.8.1), in which gene length bias was corrected. GO terms with corrected p values less than 0.05 were considered significantly enriched with DEGs. The Kyoto Encyclopedia of Genes and Genomes (KEGG) is a database resource for understanding high-level functions and utilities of the biological systems, especially large-scale molecular datasets generated by genome sequencing and other high throughput experimental technologies. We used clusterProfiler R package (Version 3.8.1) to test the statistical enrichment of DEGs in KEGG pathways. The Disease Gene Network (DisGeNET) database integrates human disease-related genes. DisGeNET pathways with corrected p values less than 0.05 were considered significantly enriched by DEGs. The Reactome database brings together the various reactions and biological pathways of human model species. Reactome pathways with corrected p values less than 0.05 were considered significantly enriched by DEGs. We also used clusterProfiler R package (Version 3.8.1) to test the statistical enrichment of DEGs in the Reactome pathway and the DisGeNET pathway. The functional enrichment analysis was performed as previously described in Yu et al. (2012).
Public RNA sequencing data analysis
Public data (RNA sequencing data and clinical information) were requested from TCGA and GTEx databases provided on the UCSC Xena website (http://xenabrowser.net/datapages/). The FPKM-form RNA sequencing data were uniformly treated through Toil process (Vivian et al., 2017). The expression of selected DEGs was transformed into log2(FPKM+1) values to compare the differences. The receiver operating characteristic (ROC) curves were analyzed by pROC package (Version 1.18.0) which was described in Robin et al. (2011). Diagnostic values were measured by area under the curve (AUC) values. Survival analysis was finished using overall survival (OS) time through survival package (Version 3.3.1) described in Groeneveld et al. (2019). Survival outcomes referred to data from the literature reported in 2018 (Liu et al., 2018). The groups were divided by the median value of the expression level of each DEG.
Quantitative real time polymerase chain reaction
Total RNA was extracted from 20–30 mg paired adjacent normal cervical tissues and cervical cancer tissues through macrodissection according to the manufacturer’s protocol of total RNA rapid extraction kit (BIOMAN, Beijing, China) within 1 week. All the equipments were purified with DEPC water. RNase free water was used for the dilution of RNA. The adsorption columns in the kit were used to remove DNA and purify RNA. The quality of RNA was assessed by the A260/A280 and A260/A230 value of each sample using Multiskan Skyhigh (Thermo Fisher Scientific, Waltham, MA, USA) and all the values were conformed to the standard. RNA (200 ng for each sample) was reverse-transcribed into cDNA by reverse transcriptase and random primer (N9) (0.1 μg/μl) in a 20 μl reaction volume with transcript one-step gDNA removal and cDNA synthesis supermix kit (TRANSGEN, Beijing, China). The reverse-transcribed reaction conditions included 25 °C for 10 min, 42 °C for 15 min and 85 °C for 5 s. cDNA was stored at −20 °C and was used for qPCR within 1 week. RT-qPCR was performed using the PerfectStart Green qPCR Supermix kit (TRANSGEN, Beijing, China) in 0.2 mL Polypropylene PCR Tube Strips (Axygen, Union City, CA, USA) via QuantStudio 3 Real-Time PCR System (ABI, Loma Linda, CA, USA). QuantStudio Design & Analysis Software (ABI, Waltham, MA, USA) was used for manual reaction setup and analysis. The PCR conditions included a denaturing step at 94 °C for 30 s and 45 cycles of 94 °C for 5 s and 60 °C for 30 s for real time plate read. The melt curve stage included 95 °C for 15 s, 60 °C for 1 min and 95 °C for 1 s. The whole reaction volume was 20 μl, and the concentration of forward and reverse primers were 10 μM. SYBR Green I was the fluorescent dye applied in this assay. GAPDH was used for data normalization. The 2−ΔΔCt value was regarded as the expression level of each gene. The RT-qPCR was performed in investigator’s lab and repeated three times similar to what we described in our previous work (Jin et al., 2019). The results showed well repeatability. Each melt curve has only one peak and we found little outliers. Targeted gene information and specific primer sequences were described in Table S1. The manufacturer of oligonucleotides was Sangon (Shanghai, China).
Statistical analysis
RNA sequencing and public database data were conducted using the R environment (Version 4.2.1). Padj ≤ 0.05 and |log2(foldchange)| ≥ 1 were the thresholds for DEGs. Corrected p values < 0.05 were considered significantly enriched in function enrichment analysis. Quantitative data were analyzed using Shapiro-Wilk normality test and Levene’s test. The expression level difference was calculated by Mann–Whitney U test using stats package (Version 4.2.1) and car package (Version 3.1-0). The ROC curves were analyzed by pROC package (Version 1.18.0). Cox proportional hazard model was tested and survival curves were matched through survival package (Version 3.3.1) using Kaplan-Meier methodology. Then the difference in OS of cervical cancer patients stratified by target gene expression level was tested by the Log-rank test. Data visualization was accomplished via survminer package and ggplot2 package (Version 3.3.6). The comparison of 10 DEGs expression between paired normal and cancer samples from clinical sampling in RT-qPCR was analyzed by paired t test and plotted in Graphpad Prism 9 (GRAPHPAD SOFTWARE, CA, USA). p < 0.05 was considered statistically significant.
Results
Identification of DEGs
To discuss the potential mechanisms of cervical cancer tumorigenesis and identify the DEGs involved in these processes, we extracted the specimens from three patients (stage IB2 to IIA2) after the radical hysterectomy. Their clinical information was shown in Table 1. Then, RNA sequences were determined by NGS. The up-regulated and down-regulated DEGs were sorted out, respectively (Fig. 1A). According to the integrated NGS data of three patients, there were 875 up-regulated and 1,482 down-regulated genes in cervical cancer tissues compared to paired adjacent normal cervical tissues (Fig. 1B). DEGs were reported only if the log-fold change was >1 and the adjusted p value was less than 0.05. We focused on the top 500 DEGs of each patient, and found that their intersection contained 47 DEGs (Fig. 1C). The heatmap demonstrated that only five DEGs expressions were increased in cancer specimens, while other 42 DEGs expressions were obviously decreased (Fig. 1D). We chose the top 10 significant DEGs in the 47 intersectional DEGs for further research (Fig. 1E) and we marked their locations in the integrated DEGs union between normal group and cancer group of three patients (Fig. 1B). These genes included APOD, MASP1, ACKR1, C1QTNF7, SFRP4, HSPB6, GSTM5, IGFBP6, F10 and DCN. All of them expressed at lower levels in cervical cancer samples than in normal cervix cells.
Functional enrichment analysis of DEGs
Functional enrichment analysis revealed the potential mechanisms of the DEGs union between normal group and cancer group of three patients in the development of cervical cancer. GO analysis is associated with cellular component (CC), molecular function (MF) and biological process (BP). It was indicated that the incidence of malignant cervical tumor could be attributed to extracellular matrix, angiogenesis and circulatory system process (Fig. 2A). DisGeNET database contains a collection of genes associated with abundant human diseases. The results showed that 2357 DEGs (including 875 up-regulated DEGs and 1482 down-regulated DEGs) were more likely to generate tumor angiogenesis, systemic scleroderma and malignant neoplasm of thyroid (Fig. 2B). KEGG database reflected the reaction network of molecules and pathways of diseases. We found that PI3K-Akt signaling pathway, calcium signaling pathway, neuroactive ligand-receptor interaction, cell cycle and focal adhesion may participate in the occurrence and progression of cervical cancer (Fig. 2C). Changes in extracellular matrix organization and cell cycle checkpoints were the two most important processes associated with cervical tumors on the basis of Reactome database (Fig. 2D).
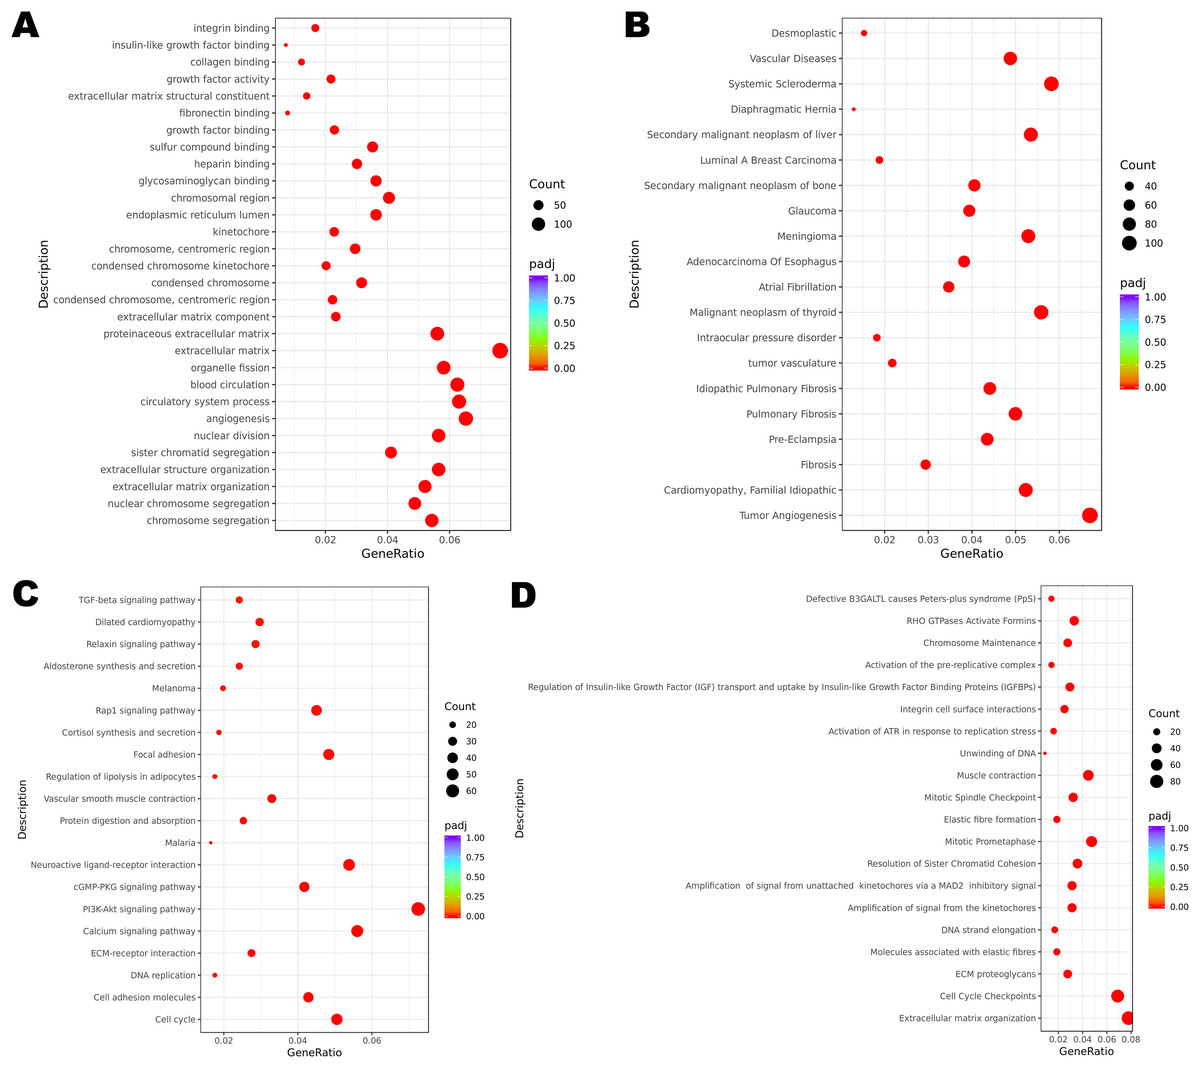
Figure 2: Functional enrichment of DEGs.
(A) GO enrichment analysis of all the DEGs. (B) DisGeNET enrichment analysis of all the DEGs. (C) KEGG enrichment analysis of all the DEGs. (D) Reactome enrichment analysis of all the DEGs.
The expression levels of selected DEGs in public database
The TCGA program is the largest public database of cancer genetic information worldwide. The database provides multi-omics hereditary information of cancer patients. The GTEx project collected the sequencing data of healthy human donors. In this study, we focused only on the transcriptomic information of 10 selected DEGs to verify their expression levels in a larger population. All the selected genes (including APOD, MASP1, ACKR1, C1QTNF7, SFRP4, HSPB6, GSTM5, IGFBP6, F10 and DCN) showed lower expression levels in cervical cancer samples, and these results were statistically significant (Figs. 3A–3J).
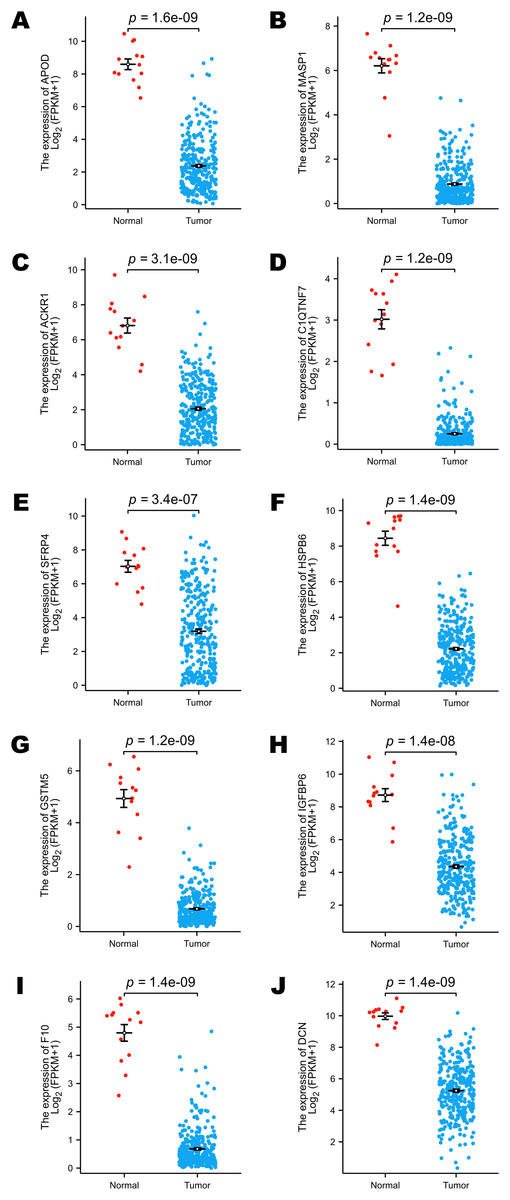
Figure 3: Comparison of the expression levels of selected DEGs between normal and cervical cancer samples in public databases.
(A) Comparison of APOD expression levels in public databases. (B) Comparison of MASP1 expression levels in public databases. (C) Comparison of ACKR1 expression levels in public databases. (D) Comparison of C1QTNF7 expression levels in public databases. (E) Comparison of SFRP4 expression levels in public databases. (F) Comparison of HSPB6 expression levels in public databases. (G) Comparison of GSTM5 expression levels in public databases. (H) Comparison of IGFBP6 expression levels in public databases. (I) Comparison of F10 expression levels in public databases. (J) Comparison of DCN expression levels in public databases. Statistical method was Mann-Whitney U test. Data was presented as Mean ± SEM.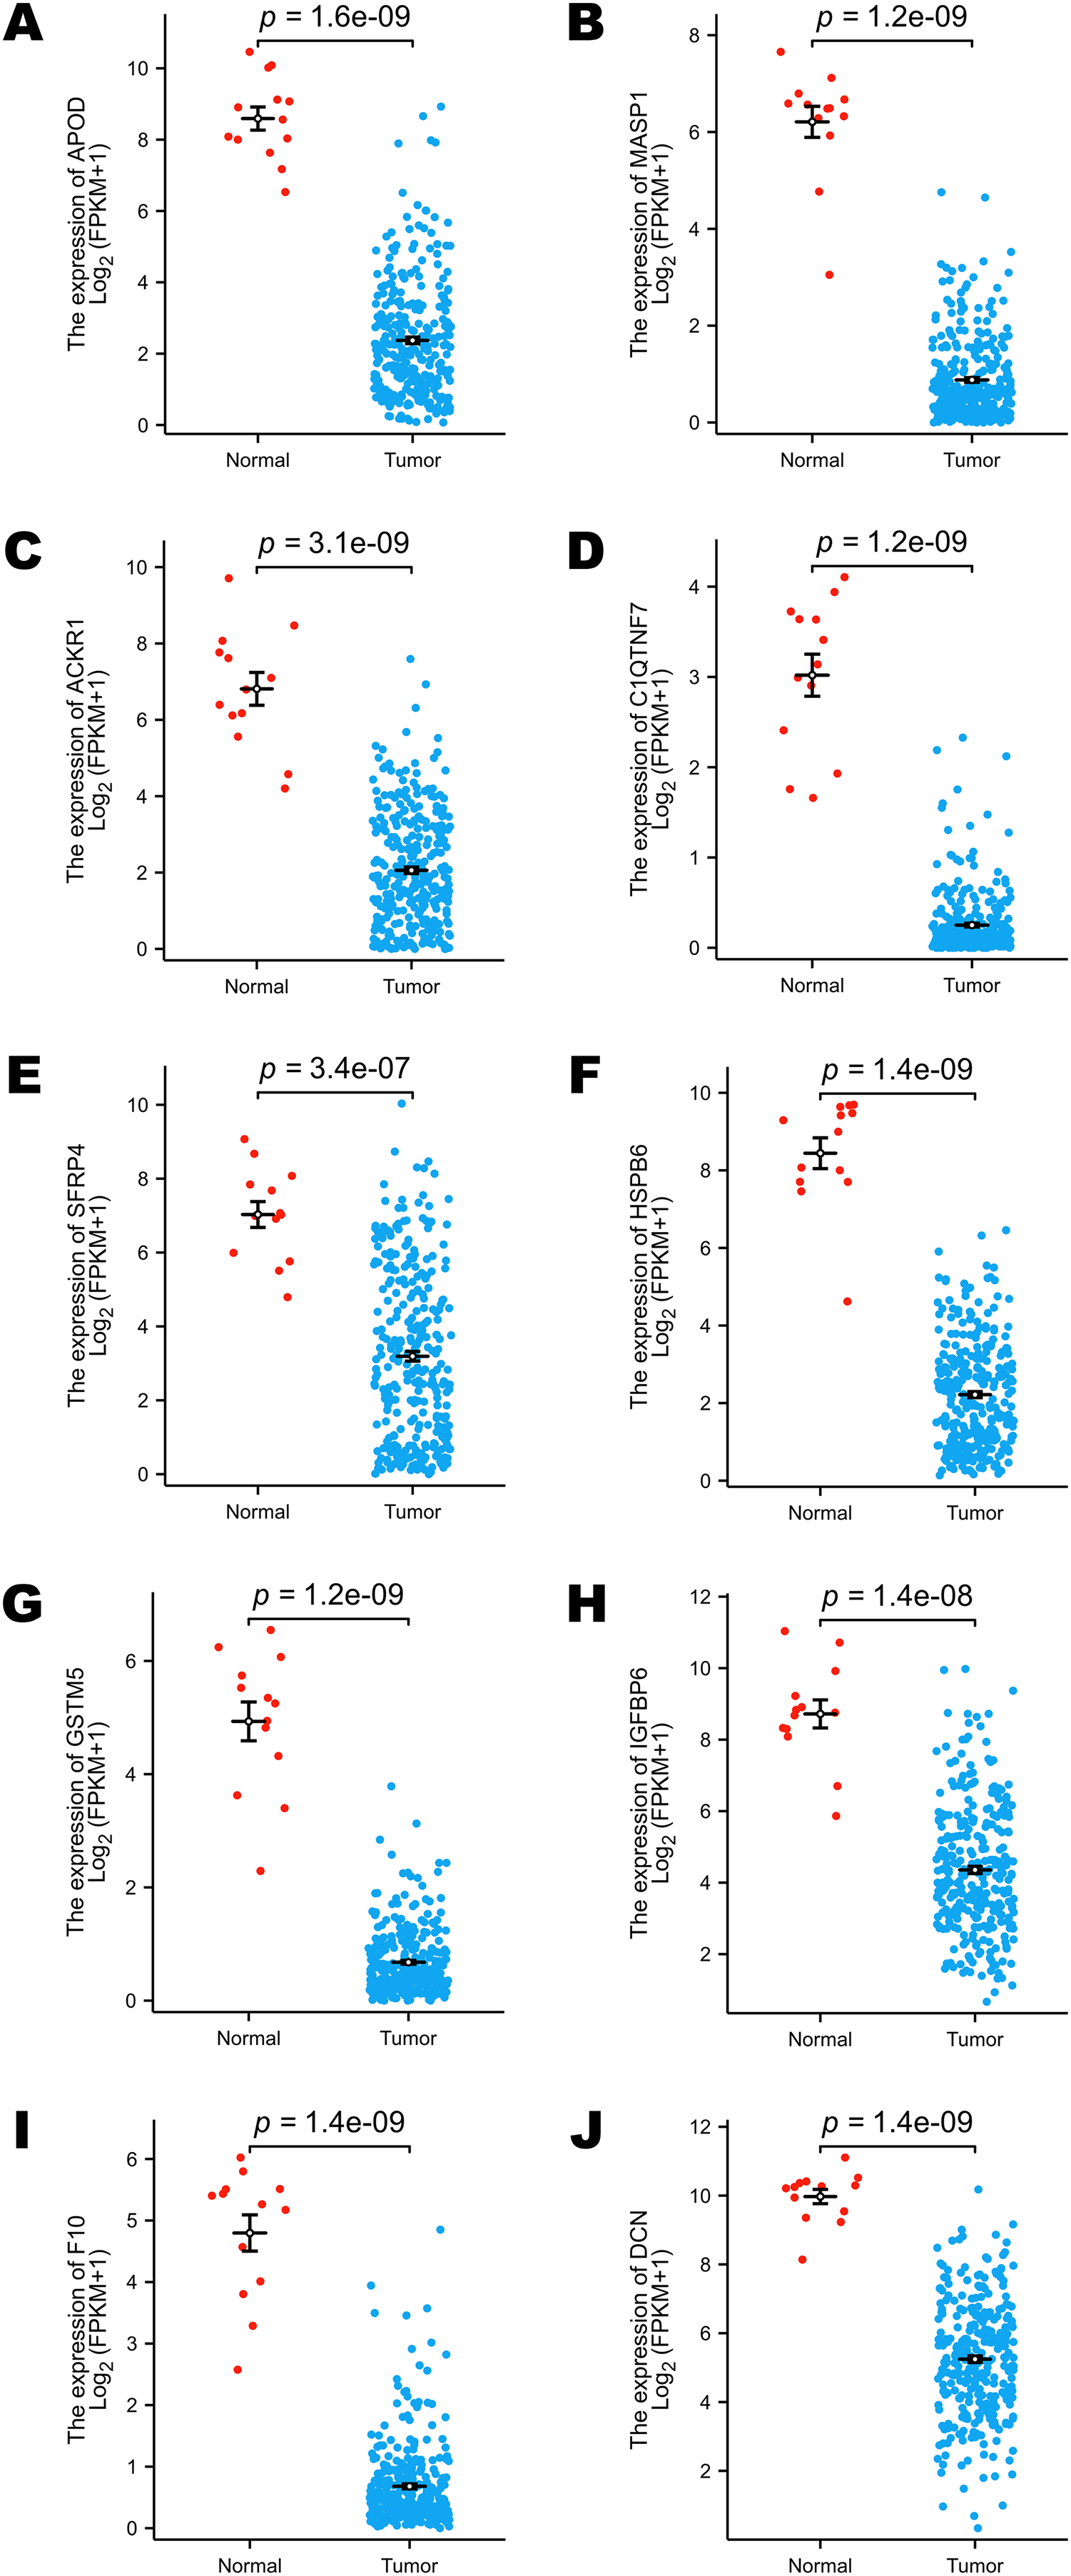
The diagnostic performance of selected DEGs in public database
To assess the performance of these selected DEGs as biomarkers, ROC curves were generated to measure the AUC values. All the AUC values exceeded 0.90, which meant that the selected DEGs have chances to function as excellent diagnostic biomarkers (Figs. 4A–4J). In particular, the AUC values of MASP1, GSTM5 and C1QTNF7 were 0.998, 0.998 and 0.997, respectively (Figs. 4B, 4G, 4D). Other DEGs whose AUC values were greater than 0.99 included APOD, HSPB6, F10 and DCN (Figs. 4A, 4F, 4I, 4J).
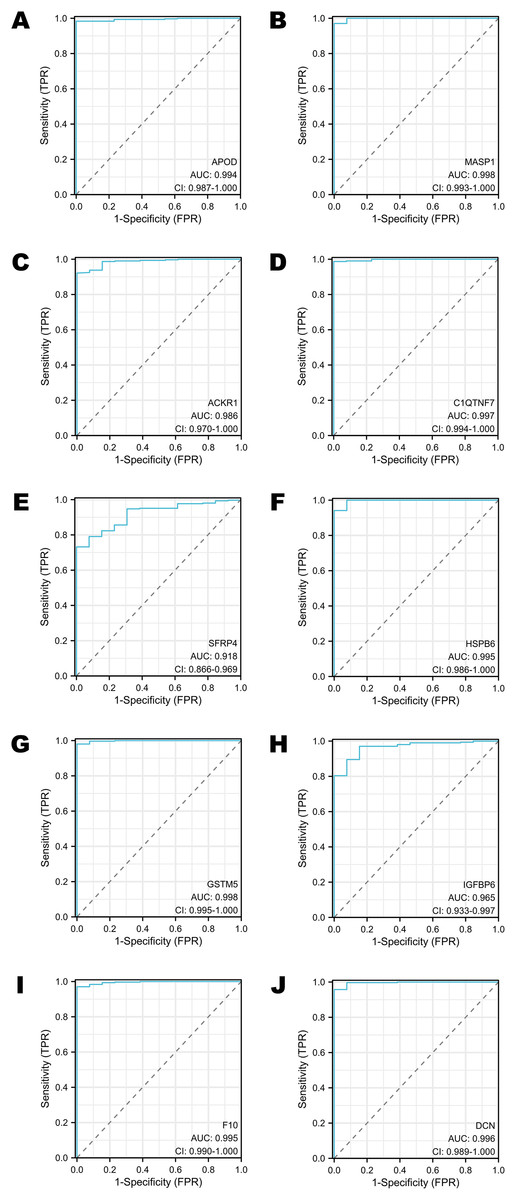
Figure 4: The ROC curves of selected DEGs in public databases.
(A) The ROC curve of APOD in public databases. (B) The ROC curve of MASP1 in public databases. (C) The ROC curve of ACKR1 in public databases. (D) The ROC curve of C1QTNF7 in public databases. (E) The ROC curve of SFRP4 in public databases. (F) The ROC curve of HSPB6 in public databases. (G) The ROC curve of GSTM5 in public databases. (H) The ROC curve of IGFBP6 in public databases. (I) The ROC curve of F10 in public databases. (J) The ROC curve of DCN in public databases.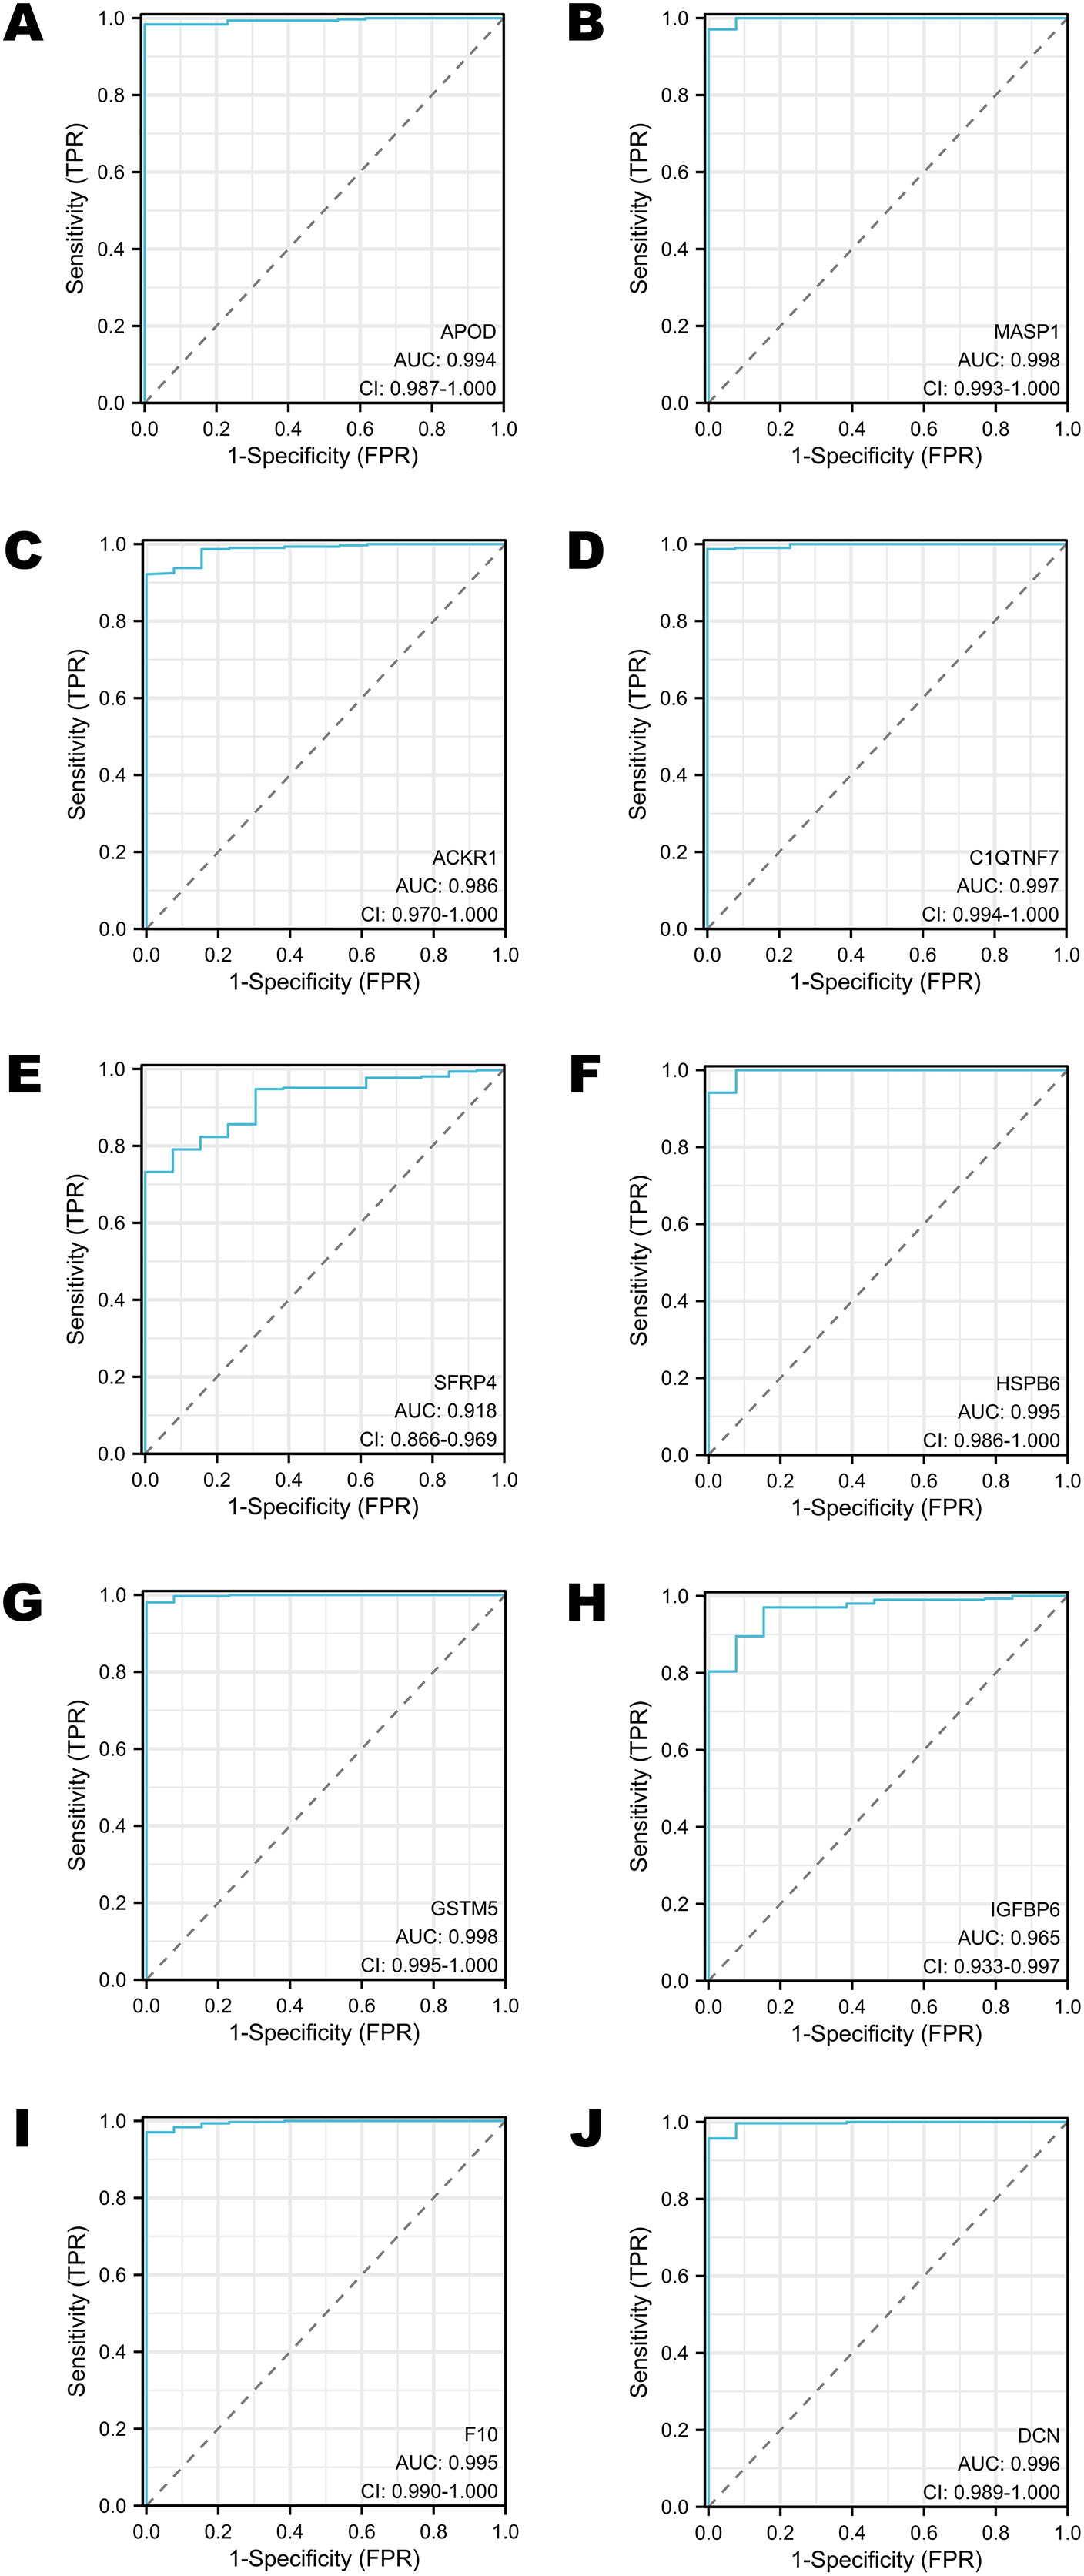
Survival analysis of selected DEGs in the TCGA program
Survival analysis was performed according to the OS time. The groups were divided by the median expression value of each target gene (Figs. 5A–5J). Only the expression levels of APOD, ACKR1 and SFRP4 contributed to the variation in OS. Patients who had higher expression of APOD, ACKR1 and SFRP4 might have a longer survival time (Figs. 5A, 5C, 5E).
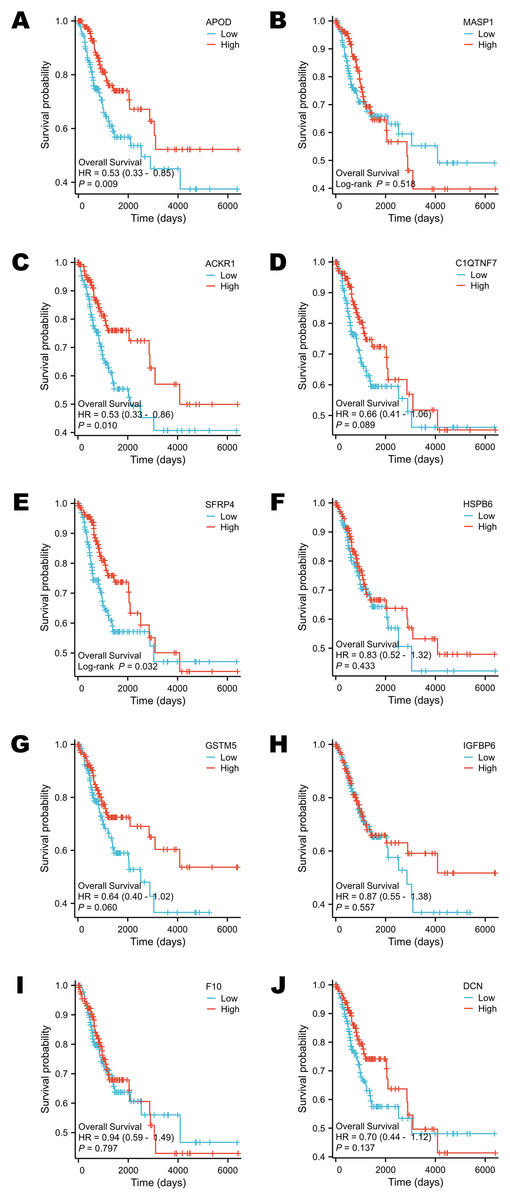
Figure 5: Survival analysis of selected DEGs in public database.
(A) The survival analysis of APOD in public database. (B) The survival analysis of MASP1 in public database. (C) The survival analysis of ACKR1 in public database. (D) The survival analysis of C1QTNF7 in public database. (E) The survival analysis of SFRP4 in public database. (F) The survival analysis of HSPB6 in public database. (G) The survival analysis of GSTM5 in public database. (H) The survival analysis of IGFBP6 in public database. (I) The survival analysis of F10 in public database. (J) The survival analysis of DCN in public database. Statistical methods were Cox proportional hazard model and Log-rank test.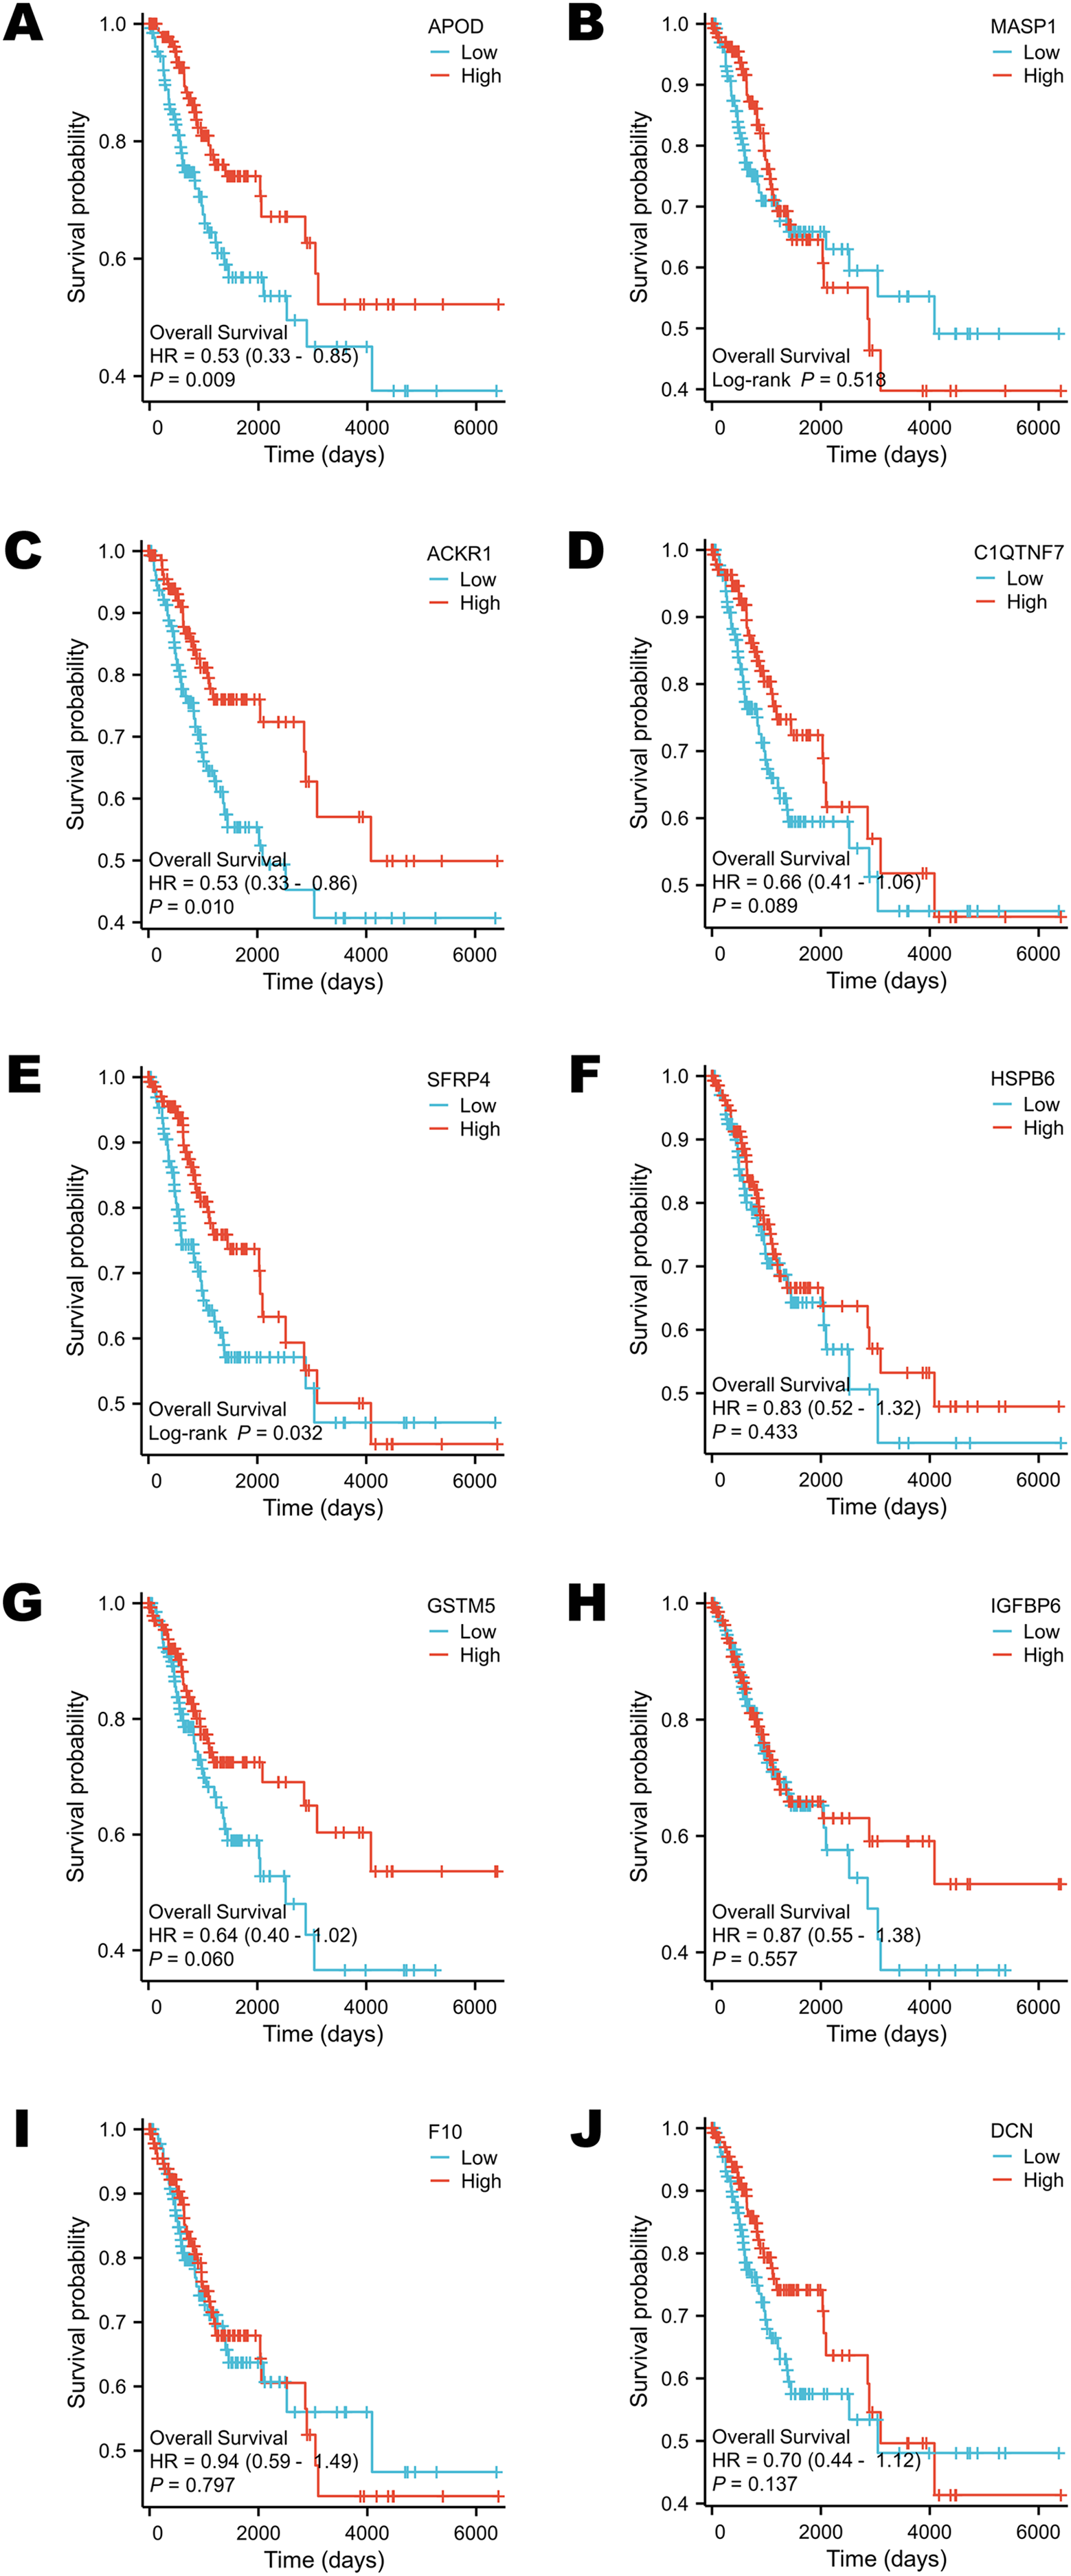
Selected DEGs were down-regulated in cervical cancer tissues
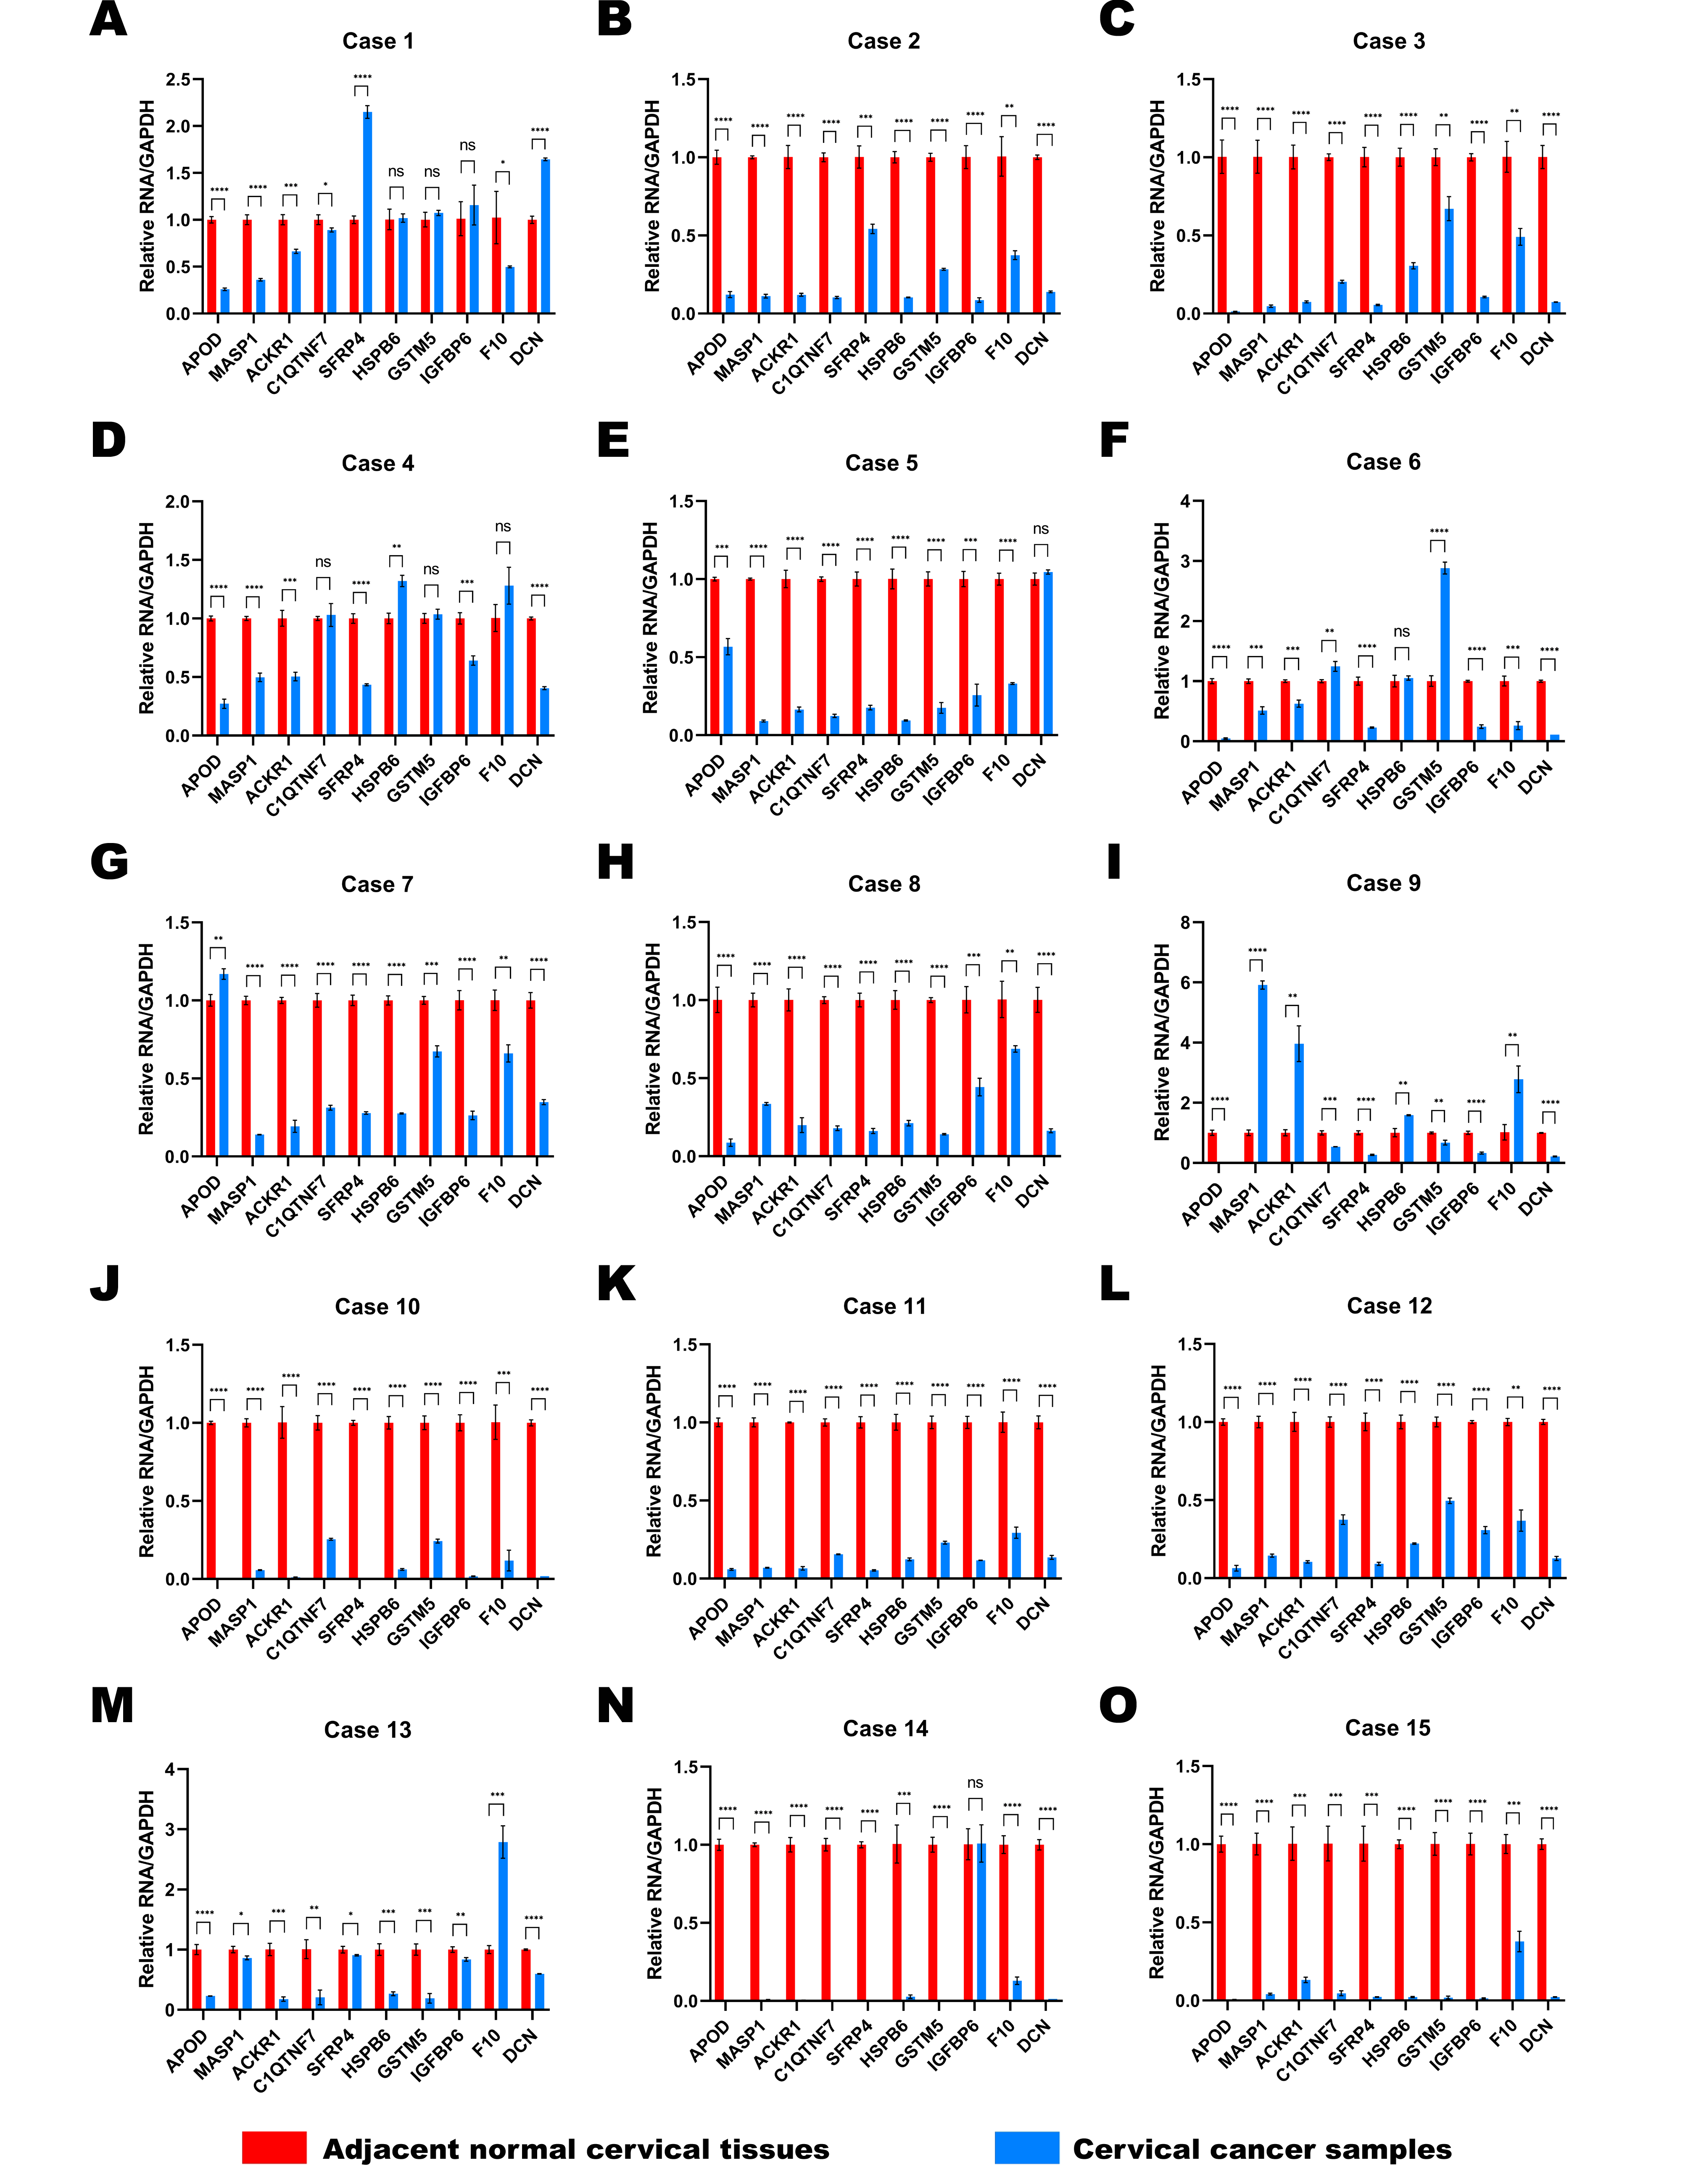
Fifteen pairs of cervical cancer tissues and adjacent normal cervical tissues were collected after the radical hysterectomy, and their brief clinical information were shown in Table 2. We performed RT-qPCR to determine the expressions of 10 selected DEGs in various patients (Figs. 6A–6J). GAPDH was used as the normalization gene. Similar to the analysis results of public database, the expression levels of most DEGs were down-regulated in cervical cancer tissues compared to the paired normal cervical tissues (Figs. 6A–6J). In Cases 2, 3, 8, 10, 11, 12 and 15, the expression levels of all 10 selected DEGs decreased significantly in cervical cancer tissues (Figs. S1B, S1C, S1H, S1J, S1K, S1L, S1O). The expression of DCN was almost unchanged in Case 5 (Fig. S1E), and IGFBP6 expression remained stable in both normal and cancer tissues of Case 14 (Fig. S1N). However, the expression levels of other DEGs in Case 5 and 14 were lower in cancer tissues than that in normal tissues (Figs. S1E and S1N). All data in Fig. 6 and S1 showed that the expression levels of APOD, MASP1, ACKR1 and SFRP4 were extremely consistent in most cases, demonstrating that they have a potential to be biomarkers for cervical cancer diagnosis.
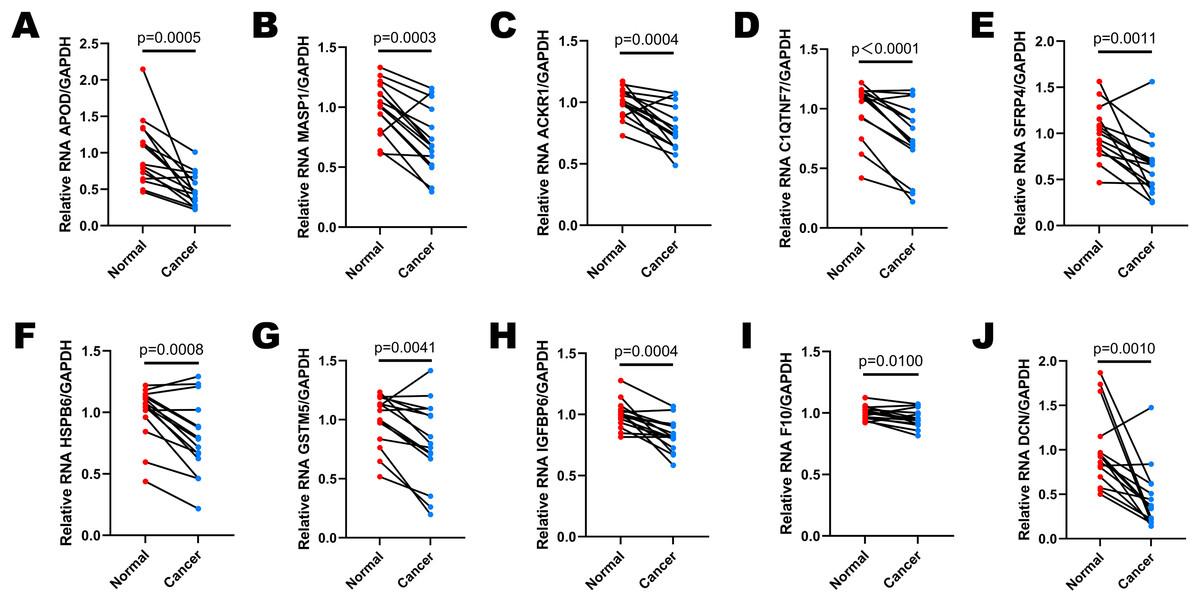
Figure 6: The expression levels of selected DEGs between paired adjacent normal cervical tissues and cervical cancer tissues by RT-qPCR.
(A) The comparison of APOD expression between paired normal and cancer tissues. (B) The comparison of MASP1 expression between paired normal and cancer tissues. (C) The comparison of ACKR1 expression between paired normal and cancer tissues. (D) The comparison of C1QTNF7 expression between paired normal and cancer tissues. (E) The comparison of SFRP4 expression between paired normal and cancer tissues. (F) The comparison of HSPB6 expression between paired normal and cancer tissues. (G) The comparison of GSTM5 expression between paired normal and cancer tissues. (H) The comparison of IGFBP6 expression between paired normal and cancer tissues. (I) The comparison of F10 expression between paired normal and cancer tissues. (J) The comparison of DCN expression between paired normal and cancer tissues. Statistical method was paired t test. Data was presented as mean value of triplicates.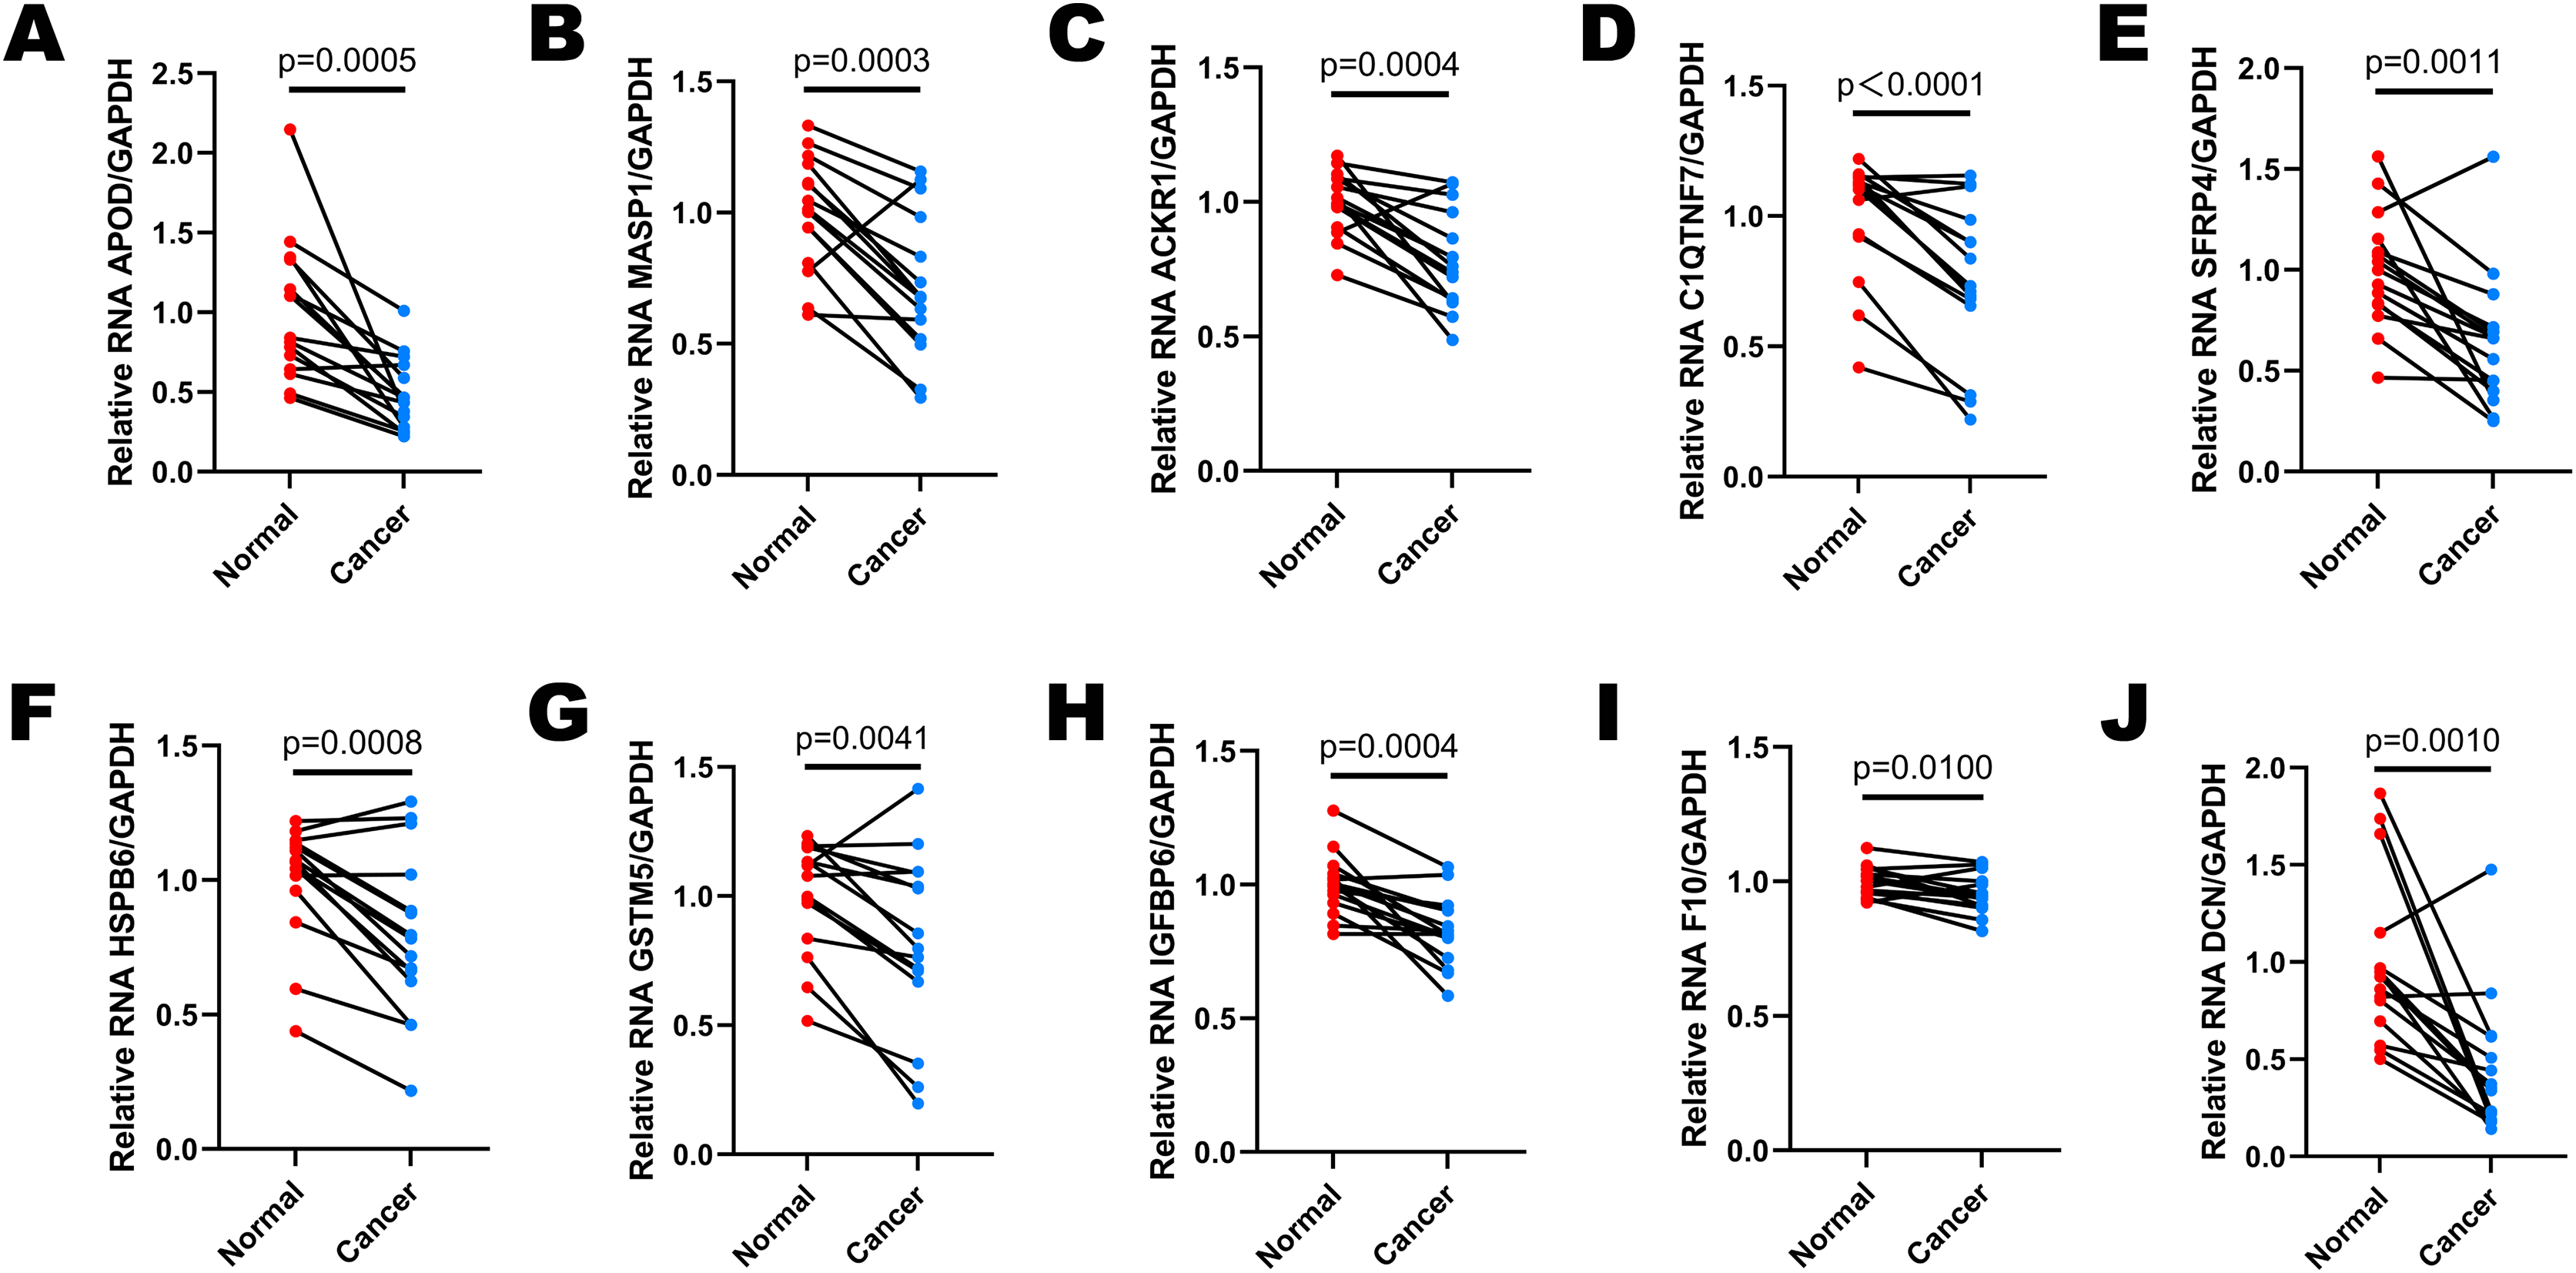
Discussion
According to the RNA sequence of three patients, we chose the top 10 DEGs which included APOD, MASP1, ACKR1, C1QTNF7, SFRP4, HSPB6, GSTM5, IGFBP6, F10 and DCN to compare the expression levels of normal and tumor tissues in public databases and our clinical specimens. The expression of 10 genes decreased significantly in most tumor samples. Moreover, we generated the ROC curves and performed survival analysis of selected genes. AUC values were greater for APOD, MASP1, C1QTNF7, HSPB6, GSTM5, F10 and DCN. The higher expression levels of APOD, ACKR1 and SFRP4 are closely related to longer OS. The functional enrichment analysis of all the DEGs were accomplished. Extracellular matrix and angiogenesis were involved in the tumorigenesis process, while PI3K-Akt signaling pathway was the most remarkable potential mechanism.
The major biological functions of the 10 DEGs were various from literatures, and we summarized them in Table 3. Five of them have previously been associated with cervical cancer. APOD is a 25–30 kDa apolipoprotein whose biological functions were mostly associated with lipid metabolism and neuroprotection in the past, but it also had effects on lipid trafficking, food intake, inflammation, antioxidative response, development and even in different types of cancers (Rassart et al., 2020). Some research identified APOD, down-regulated in cervical tumor, as a DEG from public databases such as Gene Expression Profiling Interactive Analysis 2 (GEPIA2), and utilized APOD as one of the biomarkers in prognostic model of cervical cancer (Jiang et al., 2021; Wang et al., 2021; Zhang et al., 2022c), which was consistent with our results. Song et al. (2008) even believed that APOD was a candidate gene involved in pathogenesis of invasion in cervical cancer since 2008. The above literatures approved our conclusion that APOD acts as a tumor suppressor in cervical cancer. MASP1 is one kind of the complexes of mannose-binding lectin and serine proteases and is able to activate C3 (Matsushita, Endo & Fujita, 1998). MASP1 could serve as a serum protein, so it was used to judge the prognosis of cervical cancer and response to chemotherapy (Kong et al., 2020; Li et al., 2023; Maestri et al., 2018). Since MASP1 participated in the activities of complement system, we believed that future research on the influence of MASP1 to immune escape of cervical cancer would be valuable. ACKR1, also known as the Duffy antigen receptor for chemokines (DARC), is a key regulator that binds chemokines involved in inflammatory responses, cancer proliferation, angiogenesis, and metastasis (Crawford & Volkman, 2023). Hou et al. (2013), Liu et al. (2020) both linked the expression of ACKR1 to lymph node metastasis and prognosis in cervical cancer, reaching a conclusion that ACKR1 might be a tumor suppressor. SFRP4 is a secreted protein with an affinity to bind to the Wnt ligands, participating in different developmental and adult homeostatic pathways (Pawar & Rao, 2018). The hypermethylation or decreased expression of SFRP4 was supposed to have relationship with the occurrence and progression of cervical cancer, and antagonizing canonical Wnt signaling pathway through SFRP4 may become a new cancer therapy (Chung et al., 2009; Ghoshal & Ghosh, 2016; Zhang, Chen & Shao, 2020). SFRP4 expression was also reduced in cervical cancer tissues in our experiments. Further research is needed on how SFRP4 functions on cervical cancer through Wnt/β-catenin signaling pathway. DCN, a leucine-rich extracellular matrix proteoglycan, is a suppressor of tumorigenesis, invasion and metastasis. It is said to be an essential regulatory factor in inflammation and ferroptosis (Hu et al., 2021b; Liu et al., 2021). Wang et al. (2022a) studied the relationship of long non-coding RNA (Lnc-RNA) PGM5-AS1 and cervical cancer, and finally discovered that the Lnc-RNA upregulated DCN to inhibit cervical cancer progression. Our GO enrichment analysis reported that extracellular matrix was intensively associated with cervical cancer development, and DCN may get involved in this process.
| Gene | Gene description | Gene ID in ensembl | Major biological functions |
|---|---|---|---|
| APOD | Apolipoprotein D | ENSG00000189058 | Lipid metabolism, lipid trafficking, neuroprotection, food intake, inflammation, antioxidative response, development, tumor behavior regulator |
| MASP1 | Mannose-Binding Lectin-Associated Serine Protease 1 | ENSG00000127241 | Activate complements, participate in lectin activation pathway |
| ACKR1 | Atypical Chemokine Receptor 1 | ENSG00000213088 | Chemokine receptor, inflammatory response, cancer proliferation regulator, cancer metastasis regulator, angiogenesis |
| C1QTNF7 | Complement C1q Tumor Necrosis Factor-Related Protein 7 | ENSG00000163145 | A target from adipokine family, metabolic syndrome, glucose tolerance, vascular remodeling, regulator of inflammation and cellular stress |
| SFRP4 | Secreted Frizzled Related Protein 4 | ENSG00000106483 | Regulator of Wnt/β-catenin signaling pathway, development, homeostatic establishment |
| HSPB6 | Heat Shock Protein Family B (Small) Member 6 | ENSG00000004776 | Cardioprotection, regulatory factor of the folding and degradation of proteins in cancer cell growth, proliferation, metastasis, and resistance to drugs |
| GSTM5 | Glutathione S-Transferase Mu 5 | ENSG00000134201 | Cellular protection from the environment and oxidative stress, detoxification modulator |
| IGFBP6 | Insulin Like Growth Factor Binding Protein 6 | ENSG00000167779 | A relatively specific inhibitor of IGF-II, a regulator of DNA repair, ferroptosis and chemotaxis of immune cells |
| F10 | Coagulation Factor X | ENSG00000126218 | Coagulation, FX production, hematological system diseases, ability of anti-angiogenesis |
| DCN | Decorin | ENSG00000011465 | Suppressor of tumorigenesis, suppressor of invasion and metastasis, regulatory factor in inflammation and ferroptosis |
To our knowledge, the functions of other five genes were not reported in cervical cancer previously. C1QTNF7, also called C1q complement/TNF related protein 7 (CTRP7), is an important target from adipokine family for metabolic syndrome, glucose tolerance, insulin sensitivity and vascular remodeling (Bi et al., 2022; Hu et al., 2021a; Lata et al., 2022; Petersen et al., 2017; Wong et al., 2008; Xue et al., 2024). It is also a secreted regulator of inflammation and cellular stress (Petersen et al., 2017). Besides, the increased expression of C1QTNF7 in macrophages inhibited the proliferation and migration of trophoblasts, and further resulted in recurrent miscarriage (Wang et al., 2022b). It was predicted that the function of C1QTNF7 in metabolism, vascular remodeling and inflammation may affect the progression of cervical cancer. HSPB6 is a member of the family of heat shock proteins (HSP), which regulates the folding and degradation of proteins in cancer cell growth, proliferation, metastasis, and resistance to drugs (Chen et al., 2021; Guo et al., 2023; Wu et al., 2023; Wyciszkiewicz et al., 2021). It is also famous for its ability to provide cardioprotection (Fan, Chu & Kranias, 2005). The hypermethylation of HSPB6 was observed in breast cancer and melanoma (Edwards, Cameron & Baillie, 2011; Zhang et al., 2022b). HSPB6 phosphorylation showed anti-tumor activities in hepatocellular and prostate cancer cells (Feng et al., 2024; Matsushima-Nishiwaki et al., 2016). Besides, many researches linked the action of HSPB6 with enhanced apoptosis (Feng et al., 2024; Guo et al., 2023; Ju et al., 2015; Nagasawa et al., 2014; Yang et al., 2022). The role of HSPB6 in cervical cancer is still unclear. Our data showed HSPB6 expression decreased in cervical cancer tissues, implying that it might participate in the progression of cervical cancer. The function of HSPB6 in cervical cancer progression needs further investigation. GSTM5 belongs to Glutathione S-transferase (GSTs) family, participating in cellular protection from the environment and oxidative stress (Peng et al., 2008). Zhang et al. (2022a) indicated that GSTM5 might reduce reactive oxygen species (ROS) level to ameliorate oxidative stress, and ultimately, regulate ovarian cancer stemness maintenance. Abnormal expression of GSTM5 was widely detected in malignant tumors such as gastric cancer, urothelial carcinoma and lung adenocarcinoma (Chen et al., 2020; Hao et al., 2022; Jou et al., 2021; Shen et al., 2023). We found that GSTM5 expression was down-regulated in cervical cancer, which was valuable to discover the underlying mechanism. More attention might be paid on the potential influence of oxidative stress caused by reduced GSTM5 expression in cervical cancer. IGFBP6 is a relatively specific inhibitor of IGF-II, which means it also inhibits IGF II-induced proliferation, differentiation, migration and survival (Bach Leon, Fu & Yang, 2012). Bach (2015b) reviewed literatures and found that IGFBP-6 expression was lower in malignant cells than in normal cells, which implied that it is an inhibitor of tumorigenic processes. Likewise, we found the same variation tendency in malignant cervical tissues and normal tissues. Reduced expression of IGFBP6 could be used to identify breast, prostate, hepatocellular and colorectal cancer (Bach, 2015a; Nikulin et al., 2021; Zhao et al., 2020). It is also regarded as a regulator and prognostic factor for glioma (Bei et al., 2016). Wnt/β-catenin and Hedgehog signaling pathway regulated the expression of IGFBP6 (Bach, 2015a). Other potential biological changes caused by IGFBP6 contained DNA repair, ferroptosis and chemotaxis of immune cells (Chua et al., 2015; Liso et al., 2018; Nikulin et al., 2023), which may induce cervical cancer to a certain extent. Coagulation processes interact with tumorigenesis and malignant behaviors (Falanga, Marchetti & Vignoli, 2013). Zymogen FX, encoded by F10, was reported to have the ability of anti-angiogenesis depending on the Gla domain (Lange et al., 2014). Borensztajn et al. (2009) and Borensztajn, Peppelenbosch & Spek (2010) confirmed that F10 specifically inhibits the migration of several cancer cell lines (breast, lung and colon cancer cells) dependent on protease-activated receptor-1 (PAR-1) signaling and LIM Domain Kinase (LIMK) activation. Additionally, Graf et al. (2019) found that rivaroxaban, an inhibitor of F10, promotes antitumor immunity. Since F10 influenced angiogenesis and migration, it is meaningful to explore whether cervical cancer had a relationship with coagulation changes.
It is also interesting to verify the diagnostic and prognostic value of the 10 DEGs using the public data. ROC curve is a plot that evaluated the accuracy of a diagnostic test or prognostic model. The x-axis and y-axis were used to describe (1-specificity) and sensitivity, respectively. Each point on ROC curve was confirmed under different cut-off value. The index we paid much attention to is the AUC value. The AUC value is between 0.5 and 1. A test that perfectly discriminated between two conditions such as health and tumor has an AUC close to 1.0 (Alemayehu & Zou, 2012; Obuchowski & Bullen, 2018). In this study, the AUC values of all these 10 DEGs were over 0.90, indicating that they had dramatic diagnostic value to identify cervical cancer, especially MASP1, GSTM5 and C1QTNF7. Survival analysis reflects the survival status of different classification conditions over time (Flynn, 2012). It could be used to compare the follow-up of different groups of patients. Median expression level of each DEG was regarded as the classification standard in this research. Only the expression levels of APOD, ACKR1 and SFRP4 had influences on the OS of cervical cancer patients. These findings indicated that APOD, ACKR1 and SFRP4 may have the ability to predict survival outcomes. These genes could be regarded as prognostic biomarkers. All these novel biomarkers were likely to participate in the machine-learning diagnostic or prognostic models in the future.
All the expression levels of the 10 DEGs decreased significantly in most cases in our experiments, which was consistent with the results of public database analysis. Some of the 10 genes exhibited opposite results in different cases such as MASP1 and ACKR1 in case 9 (Fig. S1I). These results could be attributed to individual difference, for the selected genes participated in diverse biological process. Only APOD, MASP1, ACKR1, SFRP4 and DCN have been reported in cervical cancer in previous studies, but all the related researches were only bioinformatics analysis or expression levels associated with clinical status. There is a lack of explanation of mechanism by which these genes influence the progression of cervical cancer. The correlation of cervical cancer with DEGs such as C1QTNF7, HSPB6, GSTM5, IGFBP6 and F10 is still unknown.
The limitation of our study was that we only analyzed the RNA sequencing results of three patients, resulting in a small sample size. Public database was included in the research to support these ideas, but the number of normal cervical samples was still limited. Fortunately, the 15 paired clinical specimens also reached a similar conclusion. In addition, the mechanism of selected DEGs has not been explained distinctly in literature. Biological functional experiments should be completed in further studies.
Conclusions
Cervical malignant tumors seriously harm women’s health. The diagnostic and prognostic biomarkers that have good sensitivity and specificity have not been explored until now. In our study, we screened 10 DEGs, which included APOD, MASP1, ACKR1, C1QTNF7, SFRP4, HSPB6, GSTM5, IGFBP6, F10 and DCN, in cervical cancer tissues and paired adjacent normal tissues by RNA sequencing. All the expression levels of selected DEGs were down-regulated in tumors in both our clinical specimens and public database analysis. These genes showed great value in diagnosing the status of carcinogenesis. However, only the expression levels of APOD, ACKR1 and SFRP4 could predict the survival of patients. We are the first team to pay attention to the relationship between C1QTNF7, HSPB6, GSTM5, IGFBP6, F10 and cervical cancer. Therefore, our results could provide novel candidate genes for future in-depth research on cervical tumorigenesis mechanisms and establishment of diagnostic or prognostic models.
Supplemental Information
Targeted gene information and specific primer sequences of top 10 DEGs.
DEGs expression of each case between paired adjacent normal cervical tissues and cervical cancer tissues by RT-qPCR.
’(A) to (O), The expression levels of 10 selected DEGs in cases 1 to 15. Statistical method was unpaired t test. Data was presented as Mean ± SD. * p < 0.05; ** p < 0.01; *** p < 0.001; **** p < 0.0001.’