
Comparative transcriptome analysis of cucumber fruit tissues reveals novel regulatory genes in ascorbic acid biosynthesis
- Published
- Accepted
- Received
- Academic Editor
- Vladimir Uversky
- Subject Areas
- Agricultural Science, Genetics, Molecular Biology, Plant Science
- Keywords
- Cucumber, Transcriptome analysis, Ascorbic acid, Ascorbate biosynthesis pathways, Ascorbate recycling pathway
- Copyright
- © 2024 Ren et al.
- Licence
- This is an open access article distributed under the terms of the Creative Commons Attribution License, which permits using, remixing, and building upon the work non-commercially, as long as it is properly attributed. For attribution, the original author(s), title, publication source (PeerJ) and either DOI or URL of the article must be cited.
- Cite this article
- 2024. Comparative transcriptome analysis of cucumber fruit tissues reveals novel regulatory genes in ascorbic acid biosynthesis. PeerJ 12:e18327 https://doi.org/10.7717/peerj.18327
Abstract
Ascorbic acid (AsA) is one of the most abundant natural antioxidants, and it is an important indicator of the nutritional value of cucumber fruit. The aim of this study was to elucidate the regulatory mechanism affecting AsA metabolism in cucumber fruit. In this study, the AsA content in the fruit of two cucumber cultivars (H28 and H105) was significantly higher in the exocarp and endocarp than in the mesocarp. To clarify the regulation of AsA in cucumber fruit, the transcriptomes of three fruit tissues (i.e., the exocarp, mesocarp, and endocarp) of two cucumber cultivars (H28 and H105) were sequenced. Transcriptomic profiling combined with transcription factors (TFs) and correlation analysis were performed to reveal that three genes, including CsaV3_5G014110 (phosphomannomutase, PMM), CsaV3_2G004170 (GDP-mannose-3′, 5′-epimerase, GME) and CsaV3_5G006680 (dehydroascorbate reductase, DHAR), were expressed at higher level in the exocarp and endocarp than in the mesocarp. In both two cultivars, CsaV3_4G028360 (ethylene-responsive transcription factor, ERF) was negatively correlated with PMM and GME, and positively correlated with DHAR. CsaV3_6G042110 (ethylene-responsive transcription factor, ERF) was positively correlated with PMM and GME, and negatively correlated with DHAR. CsaV3_6G032360 (mitogen-activated protein kinase, MAPK) as positively correlated with PMM, GME and DHAR. These six genes are considered the key candidate genes for further research. This study provides insight for further study on the regulation of AsA biosynthesis in cucumber fruit and provide potential candidate genes for future genetic improvement of cucumber germplasm with enhanced AsA accumulation.
Introduction
AsA is one of the most important antioxidant molecules. It also plays important roles in diverse physiological functions in plants, such as photosynthesis, signal transduction, cell division and expansion, plant growth, and flowering time (Foyer, Kyndt & Hancock, 2020; Alves et al., 2021; Muñoz et al., 2023; Wang et al., 2024). AsA also has important roles in human health, such as preventing various oxidative stress-related diseases, participating in collagen synthesis. Due to the lack of the gene encoding the enzyme L-gulono1,4-lactone oxidase, which catalyzes the last step of the animal AsA biosynthesis pathway, humans have lost the ability to synthesize AsA and can only obtain it from our diet (Njus et al., 2020; Muñoz et al., 2023). Fresh fruit and vegetable are our primary AsA source. However, AsA content varies among species, and there are also differences among different varieties.
AsA concentration is determined by the balance between biosynthesis, oxidation, enzymatic regeneration or recycling, and transport. To date, there are at least five pathways involved in AsA metabolism (Chen et al., 2023). Four AsA biosynthesis have been described in plants: the D-mannose/L-galactose (D-Man/L-Gal) or Smirnoff-Wheeler, L-gulose, D-galacturonate (D-GalA), and myo-inositol (MI) (Wheeler, Jones & Smirnoff, 1998; Ren et al., 2013; Sodeyama et al., 2021; Chen et al., 2023). There is only one AsA recycling pathway (Ascorbate-glutathione system, AsA-GSH system) in plants, and it plays an important role in plant development and stress tolerance (Zhang et al., 2016; Liao et al., 2023).
In order to increase the content of AsA in plant, the regulatory mechanism of AsA in plants has long been the subject of research. Many studies showed that AsA biosynthesis and recycling are closely modulated by transcriptional mechanisms. Some studies have shown that GDP-L-galactose-phosphorylase (GGP) is a crucial regulatory point in the AsA pathway in Arabidopsis thaliana (Li et al., 2008; Fenech et al., 2021). Some studies have shown that transport of AsA and its intermediates are crucial in AsA metabolism (Miyaji et al., 2015; Sechet et al., 2018). Plant hormones also participate in regulating the AsA biosynthesis in plants (Perin et al., 2019; Yu et al., 2019; Zhang et al., 2020; Chen et al., 2021; Xu et al., 2022; Xu et al., 2023). However, due to control and influence of various factors on AsA content, the mechanisms controlling AsA levels in plants remain unexplored.
Cucumber (Cucumis sativus L.) is consumed in different industries of food such as juicing, sauerkraut, and fresh food, and is a major vegetable crop grown worldwide (Dong et al., 2023; Wang et al., 2023). Recognized for its fragrant and delectable fruit, cucumber is primarily consumed in its fresh form. Cucumber boasts a rich composition of carotenoids, vitamins, minerals, and a variety of organic acids, making its very popular among consumers. AsA is one of the main components of cucumber, and increasing the content of AsA in cucumber fruits is one of the breeding goals of cucumber. So far, information about about the functions of AsA as well as the genetics and biochemistry of AsA biosynthesis in cucumber seeding have been reported (Zhang et al., 2016), few studies have focused on the mechanism of molecular regulation and accumulation in cucumber fruits.
Exploring the roles and regulatory mechanisms of distinct AsA biosynthetic routes in cucumber fruits could lay the foundation for improving the quality of this crop. The aim of this study was to investigate the transcriptome of two cucumber varieties (H28 and H105) across different tissues using RNA-seq, thus gaining further insight into the genes and regulatory networks involved in AsA biosynthesis in cucumber fruit.
Materials & Methods
Plant material
Two cucumber cultivars, H28 and H105, were grown in a greenhouse at the Institute of Vegetables and Flowers, Chinese Academy of Agricultural Sciences, Beijing, China. They were sowed on 20 March 2020. The greenhouse temperature ranged from 22–30 °C during the day and 18–25 °C at night, with natural light, 60% ± 10% RH. H28 and H105 are hybrid species preserved by our research group. The research background is clear. H28 is a North China type cucumber, H105 is a South China type white jade type cucumber.
The fruits of H28 and H105 were harvested at the fruit ripening stage (around 14 days after flowering, between the 6th and 10th node). The exocarp (1), mesocarp (2), and endocarp (3) (Fig. 1A) of the two cultivars were rapidly separated and immediately frozen in liquid nitrogen. Three replicates were prepared at each collection time point. The samples of H105 were named as A1 (A1_1, A1_2, A1_3), A2 (A2_1, A2_2, A2_3), A3 (A3_1, A3_2, A3_3). The samples of H28 were named as B1 (B1_1, B1_2, B1_3), B2 (B2_1, B2_2, B2_3), B3 (B3_1, B3_2, B3_3).
Analyses of AsA, total AsA (T-AsA), and DHA
AsA, T-AsA, and DHA were analyzed according to Law, Charles & Halliwell (1983) with slight modifications. T-AsA was determined after reduction of DHA to AsA with dithiothreito (DTT), and the concentration of DHA was calculated by using the following formula: (T-AsA) - (AsA level). Data were collected as previously described in Zhang et al. (2016).
RNA-seq analysis
The methods for total RNA extracted, purification, and synthesis of first and second stranded cDNA were the same as previously described in Li et al. (2023). Total RNA were extracted following the manufacturer of Trizol Reagent (15596018; Invitrogen, Waltham, MA, USA). The quantity and purity of total RNA were assessed usingthe RNA Nano 6000 Assay Kit (5067-1511; Agilent, Santa Clara, CA, USA) of the Bioanalyzer 2100 system. mRNA was purified using Dynabeads Oligo (dT) (Thermo Fisher Scientific, Waltham, MA, USA), and fragmented into small pieces using Magnesium RNA Fragmentation Module (cat.e6150; NEB, Ipswich, MA, USA). First strand and second strand cDNA was synthesized using SuperScript™ II Reverse Transcriptase (cat. 1896649, Invitrogen), E. coli DNA polymerase I (cat.m0209; NEB), RNase H (cat.m0297; NEB) and dUTP Solution (cat.R0133, Thermo Fisher Scientific). The quantity and purity of total RNA were analysis of Bioanalyzer 2100 and RNA 6000 Nano LabChip Kit (5067-1511). The average insert size for the final cDNA libraries were 300 ± 50 bp. The cDNA library construction and transcriptome sequencing were performed by LC-Bio Technology CO., Ltd. (Hangzhou, China) used Illumina Novaseq TM 6000 sequence platform.
Clean reads were generated through Cutadapt (v1.15) software, which eliminated data with adapters and low-quality reads (average quality below Q20). The high-quality clean reads were aligned with the cucumber (Chinese Long) reference genome using HISAT2 (https://daehwankimlab.github.io/hisat2/). The final transcriptome was generated using StringTie (http://ccb.jhu.edu/software/stringtie/, version:stringtie–2.1.6) and gffcompare software (http://ccb.jhu.edu/software/stringtie/gffcompare.shtml, version:gffcompare–0.9.8). The method of the final transcriptome assembly was the same as previously described in Li et al. (2023). The expression levels of all transcripts were estimated using StringTie and ballgown (http://www.bioconductor.org/packages/release/bioc/html/ballgown.html). The expression abundance for mRNAs were performed by calculating FPKM (fragment per kilobase of transcript per million mapped reads) value. The calculation formula of RPKM was adopted as the previous study: RPKM = 109 × C/(N × L), where C represented the number of reads for a gene, N represented the total number of reads, and L represents the transcript length corresponding to the gene (Mortazavi et al., 2008). The read counts of each sequenced library were adjusted using edgeR v.3.24.3 software and the scale normalization factor before analyzing the DEGs. edgeR v.3.24.3 is a widely used software that allows us to estimate the recounts of each gene. The differential expression analysis is being conducted at the gene level. Genes differential expression (DEGs) analysis was performed by DESeq2 software (Love, Huber & Anders, 2014) and edgeR statistical package (http://bioconductor.org/packages/stats/bioc/edgeR/) according to the criteria —log2(FoldChange)—>1 and a false discovery rate (FDR) <0.05. DEGs were then subjected to enrichment analysis of GO functions and KEGG pathway. RNA-seq had three biological repetitions at each point.
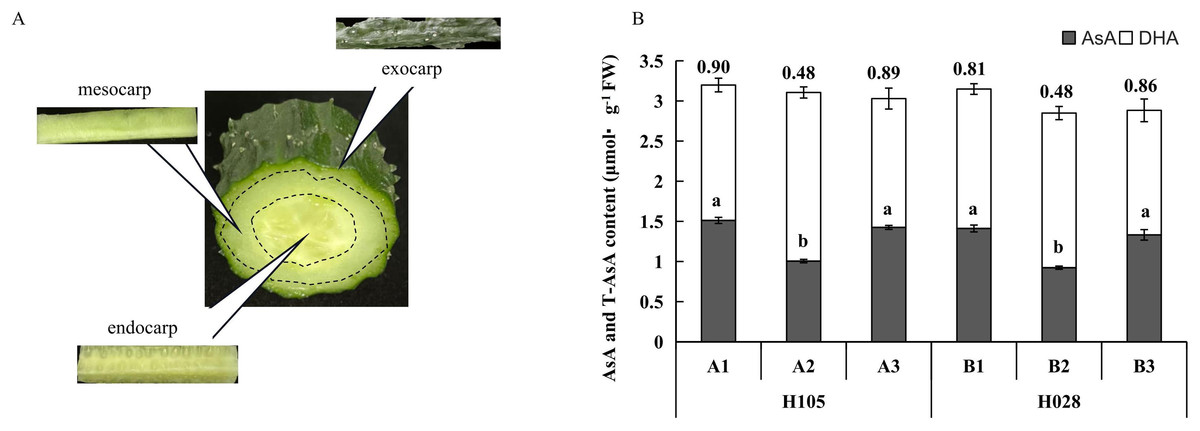
Figure 1: (A) Schematic diagram of different tissues in cucumber fruit; (B) ascorbic acid (AsA), dehydroascorbic acid (DHA), and total ascorbate (T-AsA) contents in different tissues in the two cucumber cultivars of cucumber.
‘H105’ (A) and ‘H28’ (B). Exocarp (1), Mesocarp (2), and endocarp (3) Numbers above the bar chart columns represent the AsA/DHA ratio. Error bars represent the mean ± SD of the three corresponding replicates. Different lowercase letters represent significantly different AsA content in the different tissues. A1: exocarp of ‘H105’, A2: mesocarp of ‘H105’, A3: endocarp of ‘H105’, B1: exocarp of ‘H28’, B2: mesocarp of ‘H28’, B3: endocarp of ‘H28’ .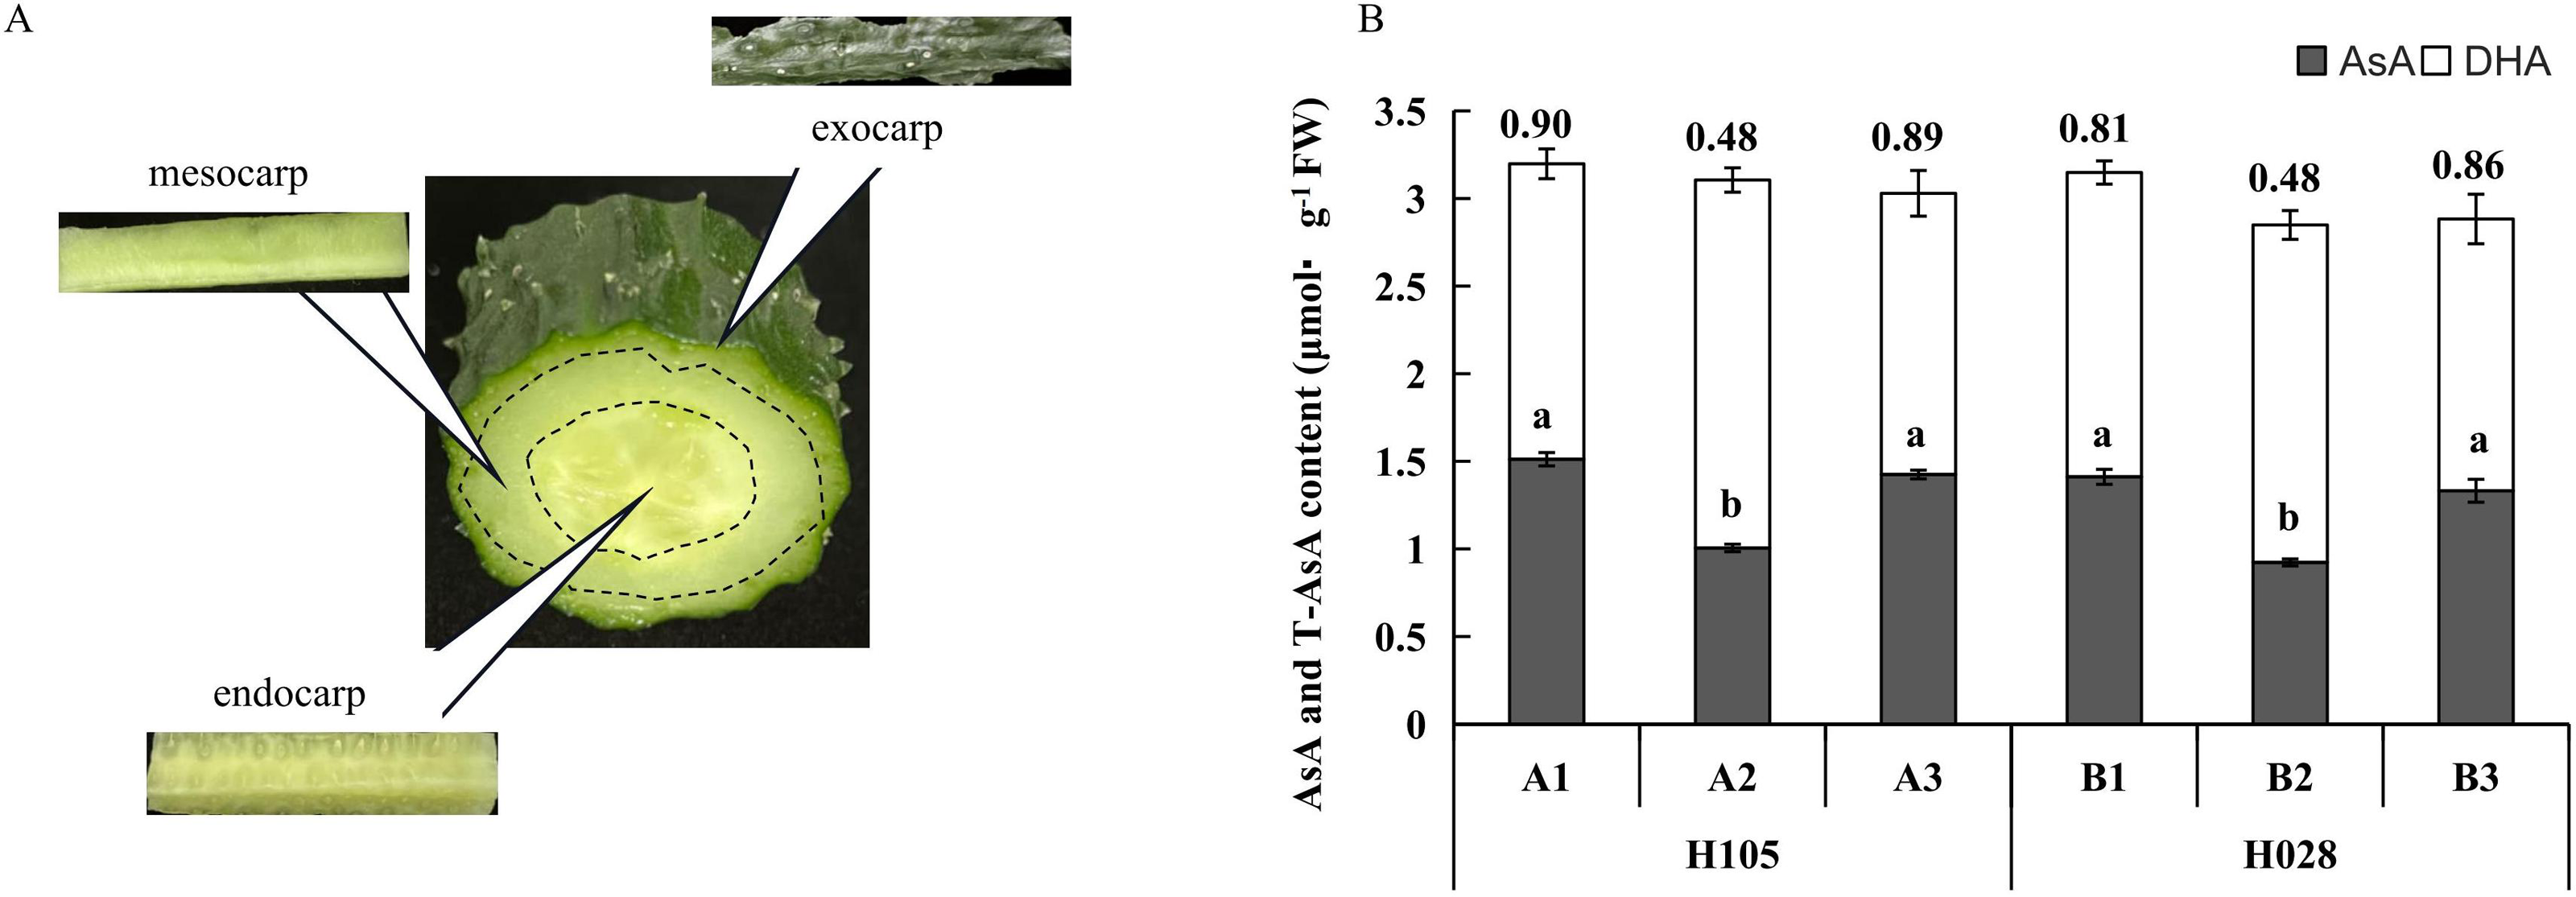
To explore the the functions of the DEGs, all DEGs were mapped to GO terms in the Gene Ontology database (http://www.geneontology.org/), then GO enrichment analysis was conducted using TBtools (Li et al., 2023), the p-value and and q-value were set to 0.05. KEGG database (KEGG: Kyoto Encyclopedia of Genes and Genomes) was used to explore the pathways associated with DEGs, and to analyze the statistical enrichment of candidate genes in the KEGG pathways. A enriched pathways with p-value <0.05 and and q-value <0.05 were considered statistically significantly enriched.
Principal component analysis (PCA) was performed with principal function of R (https://www.r-project.org/) in this experience. PCA is a statistical procedure that converts hundreds of thousands of correlated variables (gene expression) into a set of values of linearly uncorrelated variables called principal components. The correlation between different samples was analyzed using the PCA.
Genes differential expression (DEGs) analysis was performed by DESeq2 software (Love, Huber & Anders, 2014) according to the criteria —log2(FoldChange)—>1 and a false discovery rate (FDR) <0.05. DEGs were then subjected to enrichment analysis of GO functions and KEGG pathway. RNA-seq had three biological repetitions at each point.
Quantitative real-time PCR (qRT-PCR)
The quantitative real-time PCR (qRT-PCR) assay was configured following the recommendations of ‘The MIQE guidelines’ (Bustin et al., 2009). Twenty-six AsA content related genes were selected to validate the RNA-seq results. Primers for qRT-PCR were designed using the Primer Premier 5.0 online software (http://bioinfo.ut.ee/primer3-0.4.0/) and synthesized by Sangon Biotech Co., Ltd., Shanghai, China (Table S1). Only the qRT-PCR primers with 90%–110% amplification efficiencies were used for the subsequent data analysis. Actin was used as the internal reference gene (Table S1). For the cDNA synthesis, 1 µg of total RNA was reverse transcribed using the PrimeScript™ RT reagent Kit (Perfect Real Time) (TaKaRa, Dalian, China), following the manufacturer’s protocol. qRT-PCR was performed on the ABI 7500 system (Applied Biosystems) using the SYBR Green PCR Master Mix (TIANGEN, Beijing, China). The consumables used include RNase-free tips and 8 Strip PCR tubes from Axygen® Brand Products (Corning Incorporated, Corning, NY, USA). The quantification was performed in triplicate using 20 µL reactions. Each reaction included 10.0 µL of FastFire qPCR ⋅ PreMix, 0.6 µl of each primer (10 µM), 7.4 µl of RNase-free water, 0.4 µl of 50x ROX⋅ Reference Dye and 1.0 µL of 1:5 diluted cDNA. The qRT-PCR program was as follows: 95 °C for 10 min (initial denaturation), followed by 40 cycles of 95 °C for 5 s (denaturation), 60 °C for 15 s (annealing), and 72 °C for 35 s (elongation). A melting curve was obtained at the end of each PCR by gradually increasing the temperature to 95 °C (increment rates of 0.5 °C/s) after cooling to 65 °C for 5 s. Each gene was analyzed on the same amplification for all samples, so inter-run calibration was not necessary. The data obtained were analyzed by the QuantStudio Design & Analysis Software, which generated the raw quantification cycle (Cq) values for each reaction. Relative expression levels were quantified using the 2−ΔΔCt method (Livak & Schmittgen, 2001). Three biological replicates and four technical replicates were performed for each sample. Further qPCR details are supplied in a MIQE checklist table (Table S2).
Statistical analysis
The data were expressed as the mean ± standard deviation (SD) of three independent biological replicates. Statistical analysis was performed by one-way ANOVA in SAS software. Pearson’s correlation coefficient was used for correlation analysis with a two-tailed test.
Results
AsA contents in different tissues of different cucumber cultivars
For both cultivars, the distribution patterns of total ascorbate (T-AsA), AsA, and DHA in the different fruit tissues were consistent (Fig. 1). T-AsA content in the three tissues was not significantly different (Fig. 1). Accordingly, the DHA content in the mesocarp was higher than in the exocarp and endocarp, but the AsA content of the mesocarp was lower than that of the exocarp and endocarp. The ratio of AsA to DHA was computed in the three different tissues. Thus, in these two cultivars, the AsA: DHA ratio was lower (and the same) in the mesocarp but was higher in the exocarp and endocarp (Fig. 1).
Evaluation of transcriptome data
The transcriptomics of three fruit tissues (the exocarp, mesocarp, and endocarp) (Fig. 1A) of two cucumber cultivars (H28 and H105) were conducted to elucidate regulation of AsA metabolism in cucumber fruit. We analyzed three independent biological replicates of fruits for each variety, resulting in a total of 18 samples. The quality of extracted RNA is relatively high, with a yield ranging from 5.04 to 27.05 µg (Table S3).
In sequencing platforms, Q20 and Q30 are generally not less than 80%. To ensure the quality and reliability of data analysis, filter the raw data, remove adapters, N containing (N represents undetermined base information), and low-quality reads, and calculate the Q20 and Q30. The sequencing results of this experiment showed that high quality libraries with the Clean Reads Ratio of both groups of samples ≥ 94.47%, Q20 values ≥ 99.93% and Q30 values ≥ 96.41% were obtained (Table S4). 801.59 million raw reads and 765.91 million high-quality clean reads were obtained from the samples collectively. The average percentage of sequences matching to the reference genome was between 94.97%–96.88% (Table S4). The statistical power of this experimental design, calculated using RNASeqPower (Hart et al., 2013). Based on a sample size of three (the number of biological replicates used in this study), the statistical power among different groups ranged from 0.945 to 0.953, with an average value of 0.949 (Table S5). Pearson’s correlation coefficient was used to investigate the sample correlation and biological repeatability. Correlation analysis showed that there were good correlations (correlation coefffcient >0.94) between the three replicates of each samples (Fig. 2). In addition, the correlation within genotypes was higher than that among genotypes, indicating that the gene expression patterns within genotypes were more similar than those among genotypes (Fig. 2). This finding suggests a high level of reliability in the filtered data, which ensured its suitability for further analysis.
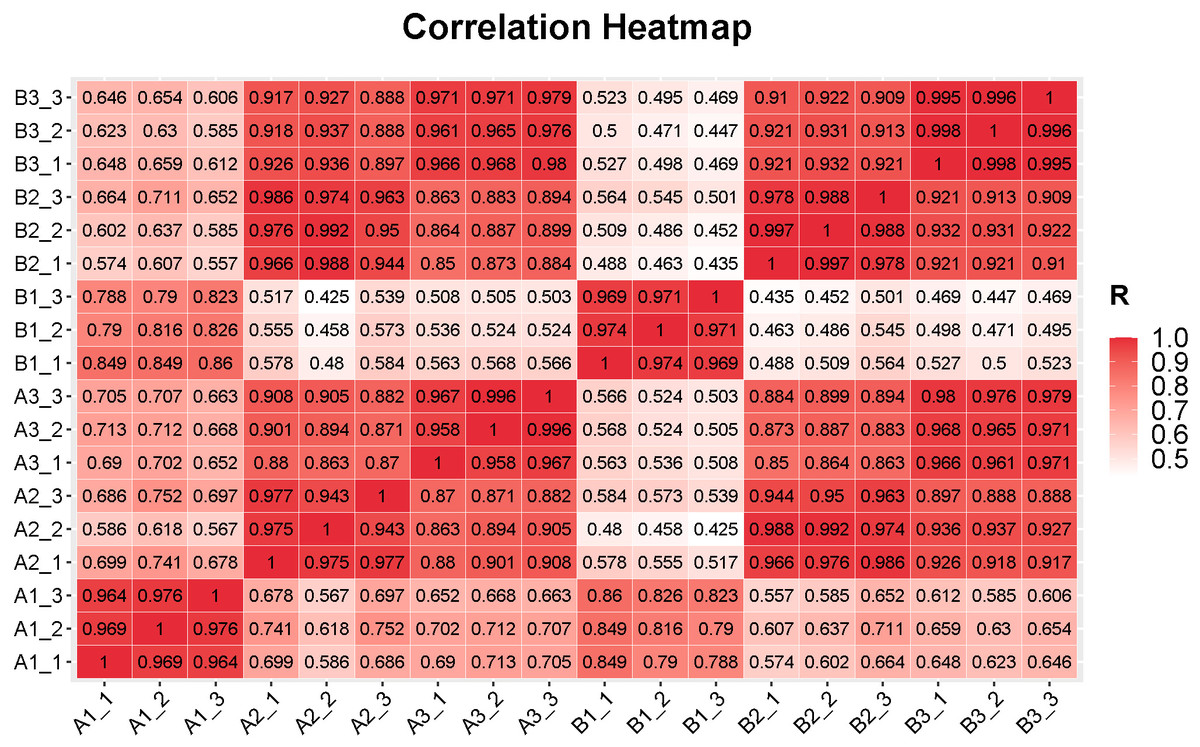
Figure 2: Correlations between the replicates of samples in different tissues in the fruits of two cucumber varieties comparisons.
A1_1 to A1_3: exocarp of ‘H105’, A2_1 to A2_3: mesocarp of ‘H105’, A3_1 to A3_3: endocarp of ‘H105’, B1_1to B1_3: exocarp of ‘H28’, B2_1 to B2_3: mesocarp of ‘H28’, B3_1 to B3_3: endocarp of ‘H28’.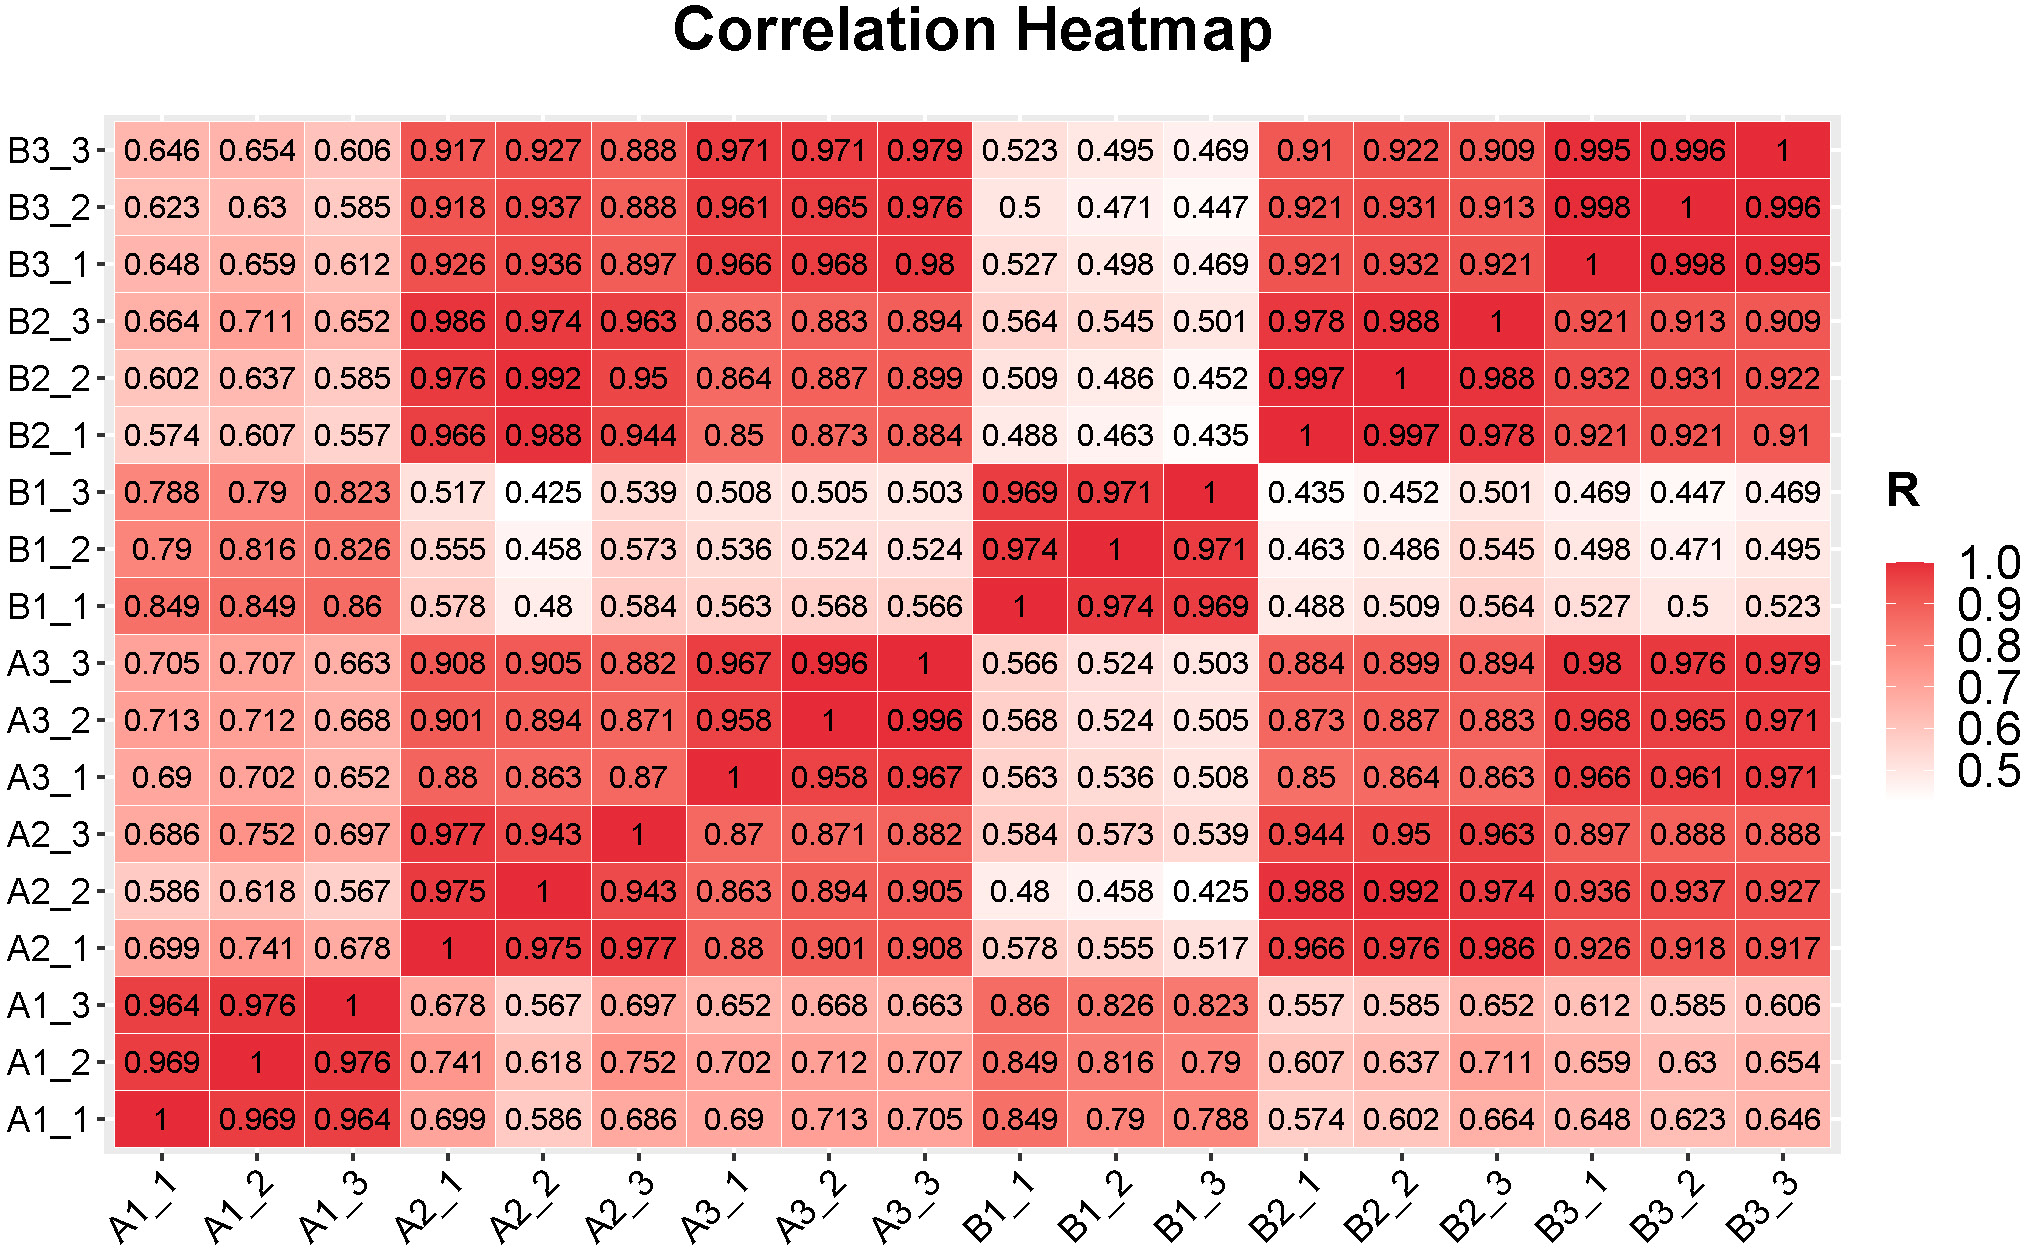
Differentially expression genes (DEGs) between different tissues
We used three different tissues from the two cultivars to compare DEGs. The DEGs were performed by DESeq2 software between two different groups (and by edgeR between two samples). The genes with the parameter of FDR<0.05 and —log2(FoldChange)—>1 were considered DEGs.
In H28 (B), the number of DEGs between exocarp (1) and mesocarp (2) was 4442, the number of DEGs between exocarp (1) and endocarp (3) was 7196, the number of DEGs between mesocarp (2) and endocarp (3) was 5270 (Fig. 3). In H105 (A), the number of DEGs between A_1 and A_2 was 3133, the number of DEGs between A_1 and A_3 was 7035, the number of DEGs between A_2 and A_3was 5329 (Fig. 3). The trend of DEGs in the 1, 2 and 3 of the two materials is consistent (Fig. 3), with the highest number of DEGs in the 3, indicating a significant difference in the changes that occur in the 3 between the two varieties. There were relatively few common DEGs among three tissues, with 796 in A and 910 in B (Figs. 3B, 3C).
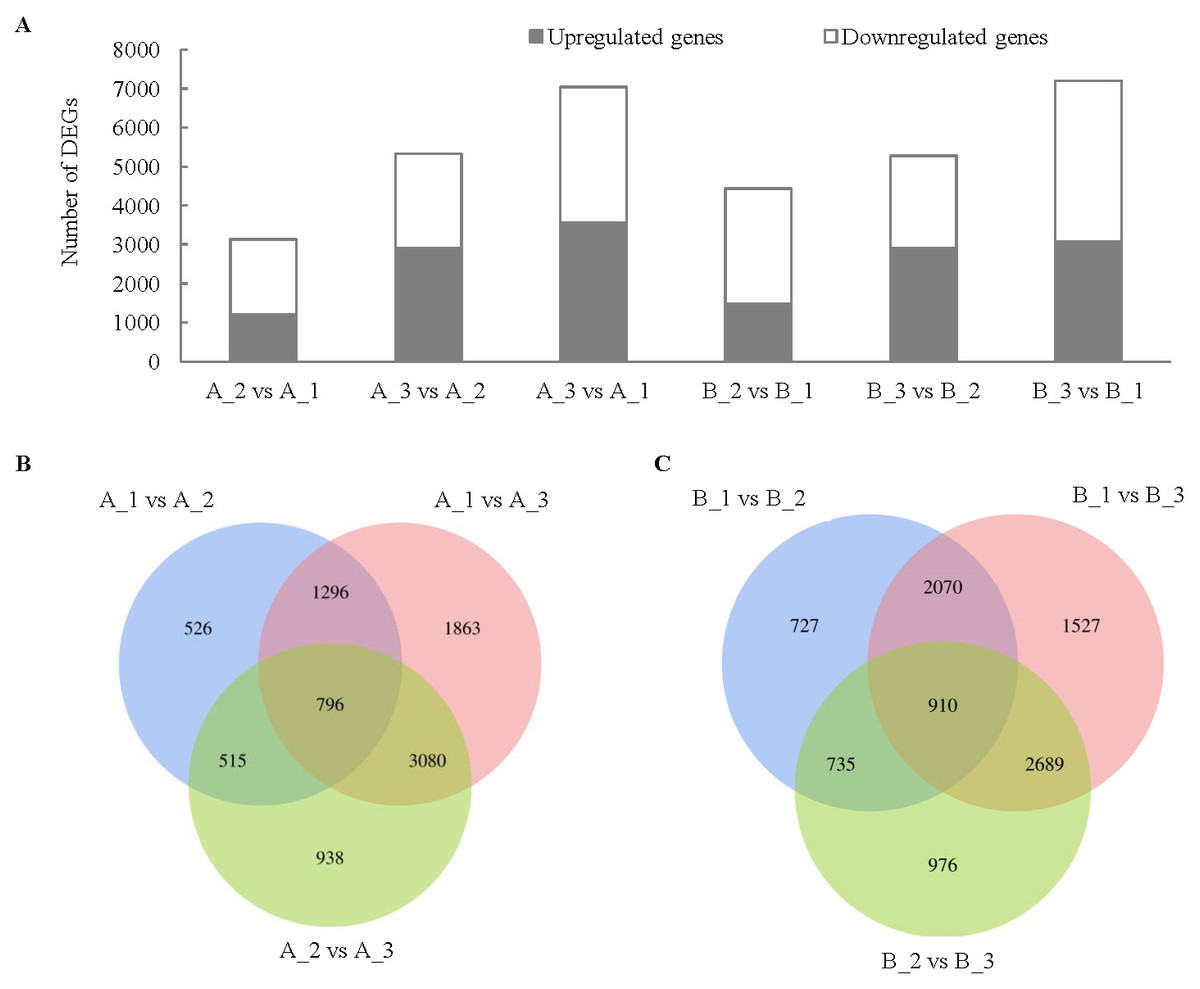
Figure 3: Comparison of up- and down-regulated DEGs in different tissues in the fruits of two cucumber varieties comparisons.
(A) The DEG in A1 compared to A2, A1 compared to A3, A2 compared to A3, B1 compared to B2, B1 compared to B3 and B2 compared to B3. (B) Venny analysis of differentially expressed miRNAs among the different tissues in H28 and B. A: H105, B: H28. A1: exocarp of ‘H105’, A2: mesocarp of ‘H105’, A3: endocarp of ‘H105’, B1: exocarp of ‘H28’, B2: mesocarp of ‘H28’, B3: endocarp of ‘H28’.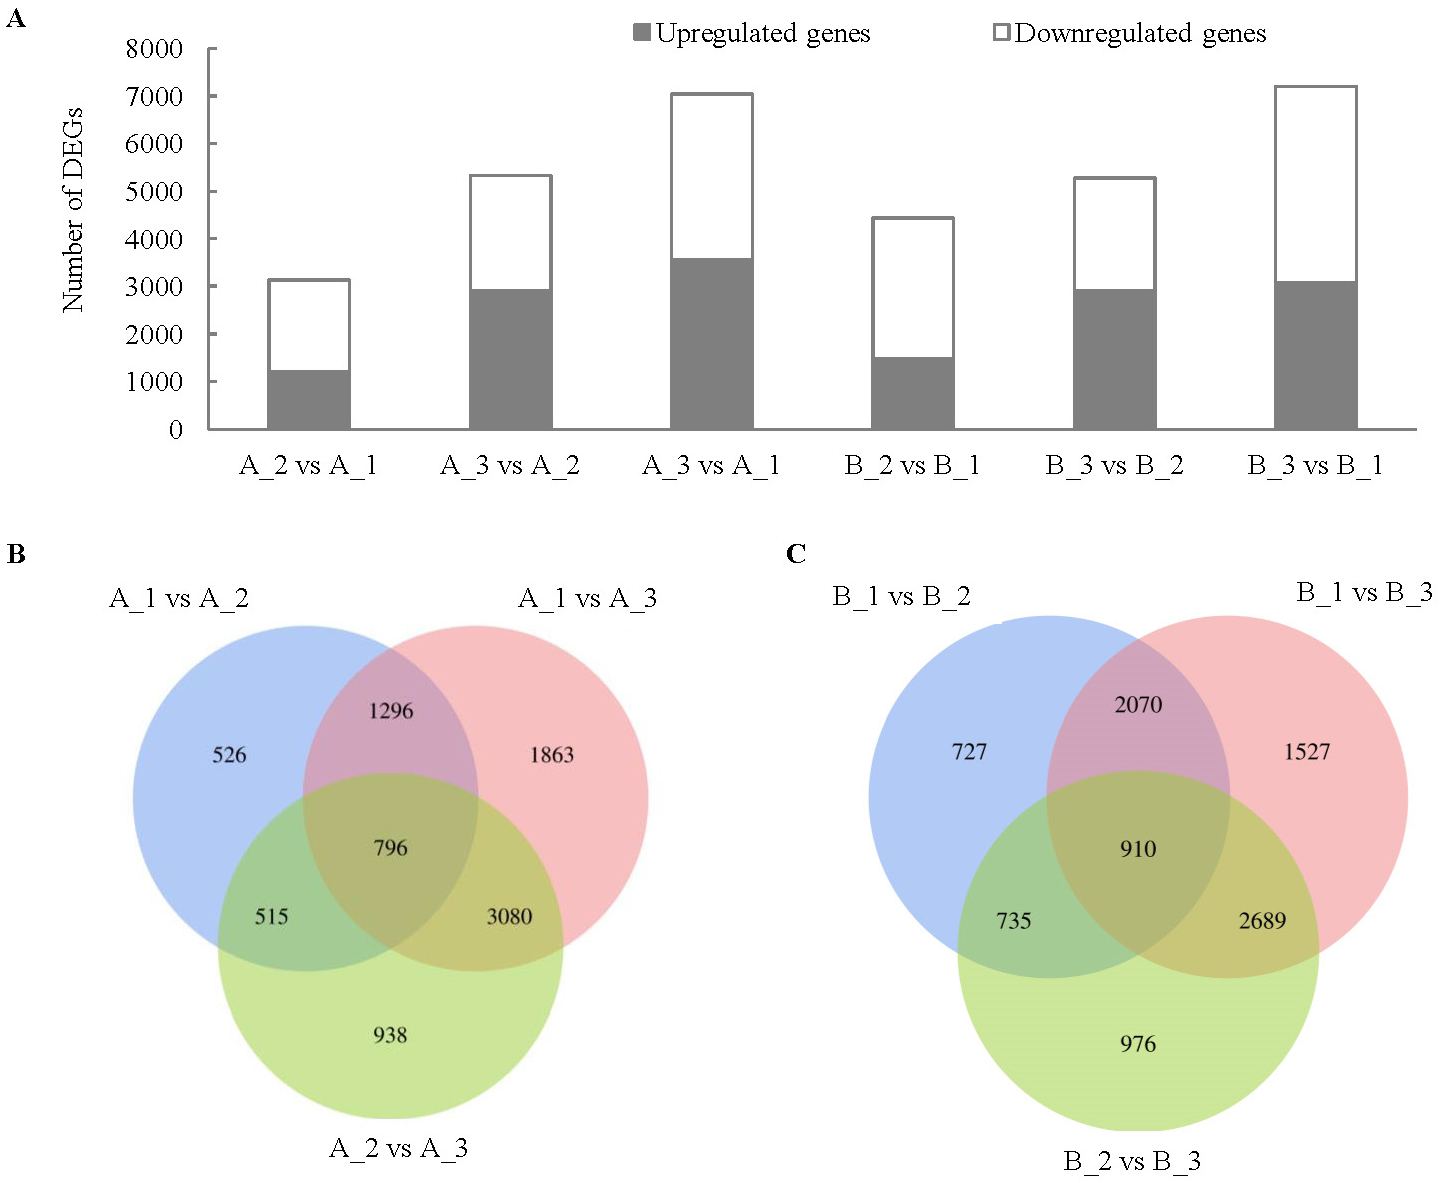
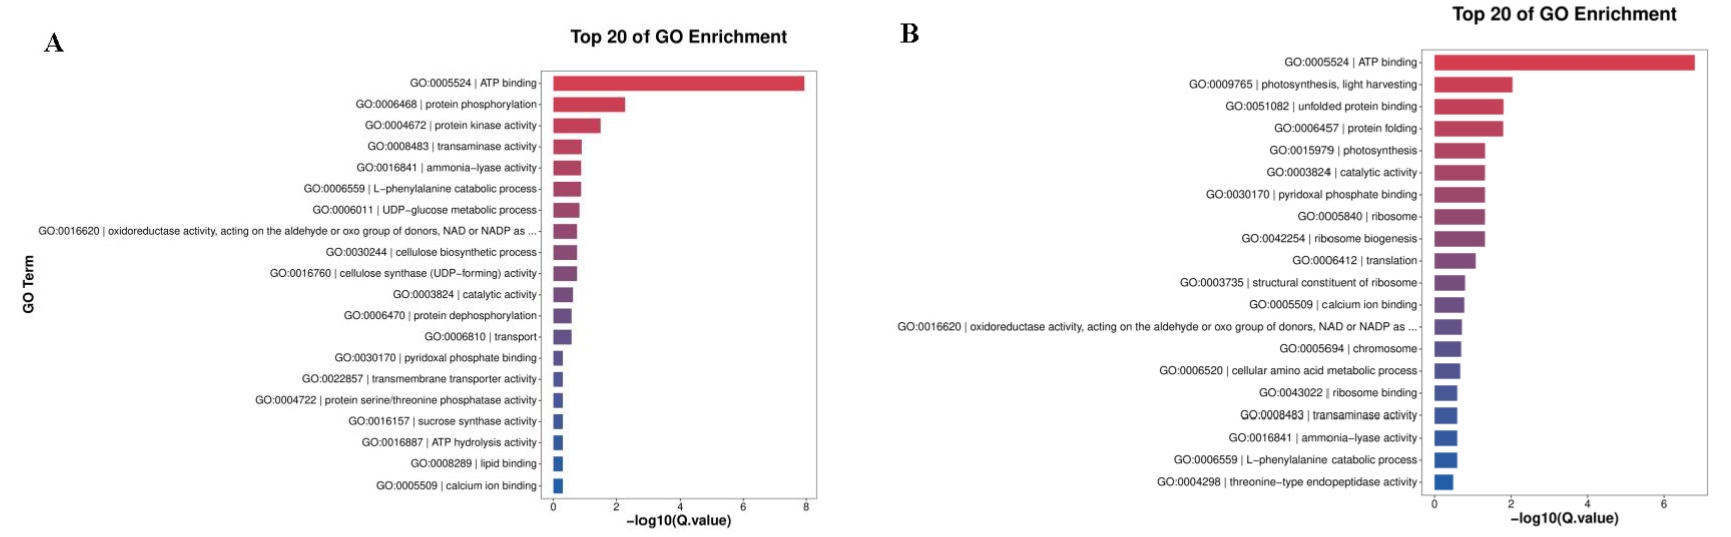
GO annotation and KEGG enrichment analysis of DEGs
To better understand the biological functions beyond the number of DEGs, GO terms were employed for annotation. GO terms meeting this condition with p < 0.05 were defined as significantly enriched GO terms in DEGs. Both up- and downregulated DEGs can be classified under biological process, cellular component, and molecular function (Table 1; Fig. 4; Fig. S1). Among the topmost GO terms, the prominent two terms for biological process for the three comparative groups are obsolete oxidation–reduction process and protein phosphorylation; molecular functions are protein binding and ATP binding whereas membrane and its parts comprised the two most prominent cellular component terms (Table 1; Fig. 4; Fig. S1).
| Parallels | All GOs | All DEGs | Down-regulated DEGs | Up-regulated DEGs |
|---|---|---|---|---|
| A_2 vs A_1 | 778 | 5,312 | 3,455 | 1,857 |
| A_3 vs A_2 | 1,130 | 8,730 | 3,783 | 4,947 |
| A_3 vs A_1 | 1,330 | 11,823 | 5,779 | 6,044 |
| B_2 vs B_1 | 1,107 | 7,606 | 5,386 | 2,220 |
| B_3 vs B_2 | 1,138 | 8,695 | 3,776 | 4,919 |
| B_3 vs B_1 | 1,387 | 12,141 | 7,137 | 5,004 |
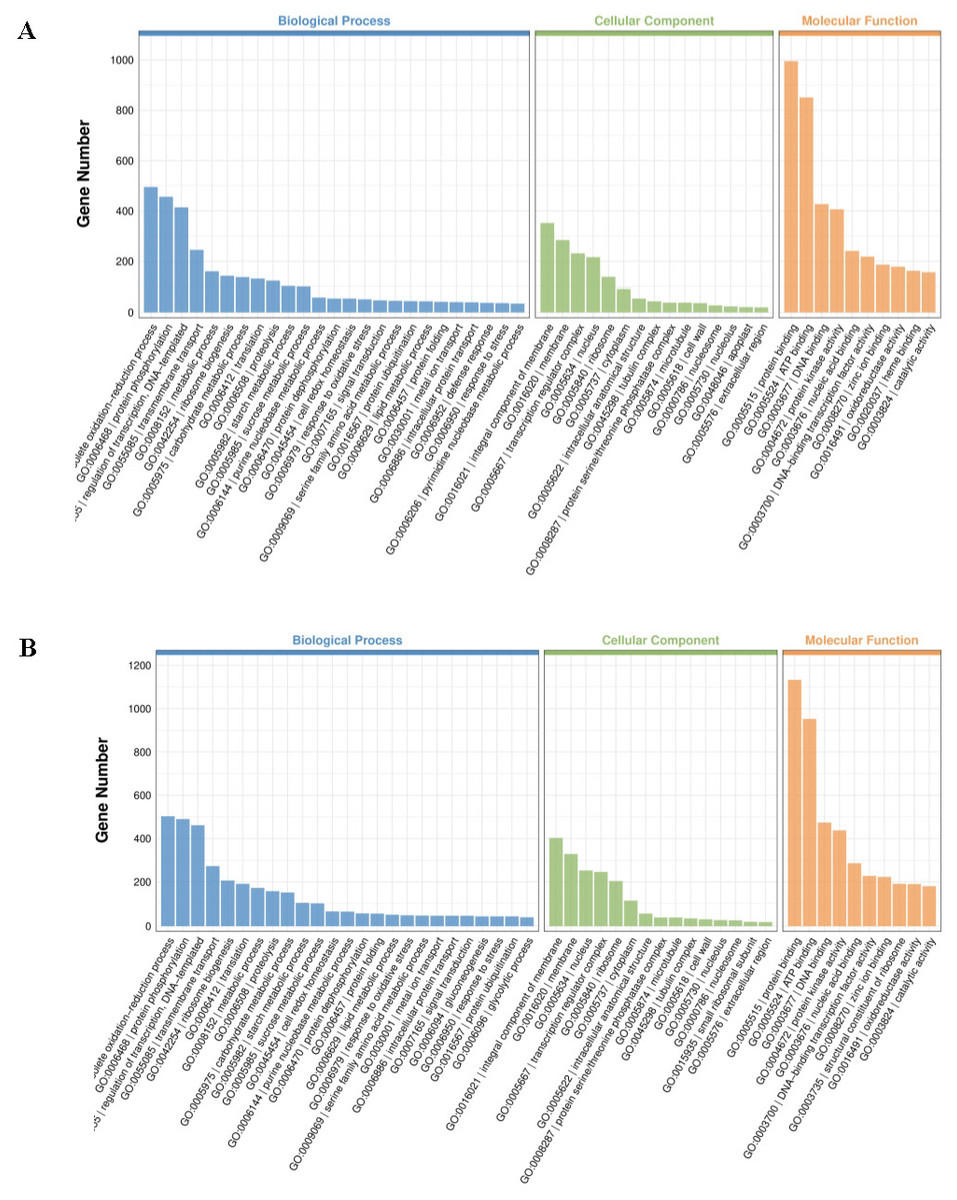
Figure 4: Significantly enriched GO terms in cultivars H105 (A) and H28 (B).
The GO terms of the most significantly enriched genes in their three GO categories: molecular function (MF), biological process, and cellular component.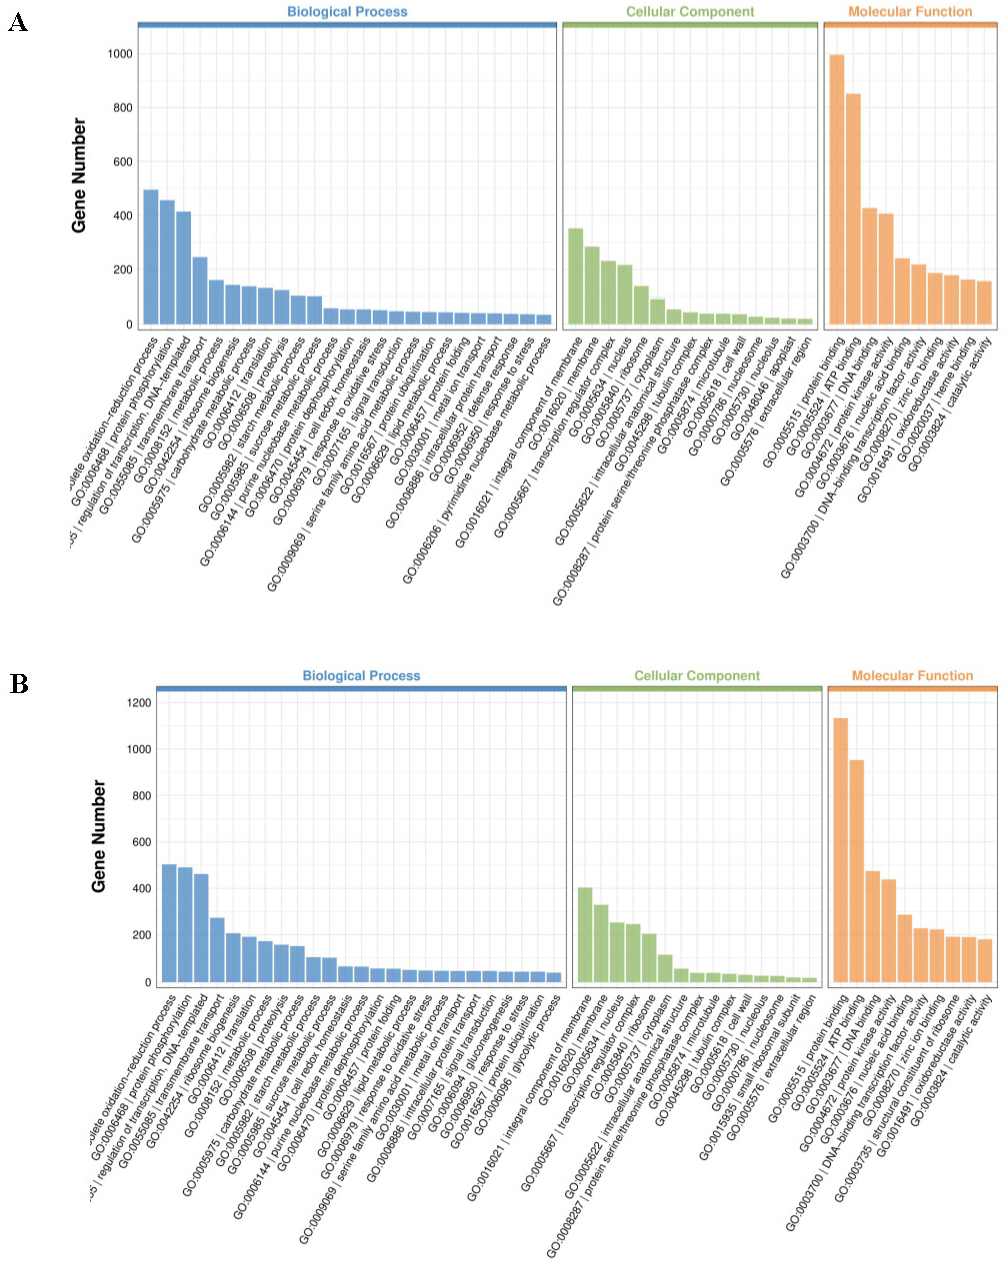
KEGG (Kyoto Encyclopedia of Genes and Genomes) provides a network of developmental pathway and can be used to study the gene expression of DEGs involved in the biological pathways (P-value <0.05 as a threshold). The top 20 most significantly enrichment pathways were selected and displayed in Table 2 and Fig. 5. The significantly enriched pathways for up- and down-regulated DEGs included biosynthesis of secondary metabolites and metabolic pathways.
| Parallels | Pathways | All DEGs | Down-regulated DEGs | Up-regulated DEGs |
|---|---|---|---|---|
| A_2 vs A_1 | 130 | 1,522 | 1,031 | 491 |
| A_3 vs A_2 | 131 | 2,556 | 1,022 | 1,534 |
| A_3 vs A_1 | 134 | 3,480 | 1,640 | 1,840 |
| B_2 vs B_1 | 132 | 2,328 | 1,659 | 669 |
| B_3 vs B_2 | 134 | 2,564 | 1,039 | 1,525 |
| B_3 vs B_1 | 135 | 3,573 | 2,051 | 1,522 |
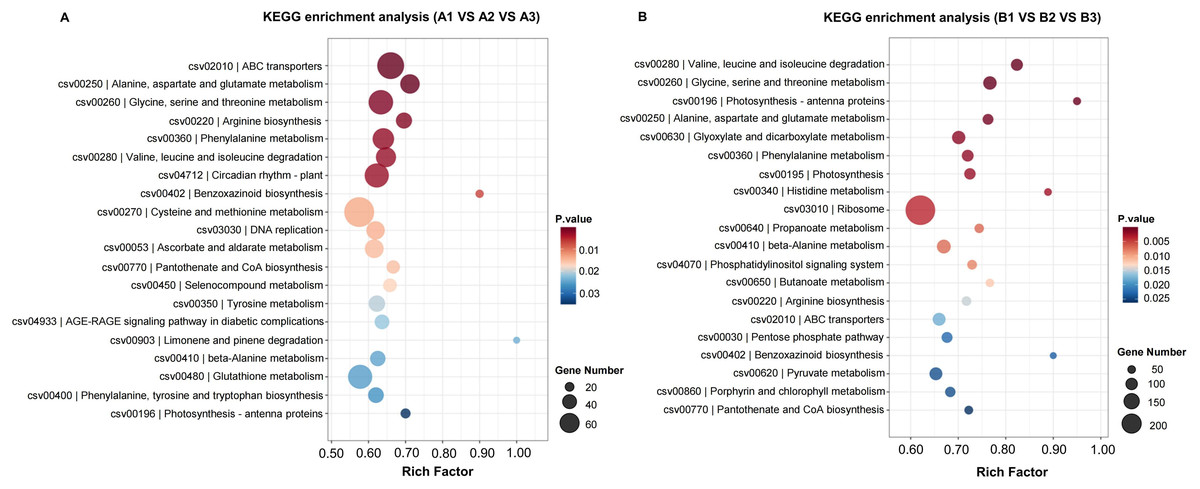
Figure 5: The KEGG enrichment classification of DEGs in H105 (A) and H28 (B).
The specific pathways are plotted along the y-axis, and the x-axis indicates the rich factor. The size of the colored dots indicates the number of significantly differentially expressed genes associated with each corresponding pathway: pathways with larger-sized dots contain a higher number of genes. The color of each dot indicates the corrected P adjusted for the corresponding pathway.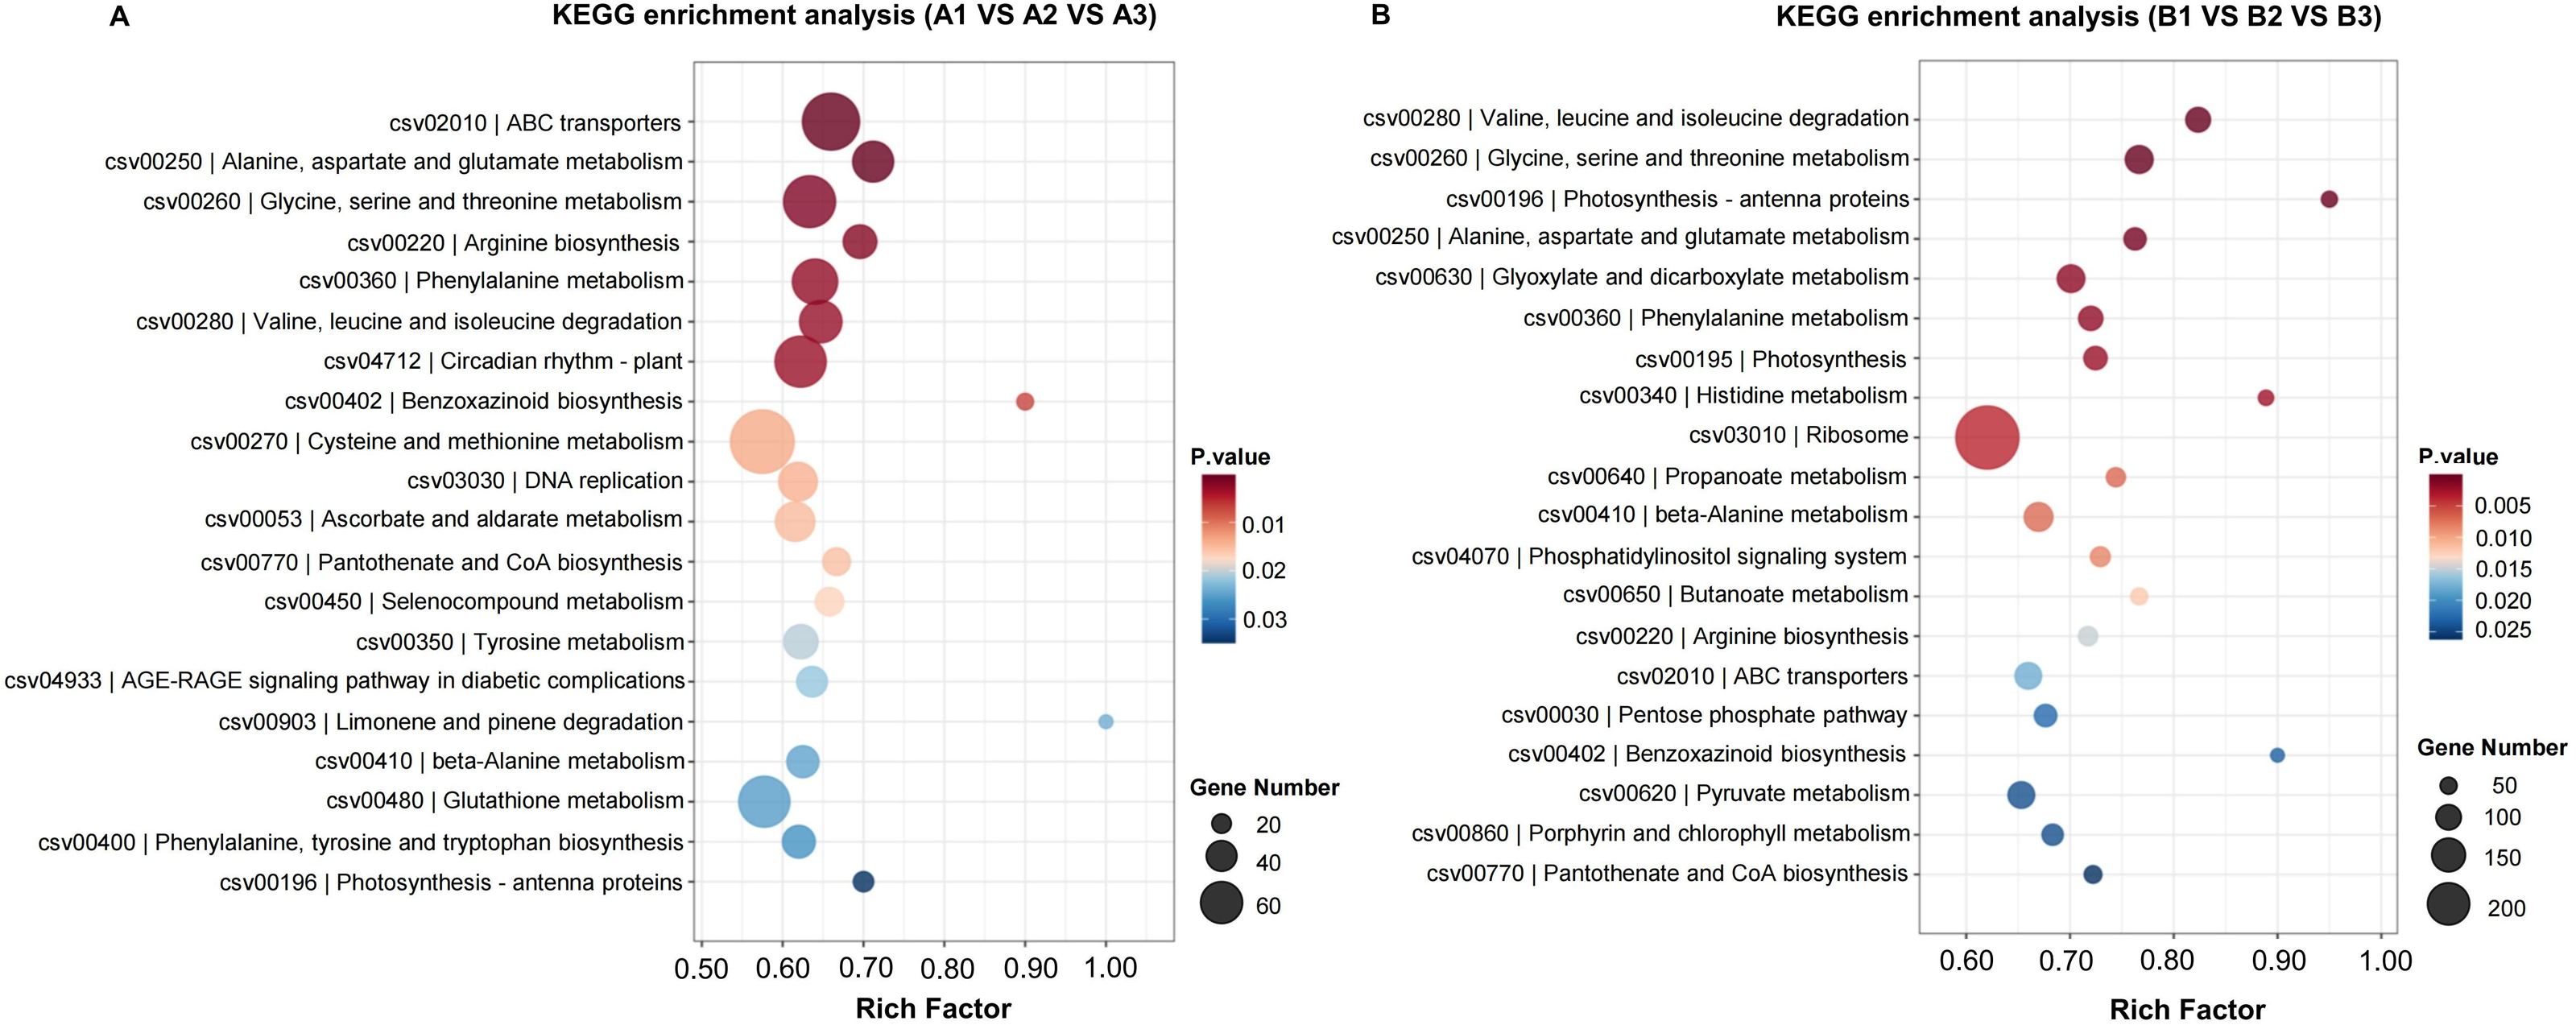
Common DEGs involved in AsA metabolism between two cultivars
Multiple genes involved in the biosynthesis and recycling pathways of AsA were identified through screening all DEGs. Among them, there were 34 DEGs were common across all three tissues of both cultivars (Tables S6, S7; Fig. 6). These included five ascorbate oxidase (AO), four ascorbate peroxidase (APX), one monodehydroascorbate reductase (MDHAR), one dehydroascorbate reductase (DHAR), three myo-inositol oxygenase (MIOX), one UDP-sugar pyrophosphorylase (USPase), three UDP-glucuronosyltransferases (UGTs), one aldo-keto reductase (AKRs), three UDP-glucose 6-dehydrogenase (UGDH), four UDP-glucuronate 4-epimerase (GAE), one Mannose-6-phosphate isomerase (PMI), one phosphomannomutase (PMM), one GDP-D-mannose 3′,5′-epimerase (GME), one GDP-L-galactose-phosphorylase (GGP) and two L-galactose 1-phosphate phosphatase (GPP). These DEGs were primarily associated with the L-Galactose, D-Galacturonate, Myo-inositol and ascorbate recycling pathway (Fig. 6). There are five expression patterns among them, and most genes in the two cultivars had the same expression pattern. For example, PMI and GME transcripts were highest in the exocarp, and lowest in the endocarp. In these two cultivars, the expression patterns of PMM (CsaV3_5G014110), GME (CsaV3_2G004170) and DHAR (CsaV3_5G006680) are positively correlated with the AsA content. Thus, these three genes is considered to be key candidate genes.
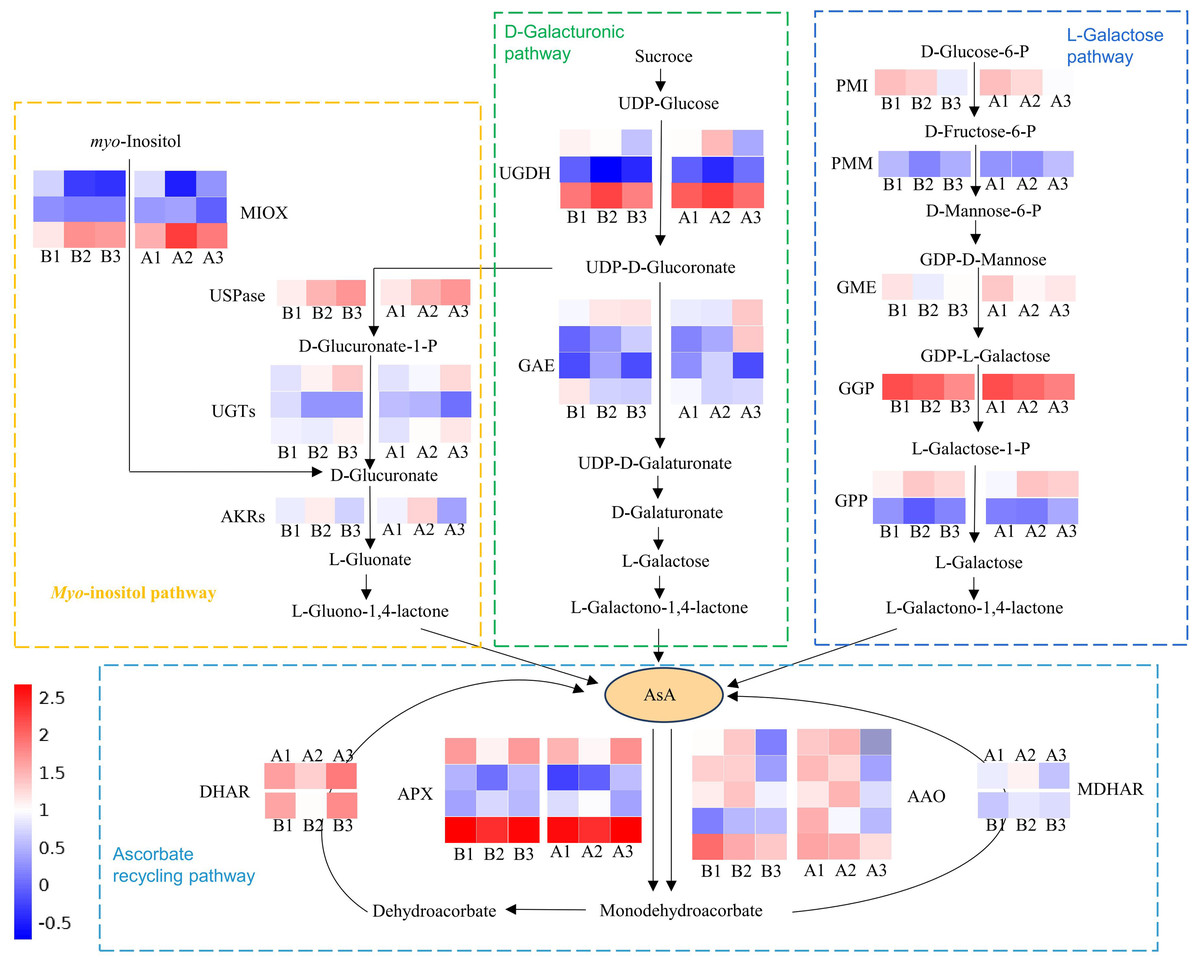
Figure 6: Schematic illustration depicting the pathway analysis of DEGs associated with AsA metabolism in different tissues of the exocarp (1), mesocarp (2), and endocarp (3) in the two cultivars of cucumber, including ‘H105’and ‘H28’.
The heatmap shows log2(FC) , with red indicating higher expression and blue indicating lower expression, as indicated in the scale bar on the right. PMI, D-mannose-6-phosphate isomerase; PMM, phosphomannomutase; GME, GDP-mannose-30, 50-epimerase; 5, GGP, GDP-L-galactose phosphorylase; GPP, L-galactose-1- phosphate phosphatase; APX, ascorbate peroxidase; AAO, ascorbate oxidase; MDHAR, monodehydroascorbate reductase; DHAR, dehydroascorbate reductase; GR, glutathione reductase; GAE, UDPglucuronate 4-epimerase; UGDH, UDP-glucose 6-dehydrogenase; AKR, aldo-keto reductase; MIOX, inositol oxygenase; USPase, UDP-sugar pyrophosphorylase.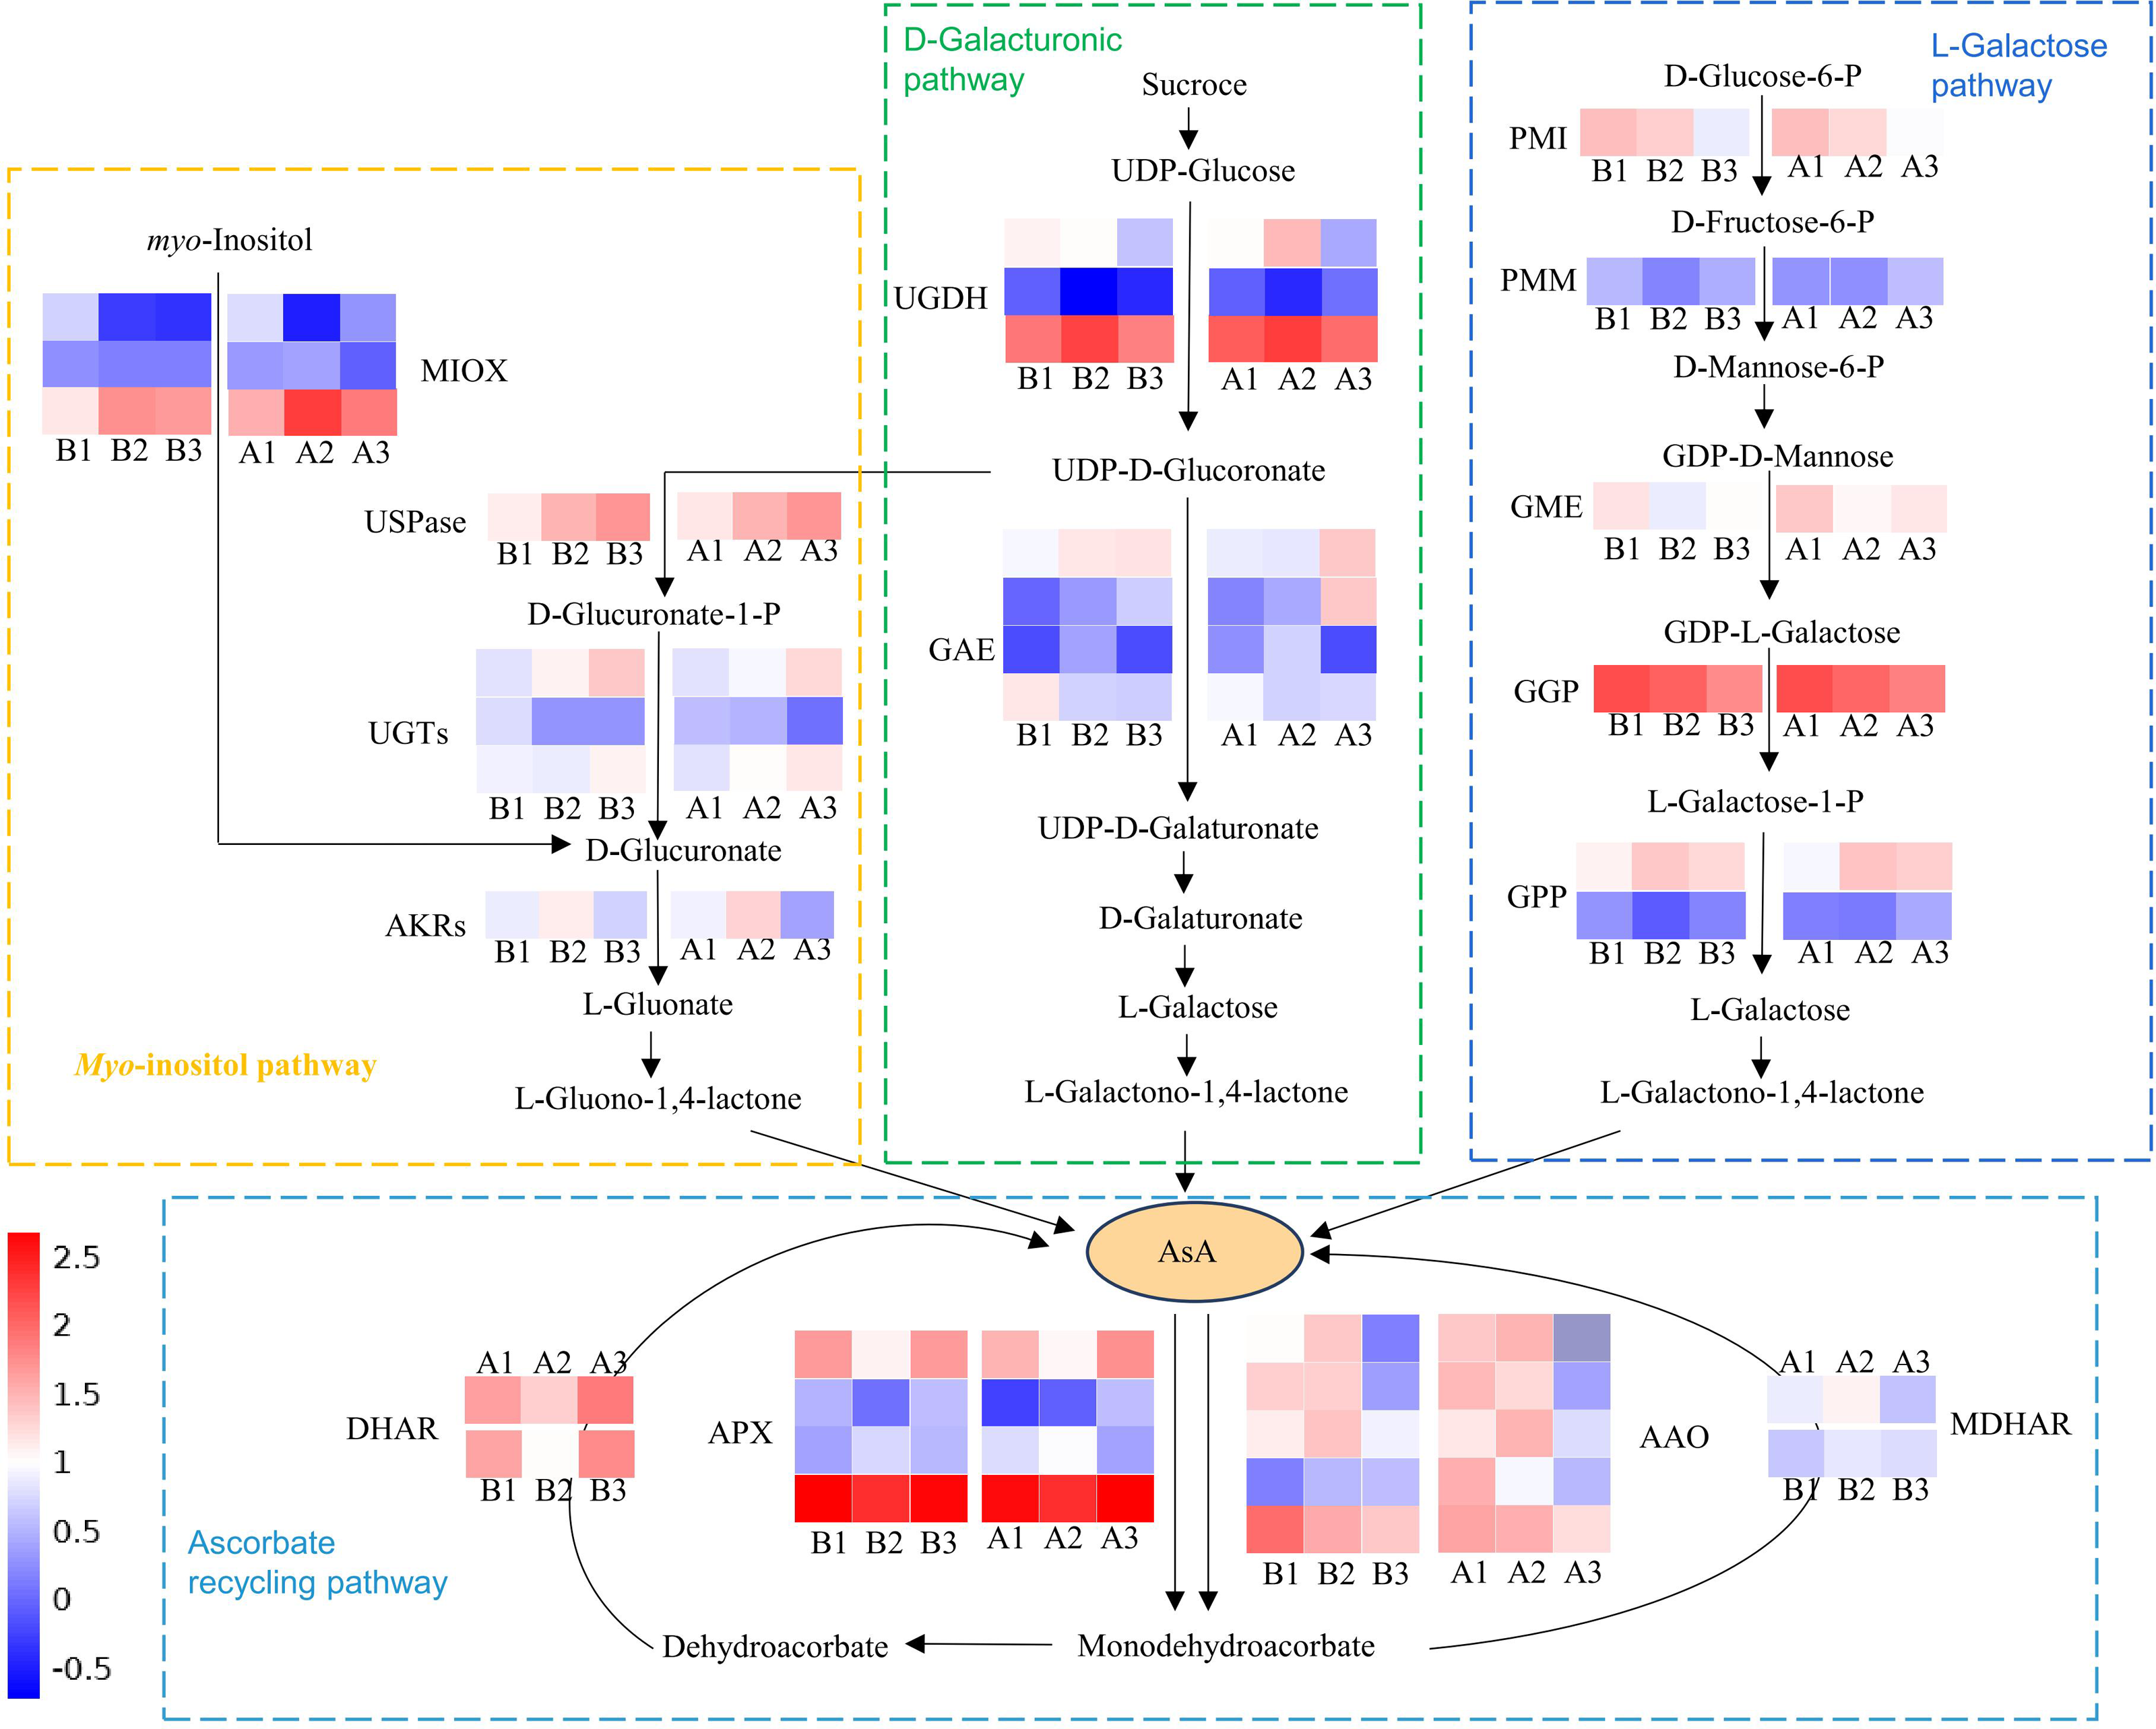
Key transcription factors in the regulation of AsA synthesis
Transcription factors are major proteins that control key biological processes such as metabolism, growth, and responses to biotic and abiotic stresses (Czechowski et al., 2004; Lloyd et al., 2017). Some studies showed AsA biosynthesis in plants is also regulated by plant hormones (Chen et al., 2023; Xu et al., 2023). Therefore, we analyzed the transcription factors (TFs) predicted from ‘plant hormone signal transduction’ pathway. We identified 29 TFs related to AsA in the transcriptomes between three different tissues of both two cultivars, including ethylene-responsive transcription factor (ERF) (nine), MYB (two), basic-helix-Loop-helix class (bHLH, eight), MAPK (six), auxin response factor (ARF, three), ETHYLENE-INSENSITIVE 3/ETHYLENE-INSENSITIVE (EIN, one) (Tables S6, S7; Figs. 7 and 8). The correlation coefficients between TFs and AsA related genes are shown in Fig. 8. In both two cultivars, CsaV3_4G028360 (ERF) was negatively correlated with PMM and GME, and positively correlated with DHAR. CsaV3_6G042110 (ERF) was positively correlated with PMM and GME, and negatively correlated with DHAR. CsaV3_6G032360 (MAPK) as positively correlated with PMM, GME and DHAR.
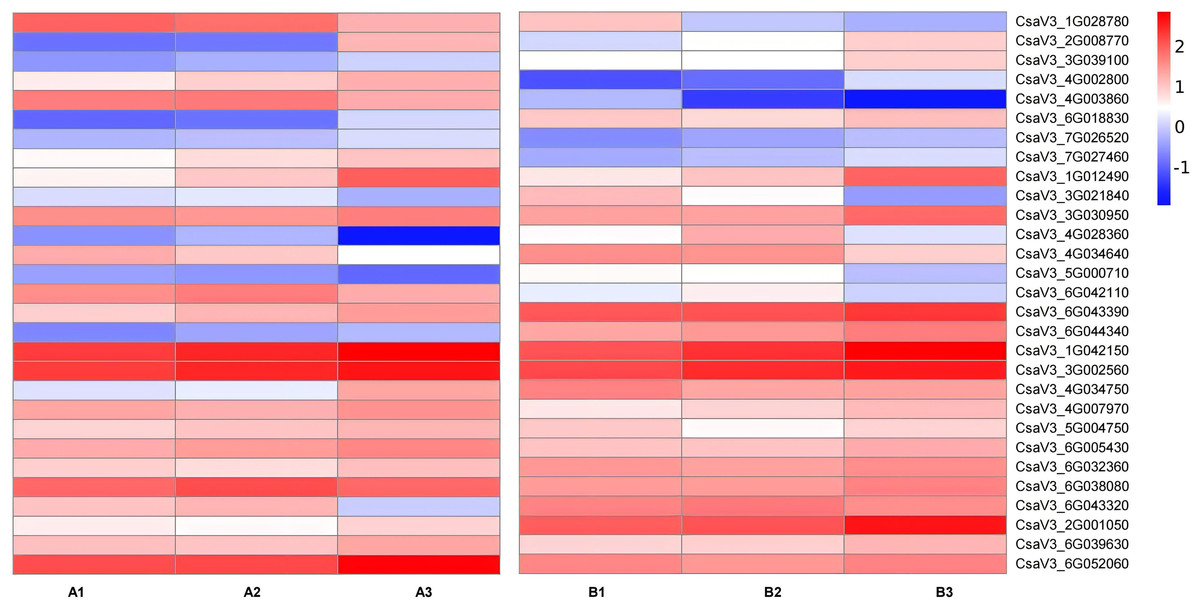
Figure 7: Expression patterns of TFs transcription factors involved in the regulation of anthocyanin synthesis.
The value of log2[fold change (FC)] is represented using the depth of color, with blue representing downregulation and red representing upregulation. The progression of the color scale from blue to red represents an increase in the FPKM values.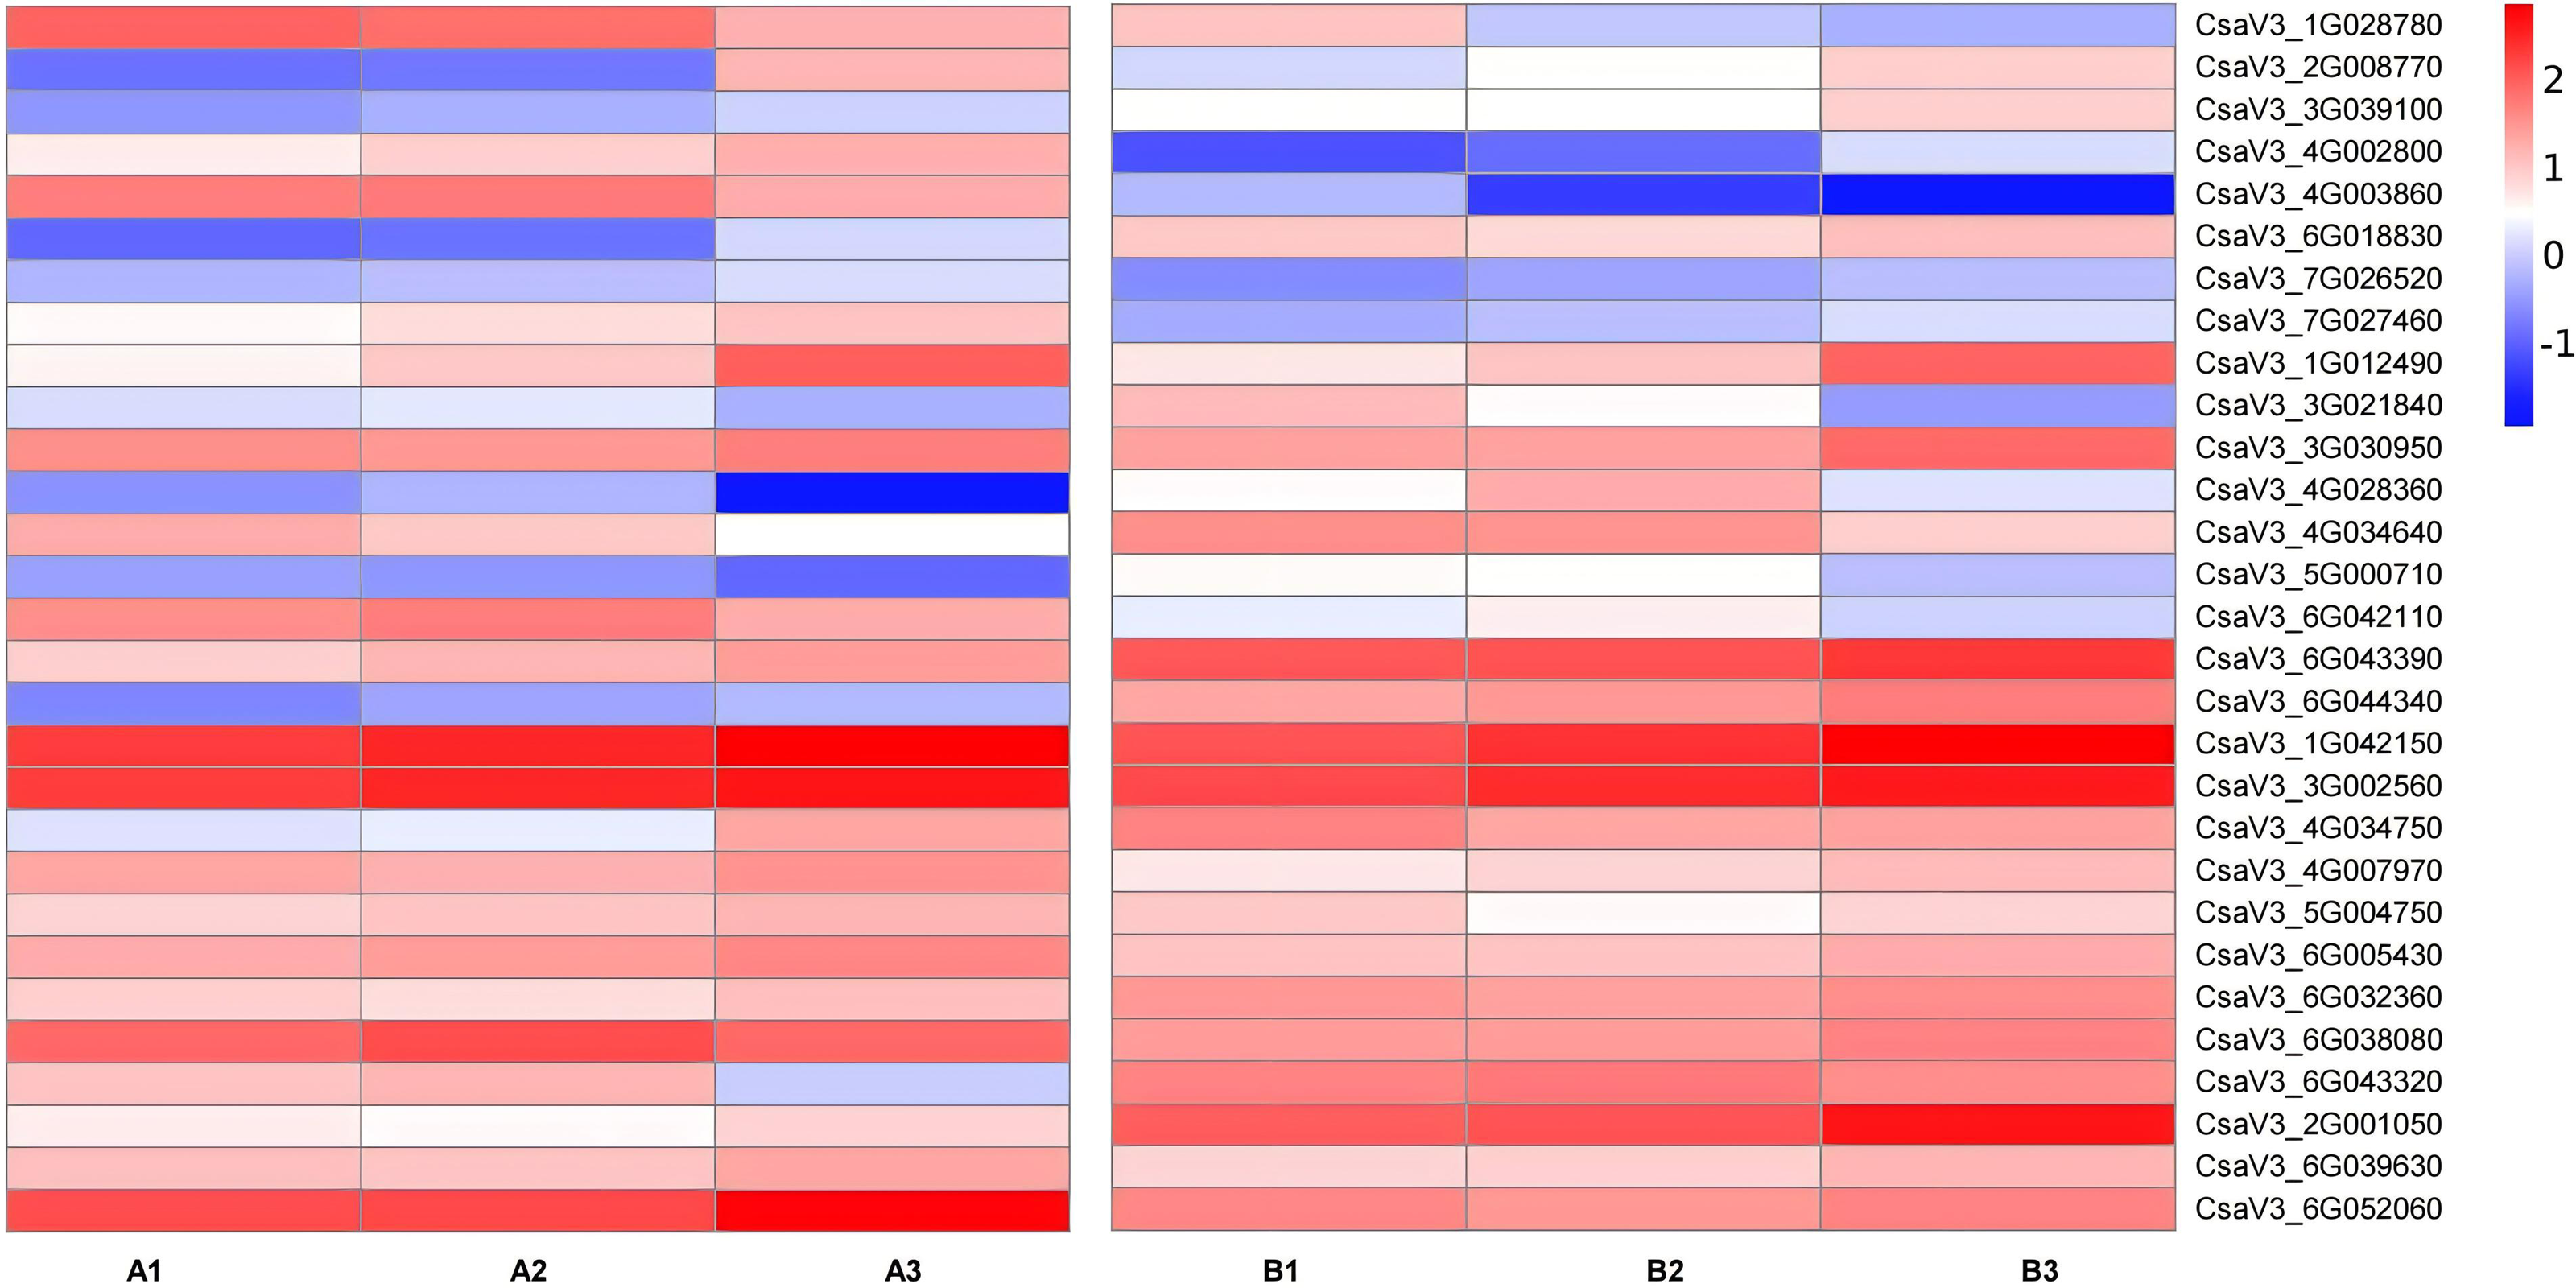
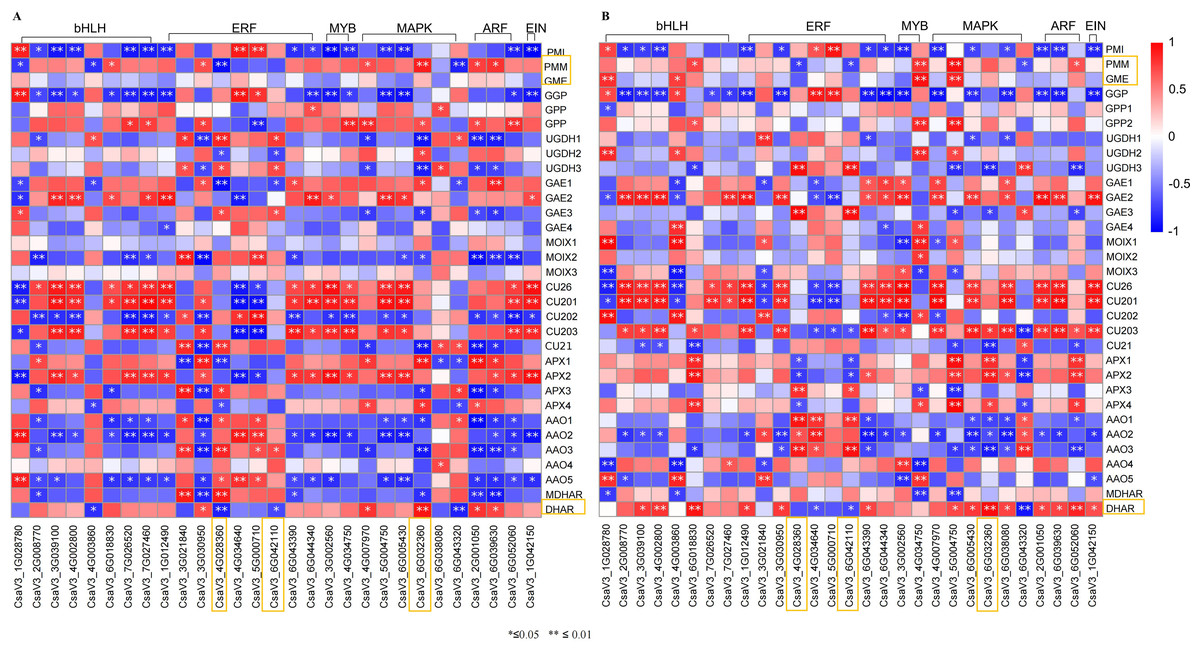
Figure 8: Correlation analysis between transcription factors and DEGs related to AsA metabolism in H105 (A) and H28 (B).
Positive correlations are denoted in red, while negative correlations are denoted in blue.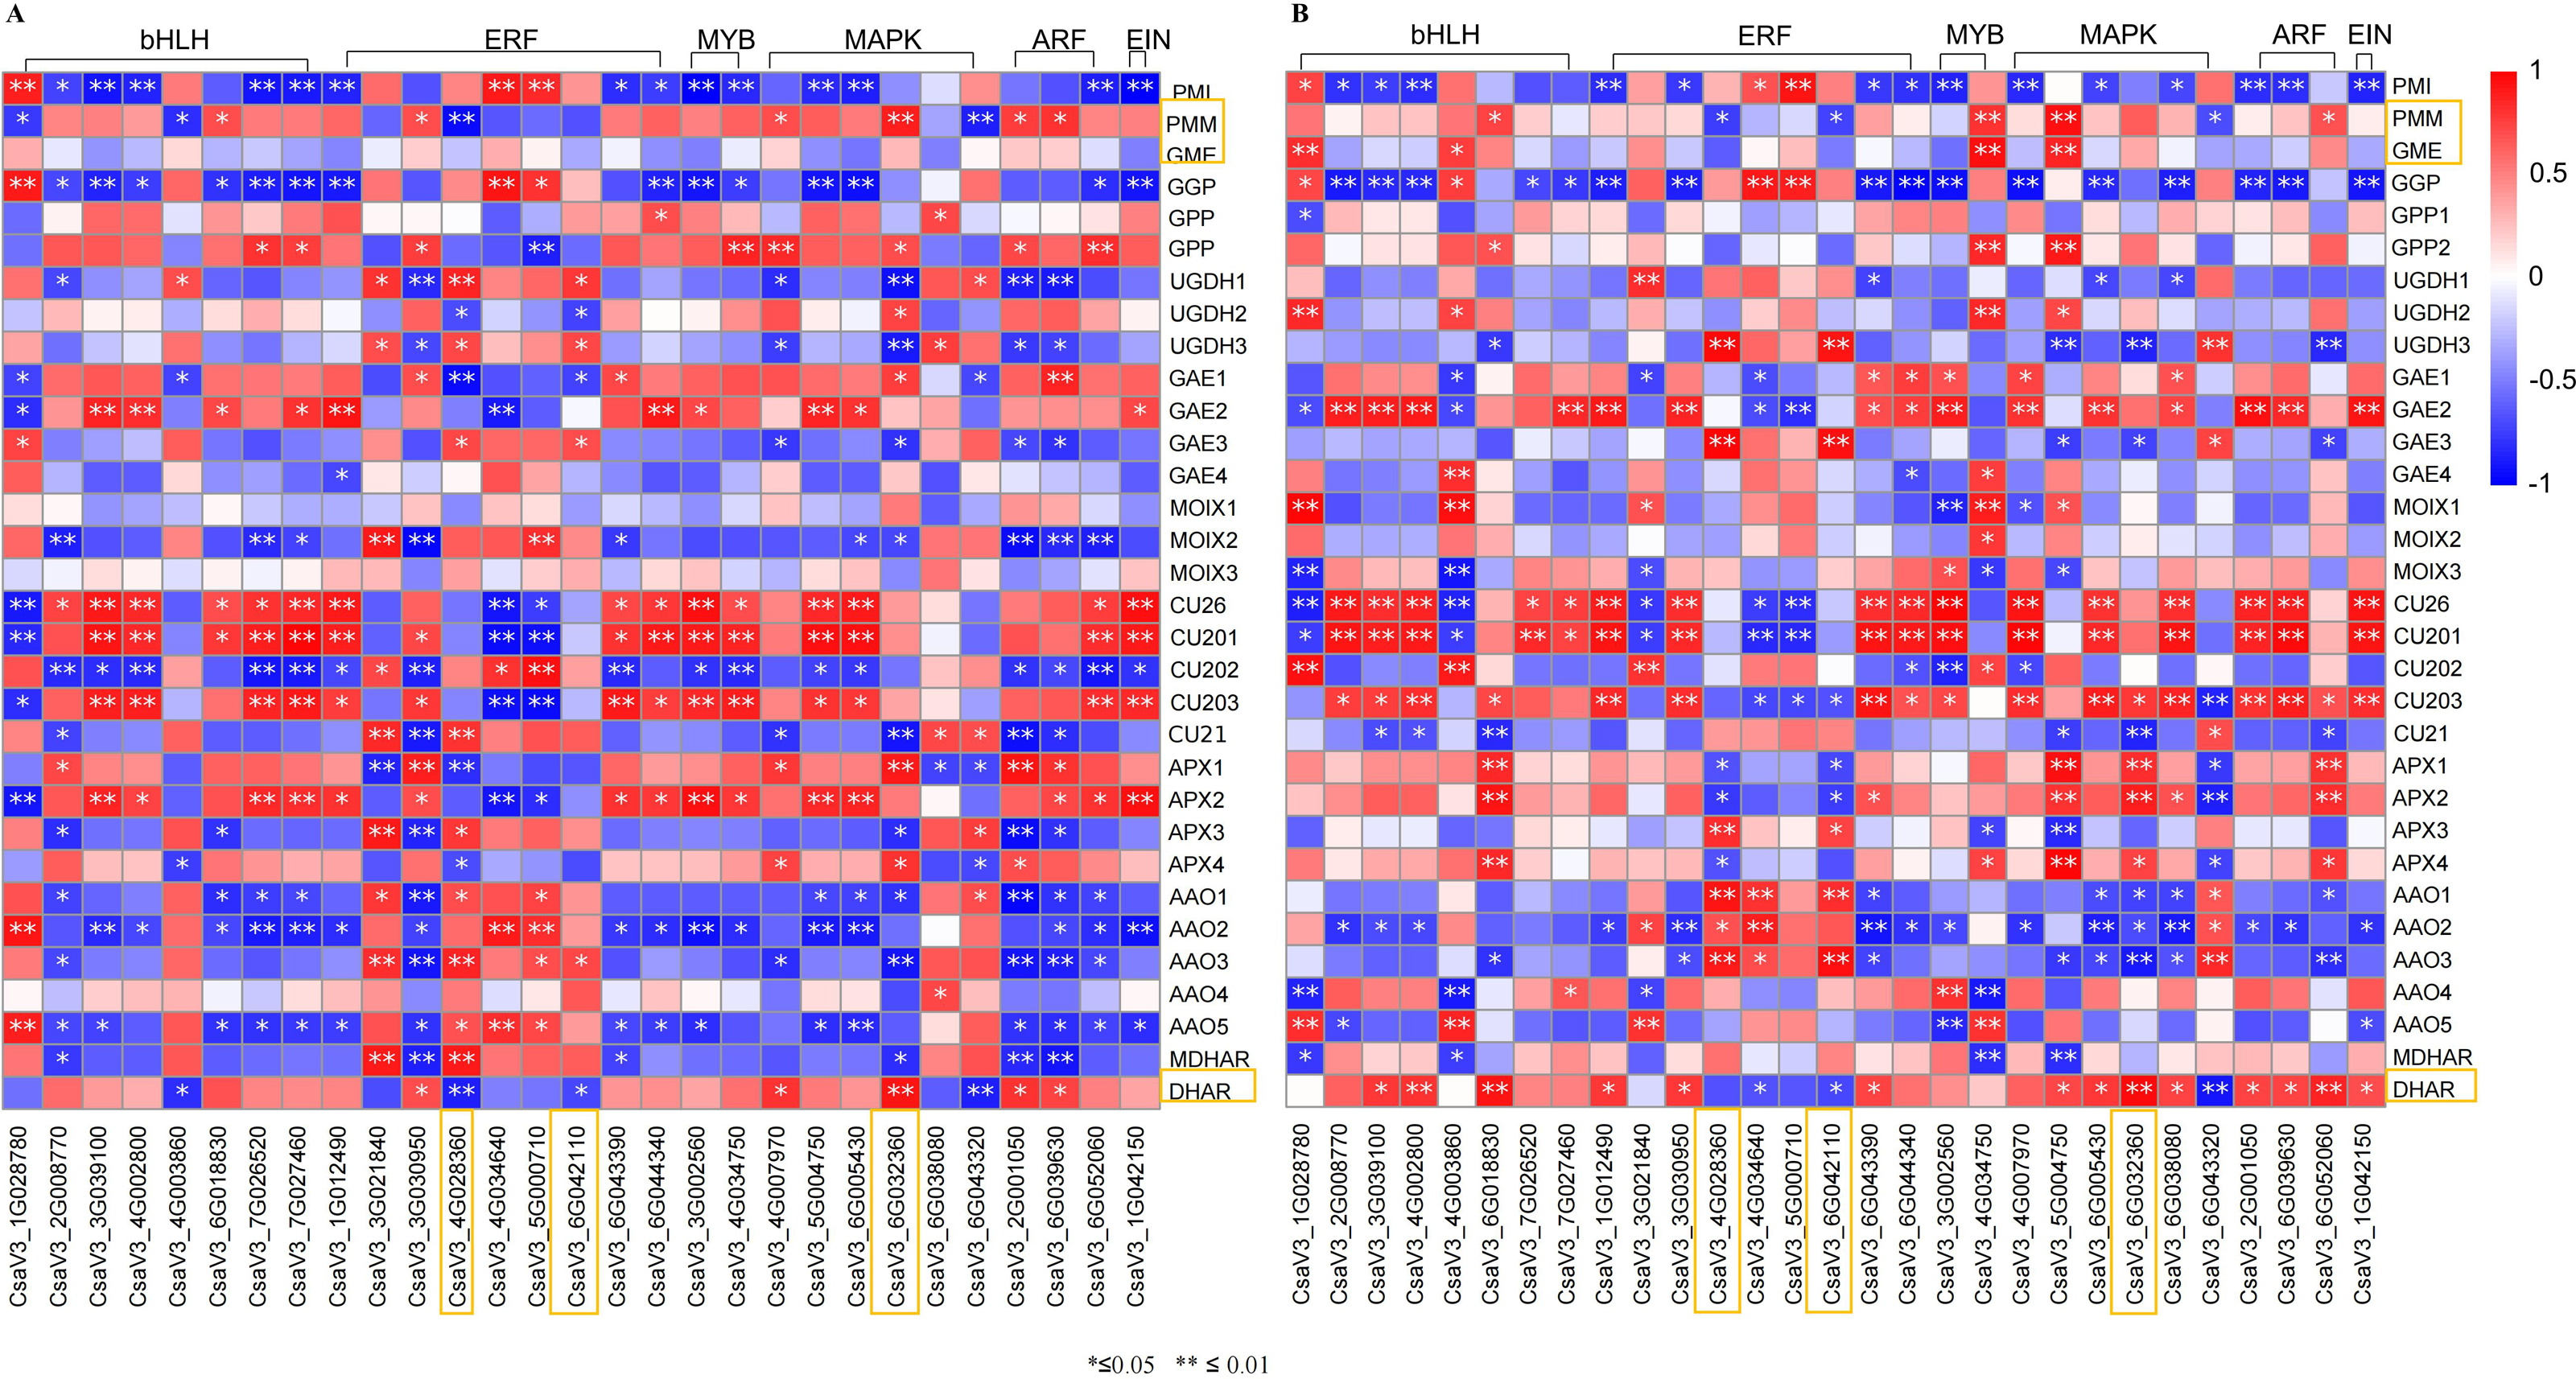
Analysis of transcriptome data reliability using qRT-PCR
To validate the reliability of DEGs obtained from RNA-seq analyses, the expression levels of 12 randomly selected DEGs related to metabolic pathways and antioxidant activity were measured via qRT-PCR. The expression patterns of theses genes obtained from RNA-Seq and qRT-PCR were basically consistent with each other (Fig. 9). All these data indicated that the RNA-Seq results were of high quality, stable and reliable.
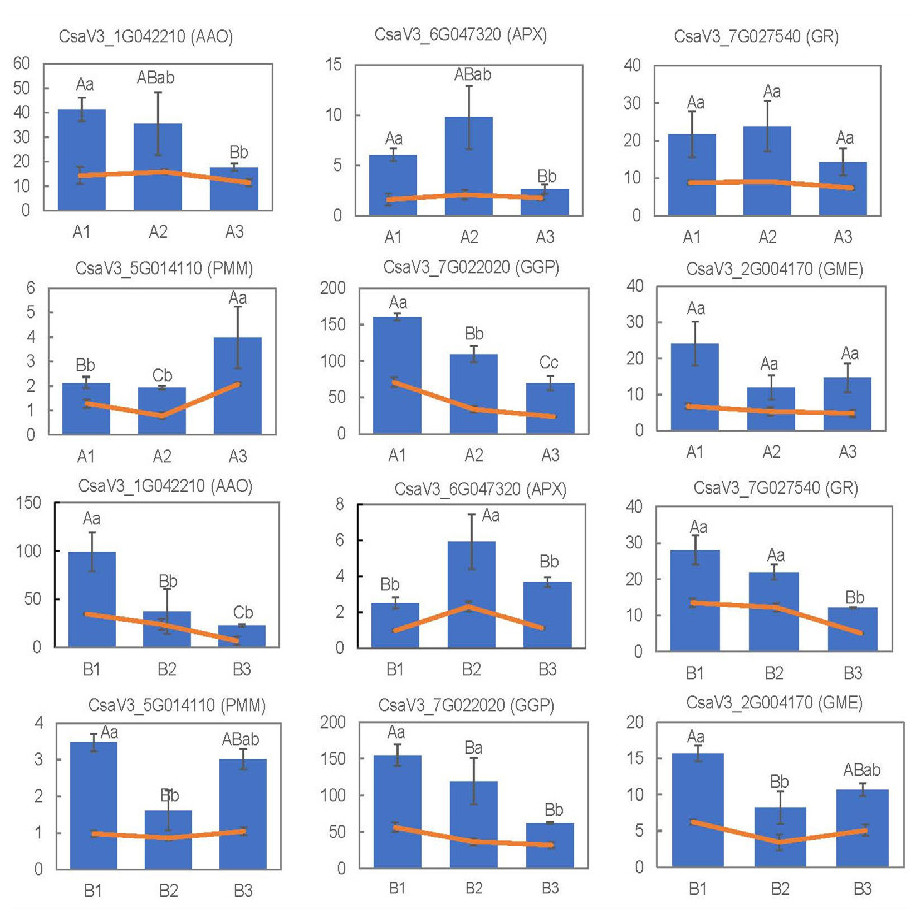
Figure 9: RNA-seq results using the FPKM values and gene expression levels, measured via qRT-PCR, for the 15 selected DEGs.
The capital letters represent the differences in qRT-PCR results among the groups, and the lowercase letters represent the differences in RNA-seq data using the FPKM values.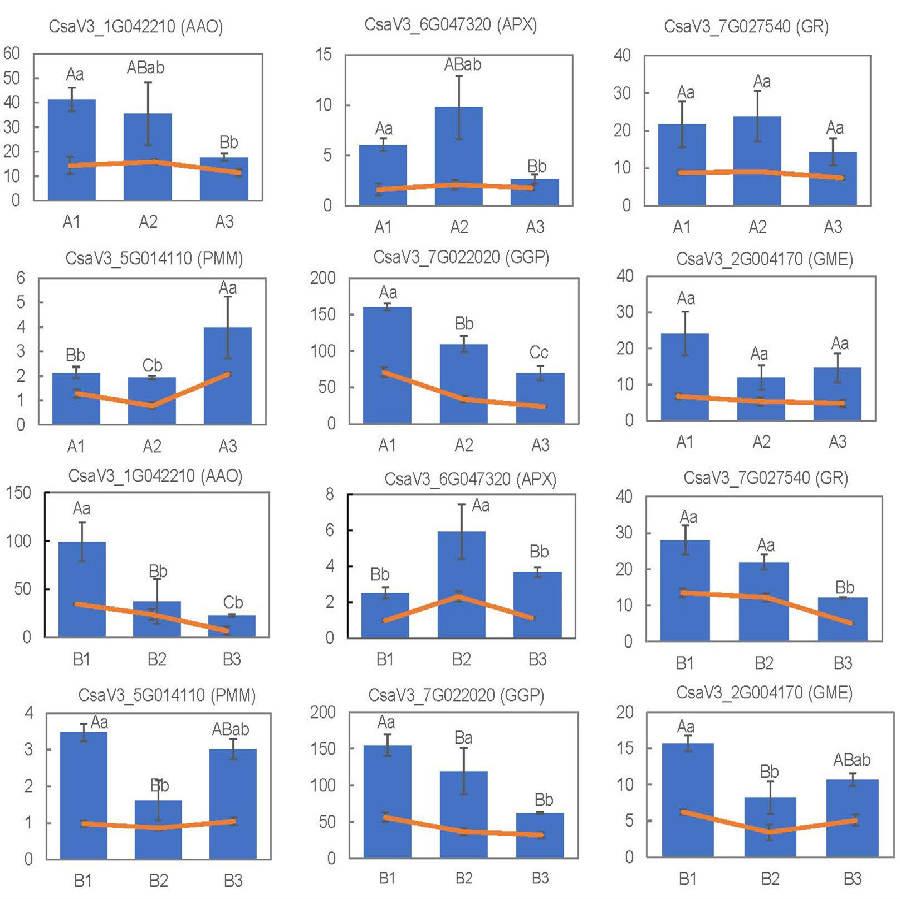
Discussion
Cucumber is one of the most economically important vegetable crops, widely cultivated for its edible fruit. AsA content is an important quality indicator for cucumber. Research shows that AsA contents vary greatly among the cultivars. In this study, we found that AsA contents were spatially distributed in two genotypes. For both cultivars, the distribution pattern of AsA in different parts of the fruit was consistent (Fig. 1). T-AsA and AsA contents in the mesocarp were lower than those in the exocarp and endocarp (Fig. 1). This the distribution pattern would help to understand the regulatory mechanism of AsA in cucumber.
Transcriptome refers to the complete set of transcripts in a cell, specific to a particular physiological condition or developmental stage (Wang, Gerstein & Snyder, 2009; Tan et al., 2024). It has become a powerful tool for identifying DEGs and potential molecular mechanisms (Yang et al., 2019; Chen et al., 2021; CNCB-NGDC Partners and Members, 2023; Tan et al., 2024). Many studies have shown that AsA content is strongly influenced by environmental conditions, such as light and temperature, and by growing conditions and water availability (Bartoli et al., 2009; Broad et al., 2020; Chen et al., 2023). The AsA content of a plant is also tightly controlled by its biosynthesis, catabolism, reductive recovery from the oxidized form, and transport (Muñoz et al., 2023; Xu et al., 2022; Xu et al., 2023). To uncover the molecular mechanisms by which AsA accumulates in cucumber fruits, we used transcriptome of three tissues (exocarp, mesocarp, and endocarp) of two cucumber varieties (H28, H105) to identify structural genes and transcription factors, which play vital roles in regulating AsA biosynthesis. A total of 34 DEGs involved in AsA metabolism were common across all three tissues of both cultivars (Fig. 6).
To further narrow down the list of candidate genes, we analyzed and selected genes related to their synthesis that were consistent with the AsA content pattern in both two varieties, and genes related to their metabolism that were opposite to the AsA content pattern. By focusing on this stage, we found that the expression patterns of PMM, GME and DHAR are positively correlated with the AsA content in these two cultivars (Fig. 6). In AsA synthesis, PMM catalyzes the interconversion of mannose-6-phosphate to mannose-1-phosphate. In Nicotiana benthamiana, reducing PMM expression caused a substantial decrease in AsA content; conversely, raising the PMM expression level led to a 20–50% increase in AsA content (Qian et al., 2007; Badejo et al., 2012). GME is a key enzyme in the AsA synthesis pathway, which catalyzes the conversion of GDP-D-mannose to GDP-l-galactose. GME is the most conserved protein in AsA biosynthesis pathway, and its function has been demonstrated in many higher plants (Wolucka & Van Montagu, 2007; Beerens, Gevaert & Desmet, 2022). Numerous studies have shown that GME expression levels are positively correlated with the AsA content. Overexprssion of GME enhanced AsA accumulation in tomato, tobacco and Arabidopsis thaliana (Arabidopsis) (Zhang et al., 2011; Imai et al., 2012; Ma et al., 2014). Meanwhile, the AsA content is decreased significantly in GME-silenced tomato (Gilbert et al., 2009; Voxeur et al., 2011). DHAR is a key enzyme involved in the recycling of AsA, which catalyses the glutathione (GSH)-dependent reduction of oxidized ascorbate (dehydroascorbate, DHA). Previous studies have shown that overexpression of DHAR can increased amounts of AsA in rice (Yin et al., 2010; Do et al., 2016). Thus, these three genes are considered to be key candidate genes.
In recent years, an increasing number of studies indicated that AsA biosynthesis in plants is regulated by plant hormones (Chen et al., 2023; Xu et al., 2023). ERF98, a member of the AP2/ERF transcription factor family, can modulates AsA accumulation by positively regulates the transcription of the AsA biosynthetic gene GMP in Arabidopsis (Zhang et al., 2012). The tomato C2H2-type zinc finger protein ZF3 interacts with CSN5B and inhibits the ubiquitination-dependent degradation of GMP by CSN5B. Increased expression of the tomato ZF3 gene increased the AsA concentration and enhanced tolerance to salt stress (Wang et al., 2013; Li et al., 2018). The PbrMYB5 protein from birchleaf pear (Pyrus betulifolia) is an R2R3-type MYB transcription factor that modulates AsA biosynthesis by transcriptionally regulating PbrDHAR2 expression. The exogenous expression of PbrMYB5 in Nicotiana benthamiana increased the AsA concentration and enhanced tolerance to cold stress (Xing et al., 2019). bHLH55, a basic helix–loop–helix 55 transcription factor (TF), modulates AsA biosynthesis by transcriptionally regulating ZmGMP1 and ZmGGP, ZmPGI2, and ZmGME1 in maize (Yu et al., 2021). Xu et al. (2022) showed that auxin and ABA antagonistically regulated AsA accumulation via SlMAPK8–SlARF4–SlMYB11 module in tomato. ETHYLENE-INSENSITIVE 3/ETHYLENE-INSENSITIVE 3-LIKEs (EIN3/EILs) are important ethylene response factors during fruit ripening. It could modulates AsA accumulation by transcriptionally regulating GPP and MIOX expression in tomato (Chen et al., 2023). These regulatory factors reported in the researches are all transcription factors (TFs). Thus, we analyzed the transcription factors (TFs) predicted from the ERF, MYB, MAPK, ARF, bHLH, EIN3/EILs. We analyzed and selected 29 TFs with similar expression patterns in both two varieties from DEGs, including ERF (nine), MYB (two), bHLH (eight), MAPK (six), ARF (three), EIN (one) (Tables S6, S7; Figs. 7 and 8). Correlation analysis of TFs and genes showed that in both two cultivars, CsaV3_4G028360 (ERF) was negatively correlated with PMM and GME, and positively correlated with DHAR. CsaV3_6G042110 (ERF) was positively correlated with PMM and GME, and negatively correlated with DHAR. CsaV3_6G032360 (MAPK) as positively correlated with PMM, GME and DHAR (Tables S6, S7; Fig. 8). In summary, at the transcriptional level, there is a complex regulatory system between TFs and AsA-related genes. CsaV3_4G028360 (ERF), CsaV3_6G042110 (ERF) and CsaV3_6G032360 (MAPK) may be involved in regulating the expression of AsA -related genes.
Conclusions
In this study, the AsA content in the exocarp and endocarp was significantly higher than that in the mesocarp of cucumber cultivars. Duo to the positively correlated between the expression patterns of PMM (CsaV3_5G014110), GME (CsaV3_2G004170) and DHAR (CsaV3_5G006680) and AsA content, these three genes are considered to be key candidate genes for regulating AsA content in cucumber fruits. Three TFs, including CsaV3_4G028360 (ERF), CsaV3_6G042110 (ERF) and CsaV3_6G032360 (MAPK) could potentially be novel candidate genes for AsA based on their expression patterns. These findings contribute to a comprehensive understanding of the distribution and regulation of AsA in cucumber fruits and provide potential target genes for the genetic improvement of AsA-rich cucumber germplasm.