


Temporal disruption in tuberculosis incidence patterns during COVID-19: a time series analysis in China
- Published
- Accepted
- Received
- Academic Editor
- Dominic Thorrington
- Subject Areas
- Epidemiology, Global Health, Infectious Diseases, Public Health, COVID-19
- Keywords
- Tuberculosis, COVID-19, Time series analysis, Incidence patterns, China, SARIMA model, Prophet model, LSTM networks, Infectious disease trends
- Copyright
- © 2024 Zhang et al.
- Licence
- This is an open access article distributed under the terms of the Creative Commons Attribution License, which permits using, remixing, and building upon the work non-commercially, as long as it is properly attributed. For attribution, the original author(s), title, publication source (PeerJ) and either DOI or URL of the article must be cited.
- Cite this article
- 2024. Temporal disruption in tuberculosis incidence patterns during COVID-19: a time series analysis in China. PeerJ 12:e18573 https://doi.org/10.7717/peerj.18573
Abstract
Background
Despite extensive knowledge of tuberculosis (TB) and its control, there remains a significant gap in understanding the comprehensive impact of the COVID-19 pandemic on TB incidence patterns. This study aims to explore the impact of COVID-19 on the pattern of pulmonary tuberculosis in China and examine the application of time series models in the analysis of these patterns, providing valuable insights for TB prevention and control.
Methods
We used pre-COVID-19 pulmonary tuberculosis (PTB) data (2007–2018) to fit SARIMA, Prophet, and LSTM models, assessing their ability to predict PTB incidence trends. These models were then applied to compare the predicted PTB incidence patterns with actual reported cases during the COVID-19 pandemic (2020–2023), using deviations between predicted and actual values to reflect the impact of COVID-19 countermeasures on PTB incidence.
Results
Prior to the COVID-19 outbreak, PTB incidence in China exhibited a steady decline with strong seasonal fluctuations, characterized by two annual peaks—one in March and another in December. These seasonal trends persisted until 2019. During the COVID-19 pandemic, there was a significant reduction in PTB cases, with actual reported cases falling below the predicted values. The disruption in PTB incidence appears to be temporary, as 2023 data indicate a gradual return to pre-pandemic trends, though the incidence rate remains slightly lower than pre-COVID levels. Additionally, we compared the fitting and forecasting performance of the SARIMA, Prophet, and LSTM models using RMSE (root mean squared error), MAE (mean absolute error), and MAPE (mean absolute percentage error) indexes prior to the COVID-19 outbreak. We found that the Prophet model had the lowest values for all three indexes, demonstrating the best fitting and prediction performance.
Conclusions
The COVID-19 pandemic has had a temporary but significant impact on PTB incidence in China, leading to a reduction in reported cases during the pandemic. However, as pandemic control measures relax and the healthcare system stabilizes, PTB incidence patterns are expected to return to pre-COVID-19 levels. The Prophet model demonstrated the best predictive performance and proves to be a valuable tool for analyzing PTB trends and guiding public health planning in the post-pandemic era.
Introduction
Globally, tuberculosis (TB) remains one of the top 10 causes of death and the leading cause of mortality from a single infectious agent, surpassing HIV/AIDS. In 2022, approximately 10.6 million people contracted TB, and 1.3 million died from the disease (Falzon et al., 2023; World Health Organization (WHO), 2023). China, with its large population, faces significant challenges in controlling TB, particularly in managing multidrug-resistant TB (MDR-TB), which complicates treatment efforts. One study highlighted the spread of MDR-TB within households and schools in China during the COVID-19 pandemic, emphasizing the need for strengthened TB detection and control measures (Li et al., 2023b). Although China has made progress in reducing TB incidence through improved diagnostic techniques and treatment protocols, regional disparities persist, particularly in areas heavily impacted by MDR-TB (Long et al., 2021). The long-term impact of COVID-19 on these efforts remains a concern, as the pandemic stressed healthcare systems and potentially hindered TB management strategies (Ledesma et al., 2023; Zumla et al., 2020).
The COVID-19 pandemic introduced both positive and negative effects on TB control. On one hand, containment measures such as lockdowns and social distancing reduced transmission by limiting social interactions (Zhang et al., 2023). On the other hand, delays in TB diagnosis, treatment, and notifications due to overwhelmed healthcare systems posed serious risks (Soko et al., 2021). Disruptions in health services in China led to a significant drop in TB case notifications, raising concerns about undiagnosed cases that could increase future TB morbidity (Fei et al., 2020; Ledesma et al., 2023).
Predictive models play a crucial role in understanding TB trends, particularly in light of pandemic disruptions. Time series models can capture trends and predict future changes in variables, making them widely applicable in TB forecasting. The autoregressive integrated moving average (ARIMA) model is the most classic time series model, and the seasonal autoregressive integrated moving average (SARIMA) extends it by accounting for seasonality and periodic trends. Although ARIMA does not require special assumptions about the data, its limited ability to model nonlinear components can lead to overfitting (Brown, Bateson & McDonnell, 2008; Sembiring, Wahyuni & Sediyono, 2024). Recent studies suggest that ARIMA performs better in infectious disease forecasting than some machine learning-based models, such as grey forecasting models (Wang, Shen & Jiang, 2018), thus maintaining its relevance in disease prediction. The Prophet model, introduced by Facebook in 2017, is another time series forecasting algorithm capable of incorporating holiday effects and handling missing or anomalous data, providing a more flexible and generalizable solution compared to traditional models (Xie et al., 2021). long short-term memory (LSTM), a variant of recurrent neural networks (RNN), is a deep learning algorithm known for its ability to model complex sequential dependencies (Sembiring, Wahyuni & Sediyono, 2024). It has been widely used in tasks requiring high performance, particularly for addressing sequence-related problems and mitigating gradient vanishing issues in time series data (Wahyuni et al., 2022). Given their distinct strengths, this study applies all three predictive models—SARIMA, Prophet, and LSTM—to balance potential biases in evaluating TB incidence trends before and after the COVID-19 outbreak in China.
In most studies employing time series models for disease forecasting, researchers have focused primarily on model fitting, prediction, and performance evaluation. However, in this study, we aim to go beyond mere forecasting by applying these predictive models to analyze changes in pulmonary tuberculosis (PTB) incidence patterns. Considering the complex interactions between COVID-19 and TB, this study aims to assess the performance of different time series models in predicting PTB trends before, during, and after the COVID-19 pandemic in China. Additionally, this study explores the potential impact of the pandemic on PTB incidence patterns and highlights the utility of time series models in analyzing PTB trends. The insights gained will fill knowledge gaps about the long-term impact of COVID-19 on PTB and provide a scientific basis for selecting predictive tools for future PTB incidence forecasting and public health strategies.
Materials and Methods
Data source and preparation
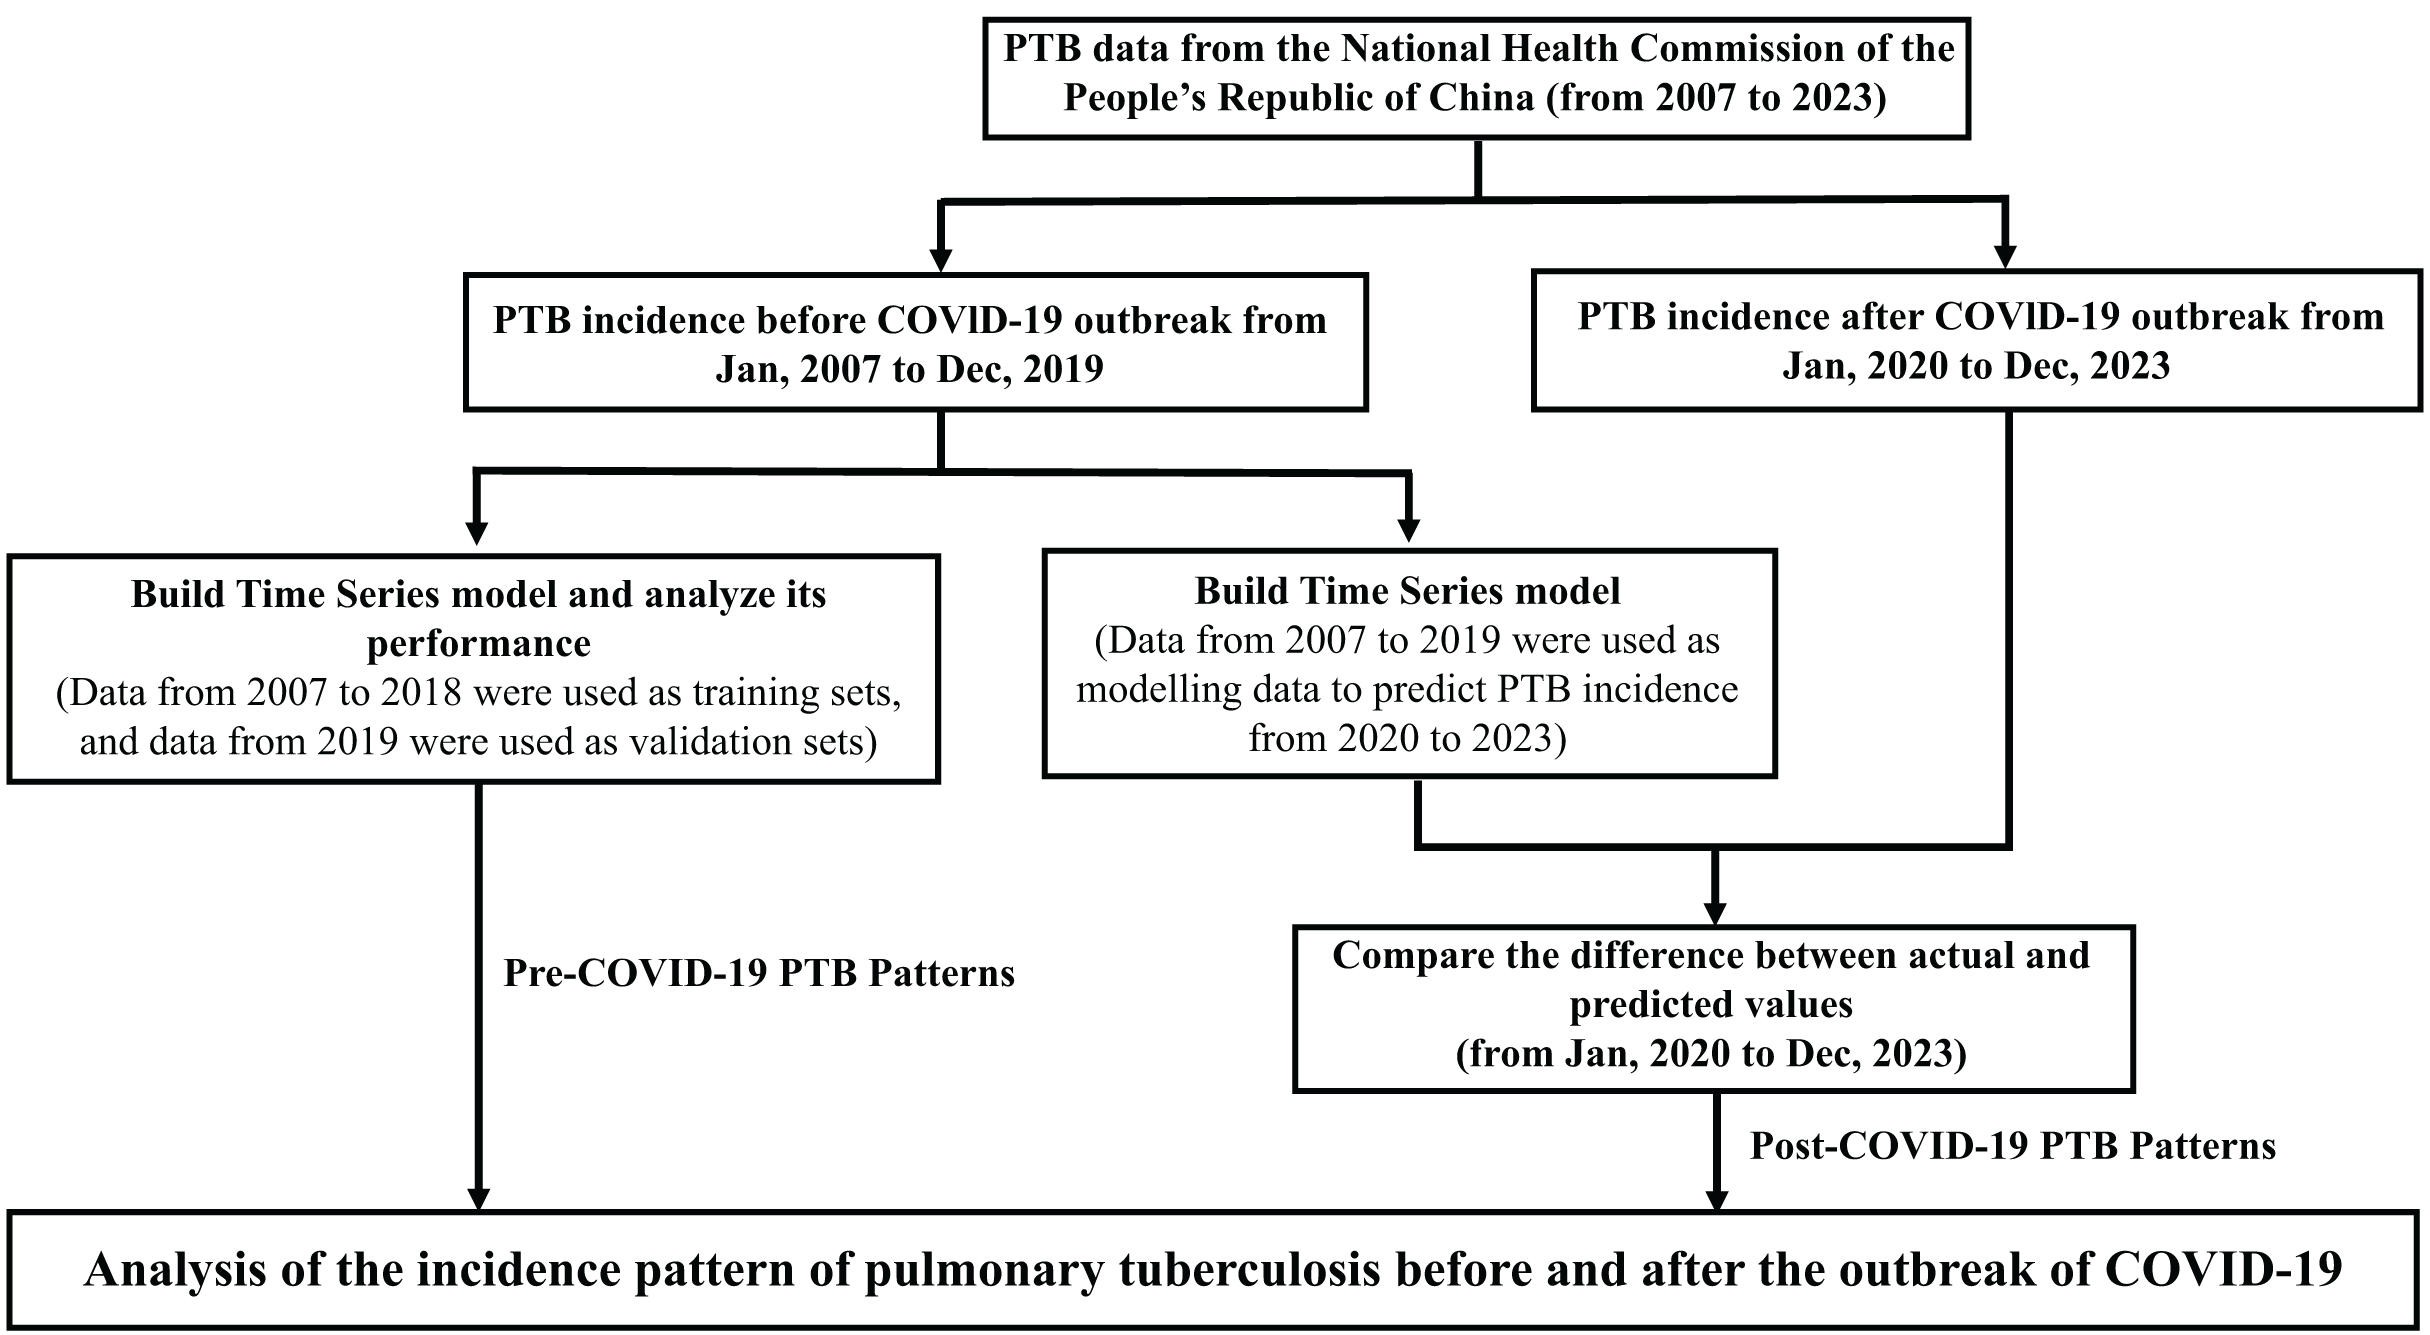
This study analyzed monthly PTB incidence data obtained from the National Health Commission of the People’s Republic of China (http://www.nhc.gov.cn/), covering the period from January 2007 to December 2023. The dataset included reports from 31 provinces, municipalities, and autonomous regions in China. Data quality was rigorously checked to ensure accuracy and consistency. Missing values were handled using linear interpolation, a suitable approach for time series data. Outliers were detected via Z-scores and adjusted using winsorizing to minimize their impact on model accuracy without distorting the overall trends. Population data for each year were used to calculate annual incidence rates per 100,000 individuals. The study design and methodology are illustrated in Fig. 1, which provides an overview of the time series models (SARIMA, Prophet, and LSTM) used to predict PTB incidence in China based on pre-COVID-19 data (2007–2019). Detailed monthly incidence and mortality data for pulmonary tuberculosis from 2007 to 2023 are available in Table S1.
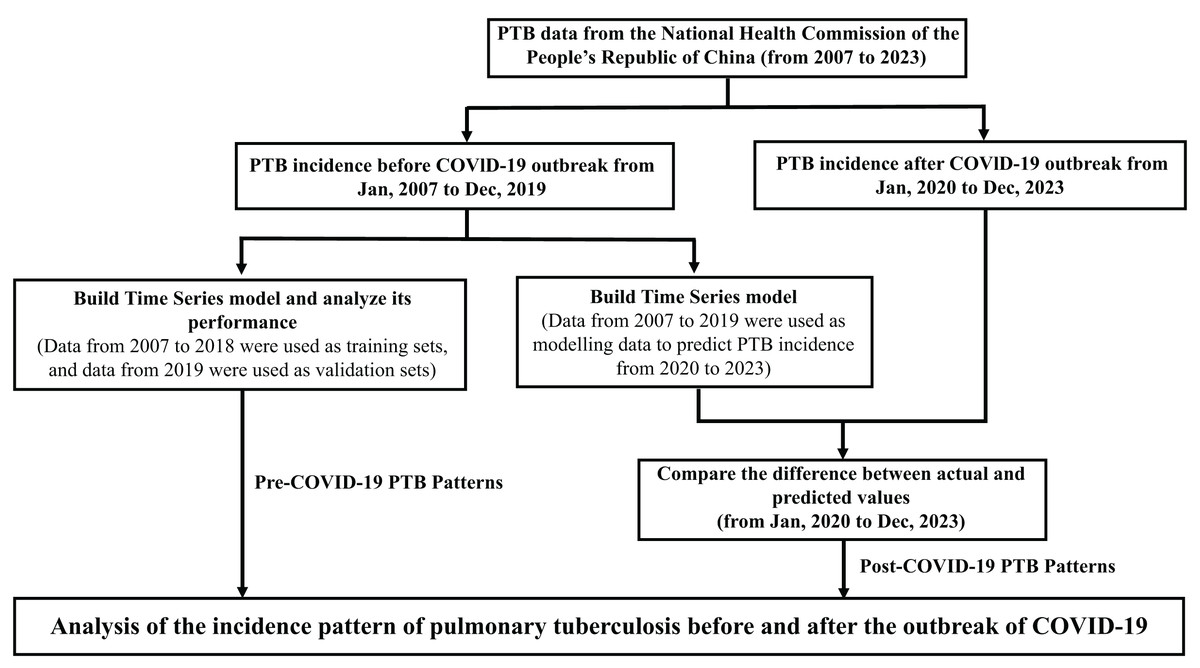
Figure 1: Methodology for predicting pulmonary tuberculosis (PTB) incidence using time series models.
Methodology for predicting PTB incidence in China, employing SARIMA, Prophet, and LSTM time series models with data from 2007 to 2019. Expected PTB incidence without pandemic influence is represented by predicted values, compared against actual cases during the COVID-19 period (2020–2023). Deviations indicate the pandemic’s impact on PTB transmission and reporting, underscoring COVID-19 as a key variable affecting incidence trends.Descriptive statistical analysis
A descriptive statistical analysis was performed to explore trends in PTB incidence over time. The annual incidence rate was calculated by dividing the total number of reported PTB cases each year by the population for that year and multiplying by 100,000 to express the rate per 100,000 people. Line charts were generated to visualize these trends over time, and the annual percentage change (APC) was calculated using the formula:
This measure enabled precise year-over-year comparisons of PTB incidence, with particular attention to fluctuations caused by the COVID-19 pandemic.
Model training and forecasting
SARIMA model
The SARIMA model was employed to capture both seasonal and non-seasonal patterns in PTB data (Boshnakov & Halliday, 2024). SARIMA is denoted as SARIMA(p, d, q)(P, D, Q)s, where p is the autoregressive order, d is the differencing order, and q is the moving average order. P, D, and Q represent their seasonal counterparts, and s is the seasonal period, set to 12 months. Model parameters were selected using autocorrelation function (ACF) and partial autocorrelation function (PACF) plots, with the Akaike Information Criterion (AIC) guiding final model selection. This model was chosen for its robustness in handling seasonality in TB trends (Zhao et al., 2023). The SARIMA model is mathematically represented as:
where is the backshift operator, and is white noise.
Prophet model
The Prophet model, developed by Facebook, was used due to its flexibility in handling time series data with missing values and outliers (Taylor & Letham, 2018). The model decomposes time series into trend, seasonal, and holiday components, making it particularly suited for capturing complex seasonal patterns in PTB incidence. The model accounted for known holidays and significant public health events, such as lockdowns, which could affect TB trends. The Prophet model is represented as:
where represents the trend component, the seasonal component, the holiday effects, and is the error term.
LSTM networks
The LSTM networks, a type of recurrent neural network (RNN), were employed to model complex non-linear dependencies in the sequential PTB data (Sembiring, Wahyuni & Sediyono, 2024). LSTM is particularly effective in capturing long-term temporal dependencies and patterns in time series data. The LSTM architecture used multiple hidden layers to capture the intricate temporal patterns of the PTB incidence. The model was trained using the Keras library in Python, with normalized input sequences to improve the training process. LSTM operations are defined by the following equations:
where , , are the input, forget, and output gates, respectively; is the cell state; and is the hidden state.
Model evaluation
The accuracy of the models was assessed using the following metrics:
Root mean square error (RMSE): Measures the average magnitude of the forecast errors.
Mean absolute error (MAE): Provides the average absolute forecast errors.
Mean absolute percentage error (MAPE): Expresses forecast accuracy as a percentage, with values between 0% and 10% indicating high accuracy (Lewis, 1982; Wang et al., 2019). The lower the MAPE, the better the model’s prediction performance.
Residual analysis, including the Ljung-Box test, was conducted to ensure the robustness of the models. These metrics provided a comprehensive evaluation of model performance across SARIMA, Prophet, and LSTM models.
Statistical analysis
All data analysis and modeling were conducted using R (version 4.2.2; R Core Team, 2022) for the SARIMA and Prophet models and Python (version 3.12 with TensorFlow/Keras) for the LSTM model. The analysis focused on evaluating model fit, forecast accuracy, and residual patterns to ensure reliability in predictions.
Ethics statement
This study utilized publicly available data from the National Health Commission of the People’s Republic of China, aggregated at a national level and without personally identifiable information. Therefore, ethical approval and informed consent were not required. Data handling followed ethical guidelines to maintain data integrity and confidentiality.
Results
National trends in pulmonary tuberculosis incidence (2007–2023)
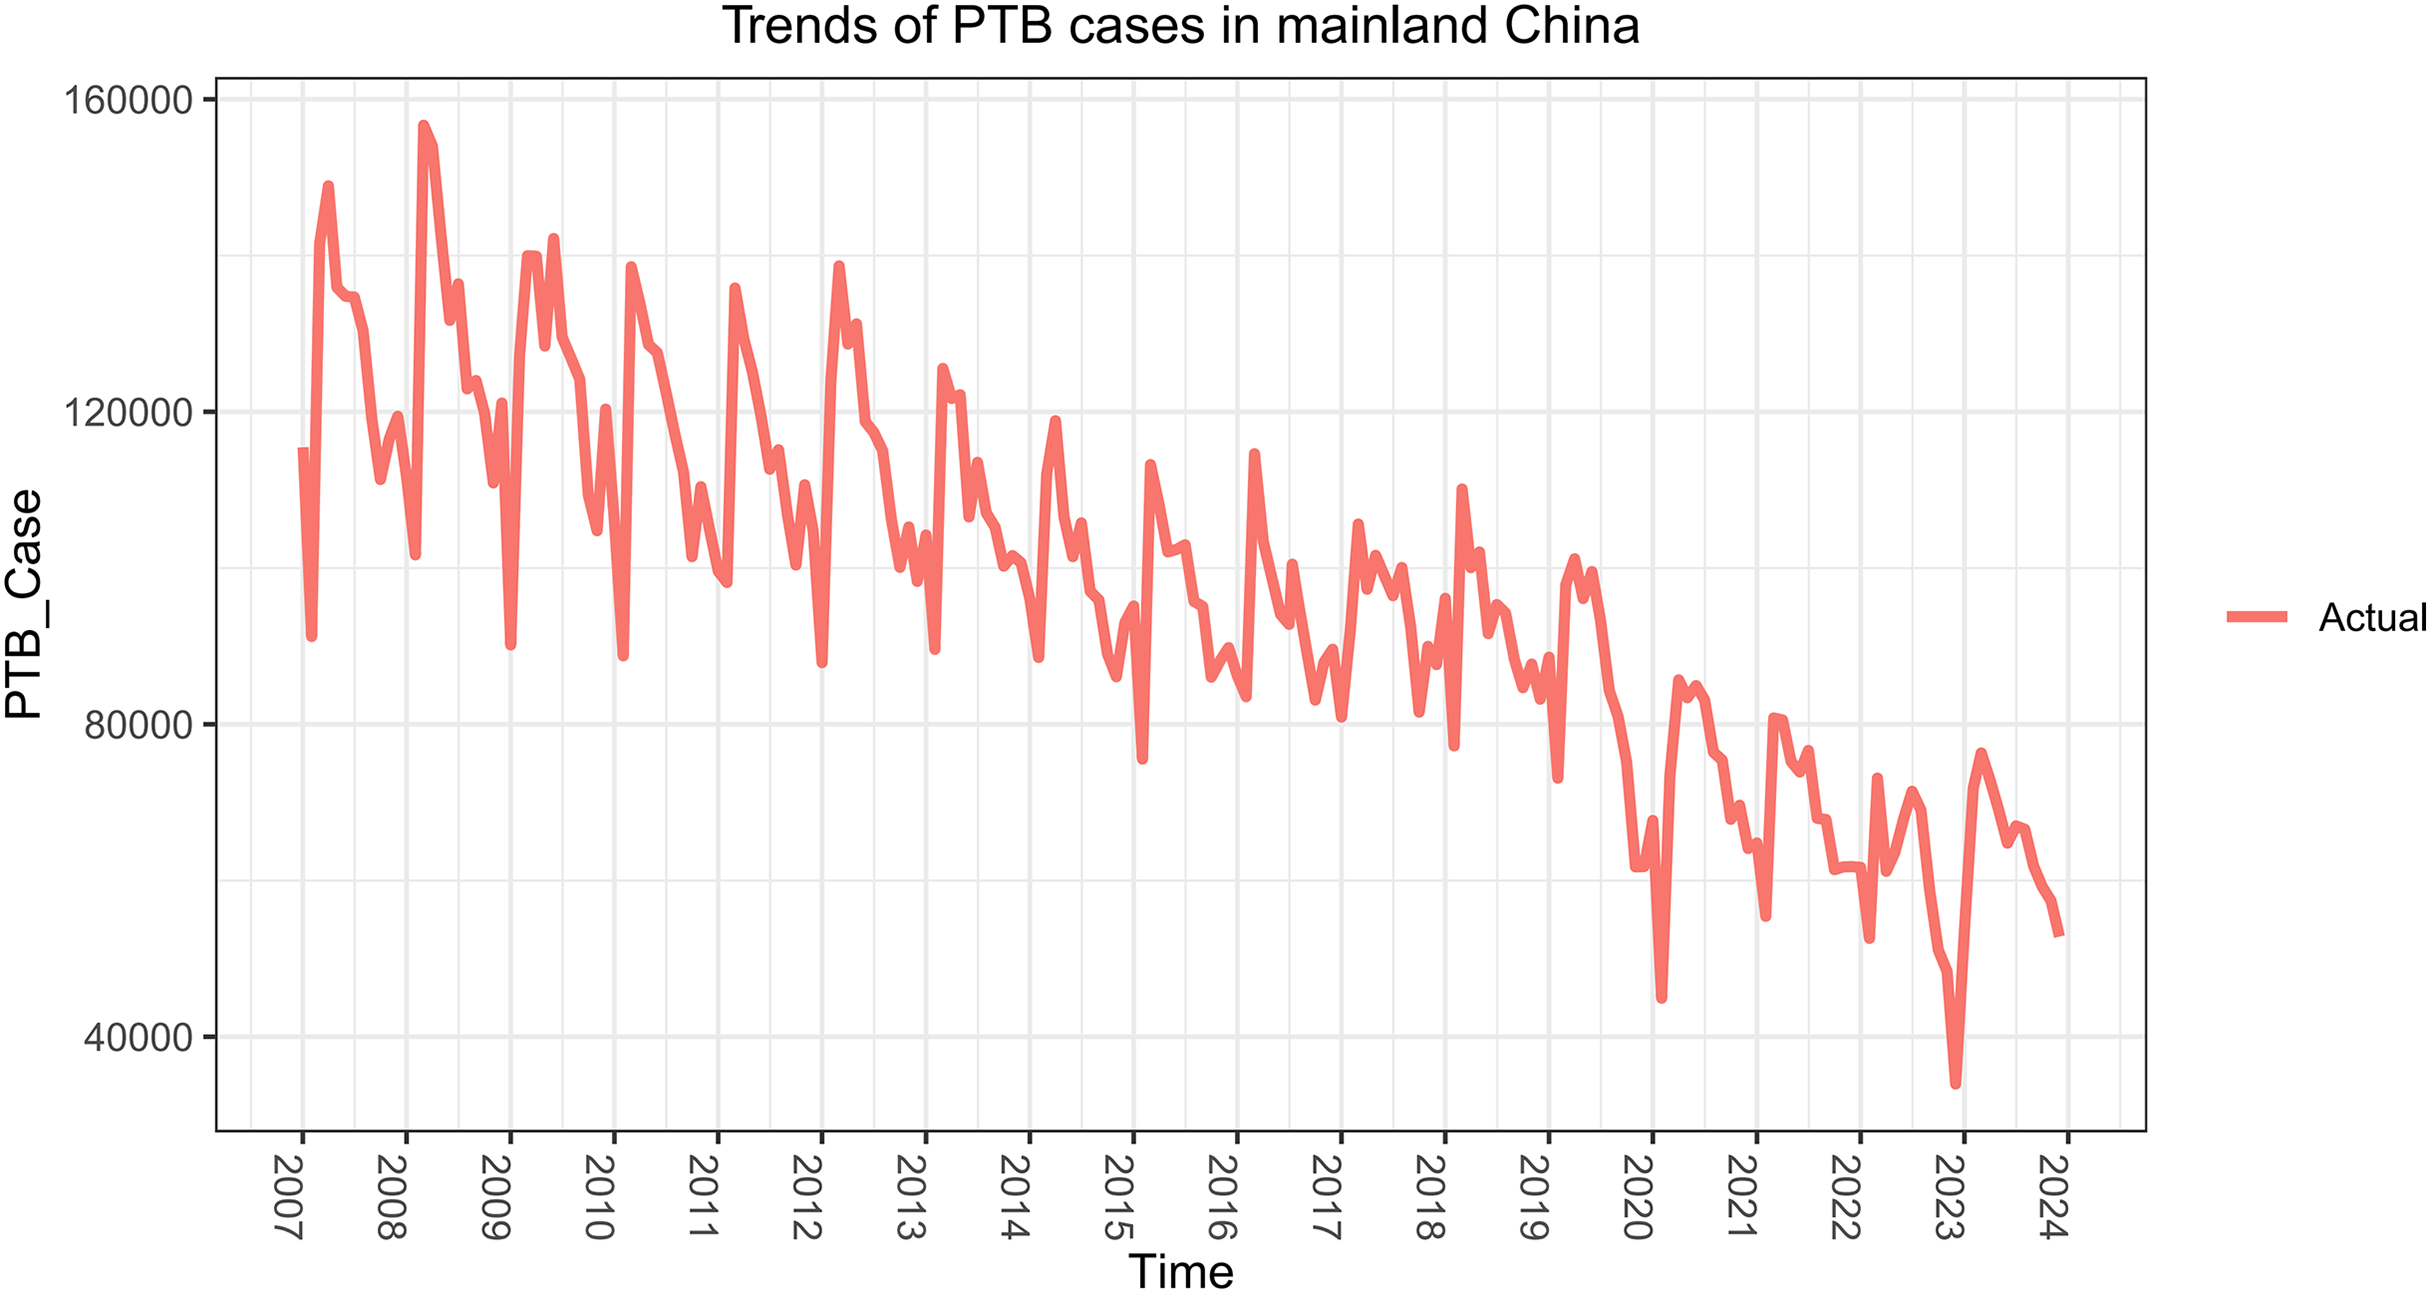
From January 2007 to December 2023, China reported a total of 19,840,536 PTB cases, with an average of 97,257.53 cases per month. Over this 17-year period, the annual incidence rate steadily declined from 88.55 per 100,000 in 2007 to an estimated 37.24 per 100,000 in 2023 (Fig. 2, Table 1). This consistent decline reflects significant improvements in PTB control measures, including enhanced diagnosis, treatment, and prevention strategies nationwide.

Figure 2: Time series of pulmonary tuberculosis (PTB) incidence in China from January 2007 to December 2023.
| Year | Cases | Incidence (per 100,000) | Annual case change (%) | Annual incidence change (%) |
|---|---|---|---|---|
| 2007 | 1,499,264 | 88.55 | – | – |
| 2008 | 1,533,475 | 88.52 | 2.28 | −0.03 |
| 2009 | 1,482,869 | 81.09 | −3.30 | −8.39 |
| 2010 | 1,392,210 | 74.27 | −6.11 | −8.41 |
| 2011 | 1,357,922 | 71.09 | −2.46 | −4.28 |
| 2012 | 1,371,468 | 70.62 | 1.00 | −0.66 |
| 2013 | 1,298,123 | 66.80 | −5.35 | −5.41 |
| 2014 | 1,190,246 | 65.63 | −8.32 | −1.75 |
| 2015 | 1,154,156 | 63.42 | −3.03 | −3.37 |
| 2016 | 1,121,019 | 61.00 | −2.87 | −3.81 |
| 2017 | 1,124,707 | 60.53 | 0.33 | −0.77 |
| 2018 | 1,110,659 | 59.27 | −1.25 | −2.08 |
| 2019 | 1,034,760 | 55.55 | −6.83 | −6.27 |
| 2020 | 876,576 | 47.76 | −15.25 | −14.05 |
| 2021 | 828,074 | 45.37 | −5.54 | −5.00 |
| 2022 | 712,586 | 39.76 | −13.96 | −12.36 |
| 2023 | 773,512 | 37.24 (estimated) | 8.55% | −6.34% |
The most notable reduction occurred between 2020 and 2022, coinciding with the COVID-19 pandemic. Public health interventions, such as lockdowns, social distancing, and reduced mobility, likely contributed to a reduction in PTB transmission. In 2019, China reported 1,034,760 cases (55.55 per 100,000), which dropped to 876,576 cases (47.76 per 100,000) in 2020—a 15.25% reduction in case numbers and a 14.05% decrease in the incidence rate.
This downward trend continued through 2021 and 2022, with cases decreasing further to 712,586 and the incidence rate falling to 39.76 per 100,000. However, in 2023, PTB cases rebounded to 773,512, reflecting an 8.55% increase from 2022. Despite this rise in case numbers, the incidence rate continued to decline slightly to an estimated 37.24 per 100,000 (a 6.34% decrease), possibly due to the increasing population. This divergence, where the number of cases increases while the incidence rate decreases, suggests a shift in post-pandemic PTB dynamics that may warrant further investigation.
Pre-pandemic pattern and seasonality of pulmonary tuberculosis cases (2007–2018)
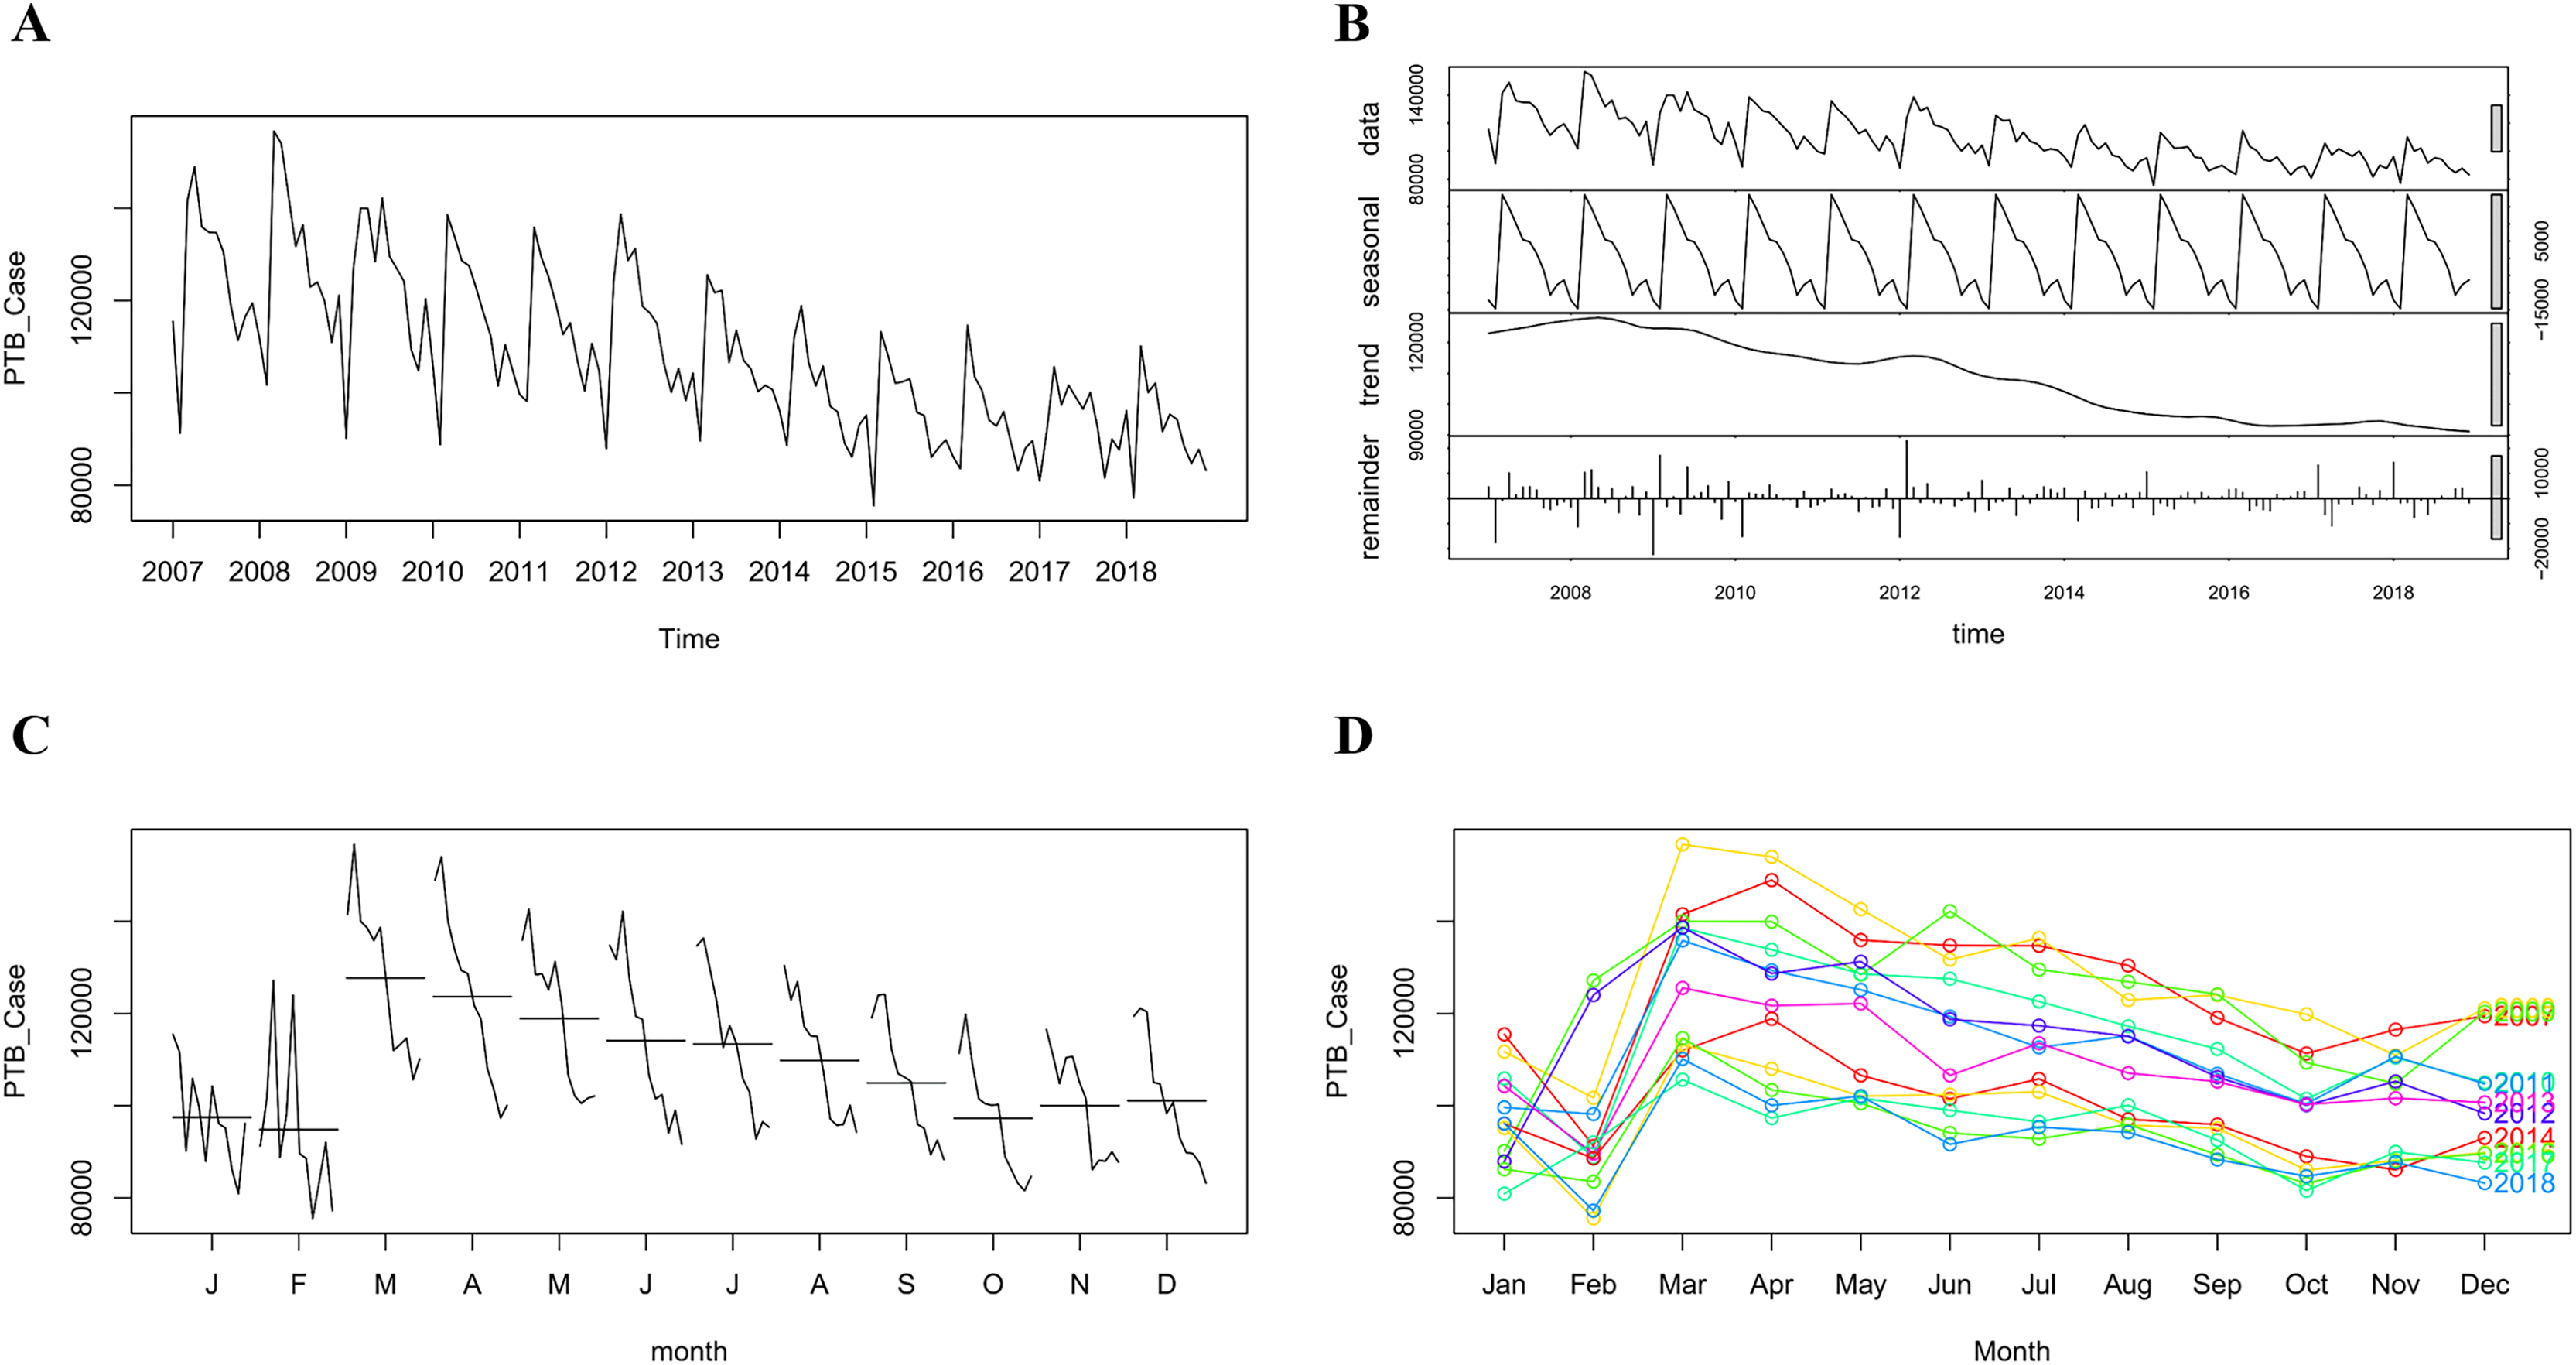
From January 2007 to December 2018, China reported a total of 15,636,118 PTB cases, with an average monthly incidence of 108,584.15 cases. During this period, the annual incidence rate steadily declined from 88.55 per 100,000 in 2007 to 59.27 per 100,000 by 2018 (Fig. 3A, Table 1). This decline reflects the sustained public health efforts, including enhanced PTB diagnostic techniques and improved access to treatment.
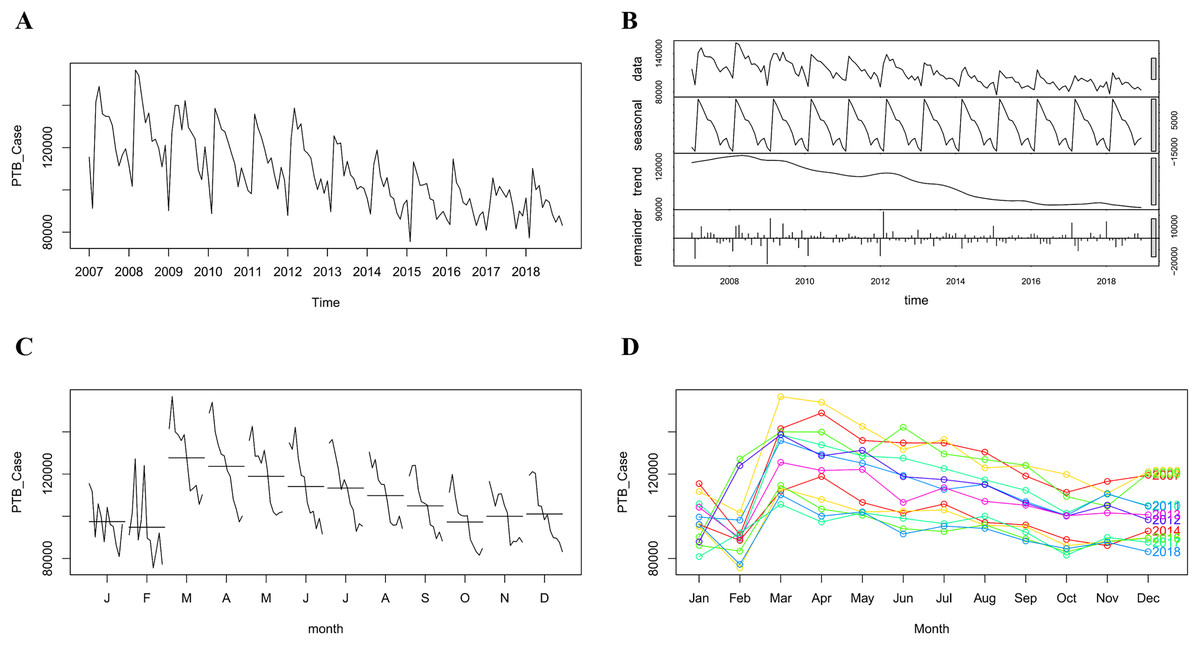
Figure 3: The monthly incidence of pulmonary tuberculosis (PTB) in China from January 2007 to December 2018.
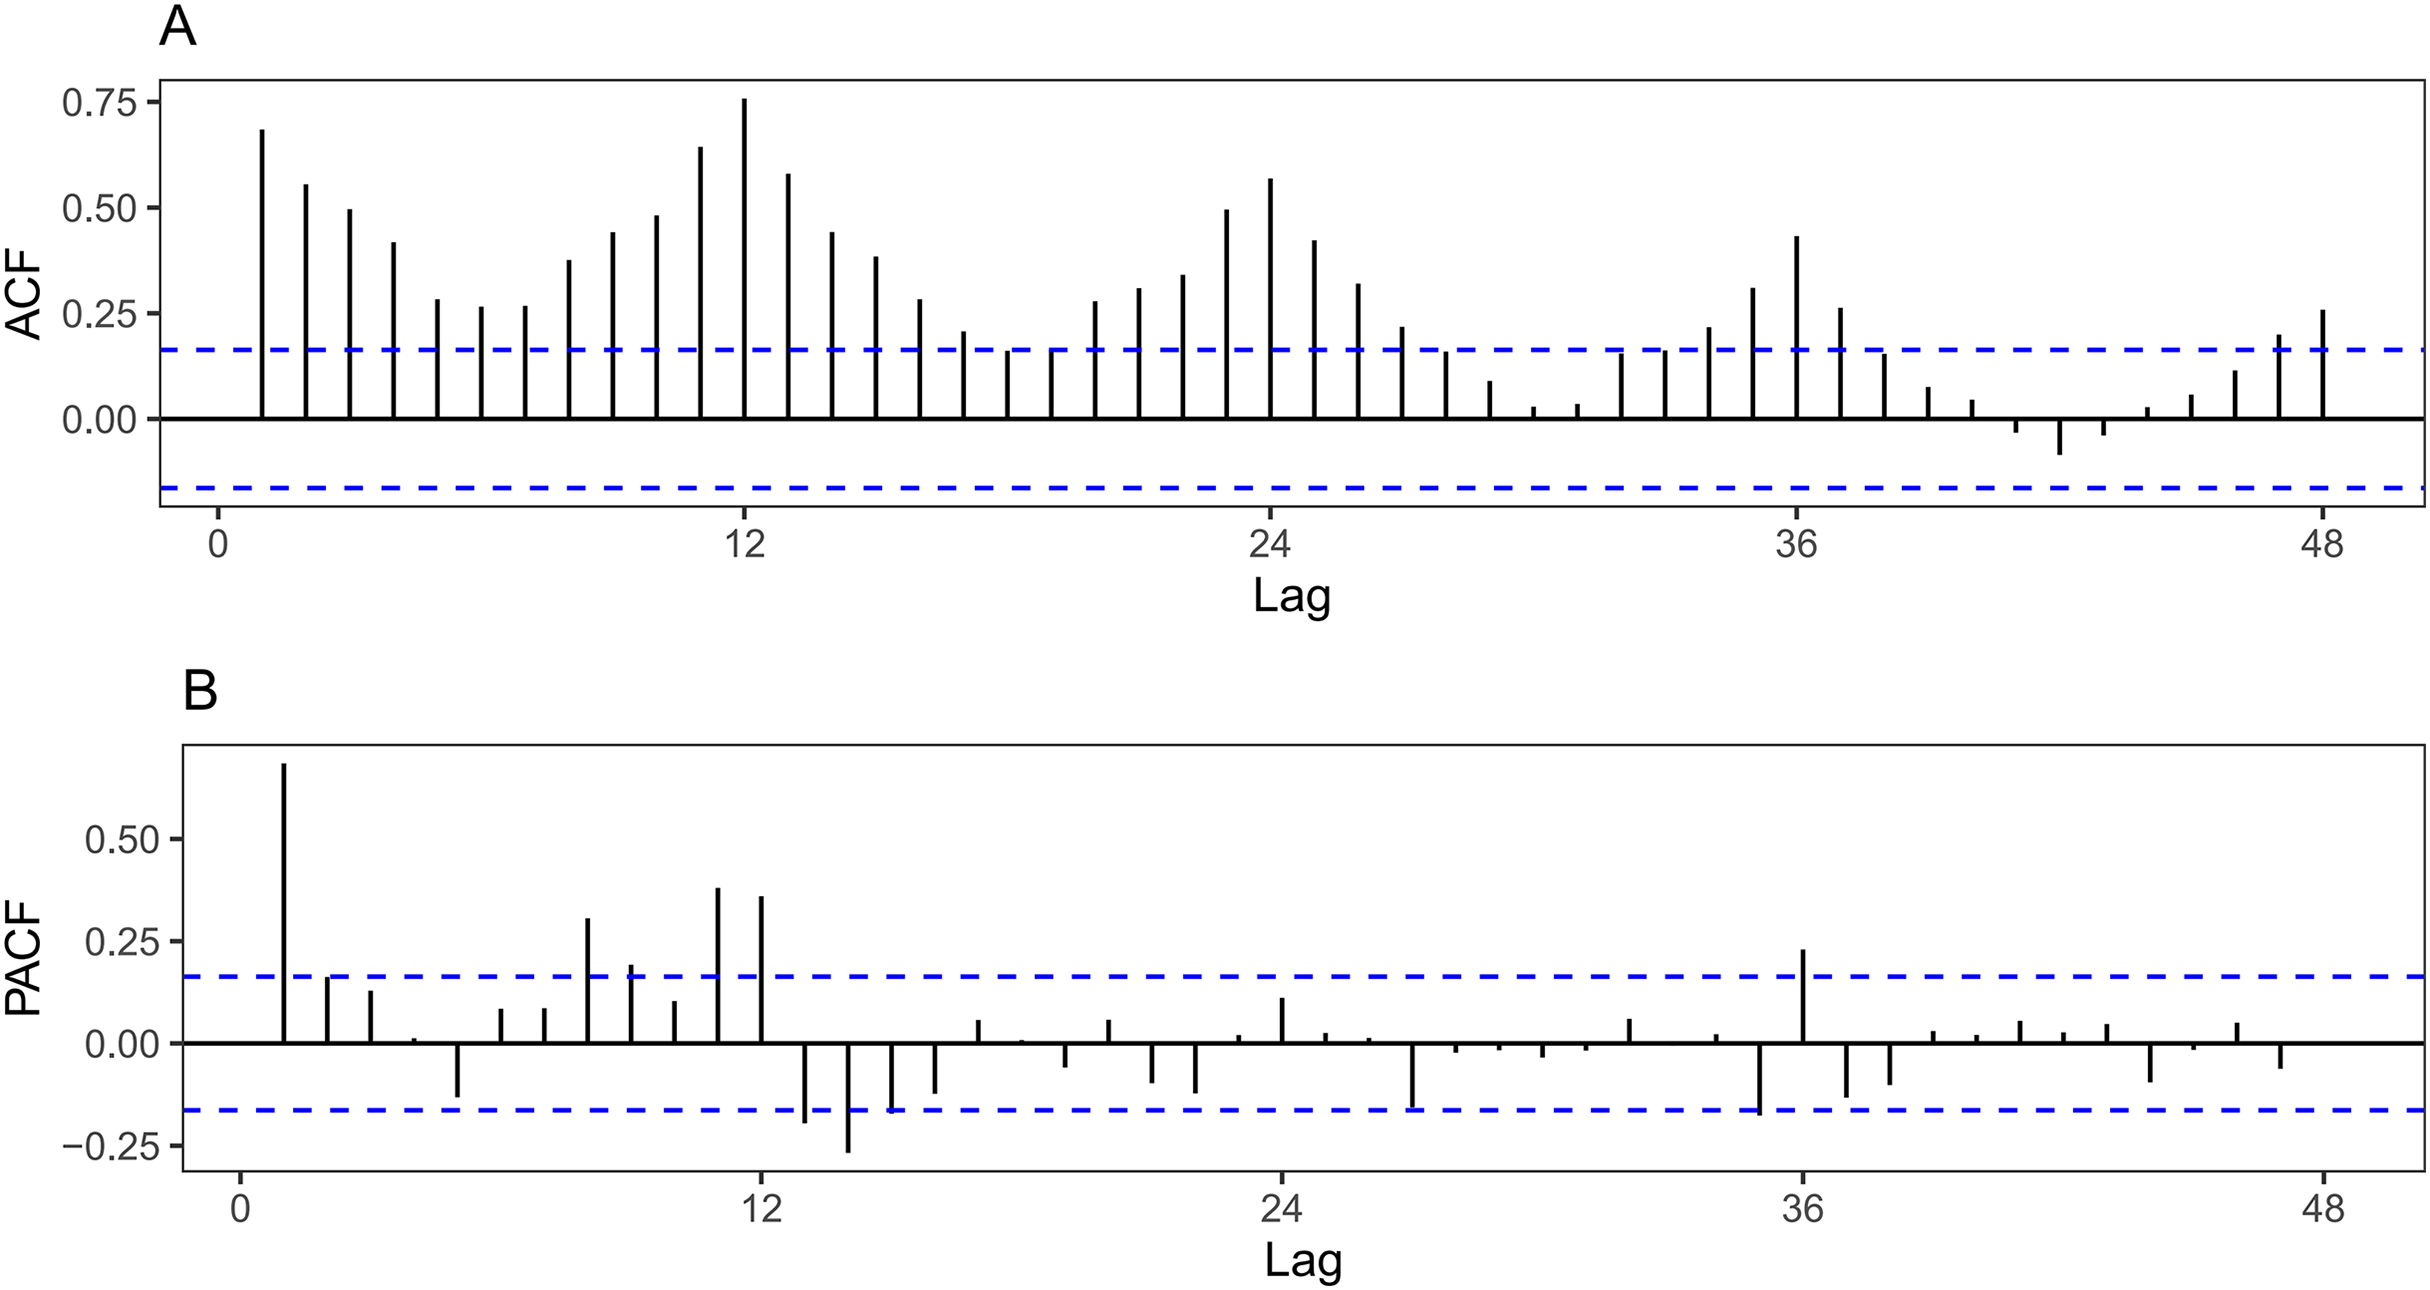
(A) The original time series of monthly reported PTB cases from 2007 to 2018, showing both the overall trend and seasonal fluctuations. (B) The decomposition of the time series using LOESS smoothing, separating the data into seasonal, trend, and irregular components. The seasonal component highlights the recurring patterns within each year, while the trend indicates a gradual decline in PTB cases over the period, and the remainder represents the irregular fluctuations in the data. (C) Monthly subsequences, where the PTB cases for each month across the years 2007 to 2018 are connected (e.g., all January values are connected, all February values are connected, and so on). The horizontal lines in each subsequence represent the average values for each month, providing a clearer view of seasonal patterns. (D) The seasonal variation in PTB incidence across different years, showing that spring (March to May) consistently exhibits the highest incidence rates, while lower rates are observed in January, February, and October. The colors indicate different years, showing the overall declining trend across the study period.The analysis of the ACF and PACF for the original series (Fig. 4) revealed that the autocorrelation and partial autocorrelation values peaked when the lag was set at 12 months, exceeding the boundary limits. This suggests strong seasonality in the data, with a periodic cycle of 12 months, indicating that PTB incidence follows an annual pattern.
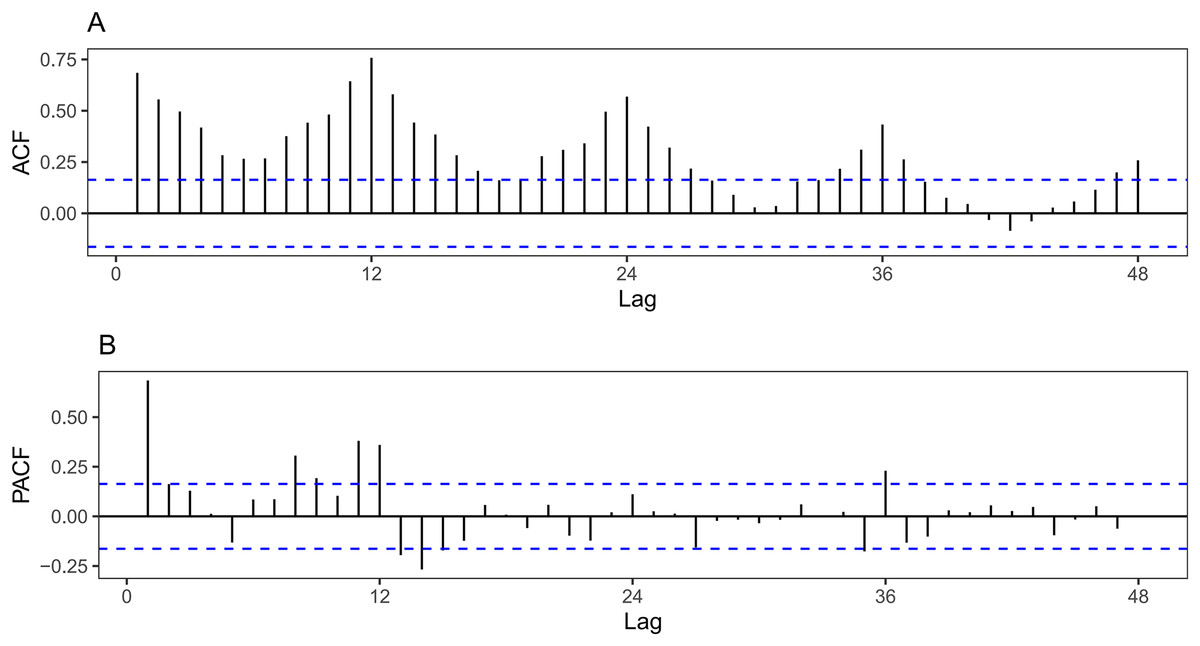
Figure 4: ACF and PACF plots of the original incidence series from 2007 to 2018.
(A) The autocorrelation function (ACF) for the differenced time series of pulmonary tuberculosis (PTB) incidence, indicating a strong seasonal component with a 12-month lag. (B) The partial autocorrelation function (PACF) of the same series, which also highlights the significant seasonal influence at a 12-month lag. The blue dotted lines represent the boundaries for statistical significance. When the vertical lines fall within the dotted lines, the corresponding autocorrelation or partial autocorrelation value is considered not significantly different from zero, meaning there is no significant correlation at that lag.To further explore these trends, we applied LOESS smoothing to decompose the incidence data into trend, seasonal, and irregular components (Fig. 3B). The trend component confirmed a steady decline in cases over time, while the seasonal component revealed recurring peaks in March and December. These seasonal peaks were likely driven by factors such as increased human mobility during these periods and the heightened prevalence of respiratory infections, which could contribute to higher PTB transmission rates.
In addition, we plotted monthly and seasonal trends in Figs. 3C and 3D. The monthly subseries plot and seasonal plot demonstrated a similar downward trend across most months, with the exception of January and February, where no significant pattern was observed. Notably, January, February, and October consistently had the lowest number of cases each year, while the incidence rate was highest from March to May. Two annual peaks were identified: a more pronounced peak during the spring months (March to May) and a secondary peak in December. These findings strongly support the existence of seasonal characteristics in PTB transmission, with the spring season being the most critical period for high PTB incidence.
Model construction and performance analysis
We used monthly PTB case data from January 2007 to December 2018 to train three different models—SARIMA, Prophet, and LSTM—aimed at capturing the pre-COVID-19 pattern of PTB incidence in China. These models were chosen for their complementary strengths: SARIMA for handling seasonal trends, Prophet for its flexibility with irregular patterns and handling of holidays, and LSTM for modeling complex non-linear dependencies in time series data.
The models were trained on the 2007–2018 data, and subsequently, they were employed to forecast PTB incidence for the period from January to December 2019. The predicted values from each model were then compared with the actual PTB incidence data for 2019, allowing us to assess model fit and forecast accuracy. This comparison served as a cross-validation of the models’ ability to predict PTB incidence trends, providing insights into the forecasting performance of each model.
SARIMA model
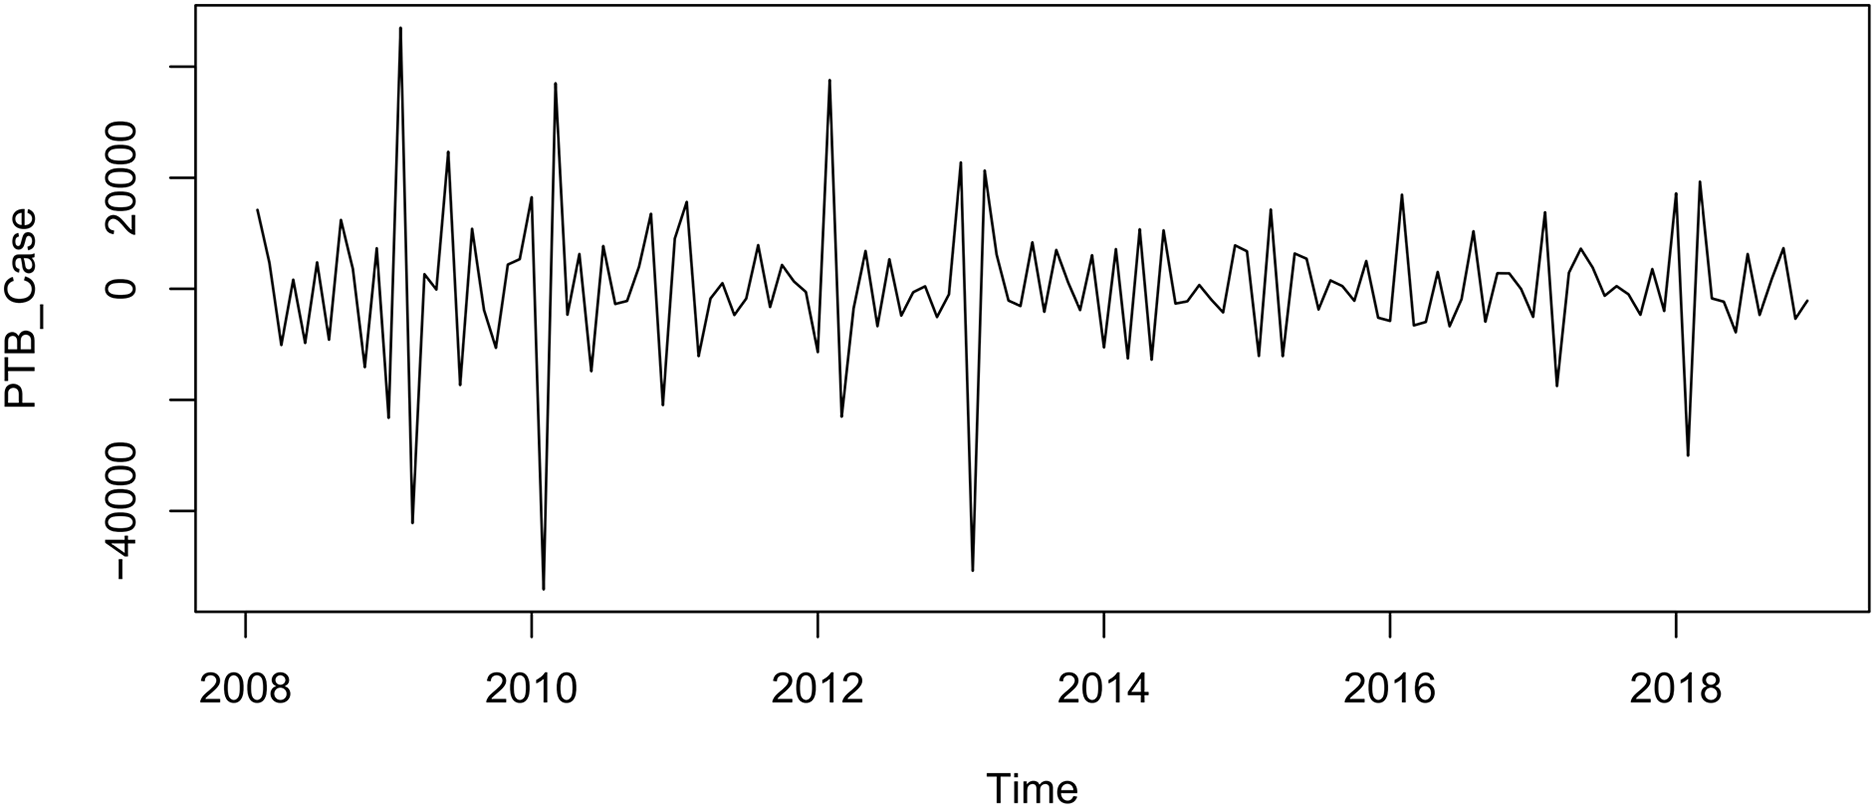
Using monthly PTB incidence data from 2007 to 2018, we developed a seasonal autoregressive integrated moving average (SARIMA) model to account for both the declining trend and seasonal fluctuations in the data, with a seasonality period of 12 months (s = 12) (Fig. 3). The original time series was differenced once to account for both seasonal and non-seasonal components, producing a stationary series (Fig. 5). Stationarity was confirmed using the augmented Dickey-Fuller (ADF) test (ADF = −7.824, P = 0.01), indicating that the series was suitable for modeling.
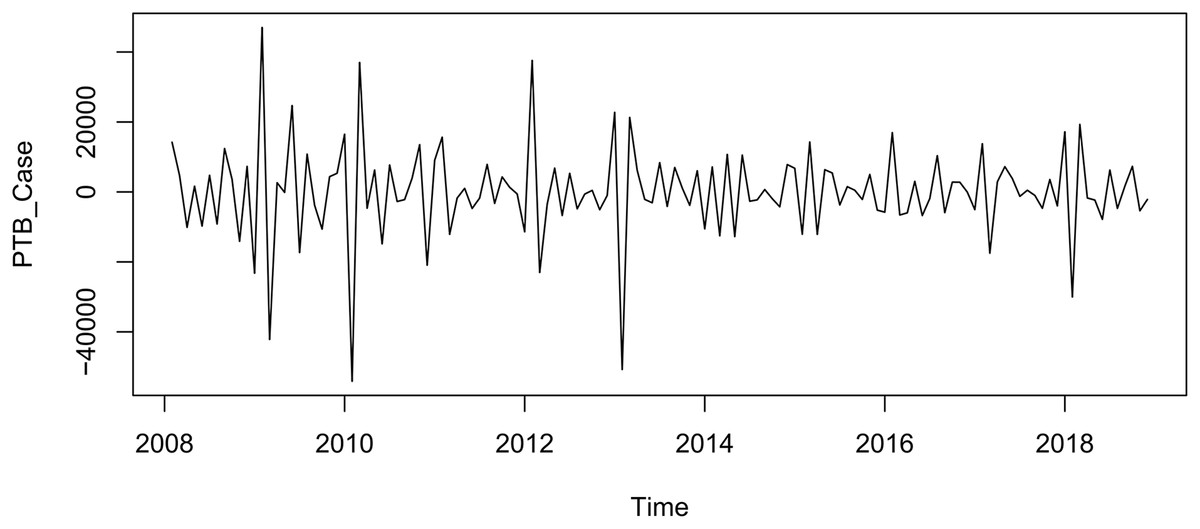
Figure 5: Differenced time series of pulmonary tuberculosis (PTB) incidence in China from January 2007 to December 2018.
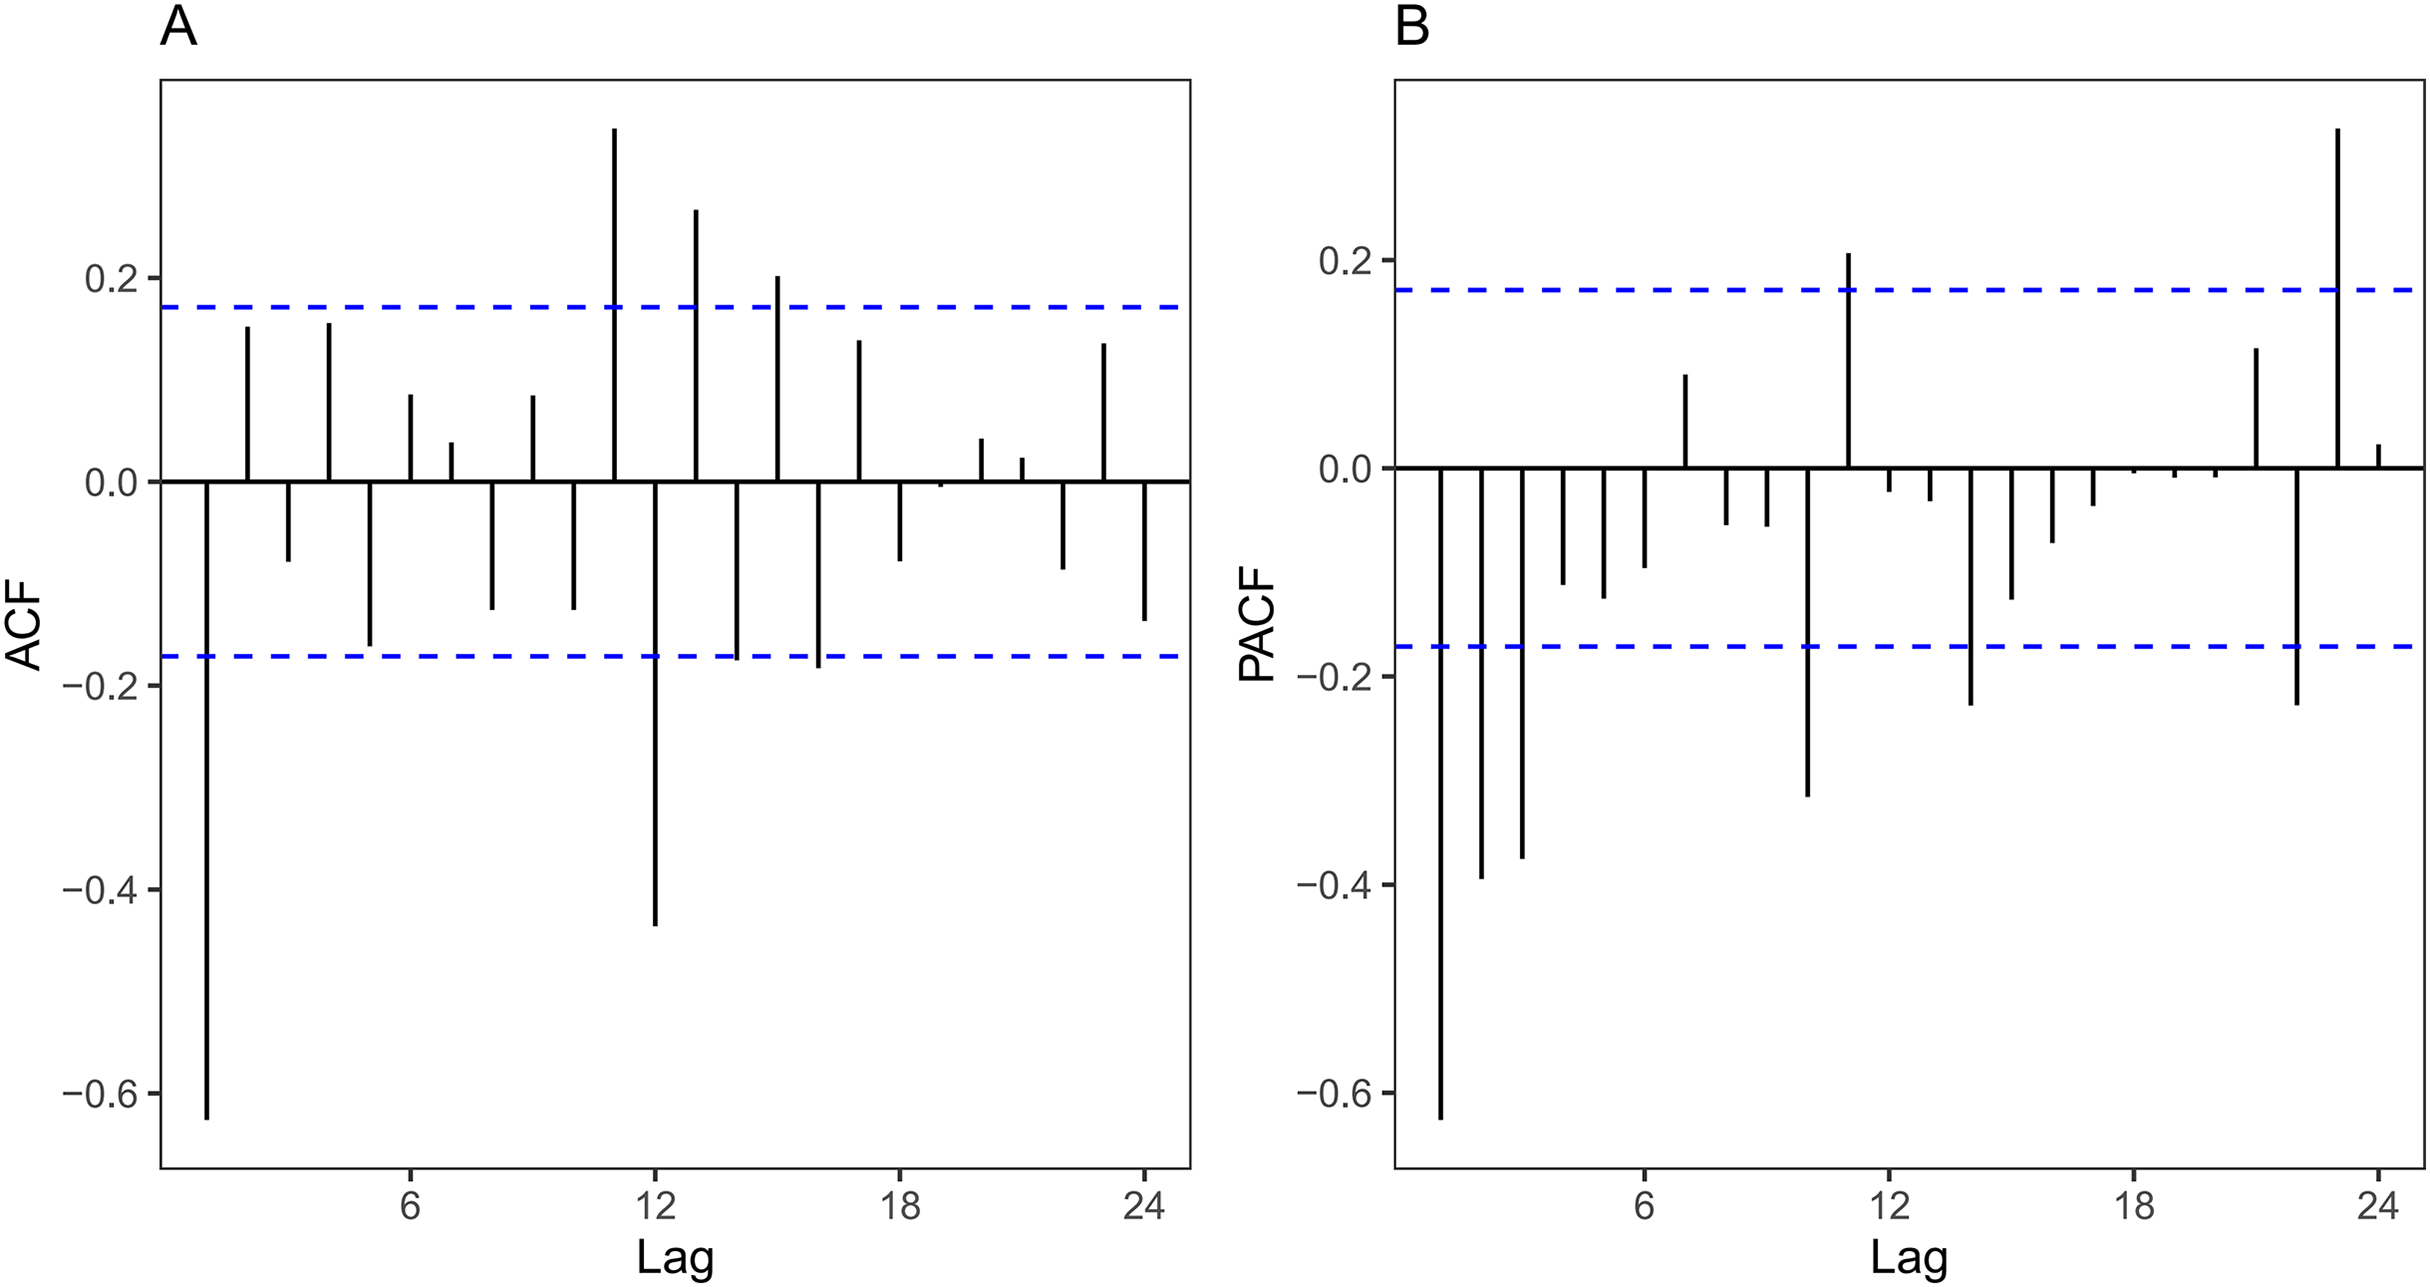
The PTB incidence time series after applying both first-order non-seasonal and seasonal differencing to remove trends and seasonal effects. The differencing process resulted in a stationary series, which is a prerequisite for SARIMA modeling. The stationary series allows for the identification of autoregressive and moving average parameters in the SARIMA model, essential for accurate forecasting.ACF and PACF plots of the differenced series (Fig. 6) were used to guide the selection of SARIMA model parameters. Through this analysis, we determined that p = 0 and were optimal for the non-seasonal component, while seasonal and were tested up to a maximum of 2. A total of five candidate models were evaluated based on parameter estimation and model diagnostics, with particular focus on the AIC and the Box-Ljung test for residual autocorrelation (Table 2).
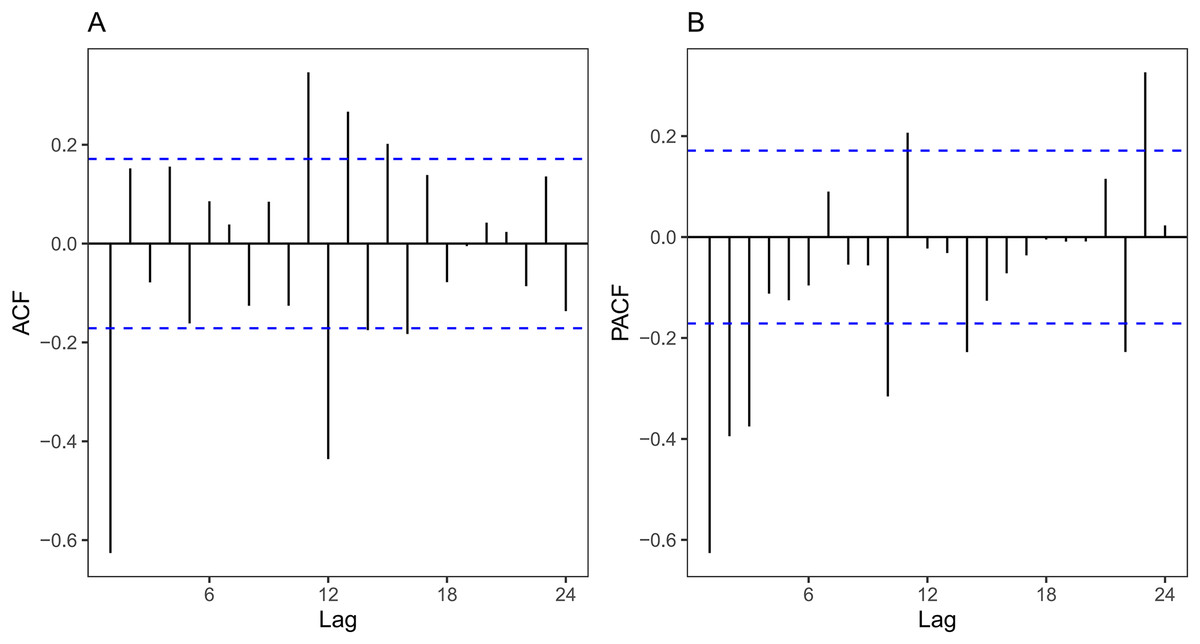
Figure 6: ACF and PACF Plots of differenced pulmonary tuberculosis (PTB) incidence data (2007–2018).
(A) The autocorrelation function (ACF) plot, and (B) the partial autocorrelation function (PACF) plot of the differenced PTB incidence time series from 2007 to 2018. These plots help determine the appropriate autoregressive (AR) and moving average (MA) terms for the SARIMA model by identifying the lags with significant correlations. The blue dotted lines represent the significance thresholds: when the vertical lines fall within the dotted lines, the corresponding autocorrelation or partial autocorrelation is not significantly different from zero, indicating no significant correlation at that lag.| SARIMA model | Model parameters | Ljung-Box (Q) test | |||||||
|---|---|---|---|---|---|---|---|---|---|
| MA1 | SAR1 | SAR2 | SMA1 | SMA2 | AIC | BIC | P | ||
| (0,1,1)(0,1,1)12 | −0.8731 | – | – | −0.7260 | – | 2,717.070 | 2,725.980 | 3.411 | 0.065 |
| (0,1,1)(0,1,2)12 | −0.8726 | – | – | −0.7314 | 0.0080 | 2,719.066 | 2,730.946 | 3.416 | 0.065 |
| (0,1,1)(1,1,1)12 | −0.8728 | −0.0049 | – | −0.7235 | – | 2,719.068 | 2,730.948 | 3.413 | 0.065 |
| (0,1,1)(1,1,2)12 | −0.8685 | −0.6968 | – | 0.1319 | −0.7107 | 2,714.129 | 2,728.978 | 2.022 | 0.155 |
| (0,1,1)(2,1,2)12 | −0.8453 | −0.8222 | −0.3853 | 0.1653 | −0.4198 | 2,708.854 | 2,726.673 | 2.022 | 0.155 |
The SARIMA (0,1,1)(2,1,2)12 model was selected as the best-performing model, with an AIC of 2,708.854 and a BIC of 2,726.673. The Box-Ljung test result ( = 2.022, P = 0.155) confirmed that the residuals of the model were white noise, indicating no significant autocorrelation and a good model fit. This model was subsequently used to forecast PTB incidence from January to December 2019 (Fig. 7 and Table S2).
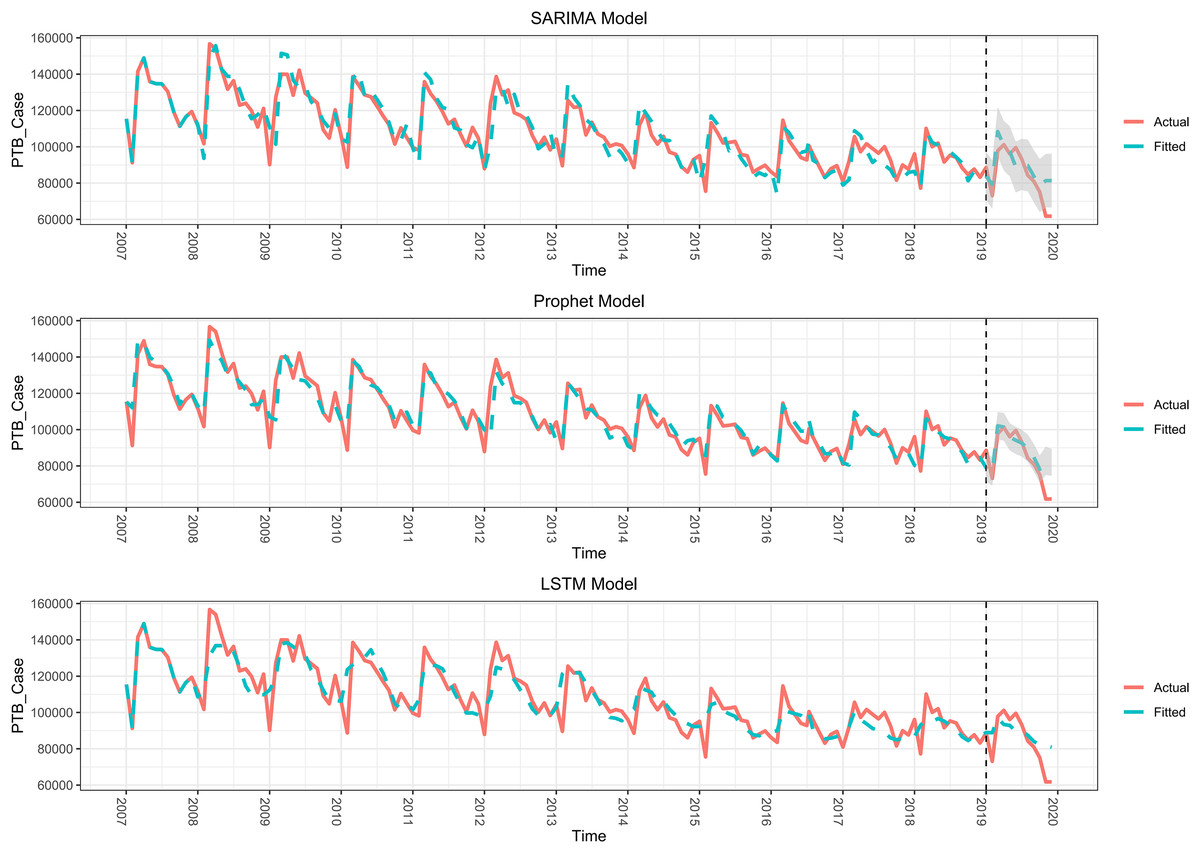
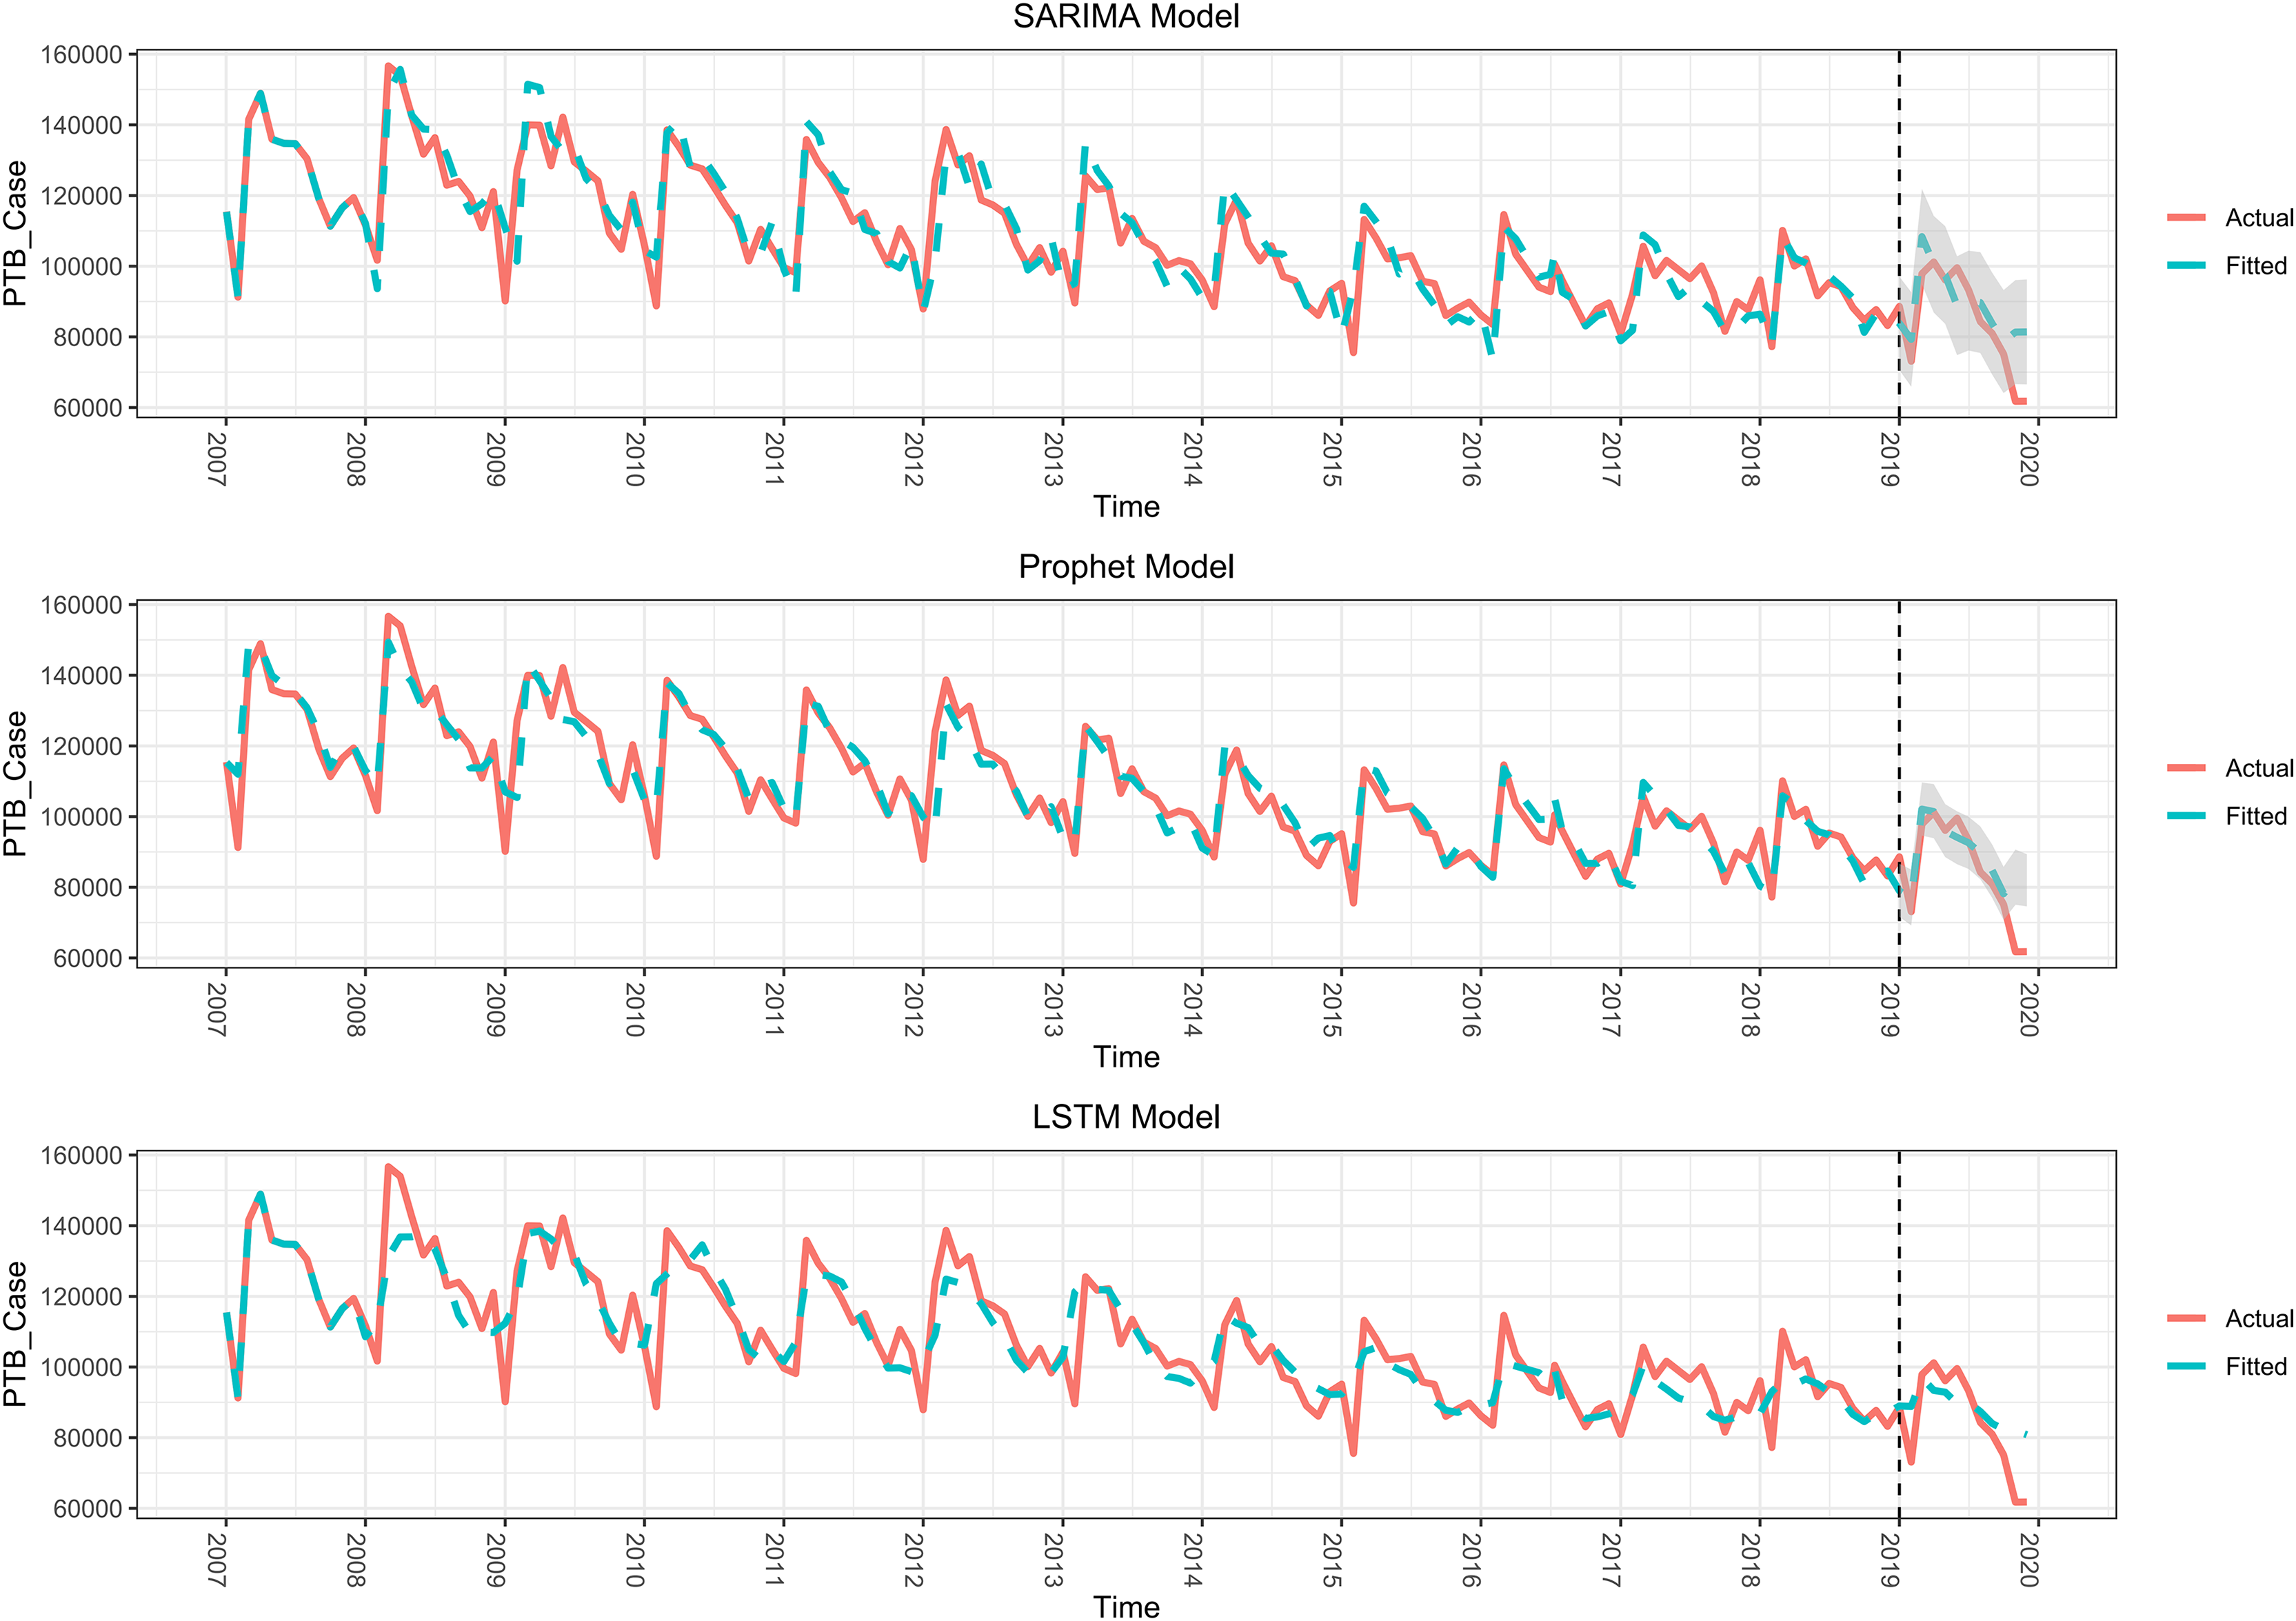
Figure 7: Model fitting and forecasting performance of SARIMA, Prophet, and LSTM Models (2007–2019).
The fitted and forecasted pulmonary tuberculosis (PTB) incidence in China from three different time series models—SARIMA, Prophet, and LSTM—against the actual incidence data. The red line represents the actual PTB cases, while the green line shows the model-fitted values for the pre-COVID-19 period (2007–2019) and the forecasts for 2019. The black dashed line marks the end of the pre-pandemic period. The shaded area represents the 95% confidence interval for the predictions, with a visible range for the SARIMA and Prophet models. However, the confidence interval for the LSTM model is too narrow to be displayed in the figure (details in Table S1). All three models show a good fit with the actual data before 2020, but deviations appear when forecasting for the pandemic period.Prophet model
We constructed a Prophet model using the same monthly PTB incidence data from 2007 to 2018. Prophet was selected for its flexibility in handling time series data with irregularities, as well as its ability to incorporate holiday and seasonality effects. The model incorporated an annual periodicity with multiplicative seasonal effects to account for the clear seasonal trends observed in the TB incidence data.
Model performance was evaluated using key metrics: RMSE, MAE, and MAPE, providing a comprehensive assessment of the goodness-of-fit. These metrics allowed for a direct comparison with the other models. The Prophet model successfully captured both the overall trend and seasonal fluctuations in PTB incidence, demonstrating good fit across all evaluation metrics.
Once trained, the model was applied to forecast PTB incidence for 2019. The predicted values were compared against actual incidence data, and the results, including forecast accuracy, are shown in Fig. 7, Tables 3 and S2. Overall, the Prophet model’s ability to handle complex seasonality patterns and irregularities proved effective in modeling PTB trends.
| Model | ||||
|---|---|---|---|---|
| SARIMA | Prophet | LSTM | ||
| Fitting with raw data from 2007 to 2018 | ||||
| RMSE | 6,430.866 | 5,959.531 | 7,838.875 | |
| MAE | 4,596.061 | 4,074.616 | 5,302.792 | |
| MAPE (%) | 4.348 | 3.826 | 5.054 | |
| Forecasts from Jan. to Dec. 2019 | ||||
| RMSE | 9,642.753 | 9,343.566 | 10,297.872 | |
| MAE | 7,349.507 | 6,448.821 | 7,832.98 | |
| MAPE (%) | 9.892 | 9.035 | 10.681 | |
| Forecasts from Jan. to Nov. 2019 | ||||
| RMSE | 8,153.804 | 7,568.164 | 9,096.35 | |
| MAE | 6,235.123 | 5,177.374 | 6,814.514 | |
| MAPE (%) | 7.907 | 6.850 | 8.851 | |
LSTM model
An LSTM model was developed using the same monthly PTB incidence data from 2007 to 2018. The hyperparameters, including the learning rate, the number of neurons in hidden layers, and the number of training epochs, were optimized through multiple trials to minimize the prediction error, specifically focusing on RMSE.
The initial learning rate was tested within the range of 0.001 to 0.010, the number of neurons in the hidden layers ranged from 10 to 500, and the number of training epochs was varied between 50 and 500. After fine-tuning, the optimal configuration was determined to be a learning rate of 0.005, 300 neurons in the hidden layer, and 100 training epochs. This configuration yielded the lowest RMSE, indicating the highest predictive accuracy.
The optimized LSTM model was then applied to forecast PTB incidence for 2019. The predicted results were compared against the actual incidence data, with performance metrics and comparisons presented in Fig. 7, Tables 3 and S2. The LSTM model’s ability to capture complex non-linear dependencies in the PTB incidence data proved beneficial in modeling long-term trends.
Model fit and forecast performance
All three models—SARIMA, Prophet, and LSTM—provided fits that closely aligned with the actual PTB incidence data from 2007 to 2018 (Fig. 7 and Table S2). The RMSE, MAE, and MAPE values for each model’s fit are presented in Table 3. Among the models, Prophet achieved the lowest MAPE, indicating the best overall fit for the historical data, followed closely by SARIMA.
For cross-validation, we forecasted PTB incidence for 2019 using the fitted models and compared the predicted values to the actual PTB incidence data (Table 4). The forecast errors, as measured by RMSE, MAE, and MAPE, are summarized in Table 3. Prophet once again performed the best, with the lowest MAPE of 9.035%, outperforming SARIMA and LSTM. However, all three models exhibited higher forecast errors for December 2019, with predictions deviating significantly from the actual values. This discrepancy could be linked to the early stages of the COVID-19 outbreak, as December 2019 marks the initial emergence of the virus in China, which may have begun to influence PTB transmission patterns.
| Time | Actual value | SARIMA | Prophet | LSTM | |||
|---|---|---|---|---|---|---|---|
| Predicted value | Relative error (%) | Predicted value | Relative error (%) | Predicted value | Relative error (%) | ||
| Jan-19 | 88,597 | 83,811.72 | −5.40 | 78,971.98 | −10.86 | 88,970.73 | 0.42 |
| Feb-19 | 73,096 | 79,278.94 | 8.46 | 76,735.37 | 4.98 | 88,826.54 | 21.52 |
| Mar-19 | 97,866 | 108,367.48 | 10.73 | 102,106.07 | 4.33 | 96,946.64 | −0.94 |
| Apr-19 | 101,191 | 100,545.76 | −0.64 | 101,423.45 | 0.23 | 93,366.38 | −7.73 |
| May-19 | 96,106 | 97,495.35 | 1.45 | 95,882.78 | −0.23 | 92,888.10 | −3.35 |
| Jun-19 | 99,555 | 88,822.17 | −10.78 | 94,126.23 | −5.45 | 89,652.52 | −9.95 |
| Jul-19 | 93,318 | 90,259.47 | −3.28 | 92,589.99 | −0.78 | 89,943.43 | −3.62 |
| Aug-19 | 84,304 | 89,700.10 | 6.40 | 89,703.81 | 6.41 | 87,408.87 | 3.68 |
| Sep-19 | 80,973 | 83,739.76 | 3.42 | 84,803.38 | 4.73 | 84,006.01 | 3.75 |
| Oct-19 | 75,123 | 78,661.82 | 4.71 | 78,159.34 | 4.04 | 82,368.28 | 9.64 |
| Nov-19 | 61,753 | 81,342.03 | 31.72 | 82,320.68 | 33.31 | 81,986.30 | 32.76 |
| Dec-19 | 61,788 | 81,395.71 | 31.73 | 82,222.74 | 33.07 | 80,824.10 | 30.81 |
Given these findings, we proceed to evaluate how the models performed during the COVID-19 pandemic, when public health measures significantly altered PTB transmission patterns.
Analysis of post-COVID-19 pulmonary tuberculosis patterns
Trends in pulmonary tuberculosis incidence in China (2020–2023)
Following the onset of the COVID-19 pandemic, both the number of PTB cases and the incidence rate in China declined significantly (Fig. 2). In 2019, there were 1,034,760 reported cases, with an incidence rate of 55.55 per 100,000. By 2020, the number of cases had dropped to 876,576 (an incidence rate of 47.76 per 100,000), representing a 15.25% decline in case numbers and a 14.05% reduction in the incidence rate.
This downward trend continued through 2021 and 2022, with the number of cases falling to 828,074 and 712,586, respectively. Correspondingly, the incidence rates declined to 45.37 per 100,000 in 2021 and 39.76 per 100,000 in 2022.
As shown in Table 1, the average annual decline in PTB incidence before the pandemic (2007–2019) was 3.85% in case numbers and 3.68% in incidence rate. During the COVID-19 pandemic (2020–2022), these declines accelerated sharply, averaging 11.58% for case numbers and 10.80% for the incidence rate. This indicates a significant disruption in PTB transmission patterns likely driven by pandemic-related public health measures, such as lockdowns, reduced mobility, and healthcare system strain.
However, in 2023, PTB incidence began to show signs of recovery. Case numbers rose to 773,512, marking an 8.55% increase from 2022, while the incidence rate continued to decline slightly to 37.24 per 100,000, representing a 6.34% decrease. These data suggest a post-pandemic shift in PTB dynamics, where case numbers are starting to rebound, but the overall incidence rate remains below pre-pandemic levels. This divergence may reflect both the lingering effects of COVID-19 on PTB transmission and potential changes in healthcare service availability or case detection rates.
Analysis of post-COVID-19 pulmonary tuberculosis patterns using time series models
To further explore the impact of COVID-19 on PTB incidence, we applied SARIMA, Prophet, and LSTM models to analyze both the pre- and post-COVID-19 periods. First, these models were trained using monthly PTB case data from January 2007 to December 2019, and performance was evaluated using RMSE, MAE, and MAPE. As shown in Fig. 8, Tables 5 and S3, all three models captured the trend in PTB incidence effectively, with RMSE values of 6,660.49 for SARIMA, 6,265.33 for Prophet, and 8,205.52 for LSTM. The MAPE values for SARIMA, Prophet, and LSTM were 4.712%, 4.293%, and 5.628%, respectively, indicating stable pre-pandemic performance.
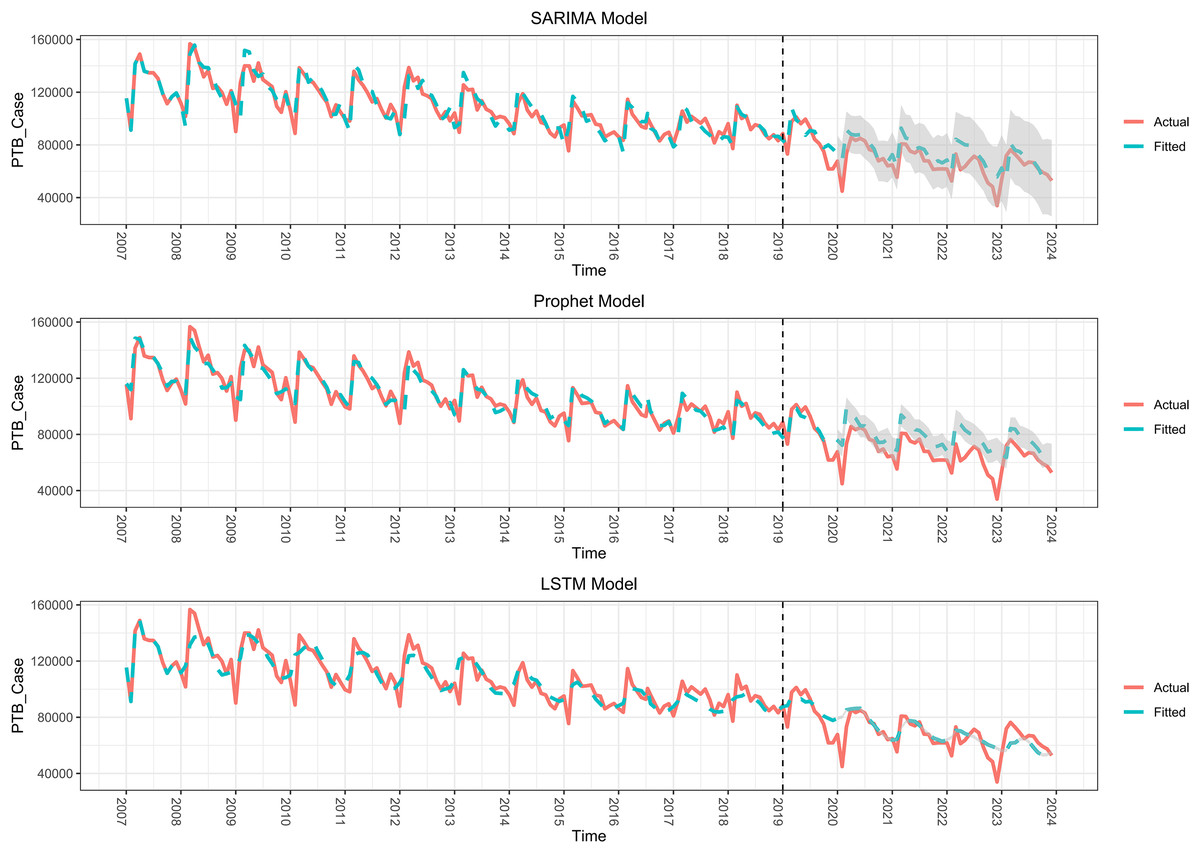
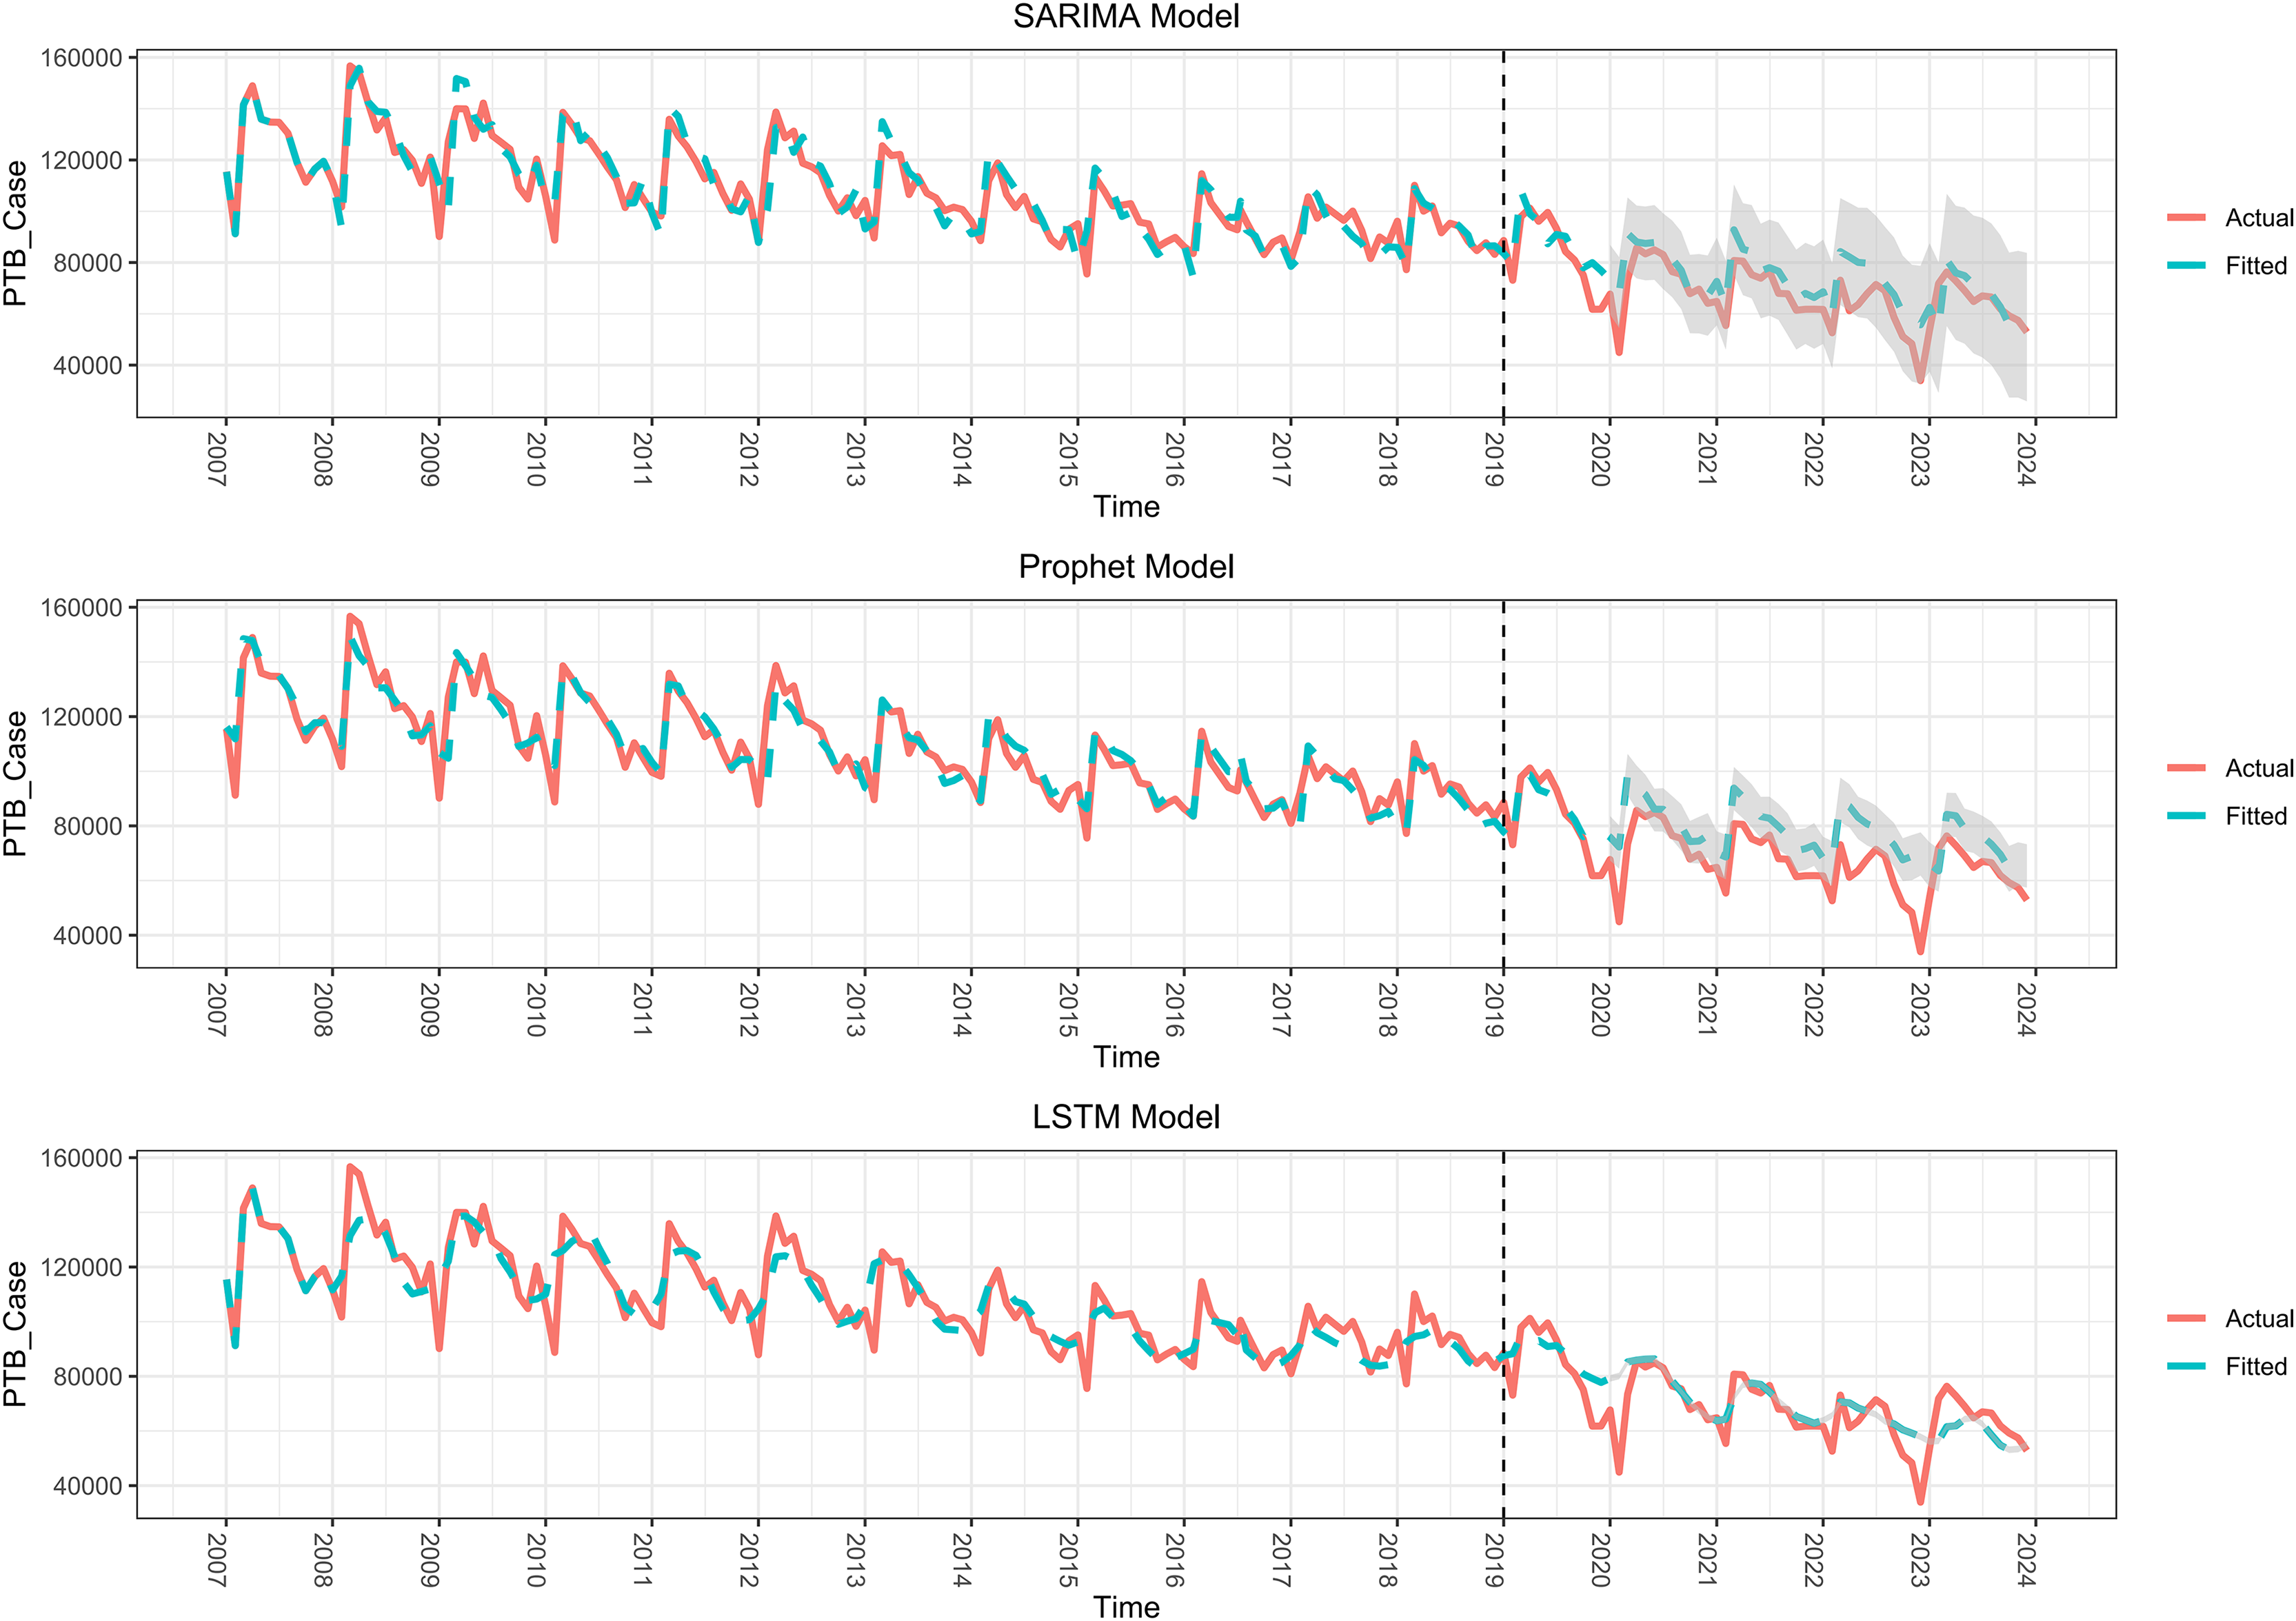
Figure 8: Forecasting performance of SARIMA, Prophet, and LSTM models for pulmonary tuberculosis (PTB) incidence during COVID-19 (2020–2023).
The forecasting performance of SARIMA, Prophet, and LSTM models for PTB incidence during the COVID-19 pandemic from 2020 to 2023. The red line represents the actual PTB cases, while the green line represents the forecasted values from each model. The grey-shaded areas show the 95% confidence intervals for the forecasts, providing a measure of uncertainty around the predicted values. Due to the narrow confidence intervals of the LSTM model, the shading is not visible in the figure (refer to Table S2 for details). The dashed line indicates the end of the pre-pandemic period (2019), with the forecasting period starting in 2020.| Model | ||||
|---|---|---|---|---|
| SARIMA | Prophet | LSTM | ||
| Fitting with raw data from 2007 to 2019 | ||||
| RMSE | 6,660.490 | 6,265.326 | 8,205.523 | |
| MAE | 4,773.484 | 4,364.737 | 5,640.628 | |
| MAPE(%) | 4.712 | 4.293 | 5.628 | |
| Forecasts from 2020 to 2023 | ||||
| RMSE | 8,931.543 | 11,366.453 | 8,773.820 | |
| MAE | 6,866.618 | 13,117.370 | 5,927.995 | |
| MAPE(%) | 11.477 | 19.032 | 10.365 | |
| Forecasts from 2020 to 2022 | ||||
| RMSE | 9,593.856 | 14,068.800 | 8,971.01 | |
| MAE | 7,528.183 | 12,019.408 | 5,676.999 | |
| MAPE(%) | 12.808 | 20.402 | 10.520 | |
| Forecasts from Jan. to Dec. 2023 | ||||
| RMSE | 6,554.660 | 9,719.462 | 8,153.698 | |
| MAE | 4,881.923 | 9,407.580 | 6,680.980 | |
| MAPE(%) | 7.481 | 14.923 | 9.899 | |
Next, the models were used to forecast PTB incidence from January 2020 to December 2023, and the predicted values were compared with the actual data. As shown in Fig. 8, Tables 5 and S3, there were significant deviations between the predicted and actual values during the forecast period. The RMSE, MAE, and MAPE values for the 2020–2023 period were notably higher than those for the pre-pandemic period, indicating a decline in predictive accuracy during COVID-19. This suggests that the pandemic introduced factors not accounted for by the models, such as disruptions in healthcare access and behavioral changes due to COVID-19 containment measures.
To better understand the deviations in PTB incidence patterns before and after the COVID-19 outbreak, we divided the forecast period into two stages: Stage 1 (January 2020 to December 2022) and Stage 2 (January 2023 to December 2023). During Stage 1, all three models exhibited higher RMSE and MAPE values, reflecting greater discrepancies between predicted and actual values during the peak of the pandemic. In contrast, Stage 2 saw a reduction in RMSE and MAPE values, approaching pre-pandemic levels (Tables 3 and 5), suggesting that the predictive performance of the models improved as PTB incidence began to return to pre-pandemic patterns.
Furthermore, we calculated the error values between the predicted and actual PTB incidence for each model across both stages (Fig. 9 and Table S4). Notably, larger fluctuations in error values were observed in Stage 1, particularly in February 2020 and December 2022, where all three models—SARIMA, Prophet, and LSTM—showed peak discrepancies between predicted and actual values.
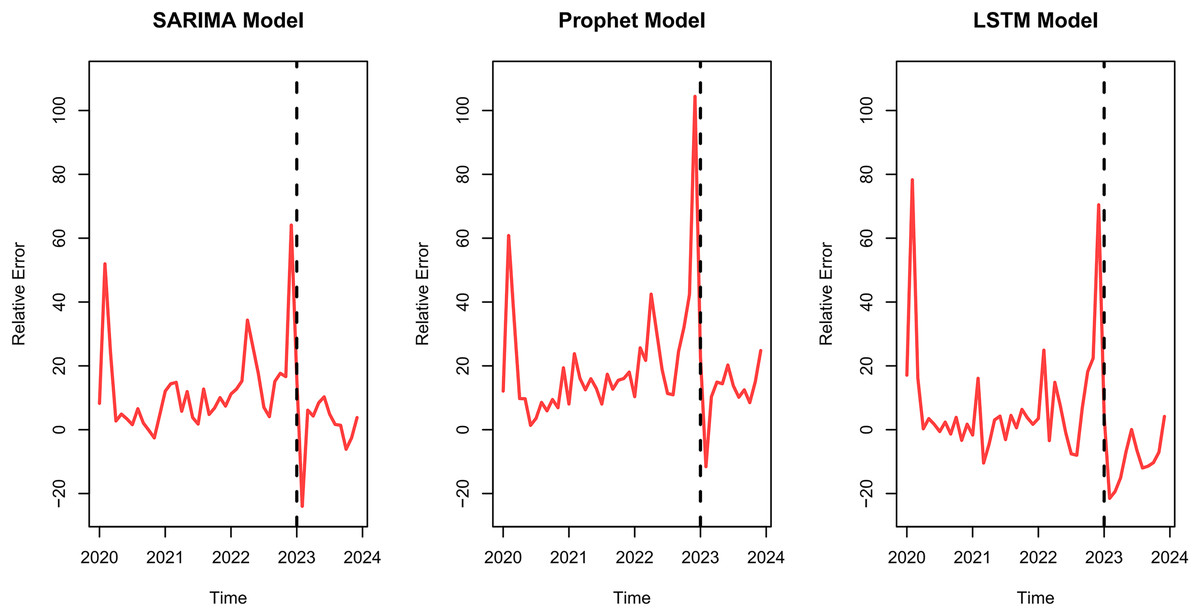
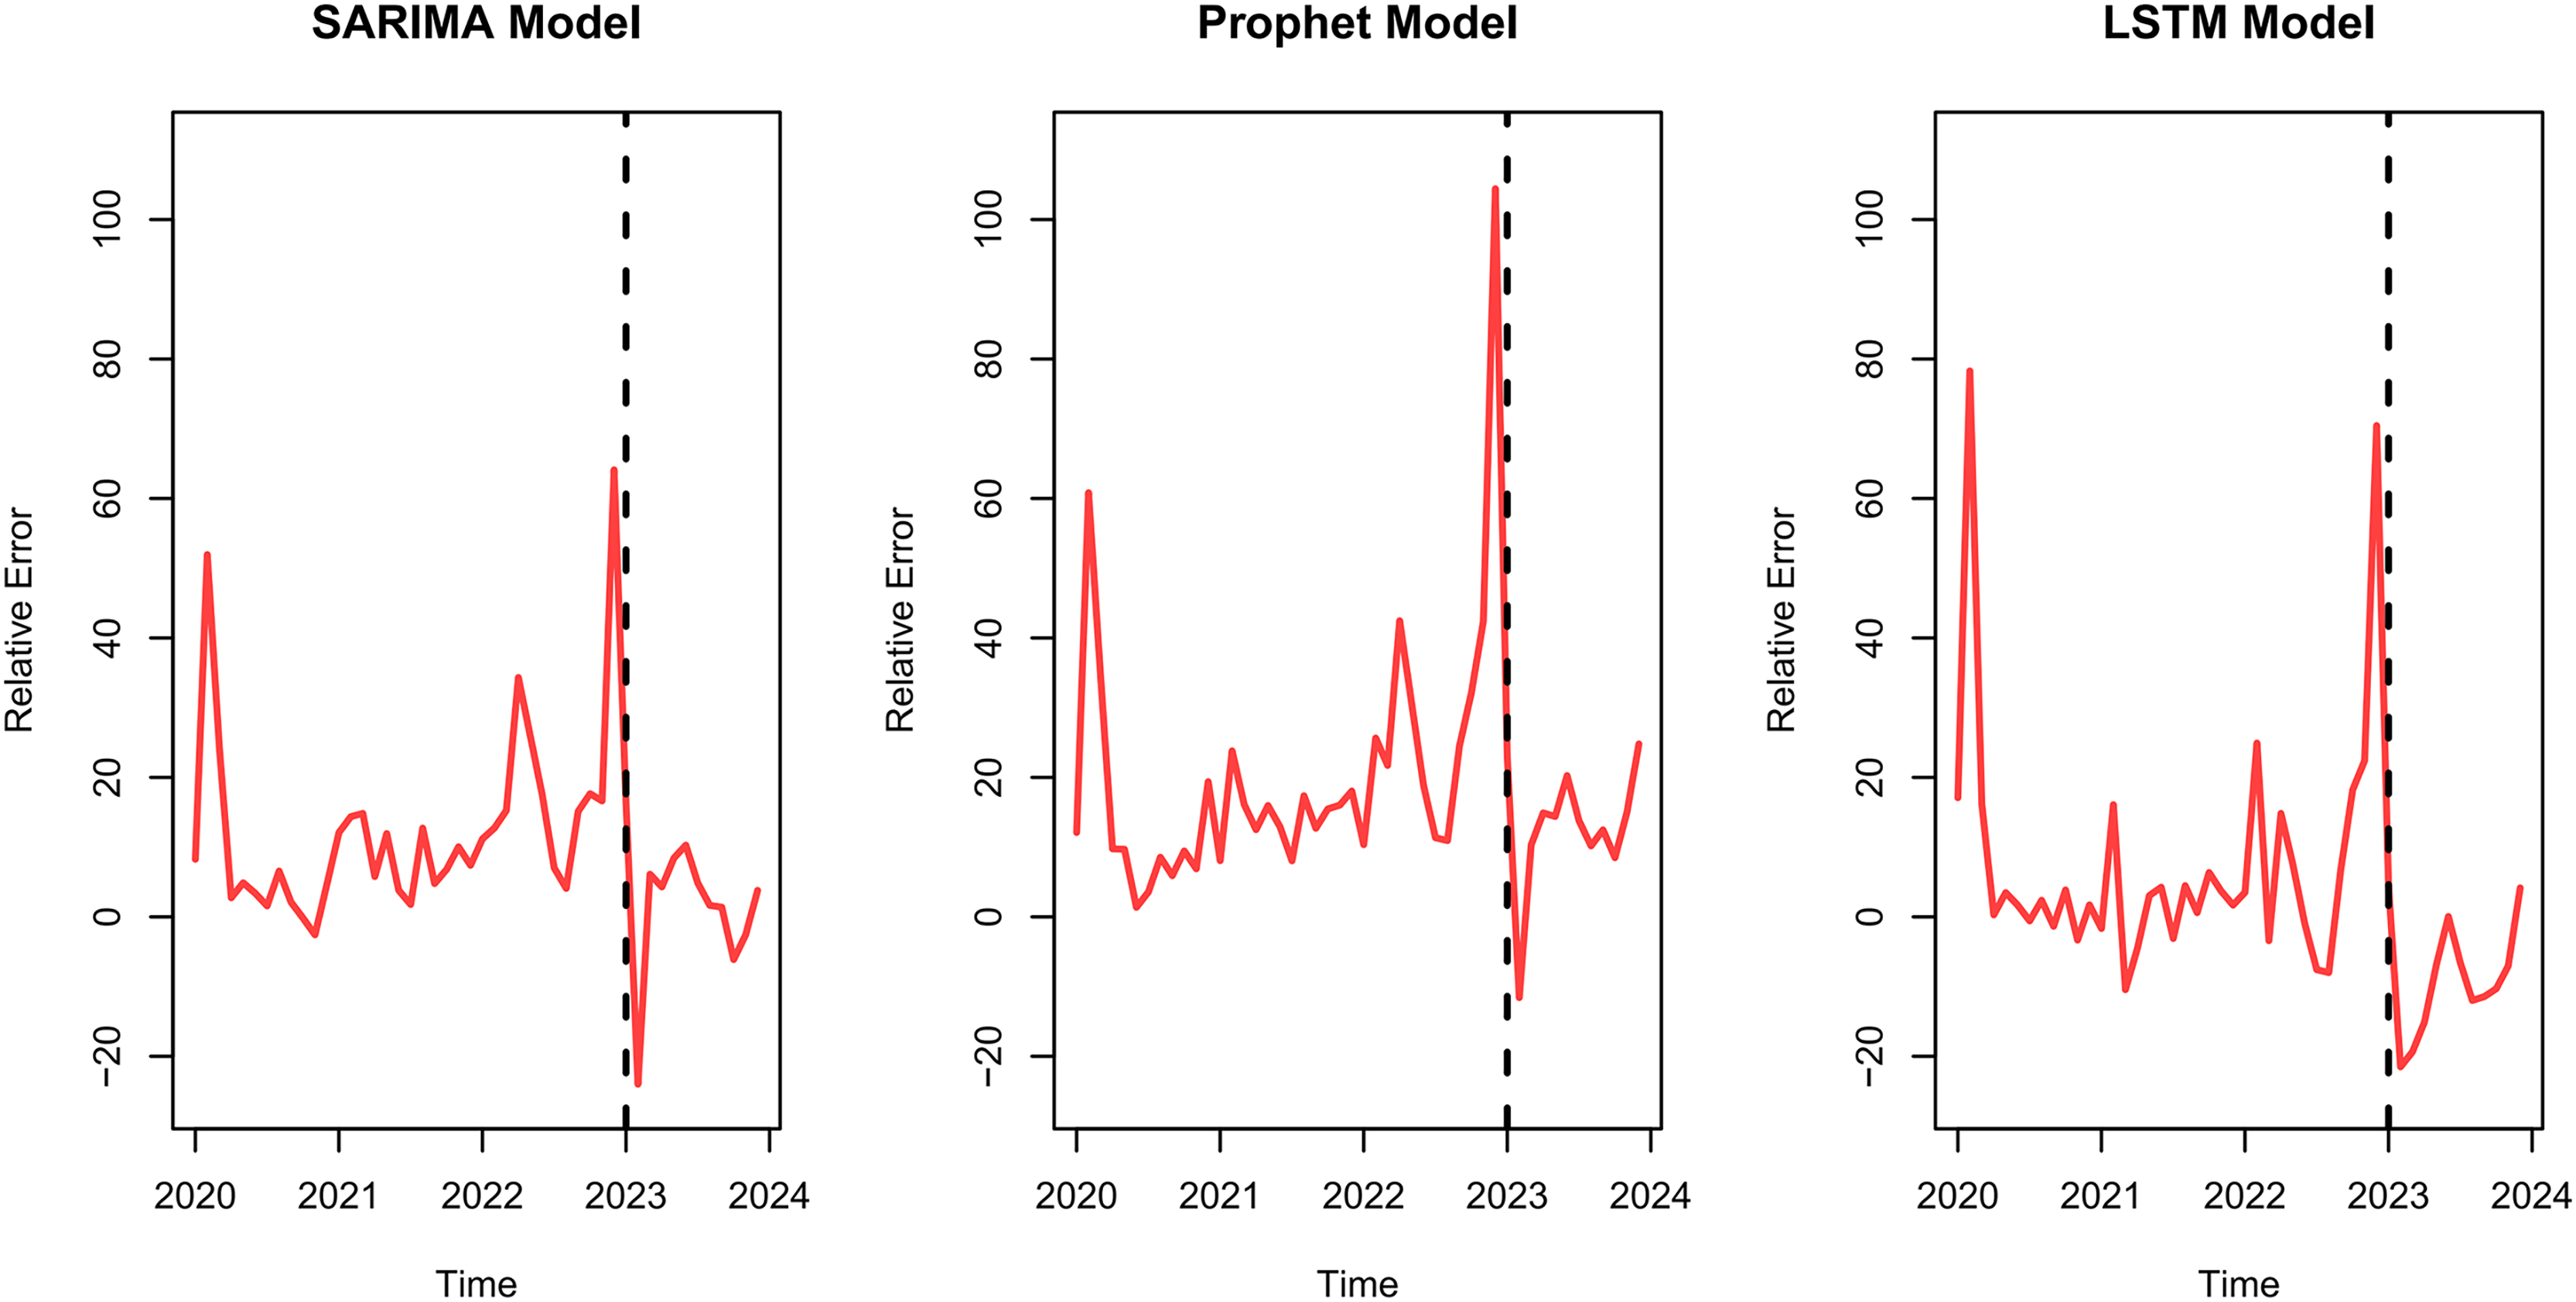
Figure 9: Relative errors of pulmonary tuberculosis (PTB) forecasts in China from January 2020 to December 2023.
The relative errors between the actual and forecasted PTB incidence in China from January 2020 to December 2023 using the SARIMA, Prophet, and LSTM models. The red line represents the relative error (%) for each model, indicating the deviation of the forecasted values from the actual cases. The dashed vertical line marks the transition into 2023, highlighting the post-pandemic period. The relative error peaks observed in all models suggest periods of significant deviation, particularly during 2022 and the transition into 2023, potentially reflecting the impact of the relaxation of COVID-19 control measures on TB reporting and healthcare services.These findings indicate that while PTB incidence patterns were significantly disrupted during the COVID-19 pandemic, they began to stabilize in 2023. The improved performance of the models in Stage 2 suggests that the effects of COVID-19 on PTB transmission may be temporary, and PTB patterns are gradually returning to pre-pandemic norms.
Discussion
Impact of COVID-19 on tuberculosis incidence in China
TB remains a significant public health challenge in China, which is one of the 30 high TB burden countries globally (World Health Organization (WHO), 2023). Despite ongoing efforts, the COVID-19 pandemic introduced new variables into the TB control landscape, disrupting diagnostic and treatment pathways and altering transmission dynamics (Zhou et al., 2023). Public health measures implemented to contain COVID-19, such as lockdowns, social distancing, and enhanced hygiene practices, significantly impacted the transmission of TB and other infectious diseases (Namgung et al., 2023; Song et al., 2022; Tian et al., 2020). A study from Shantou, China, reported that these measures led to a substantial reduction in TB incidence, especially among older adults and certain occupations like agriculture and the unemployed, underscoring the indirect effects of COVID-19 interventions on TB transmission (Su et al., 2024).
This reduction in TB cases during the pandemic is consistent with other studies that have explored the broader impact of COVID-19 on infectious diseases (Li et al., 2023b; Nash et al., 2022). A national-level study in China found that both TB incidence and mortality decreased significantly at the onset of the pandemic (Zhang et al., 2023). However, it remains unclear whether this reduction reflects a true decline in TB transmission or whether it is partly due to delays in diagnosis and interruptions in healthcare services. For example, some findings suggest that healthcare access was restricted during the pandemic, reducing opportunities for TB diagnosis and treatment (Morrison et al., 2023).
As COVID-19 control measures relaxed in 2023, TB incidence began to show signs of recovery, yet the overall incidence rate remained below pre-pandemic levels. This highlights the need for further research into the long-term effects of the pandemic on TB transmission, including how changes in healthcare-seeking behavior and service delivery may have influenced TB trends (Zhou et al., 2023). Studies using time series analysis, such as the one from Guizhou, China, which observed prolonged declines in TB incidence even after the initial COVID-19 wave, suggest that some of the pandemic’s effects on TB transmission may be long-lasting (Zhou et al., 2023).
Pre-COVID-19 PTB patterns and seasonality
Before the COVID-19 outbreak, the incidence of PTB in China exhibited a distinct seasonal pattern, with two notable annual peaks: one in March and a smaller secondary peak in December. This pattern is likely linked to increased human mobility following the “Spring Festival” and a rise in respiratory infections during this period, both of which may facilitate TB transmission. Similar seasonal patterns have been observed in other respiratory diseases, further validating this finding (Wang et al., 2020).
Our results align with previous studies, such as those by Li et al. (2013) and Luo et al. (2014), which emphasized the “Spring Festival Effect” as a key factor influencing TB incidence during these months. The spring peak is positively correlated with rising temperatures, which may enhance the survival of Mycobacterium tuberculosis in aerosols (Wang et al., 2020). This effect is particularly pronounced in areas with cooler spring climates, where the post-winter surge in TB transmission is more evident (Luo et al., 2014).
Conversely, the summer months, particularly June and July, saw a noticeable decline in TB cases. This trend could be attributed to the inhibitory effects of high temperatures on bacterial survival, especially in regions like Xinjiang and Tibet, where temperatures often exceed 37 °C (Wang et al., 2021). Additionally, environmental factors such as air pollutants and varying levels of humidity may further influence the seasonal transmission of TB, as observed in the study by Wang et al. (2021), which found that PM10 concentrations had a significant effect on TB incidence in Shijiazhuang, China.
These findings underscore the importance of understanding the climatic and cultural factors that contribute to the seasonality of TB in China, particularly in the context of public health planning and targeted interventions during high-risk periods.
Post-COVID-19 PTB patterns and disruptions
Initially, we used data from 2007 to 2018 to construct SARIMA, Prophet, and LSTM models to predict the incidence of PTB in 2019. Models with a MAPE between 0% and 10% are considered highly accurate in capturing data trends. The MAPE for the three models ranged from 3% to 6% for fitting and from 6% to 9% for predictions (excluding December 2019, Table 3), indicating strong predictive performance before the onset of COVID-19.
Next, we applied these models (trained on pre-pandemic data) to forecast PTB incidence from January 2020 to December 2023. We observed significant deviations between predicted and actual values, with actual TB incidence markedly lower than predicted, consistent with findings from studies such as Ge et al. (2024), who observed delays in TB diagnosis during the pandemic in Eastern China. This pattern mirrors the results seen in other infectious diseases like hepatitis E and pertussis, where COVID-19 countermeasures significantly reduced transmission (Qin et al., 2024). The time series models revealed substantial deviations, demonstrating the collateral impact of public health interventions for COVID-19 on TB transmission.
Two key policy shifts in China’s COVID-19 response significantly influenced these deviations. First, in January 2020, the Chinese central government implemented emergency control measures, launching a Level-1 public health emergency response across more than 30 provinces. Wuhan was locked down, effectively curbing population movement (The State Council Information Office of the People’s Republic of China, 2020). Second, in December 2022, the National Health Commission downgraded COVID-19 from Category A to Category B, placing it on par with TB in terms of prevention and control, signaling the post-pandemic transition (National Health Commission of the People’s Republic of China, 2022). Our analysis shows that the prediction deviations were largest during the strictest COVID-19 measures (2020–2022), particularly during Wuhan’s lockdown and the policy shift in December 2022. These large deviations can be attributed to disruptions in TB diagnosis and reporting, delayed healthcare access, and reduced TB service capacity, as also highlighted by Zhang et al. (2022) in their study on TB services in Tianjin. Xie et al. (2022) similarly noted that diagnostic delays during the pandemic led to missed or delayed TB diagnoses.
Interestingly, our models indicated smaller prediction errors during May 2020 to November 2022, reflecting a reduction in the disruptive effects of the pandemic on TB transmission as public health measures became more normalized. The error peaks in February 2020 and December 2022 correspond with the early lockdown phase and the major policy transition, highlighting periods where TB control efforts were most disrupted.
Post-2023, as COVID-19 management moved to Category B and restrictions were relaxed, TB cases rebounded, surpassing model predictions. The relaxation of strict COVID-19 measures, the restoration of routine healthcare services, and the identification of delayed TB cases likely contributed to this resurgence. Similar findings were reported by Li et al. (2023a), who noted a rebound in TB incidence as healthcare services normalized after the pandemic. Our analysis confirms that the temporary impact of COVID-19 on TB transmission has begun to reverse, with PTB incidence gradually returning to pre-pandemic levels.
Overall, these findings suggest that the effects of COVID-19 on TB transmission in China may have been temporary, with the TB incidence pattern stabilizing as healthcare services resumed normal operations. As highlighted by Wang et al. (2021), ongoing vigilance is necessary to ensure that future disruptions to TB services are minimized.
Limitations and future directions
While this study provides valuable insights into the impact of COVID-19 on TB trends in China, several limitations should be acknowledged. First, the primary limitation is that we only used case numbers and incidence rates as quantitative measures of COVID-19’s impact on TB. This approach did not directly account for additional sociological factors, such as healthcare accessibility, public health system disruptions, and changes in population behavior during the pandemic. Future studies could benefit from incorporating a broader set of indicators, including health service availability and access, diagnostic delays, and population movement, using multivariate time series models to provide a more comprehensive understanding of these dynamics.
Second, our analysis focused on the national level, which may obscure regional disparities. Areas with high TB burdens, such as Xinjiang and Tibet, may have experienced the pandemic’s effects on TB transmission differently. Future research should aim to investigate these localized impacts, allowing for more tailored public health interventions. As noted in the studies by Zhang et al. (2023) and Fei et al. (2020), the pandemic may have exacerbated regional inequalities in healthcare access, further affecting TB outcomes.
Third, as with the studies by Zhang et al. (2023) and Fei et al. (2020), the study is limited by potential underreporting and delays in diagnosis during the pandemic. The reduction in reported TB cases during the pandemic may reflect not only reduced transmission but also disruptions in TB services, such as delayed or missed diagnoses, as patients may have avoided healthcare facilities due to COVID-19-related fears. Thus, this study cannot definitively distinguish between a true decrease in TB transmission and a decline in diagnosis and reporting.
Regarding the time series models, the evaluation of models pre-COVID-19 (with the 2007–2018 data as the training set and 2019 as the validation set) indicated that the Prophet model had the lowest MAPE, demonstrating the best overall performance for fitting and forecasting. While both SARIMA and LSTM models performed well in capturing TB trends in China, the SARIMA model required a more complex modeling process and parameter selection. The LSTM model, though advantageous in capturing long-term dependencies, was prone to overfitting, especially on smaller datasets, limiting its generalization capacity. Additionally, LSTM models may encounter irregularities, such as sudden interruptions in data patterns caused by external factors like the COVID-19 pandemic, due to their heavy reliance on historical data for predicting future trends (Chen et al., 2024). In contrast, the Prophet model proved more efficient by automatically capturing seasonality and trend parameters and offering superior performance with a simpler modeling process.
The optimization of LSTM models has been a key factor in improving prediction accuracy for various infectious diseases, including COVID-19 and TB. For instance, Sembiring, Wahyuni & Sediyono (2024) reported significant improvements in model performance when adjustments were made to the output gates and hidden states. Our study similarly benefited from fine-tuning LSTM parameters, which allowed it to model non-linear dependencies more effectively. This is consistent with findings by Wahyuni et al. (2022), who demonstrated that LSTM models generally outperform SARIMA and Prophet when larger datasets are available. Despite its complexity, the LSTM model in our study provided robust results, validating the use of advanced neural networks for time series forecasting. However, given Prophet’s performance in this study, future research could explore its application for predicting other infectious diseases in China.
As TB control strategies continue to evolve in the post-pandemic era, time series models will remain crucial in forecasting disease trends and guiding public health interventions. This study also highlights the importance of developing adaptive healthcare systems that can swiftly respond to external shocks, such as pandemics, ensuring minimal disruption to critical disease control efforts.
Conclusions
Our study demonstrates that while the COVID-19 pandemic introduced a significant, albeit temporary, disruption to TB incidence in China, long-term TB trends are expected to return to pre-pandemic levels as healthcare systems stabilize and public health interventions continue. The pandemic-induced decline in reported TB cases, as observed in 2020–2022, was largely influenced by public health measures such as lockdowns and healthcare system strain. However, as these measures were lifted and healthcare services were restored, TB incidence began to rebound in 2023, although the incidence rate remains slightly below pre-pandemic levels.
The application of time series models—SARIMA, Prophet, and LSTM—proved effective in predicting TB trends, with the Prophet model demonstrating the highest predictive accuracy. This study’s findings emphasize the utility of the Prophet model in real-time monitoring and public health planning, particularly during the post-pandemic recovery phase. As TB incidence stabilizes, continued surveillance using time series models will be critical for early detection of outbreaks. These results also underline the importance of developing adaptable healthcare systems capable of rapidly responding to external shocks like pandemics, ensuring minimal disruption to essential disease control efforts. Additionally, the temporary impact of COVID-19 on TB transmission indicates that models like Prophet could be pivotal in preparing for similar disruptions in the future.
While the LSTM model showed potential, its performance was limited by overfitting on smaller datasets, indicating that LSTM models may require larger datasets for optimal performance. Future research could focus on optimizing LSTM parameters to enhance its accuracy in predicting non-linear trends in infectious diseases.
As TB incidence stabilizes post-pandemic, continuous monitoring and the application of time series models will be critical in guiding evidence-based strategies for TB control in China and globally. Future research should focus on improving predictive accuracy by incorporating additional sociological and healthcare-related factors, and exploring regional disparities in TB incidence. The evolving nature of public health challenges requires adaptive healthcare systems that can swiftly respond to disruptions while ensuring minimal impact on essential disease control efforts.
