
Genetic diversity of the Khorat snail-eating turtle (Malayemys khoratensis) in Thailand
- Published
- Accepted
- Received
- Academic Editor
- Viktor Brygadyrenko
- Subject Areas
- Conservation Biology, Genetics, Zoology, Population Biology
- Keywords
- Genetic diversity, Malayemys khoratensis, Mitochondrial DNA, Isolation-by-basin, Bayesian skyline plot, Haplotype network
- Copyright
- © 2024 Chaianunporn et al.
- Licence
- This is an open access article distributed under the terms of the Creative Commons Attribution License, which permits using, remixing, and building upon the work non-commercially, as long as it is properly attributed. For attribution, the original author(s), title, publication source (PeerJ) and either DOI or URL of the article must be cited.
- Cite this article
- 2024. Genetic diversity of the Khorat snail-eating turtle (Malayemys khoratensis) in Thailand. PeerJ 12:e18699 https://doi.org/10.7717/peerj.18699
Abstract
Introduction
Malayemys khoratensis is a freshwater turtle species endemic to northeastern Thailand and Lao PDR. While M. khoratensis is relatively common and widespread in Thailand, its population size and demographic trends remain largely unknown, as direct population estimates are lacking. This species faces significant threats from consumption, exploitation, and trade. Therefore, this study aims to investigate the genetic diversity, population structure, and demographic trends of M. khoratensis in northeastern Thailand, using two mitochondrial DNA genes, Cyt b and ND4.
Method
We grouped the turtles based on three major river basins in northeastern Thailand: Mun, Chi, and Northeast Mekong to assess population structure and test the isolation-by-basin hypothesis. The Cyt b and ND4 genes of 49 M. khoratensis individuals across 15 provinces in Thailand were sequenced, and 15 sequences from a previous study of Ihlow et al. (2016) were included into the analyses. We constructed a haplotype network from the concatenated sequences and analyzed the population structure with the analysis of molecular variance (AMOVA). Additionally, we used a Bayesian Skyline plot (BSP) analysis to estimate the effective female population size and explore the demographic history of this species.
Results
Our analysis identified 13 unique haplotypes defined by 26 polymorphic sites from 64 samples. The total haplotype diversity for M. khoratensis was 0.819, while nucleotide diversity was 0.0031. The haplotype network and AMOVA revealed no distinct population structure among the river basins, suggesting gene flow across these regions. The BSP estimated a stable effective female population size of approximately 130,000 individuals since around 100,000 years ago (late Pleistocene).
Conclusion
Our findings indicated no significant population structure by river basin, which may be due to natural movement between basins or potential human-mediated translocations linked to the turtle trade. The demographic trend of M. khoratensis appears to have been stable over time. However, given the ongoing exploitation of this species, we recommend regular monitoring of population trends to support its long-term survival.
Introduction
Malayemys is an endemic freshwater turtle genus in Southeast Asia (Bonin, Devaux & Dupré, 2006; Brophy, 2004, 2005; Dawson et al., 2018; Dawson, Ihlow & Platt, 2020; Platt et al., 2022). Three species of Malayemys are known in this region: Malayemys subtrijuga (Schlegel & Müller, 1845) Malayemys macrocephala (Gray, 1859) and Malayemys khoratensis (Ihlow et al., 2016). Malayemys khoratensis is distributed across the upper Mun River Basin (shown in purple in Fig. 1), Chi River Basin (green in Fig. 1) and Northeast Mekong River Basin (brown in Fig. 1) in northeastern Thailand and Lao PDR (Ihlow et al., 2016; Sumontha et al., 2016; Platt et al., 2022; Chaianunporn et al., 2024). This species is highly endemic to northeastern Thailand (the Khorat Plateau, which includes the Mun, Chi, and Northeast Mekong River Basins), as well as to the Mekong River Basin in Laos.
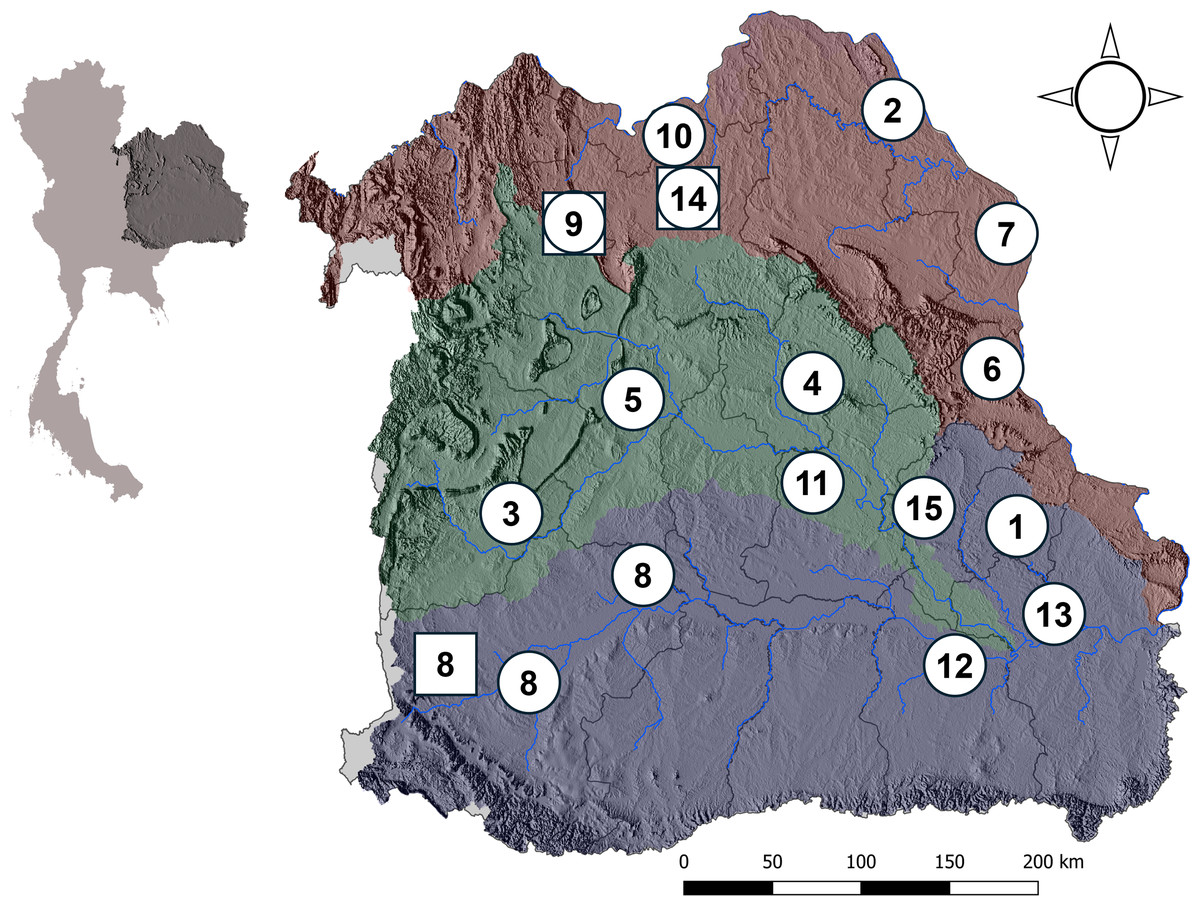
Figure 1: Map of basins in northeastern Thailand.
This figure illustrates three distinct river basins in northeastern Thailand which are the sampling sites for M. khoratensis: (1) Mun Basin (purple), (2) Chi Basin (green) and (3) northeast Mekong Basin (brown). The map highlights the province boundaries (dark lines) and major hydrological features of each basin (blue lines). The circles and squares represent sampling locations, with circles indicating samples from this study and squares indicating those from Ihlow et al. (2016). Numbers correspond to provinces: 1. Amnat Charoen, 2. Bueng Kan, 3. Chaiyaphum, 4. Kalasin, 5. Khon Kaen, 6. Mukdahan, 7. Nakhon Phanom, 8. Nakhon Ratchasima, 9. Nong Bua Lam Phu, 10. Nong Khai, 11. Roi Et, 12. Sisaket, 13. Ubon Ratchathani, 14. Udon Thani and 15. Yasothon. An inset map of Thailand is included in the upper corner to show the relative position of the river basins within the country.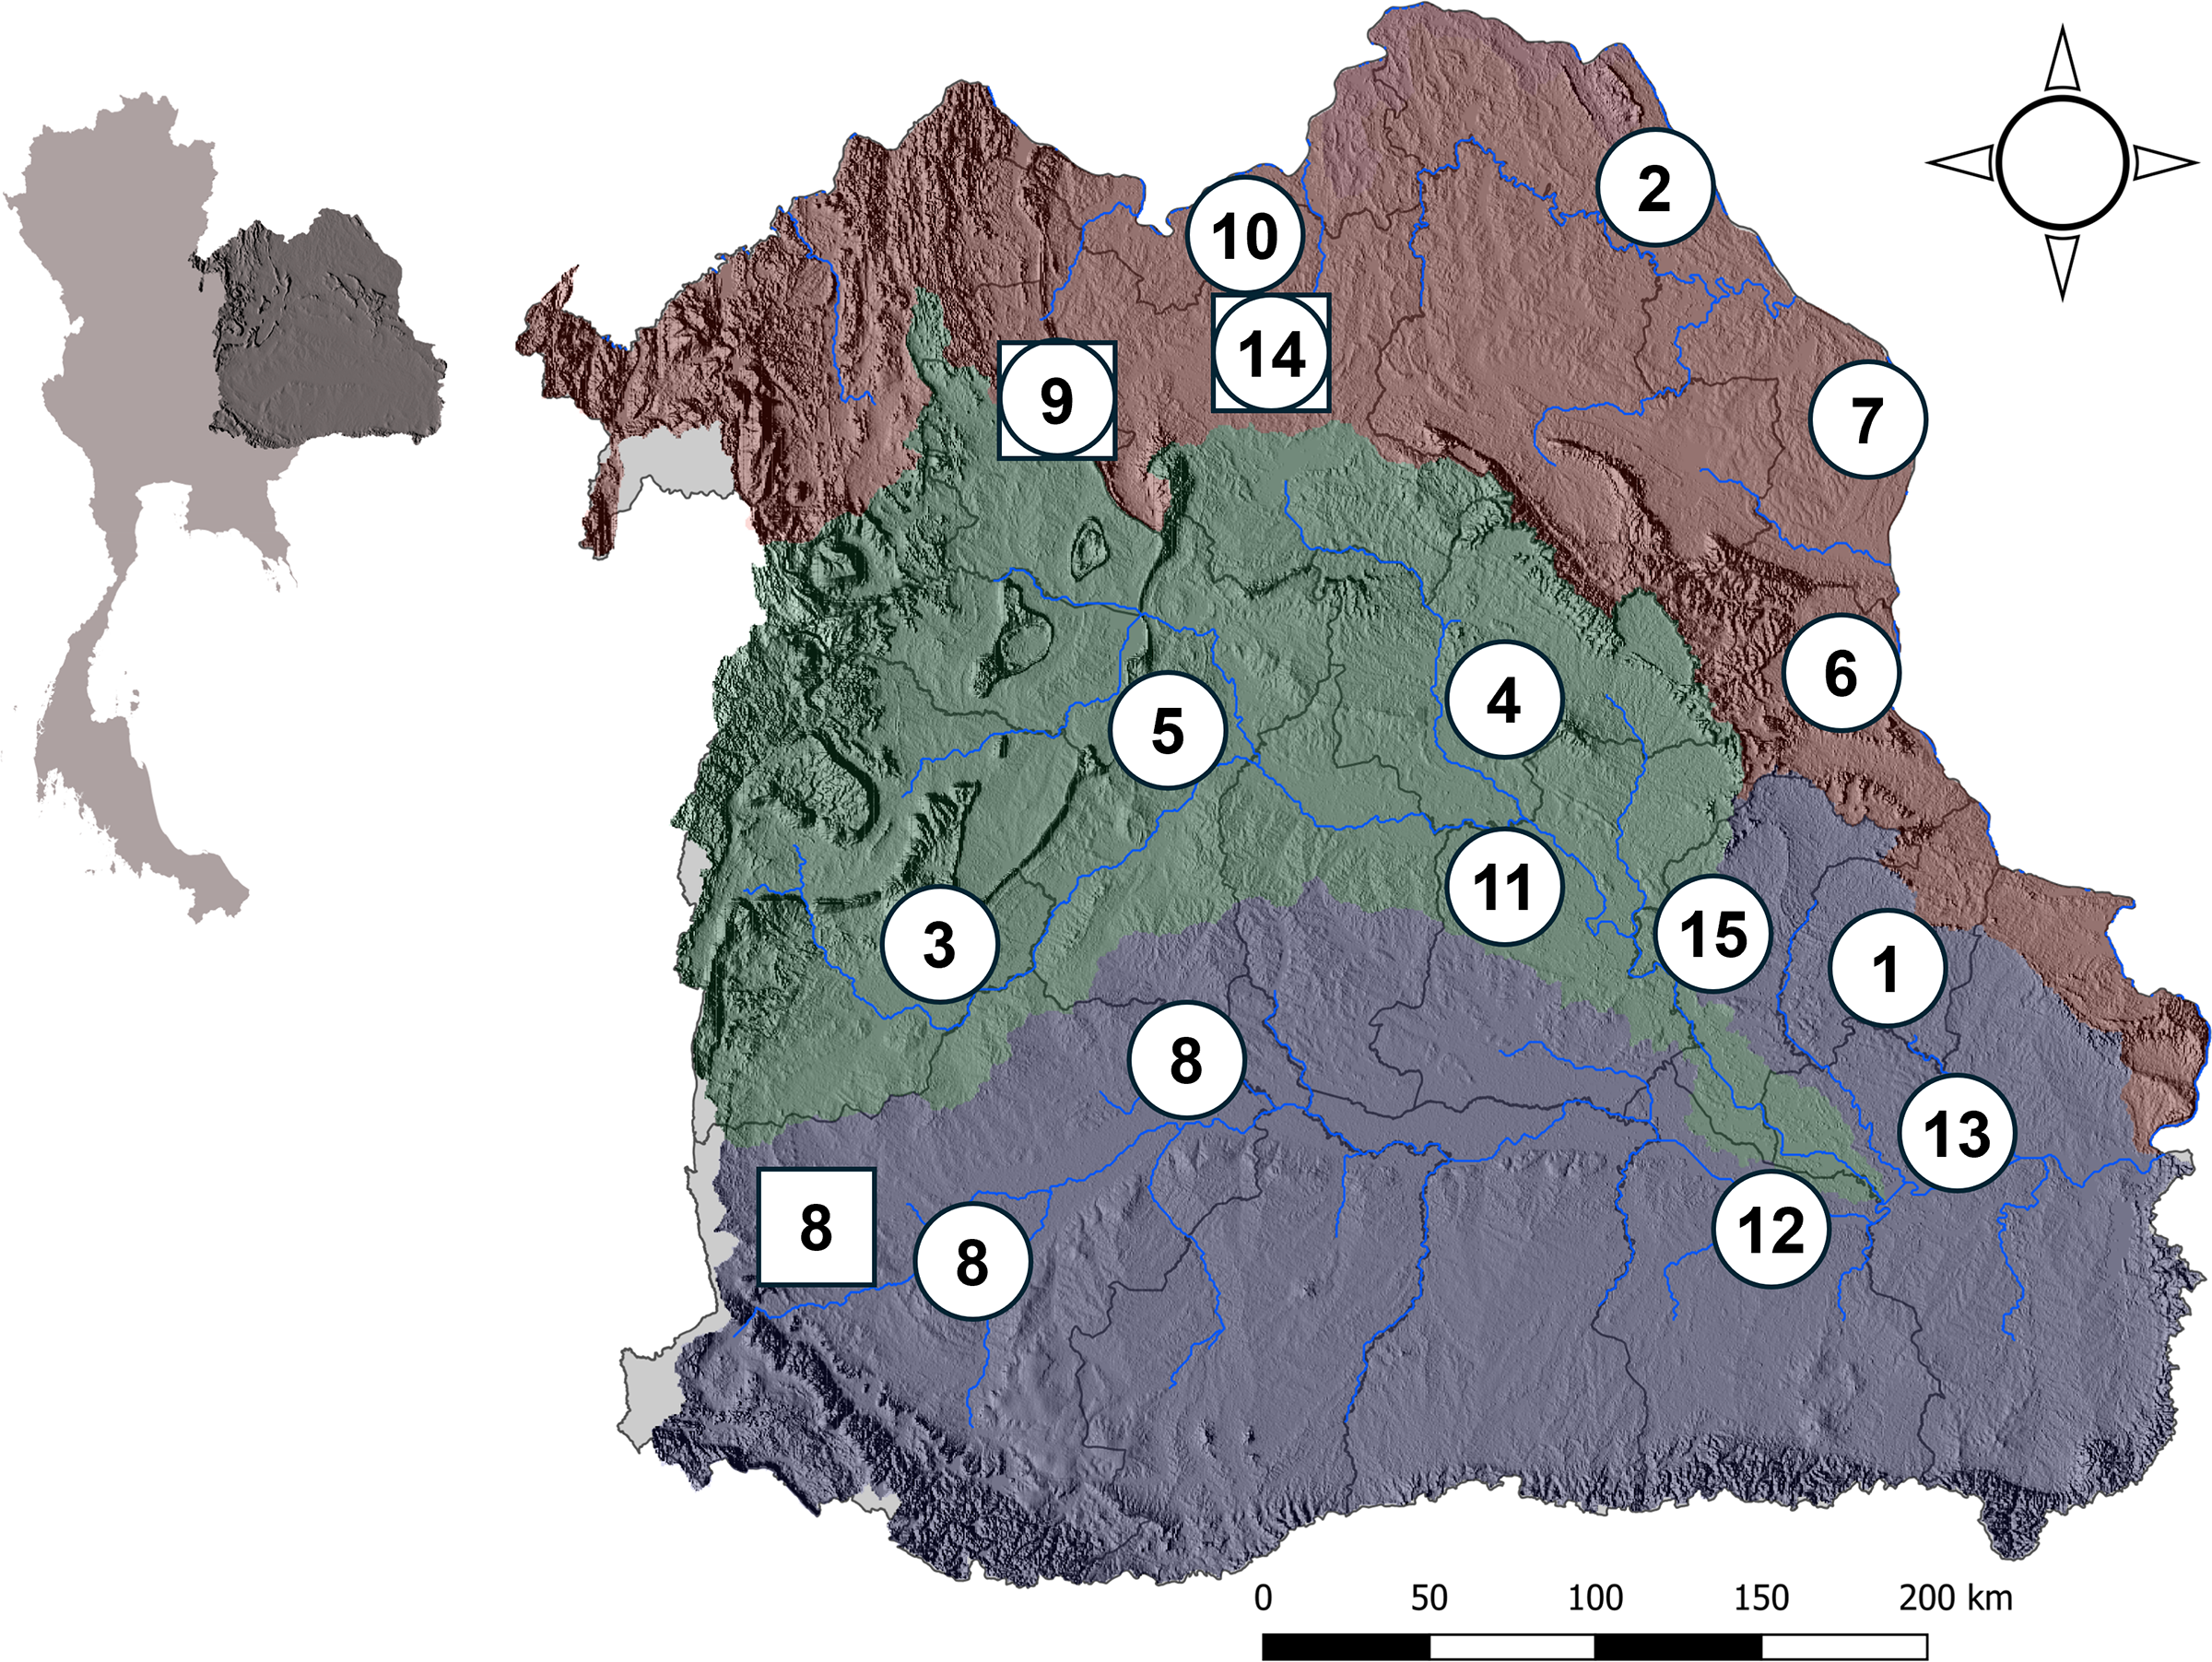
According to the isolation-by-basin hypothesis, river basins can serve as natural geographic and ecological grouping criteria, acting as significant barriers that shape genetic structure by restricting gene flow between populations (Vargas-Ramírez et al., 2007; Todd et al., 2013; Todd, Blair & Jerry, 2014; Bouchard, Tessier & Lapointe, 2019). Since M. khoratensis primarily inhabits lentic waters in lowland areas, mountain ranges may restrict its movement and gene flow. The Phetchabun and Phu Phan Mountains, which separate the Mekong Basin from the Chi and Mun Basins, are also expected to create natural barriers that could isolate populations of M. khoratensis.
Northeastern Thailand has supported human settlements and agriculture since at least 3,500 years BP as evidenced by various archaeological sites (Higham, 2011; Higham, Higham & Douka, 2014; Higham, Douka & Higham, 2015; Peters et al., 2022). Human activities in northeastern Thailand, both historically and presently, may have influenced this turtle population in two ways. Intensive habitat conversion from forests to agricultural areas, such as rice fields and ponds, may have created favorable conditions for M. khoratensis, potentially promoting its population growth. Conversely, M. khoratensis might have been exploited by early human inhabitants, as turtle remains have been found at multiple Southeast Asian archaeological sites (Conrad, 2015; Bochaton et al., 2023; Higham & Kijngam, 2023). Even today, M. khoratensis and its congeners continue to be consumed and exploited by local communities in Mainland Southeast Asia (Dawson et al., 2018; Dawson, Ihlow & Platt, 2020; Platt et al., 2022). All Malayemys turtle species are threatened by local consumption of turtles and their eggs, use in traditional medicine, and capture and trade for merit release in traditional and Buddhist ceremonies, where practitioners purchase captive turtles and release them as an act believed to earn karmic merit for future lives (Dawson et al., 2018; Dawson, Ihlow & Platt, 2020; Platt et al., 2022). This ongoing exploitation may have limited the turtle’s population size.
Even though M. khoratensis is relatively common and widespread in Thailand, its population size and demographic trend remains entirely unknown due to the absence of direct estimates of population size. M. khoratensis is currently categorized as Least Concern (LC), but its population trend is unknown according to the IUCN Red List (Cota, 2021), and in Appendix II by the Convention on International Trade in Endangered Species (CITES, 2024). In Thailand, only M. subtrijuga and M. macrocephala are protected under Thailand’s Wild Animal Conservation and Protection Act, B.E. 2562 (2019), while M. khoratensis remains unprotected despite facing similar threats.
In the context of conservation, genetic data may help uncovering population structure, gene flow, connectivity among populations, demographic history and population viability in turtles (Mockford et al., 2006; Buchanan et al., 2019; Jordan et al., 2019; McCluskey et al., 2022; Guinto et al., 2023; Kumar et al., 2024). These insights provide essential tools for studying population connectivity, estimating population sizes, and evaluating the potential origin which are critical for informing management strategies (Escalona et al., 2009; Pineda-Catalan et al., 2012; Schmidt et al., 2018; Buchanan et al., 2019; Bouchard, Tessier & Lapointe, 2019; McCluskey et al., 2022; Moreno et al., 2022; Kumar et al., 2024). In addition, genetic data help identify specific populations or areas that should be prioritized for protection and enhance our understanding of current threats to species survival, such as hybridization or low genetic diversity.
In this study, we collected M. khoratensis samples from across the entire distribution range of this species in northeastern Thailand (Isan) reported in Chaianunporn et al. (2024). To test the isolation-by-basin hypothesis in its population structure, we divided the turtle samples into three groups based on the northeastern Thailand river basins: the Mun, Chi, and Northeast Mekong (referred to here as the Mekong) Basin (Office of the National Water Resources Thailand, 2021). The genetic diversity and population structure of M. khoratensis in northeastern Thailand were examined using two Mitochondrial DNA (mtDNA) genes, Cyt b and ND4. Mitochondrial DNA sequences are important molecular markers for studying animal genetic diversity and phylogeography due to their high mutation rate, absence of recombination, haploid and maternal inheritance, and relatively conserved overall structure (Freeland, Kirk & Petersen, 2011 but see Galtier et al., 2009). Furthermore, direct population size estimation of M. khoratensis is challenging due to its elusive nature and scattered distribution across a wide range which makes traditional population counting methods impractical. Therefore, we used a Bayesian Skyline plot (BSP) as an alternative approach to infer population trends and estimate demographic history. Understanding M. khoratensis genetic diversity and population structure can provide important information for effective freshwater turtle conservation and management plans for this species in Thailand.
Materials and methods
Animal ethics
The study was permitted (DF. 16/2561, DF.27/2562 and DF.1/2566) by the Department of Fisheries, Ministry of Agriculture and Cooperatives, Thailand, and the protocol was approved by the Committee on the Ethics of Animal Experiments of Khon Kaen University (permit numbers: ACUC-KKU-24/61, ACUC-KKU-85/62 and ACUC-KKU-84/66). All animal handling was in accordance with accepted wildlife husbandry standards of American Society of Ichthyologists and Herpetologists (American Society of Ichthyologists and Herpetologists, 2004).
Study area, survey, and sampling
Northeastern Thailand, known as Isan, is a large, semi-arid region covering approximately one-third of the country’s land area (about 170,000 km2; Keyes, 1967). It is bordered by the Mekong River and Laos to the north and east, and by Cambodia to the south, and the western side is separated from central and eastern Thailand by the Sankamphaeng and the Phetchabun Range. The region’s landscape is predominantly a mix of low-lying plains and gently rolling hills, with some higher mountain ranges, such as the Phu Phan and Phetchabun Mountains. The region has three major river basins—the Chi, Mun and Mekong. The Chi and Mun River flow eastward across the region and ultimately drain into the Mekong River (Fig. 1).
From 2018 and 2023, we conducted 20 field surveys across 20 provinces in northeastern Thailand during the rainy season (June to October) and the cool, dry season (November to February), periods when Malayemys turtles are most active (Dawson et al., 2018; Dawson, Ihlow & Platt, 2020). In each province, we engaged with local fishermen and visited local markets to collect samples. Samples were obtained directly from fishermen or residents when available, or they informed us of turtle captures at a later time. All turtles were captured by hand or fish traps from rice fields, ponds, natural wetlands, or irrigation canals that they inhabit during the rainy season. Turtles were identified to species based on morphological characteristics described by Ihlow et al. (2016). In our surveys we found 49 M. khoratensis across 15 provinces in Thailand (Amnat Charoen, Bueng Kan, Chaiyaphum, Kalasin, Khon Kaen, Mukdahan, Nakhon Phanom, Nakhon Ratchasima, Nong Bua Lam Phu, Nong Khai, Roi Et, Sisaket, Ubon Ratchathani, Udon Thani and Yasothon). We also included sequences from GenBank (accession numbers provided in Table S1) from the prior study by Ihlow et al. (2016), which reported 15 M. khoratensis individuals from three provinces: Nakhon Ratchasima, Nong Bua Lam Phu, and Udon Thani. Our turtle sequence samples encompass all three river basins in Thailand where M. khoratensis is found. This includes 14 samples from the Mun Basin (Amnat Charoen, Nakhon Ratchasima, Sisaket, and Ubon Ratchathani), comprising nine samples from this study and five from Ihlow et al. (2016); 34 samples from the Chi Basin (Chaiyaphum, Kalasin, Khon Kaen, Roi Et, and Yasothon); and 16 samples from the Mekong Basin (Bueng Kan, Mukdahan, Nakhon Phanom, Nong Bua Lam Phu, Nong Khai, and Udon Thani), with six samples from this study and 10 from Ihlow et al. (2016).
Each M. khoratensis specimen was photographed, had a blood sample collected, and was subsequently released into suitable habitat near the collection site. Prior to blood collection, the turtle’s skin was cleansed with 70% ethyl alcohol. A maximum of 0.5 mL of blood (less than 0.5% of body weight) was drawn from the dorsocervical sinus using a 23-gauge needle and a 3-mL syringe. Blood samples were then placed in EDTA K3 disposable vacuum tubes (Zhejiang Gongdong Medical Technology Co., Ltd., Zhejiang, China) and kept on ice until transported to the laboratory. In the Department of Environmental Science, Faculty of Science, Khon Kaen University, Thailand, blood samples were stored at −20 °C.
DNA extraction, fragment amplification, and sequencing
Genomic DNA was extracted from of a total of 49 blood samples of Malayemys khoratensis using a GF-1 Blood DNA Extraction Kit (Vivantis Technologies Sdn Bhd, Selangor Darul Ehsan, Malaysia) according to the manufacturer’s protocol. DNA concentration and purity (260/280 nm ratio) of each sample were measured using a Nanodrop spectrophotometer (Thermo Fisher Scientific, Waltham, MA, USA). Two mitochondrial DNA genes, Cyt b and ND4, were separately amplified. The following primers according to Ihlow et al. (2016) were used for the Cyt b region (1,200 bp) and for ND4 region (892 bp): For Cyt b region: a forward primer, “CytbG” (5′-AACCATCGTTGTAATCAACTAC-3′) and a reverse primer, “mt-f-na” (5′-AGGGTGGAGTCTTCAGTTTTTGGTTTACAAGACCAATG-3′), and for ND4 region: a forward primer, “L-ND4” (5′-GTAGAAGCCCCAATCGCAG-3′) and a reverse primer, “H-Leu” (5′-ATTACTTTTACTTGGATTTGCACCA-3′). A 50 µL PCR Master Mix was prepared, consisting of one µL of DNA template (20–200 ng per reaction), 1.5 µL of each primer (5 µM), 25 µL of KOD One™ PCR Master Mix-Blue (Toyobo, Japan), and 21 µL of distilled water. The cycling conditions were as follows: an initial denaturation for 5 min (95 °C for Cyt b and 94 °C for ND4), followed by 35 cycles consisting of denaturation for 45 s (95 °C for Cyt b and 94 °C for ND4), annealing for 30 s (56 °C for Cyt b and 55 °C for ND4), and extension at 72 °C for 60 s. A final extension was performed at 72 °C for 8 min for Cyt b and 10 min for ND4. PCR products were assessed using 1% agarose gel electrophoresis and then sent to Macrogen (Seoul, South Korea) or Bio Basic (Markham, ON, Canada) for purification and sequencing in both directions using the same primer pairs employed in the PCR. The sequences were manually reviewed and edited using MEGA11 (Kumar et al., 2018). All sequences have been submitted to GenBank, with the accession numbers listed in Table S1 of the Supplemental File.
Sequence analyses
The Cyt b and ND4 sequences from 49 M. khoratensis samples in this study were concatenated, aligned, and trimmed along with sequences from 15 samples provided by Ihlow et al. (2016) using MUSCLE (Edgar, 2004) in MEGA11 (Tamura, Stecher & Kumar, 2021). The final concatenated sequences comprised 1,459 bp, with 753 bp form Cyt b and 706 bp form ND4 and adjacent tRNAs. Identical sequences were grouped into haplotypes using DnaSP 6.12 (Rozas et al., 2017). All concatenated sequences were then analyzed in DnaSP 6.12 to determine the number of polymorphic sites, haplotypes, haplotype diversity, and nucleotide diversity. We estimated the expected number of haplotypes in the studied population using a haplotype accumulation curve in R, employing the ‘HaploAccum’ function from the ‘spider’ package with 1,000 permutations (Brown et al., 2012). The curve was interpreted as following: an asymptotic curve that has not yet reached saturation suggests that further genetic diversity remains to be sampled, whereas a curve that has reached saturation implies that additional sampling will not yield new haplotypes (Lamont et al., 2021).
The haplotype network of concatenated sequences was constructed by median-joining networks (Bandelt, Forster & Röhl, 1999) using the program PopART (Population Analysis with Reticulate Trees) version 1.7.2 (Leigh & Bryant, 2015). We analyzed the population structure among the three river basins using Analysis of Molecular Variance (AMOVA) in ARLEQUIN Version 3.5.2.2 (Excoffier & Lischer, 2010). This method partitions genetic variation into different hierarchical levels to assess the genetic differentiation among predefined groups (in this case, river basins) and within those groups. AMOVA compares the proportion of genetic variance attributed to differences among basins versus the variance within populations in each basin. This analysis also allows us to determine the extent to which individuals within the same basin share genetic similarities compared to individuals from different basins.
A Bayesian Skyline plot (BSP) based on Bayesian Markov Chain Monte Carlo (MCMC) analyses was created using the concatenated sequences in the program BEAST 2.7.6 (Bouckaert et al., 2014, 2019). The jModel test 2.1.7 (Darriba et al., 2012) were used for the model selection, and HKY was selected as the best fitted substitution model according to the Akaike information criterion (AIC) and Bayesian information criterion (BIC) for BSP calculations. We assumed a neutral mutation rate of 1.75 × 10⁻⁸ per site per generation based on a standard molecular clock for the turtle mitochondrial gene (Formia et al., 2006; Kumar et al., 2024; Naro-Maciel et al., 2014) which was consistent with 1.2%–2.4% pairwise divergence per million years. The analysis was run for 2 × 10⁷ steps with sampling every 104 steps using the piecewise-linear Bayesian skyline model and a random starting tree. Results from five replicates were combined using LogCombiner v1.7.5 (Drummond et al., 2012). Tracer 1.7.2 was employed to check for chain convergence and to reconstruct the Bayesian Skyline plot (Rambaut et al., 2018).
Results
In total, sequences with a length of 1,459 bp of Cyt b and ND4 plus adjacent tRNAs from 64 M. khoratensis individuals were analyzed, and 13 unique haplotypes were identified. However, with 64 samples in this study, the haplotype accumulation curve did not reach saturation, indicating that the species’ genetic diversity is not yet fully represented in the samples (Fig. 2). We observed 26 polymorphic sites accounting for 1.78% of the total sites (Table 1; Table S1). The total haplotype diversity of M. khoratensis was 0.819 and the nucleotide diversity was equal to 0.0031. There were nine singleton variable sites and 17 parsimony informative sites. In comparison among basins, the Mekong Basin had highest haplotype number (eight haplotypes), haplotype diversity (0.858) and nucleotide diversity (0.0047) followed by the Mun Basin (six haplotypes, haplotype diversity = 0.791, nucleotide diversity = 0.0028) and the Chi Basin (four haplotypes, haplotype diversity = 0.693, nucleotide diversity = 0.0023) even though the Chi Basin had highest number of samples (34 turtle samples), followed by the Mekong (16 samples) and Mun Basin (14 samples).
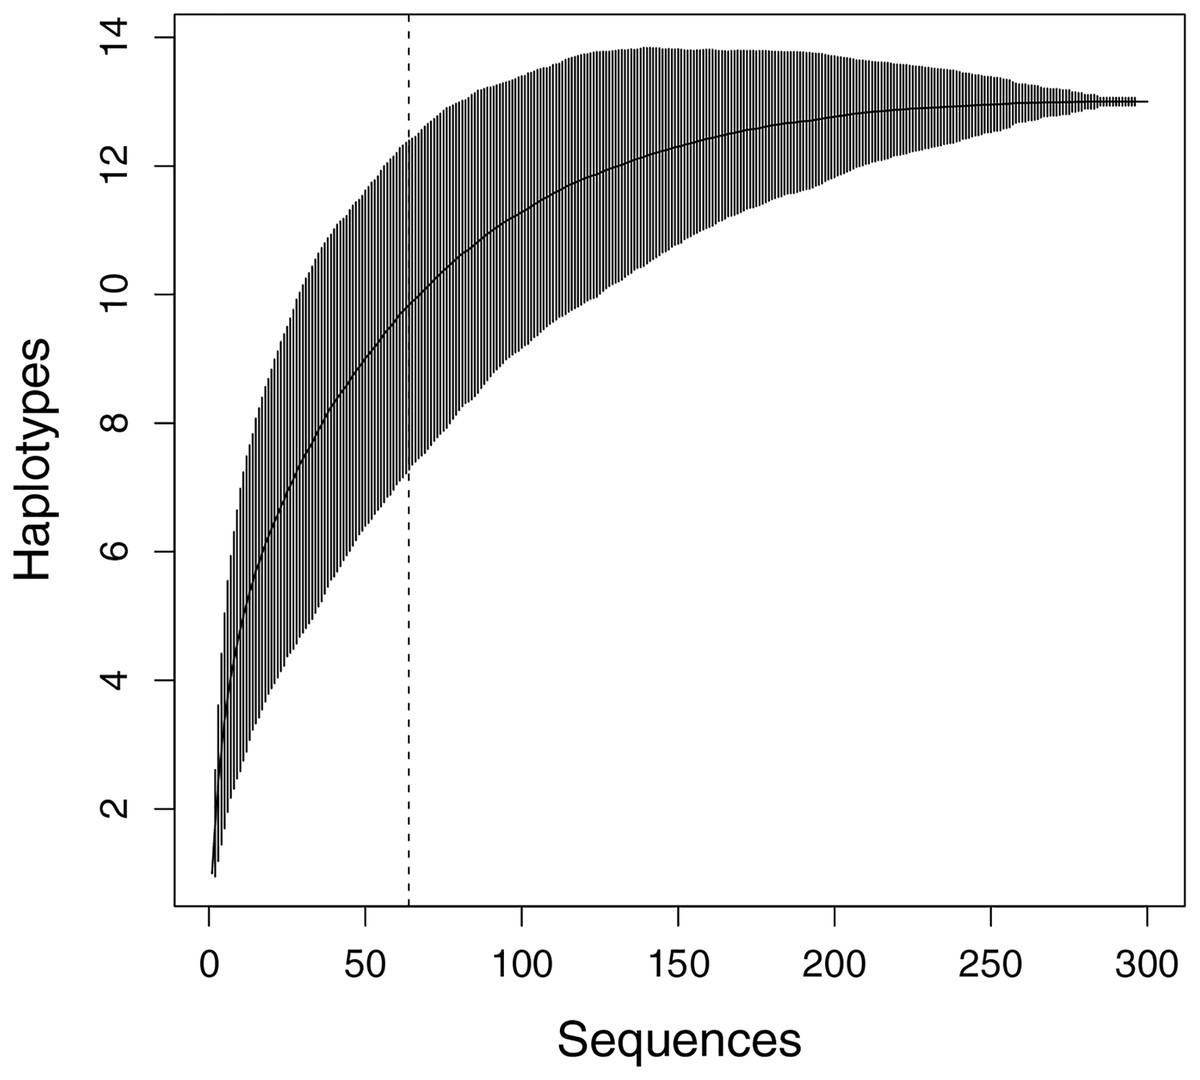
Figure 2: Haplotype accumulation curve presenting the relationship between the number of sequences and the discovery of new haplotypes.
The x-axis shows the total samples sequenced, while the y-axis represents the cumulative count of haplotypes identified with each additional randomly sampled individual (1,000 permutations). Vertical bars indicate the 95% confidence interval. The dashed line shows the number of sequences in this study (n = 64).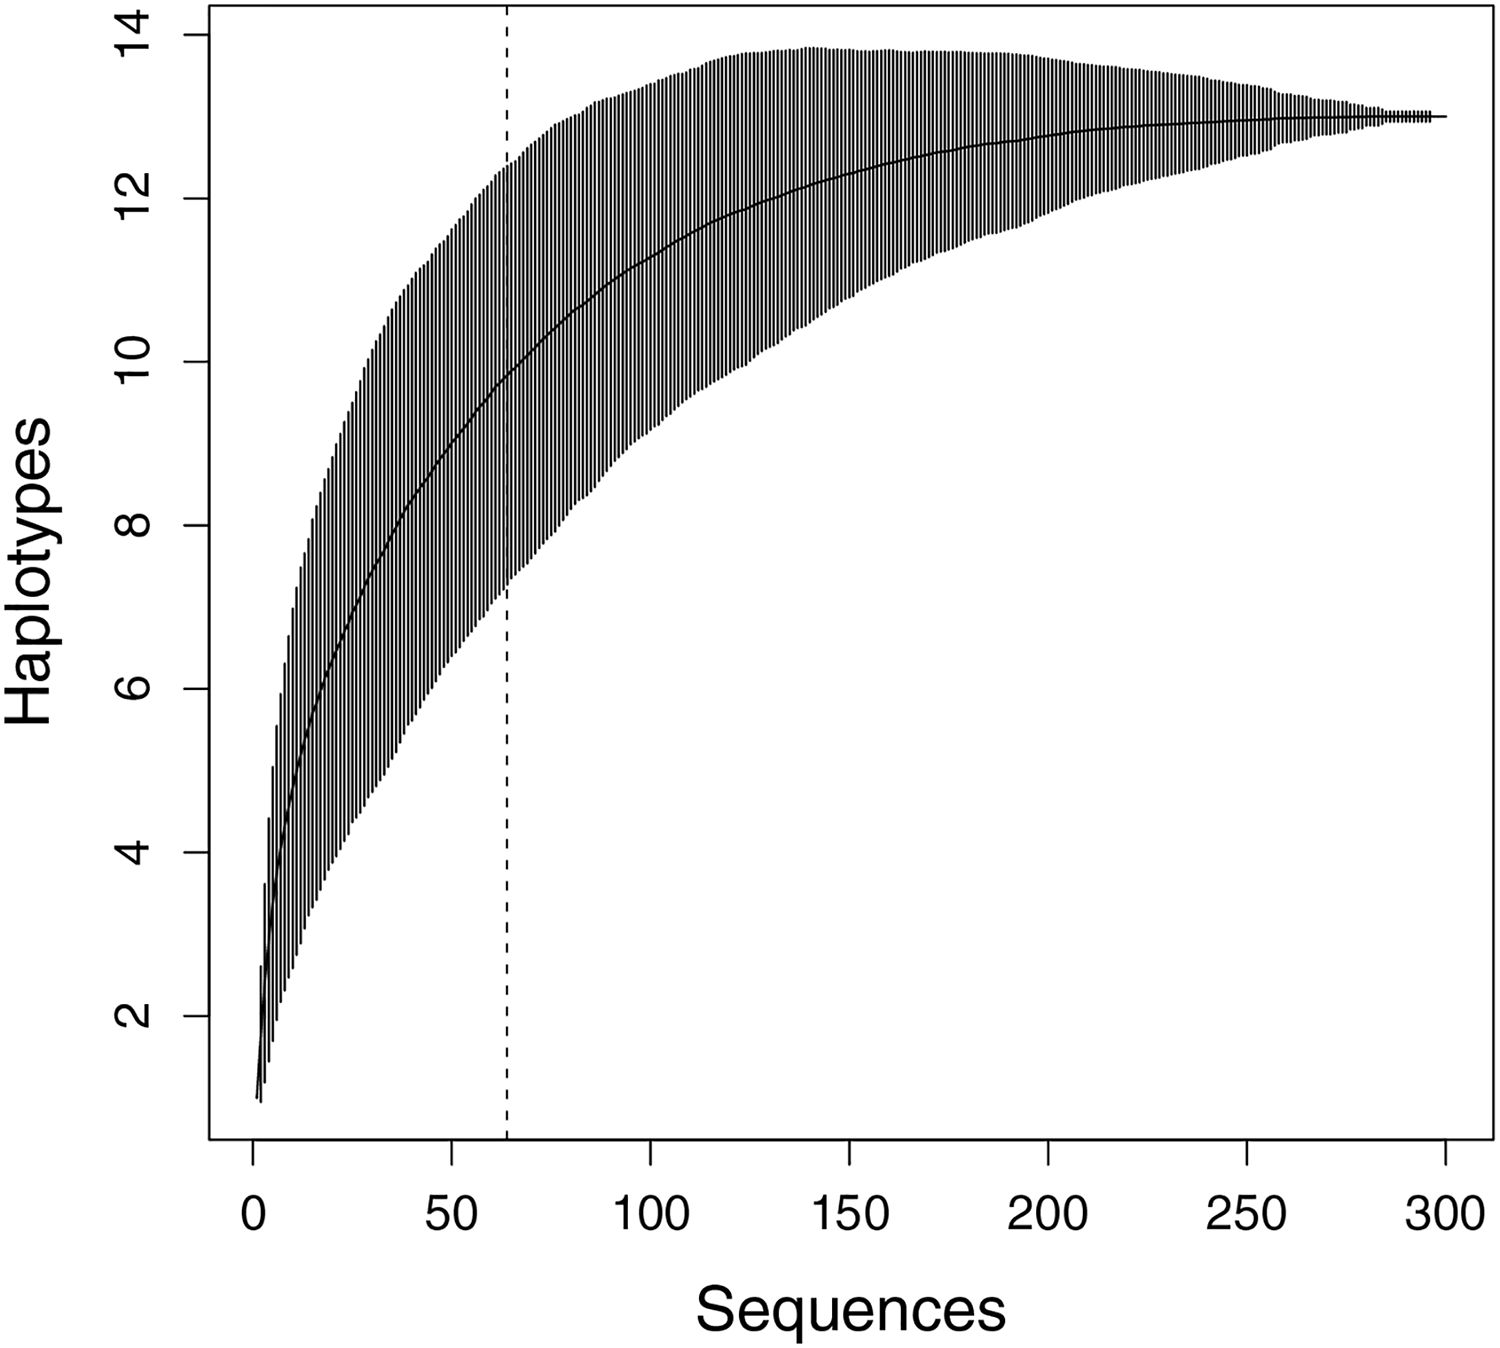
| Group | n | H | PS | Hd | π |
|---|---|---|---|---|---|
| Chi | 34 | 4 | 8 | 0.693 ± 0.051 | 0.0023 ± 0.0002 |
| Mekong | 16 | 8 | 22 | 0.858 ± 0.063 | 0.0047 ± 0.0007 |
| Mun | 14 | 6 | 11 | 0.791 ± 0.09 | 0.0028 ± 0.0004 |
| All | 64 | 13 | 26 | 0.819 ± 0.027 | 0.0031 ± 0.0003 |
The median-joining (MJ) network of 13 haplotypes showed no major branching events among M. khoratensis. In addition, the haplotype network showed no population structure among basins (Fig. 3). This aligned with AMOVA result that did not indicate any population structure among basins (3.37% of variation, variance components = 0.08, p = 0.12). The remaining 96.63% of the genetic variation was found within populations (variance components = 2.18) (Table 2). Four haplotypes were shared haplotypes occurred in more than one individual. Haplotype 1 and 4 were the most common haplotypes (18 individuals each, accounting for 56.3% of turtle samples). Haplotype 1 was found in all basins while haplotype 4 was found only in the Chi and Mun Basin. Haplotype 3 (six individuals) and 5 (nine individuals) also occurred in the Chi and Mun Basin whereas haplotype 8 (four individuals) and 6 (two individuals) were found only in the Mekong Basin. Seven haplotypes occurred only in single individuals and were observed only in the Mekong (five haplotypes: Haplotype 2, 6, 7, 9 and 11) and the Mun Basin (two haplotypes: haplotype 10 and 12).
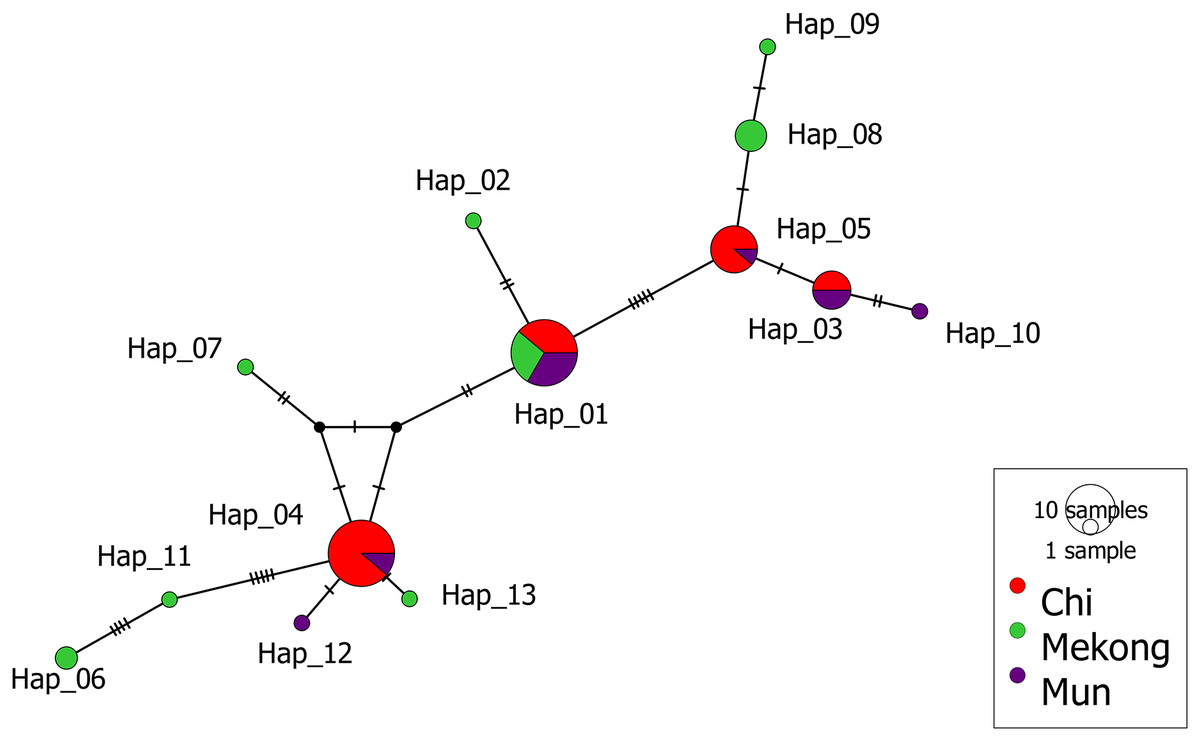
Figure 3: Median-joining haplotype network of M. khoratensis mitochondrial DNA (Cyt B and ND4).
The size of circles presents the relative frequency of each haplotype while short tick lines are the number of mutations between haplotypes. The colors indicate the populations of M. khoratensis: Mun Basin (purple), Chi Basin (red) and Northeast Mekong Basin (green).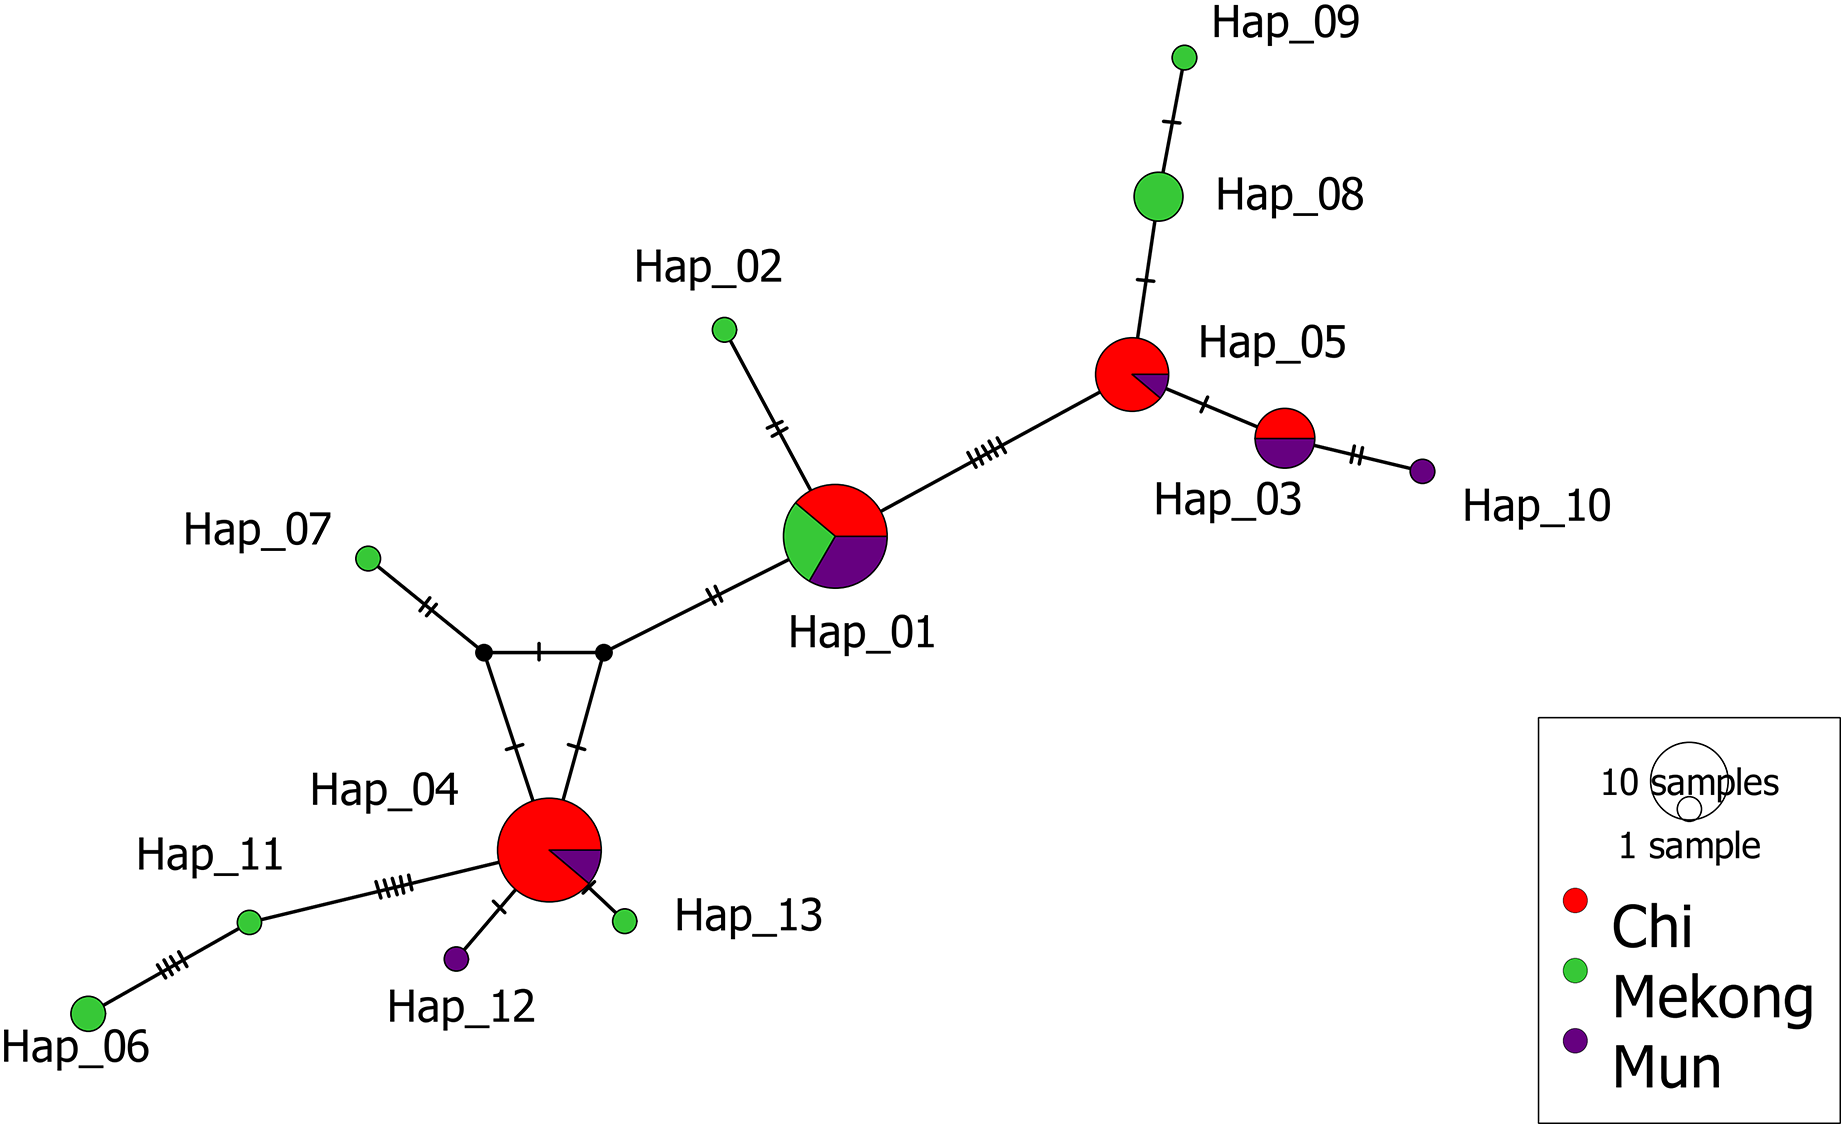
| Source of variation | d.f. | Sum of squares | Variance components | Percentage of variation | P-value | Fixation index |
|---|---|---|---|---|---|---|
| Among populations | 2 | 7.31 | 0.08 | 3.37 | 0.12 | 0.03 |
| Within populations |
61 | 132.96 | 2.18 | 96.63 | ||
| Total | 63 | 140.27 | 2.26 |
The Bayesian Skyline plot estimated the population size and demographic trend of M. khoratensis, indicating a stable effective female population size since about 100,000 years before present (BP) in the late Pleistocene with some fluctuations beginning approximately 2,000 years BP (Fig. 4). The current estimated effective female population size is also about 130,000 individuals.

Figure 4: Bayesian skyline plots for the historical demographic trend of M. khoratensis.
X-axis and Y-axis indicate time before present and effective population size, respectively. The thick solid blue line represents the mean estimate of the effective population size while the light blue area presents the 95% highest posterior density intervals.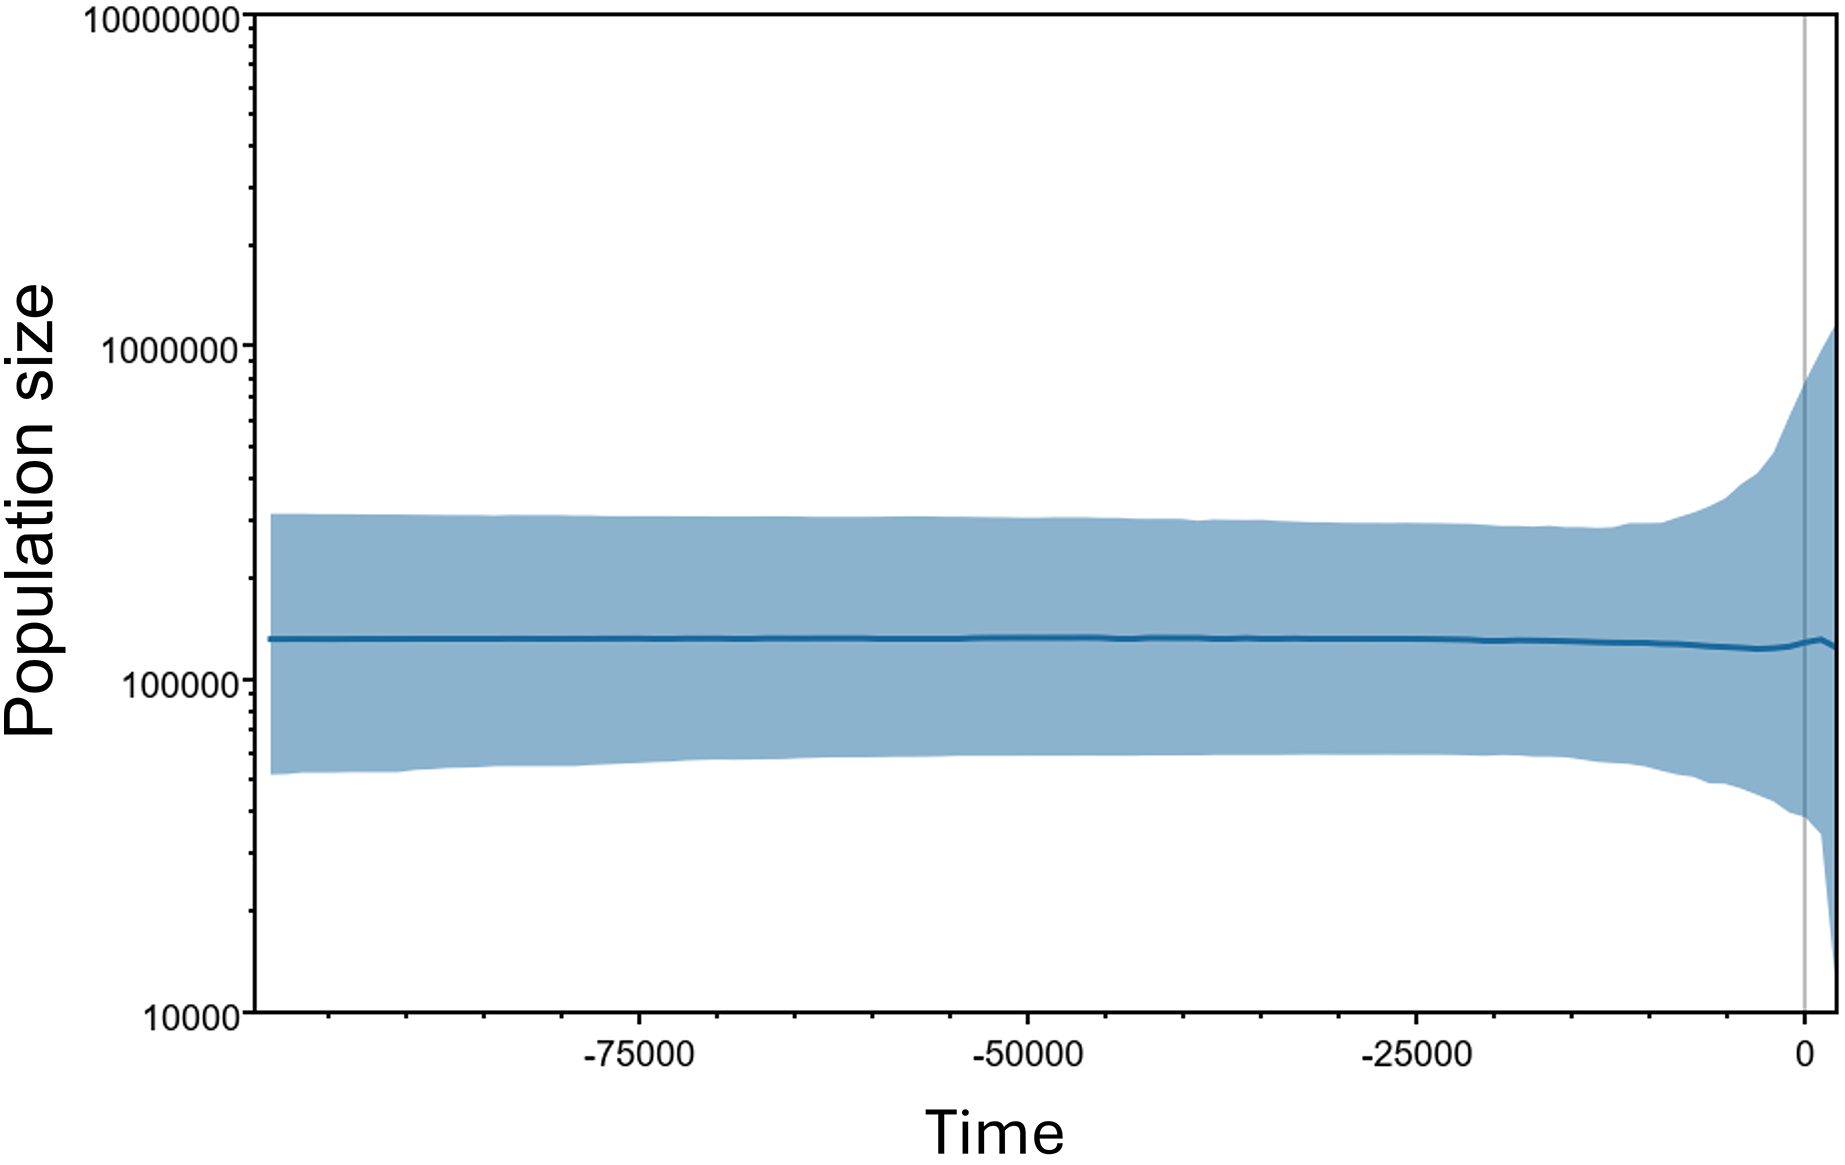
Discussion
In this study, we utilized mitochondrial DNA from M. khoratensis turtles from three basins in northeastern Thailand to investigate their population structure, estimate their effective population size, and assess their demographic trend. The turtle samples should cover the entire distribution range of this species in Thailand (Chaianunporn et al., 2024). Our findings provide evidences against the isolation-by-basin hypothesis as the haplotype network and AMOVA indicated no significant population structure among the three river basins. The haplotype network revealed only one common haplotype (Haplotype 1) present in all three basins, while the other haplotypes were found either exclusively in a single basin or shared between the Mun and Chi Basin. Notably, seven out of eight haplotypes found in the Mekong Basin were unique, in contrast to the Mun basin, which had only two unique haplotypes out of six, and the Chi Basin, which had no unique haplotypes. This pattern suggests that the turtles in the Mekong Basin are more genetically distinct from those in the Mun and Chi Basin. The shared haplotypes between the Chi and Mun Basin can possibly be explained by turtles moving between these areas as the Chi and Mun Basin are geographically close and connected by floodplains (Zenkoji et al., 2019). In contrast, the Mekong Basin is separated from the Mun and Chi Basin by the mountain range, i.e., the Phetchabun Mountains and the Phu Phan Mountains (Fig. 1). However, the role of human-mediated transport of turtles was not excluded because Malayemys turtles are exploited as food and trade by local Thai people (Dawson et al., 2018; Dawson, Ihlow & Platt, 2020). The human-mediated movement may blur the genetic boundaries between populations and complicate efforts to understand natural population structure and dynamics (González-Porter et al., 2011).
The mtDNA of M. khoratensis in this study shows relatively high haplotype diversity (Hd = 0.819) in comparison to other turtle species (Fritz et al., 2009; Lamont et al., 2021; Wongfu et al., 2022; Chomchat et al., 2024; Kumar et al., 2024) but nucleotide diversity is relatively low (π = 0.0031). This suggests that the genetic differences between haplotypes are small, likely due to a low mitochondrial mutation rate in turtles (Kumar et al., 2024). The pattern might reflect a rapid population expansion from a smaller ancestral population (Avise, 2000) or it may result from unsampled haplotypes across the species’ distribution range that would further contribute to genetic diversity (Fig. 2). In our haplotype network (Fig. 3), there is notable unsampled diversity among certain haplotypes, particularly between Haplotype 6 and 11 (four mutational steps), between Haplotype 11 and Haplotype 4 (five mutational steps), and between Haplotype 1 and Haplotype 5 (five mutational steps). These regions of the network contain several mutational steps that do not have corresponding representative haplotypes in our sample. This pattern suggests that additional haplotypes may exist in the natural population but were not captured in our sampling effort. The absence of these intermediate haplotypes could be attributed to several factors, including the wide geographic distribution and patchy habitats occupied by M. khoratensis. It is also possible that historical population bottlenecks, restricted gene flow among subpopulations, or even localized extinctions have contributed to these gaps by removing or isolating certain lineages.
The Bayesian Skyline plot estimated a relatively large effective population size (over 100,000 individuals) and indicated a stable demographic trend for this species over an extended period. This result contrasts with our expectation that anthropogenic activities, such as habitat transformation from forest to agricultural land in this region since approximately 3,500 years ago (Higham, Douka & Higham, 2015) or consumption and exploitation by humans (Platt et al., 2022), would have impacted the turtle population. Nevertheless, this finding should be validated by using alternative population census methods of this species or different genetic markers.
Conclusions
In this study, we used mitochondrial DNA data to assess the genetic diversity, population structure, and demographic trends of M. khoratensis. Our findings indicated no evidence of isolation by river basins in the population structure, which may be attributed to natural movement between basins or potentially human-mediated dispersal, as this species is involved in the turtle trade. The isolation-by-basin hypothesis could be further explored in other species within this region that are subject to similar ecological barriers, such as mountain ranges or large river systems, but are not affected by human-mediated dispersal. Examples might include other freshwater turtles, amphibians, and small fish species that are less likely to be relocated by humans and whose natural dispersal is limited by physical barriers. Investigating these species could provide deeper insights into how geographic features alone influence population structure and genetic divergence without the confounding factor of human-mediated movement. The Bayesian Skyline plot estimated a relatively large effective population size with a stable demographic trend for this species. This aligns with assessments by the IUCN Red List (Cota, 2021) and (CITES, 2024). However, as M. khoratensis continues to be consumed, exploited, and traded within its native range, we recommend monitoring its population trends to help ensure the species’ long-term survival.
In addition, the traditional and religious practice of merit release, where turtles are released as part of spiritual or ceremonial acts, may indeed place additional pressure on this turtle species. While well-intentioned, this practice can negatively impact the species by driving up demand for captured turtles and disrupting natural population structures. Furthermore, when released into non-native habitats, such as rivers, these turtles face high mortality risks. To mitigate these impacts, it is essential to promote alternative practices, for example, raising awareness about the environmental and conservation implications of merit release and encouraging actions that do not involve releasing live animals. Alternatives like sponsoring wildlife conservation efforts or supporting turtle sanctuaries can offer meaningful ways to fulfill religious and traditional intentions without harming M. khoratensis or other turtle species. Educational outreach by local conservation organizations, in collaboration with religious institutions, could help shift community practices toward more sustainable forms of merit-making.