Exploratory analysis of COVID-19 propagation using logistic model
- Published
- Accepted
- Received
- Academic Editor
- Chengming Fan
- Subject Areas
- Respiratory Medicine, COVID-19
- Keywords
- Pandemic transmission, COVID-19, National policy, Logistic model
- Copyright
- © 2025 Zhang et al.
- Licence
- This is an open access article distributed under the terms of the Creative Commons Attribution License, which permits using, remixing, and building upon the work non-commercially, as long as it is properly attributed. For attribution, the original author(s), title, publication source (PeerJ) and either DOI or URL of the article must be cited.
- Cite this article
- 2025. Exploratory analysis of COVID-19 propagation using logistic model. PeerJ 13:e19106 https://doi.org/10.7717/peerj.19106
Abstract
Pandemics pose significant threats to social, economic, and public health. The novel coronavirus (COVID-19), which emerged in late 2019, quickly became a global public health crisis due to its high contagion and pathogenicity. Using data from the World Health Organization (WHO), this study applied the Logistic model to analyze the spread patterns of COVID-19 in 16 countries with over 10 million infections from 2020 to 2023. The findings reveal that as of December 31, 2023, global infections exceeded 772 million with over seven million deaths. The USA and China had the highest infection numbers, while Brazil had the highest mortality rate. The study identified three main outbreak patterns: initial, late, and gradual development, reflecting different stages of the pandemic. Countries with earlier outbreaks, such as India, Brazil, the USA, and Argentina, generally had higher mortality rates, while those with later outbreaks, such as China, Pakistan, Japan, and Australia, had lower mortality rates. Significant differences were observed in the duration and speed of the spread, with China showing the shortest average duration and Russia the longest. The Logistic model’s parameter k values revealed policy adjustments, with Australia, Vietnam, and China showing significant changes over time, while the USA, France, and Russia showed less impact on epidemic control. These results provide an important perspective for understanding global pandemic transmission patterns and assessing the effectiveness of quarantine strategies across countries. They also provide a scientific basis for future public health policy and pandemic response development, helping countries to develop more targeted prevention and control strategies according to the characteristics of virus transmission, rationally allocate medical resources, and reduce social harm.
Introduction
Since the beginning of the 21st century, there have been three outbreaks (Sharma, Ahmad Farouk & Lal, 2021) of epidemics caused by coronaviruses: the Severe Acute Respiratory Syndrome (SARS) in 2003, the Middle East Respiratory Syndrome (MERS) in 2012, and the COVID-19 epidemic (COVID-19) that erupted in 2019. Each outbreak has been highly contagious and pathogenic, causing severe impacts on global socio-economic development and public health (Ma et al., 2022). Particularly, the COVID-19 epidemic that began in the second half of 2019 has had a profound impact. According to monitoring data from the World Health Organization (WHO), to date, the global cumulative number of infections has reached 775 million, with the death toll exceeding seven million, and the virus variants continue to spread. This epidemic has not only had a profound impact on various industries such as global finance, tourism, catering, cultural entertainment, sports, international trade, and scientific and cultural exchanges but has also severely constrained social development.
COVID-19 is named for its crown-like spike structures observed under an electron microscope. This virus belongs to the Coronaviridae family, the Orthocoronavirinae subfamily, and the Betacoronavirus genus. It is a positive-sense single-stranded RNA virus. Due to the replication mechanism of RNA viruses and the lack of proofreading mechanisms, they are prone to mutation (Yin et al., 2023). In recent years, a multitude of scholars have conducted in-depth research on the COVID-19. Phan et al. (2018) studied the structure of coronaviruses and found that the nucleocapsid protein (N) of coronaviruses forms a helical capsid to accommodate their genome, and the entire structure is further enveloped by a lipid bilayer. The lipid bilayer is composed of S (spike), E (envelope), and M (membrane) proteins. When infection occurs, the spike protein of the coronavirus undergoes conformational changes to bind with the peptidase domain (PD) of human Anti-Angiotensin-Converting Enzyme 2 (ACE2) (Wrapp et al., 2020), inducing spike membrane fusion, thereby achieving viral infection. Hamming et al. (2004) found that ACE2 is not only highly expressed in alveolar epithelial cells and intestinal epithelial cells in the human body but also has high expression in renal, cardiovascular, and gastrointestinal tissues. This explains other symptoms of coronavirus infection such as systemic vasculitis, endothelial cell apoptosis, and swelling, which also makes the coronavirus a matter of great concern for the public and global governments.
Therefore, an in-depth study of the transmission characteristics and epidemiological patterns of the COVID-19 is of utmost importance for controlling the spread of the epidemic and reducing social harm. In the study of infectious diseases, scientists have proposed various epidemiological models to investigate the prevalence characteristics and development trends of infectious diseases. For instance, during the SARS and MERS outbreaks, scholars used the SIR or SEIR models to establish system dynamics models for the transmission of these two viruses, simulating and predicting the turning points and infection rates of the epidemics (Horrocks & Bauch, 2020). The SIR model was first proposed by Kermack and McKendrick in 1927 through their study of the bubonic plague and was verified in the context of the plague (Bacaër, 2012). Subsequently, researchers extended the SIR model, developing four common models: the SI model (where the disease is difficult to cure after infection), the SIS model (where the disease can be cured but the recovered do not have immunity), the SIR model (where the infected gain lifelong immunity after recovery), and the SIRS model (Tan, Zhang & Sheng, 2023) (where the recovered have only temporary immunity, and some may be reinfected). However, these models all assume that there is no incubation period for the infectious disease, which poses a challenge in the study of the COVID-19. With a deeper understanding of the COVID-19, it has been found that it is still contagious during the incubation period, making the original models unable to accurately simulate and predict the trend of the epidemic. To address this issue, researchers have proposed adding isolation modules (Youssef et al., 2021), death modules (He, Peng & Sun, 2020), and latent infector isolation modules (Mwalili et al., 2020) to the models, constructing the SEIR model, to more accurately simulate the transmission pathways of infectious diseases and comprehensively describe the trends of emerging infectious diseases (Unkel et al., 2012). However, due to limited data, these models still have certain errors when studying the transmission of the COVID-19 and making predictions.
The Logistic model (May, 1976), also known as the population model, is a model based on observed data that studies the explosive growth of biomass. This model includes three parameters: the current state of the infected population, the end state, and stability. By constructing differential equations to solve for the parameters, it enables the prediction and study of biomass. The Logistic model has a wide range of applications in fields such as biology, market economics, and climate dynamics (Carpenter & Brock, 2006; Guttal & Jayaprakash, 2008; Yan et al., 2020). Its theories and methodologies are relatively mature, allowing for the drawing on research findings from other fields to enhance the model’s predictive accuracy. Compared to other complex epidemiological dynamic models, the Logistic model requires relatively fewer data, which is particularly important when data collection and processing are limited.
In light of this, the present study utilizes the Logistic model to investigate the characteristics of COVID-19 transmission in various countries (regions) around the world. By analyzing the COVID-19 infection data published by the World Health Organization, the study determines the epidemiological transmission parameters that fit different areas, analyzes the spatial variability of these parameters, and clarifies the transmission characteristics of each region at different stages. The expected results of the study are intended to provide a basis for decision-making in the rational allocation of medical resources and the implementation of epidemic prevention and control measures, thereby enhancing the response and prevention capabilities against the COVID-19.
Materials & Methods
Data
In this study, we utilized real-time infection data of the COVID-19 (COVID-19) published by the World Health Organization (WHO, https://data.who.int/dashboards/covid19/). These data encompass the regularly reported statistics on COVID-19 infections and deaths from countries around the world. The data set spans from January 1, 2020, to December 31, 2023, with a resolution of weekly data. It includes relevant statistical data for 237 countries and regions globally.
Methods
In this study, we employ the Logistic model to explore the transmission dynamics of infectious diseases. This model is used to simulate the nonlinear dynamic process of population or worm growth under limited resources. It is consistent with the transmission characteristics of infectious diseases and is widely used in the study of biological population dynamics (Karim, Aithal & Bhowmick, 2023). The mathematical expression of the model is shown in Eq. (1): (1)
The parameter u represents the initial number of infected individuals, v represents the total number of infected individuals at the end of the outbreak, and k is the carrying capacity parameter, indicating the infection rate. Under the control of different parameters, there are several patterns of infectious disease development:
• Under the control of different transmission stability parameters, the infection rate of the same initial infectors is inconsistent, and the final number of infectors is also inconsistent (Fig. 1A);
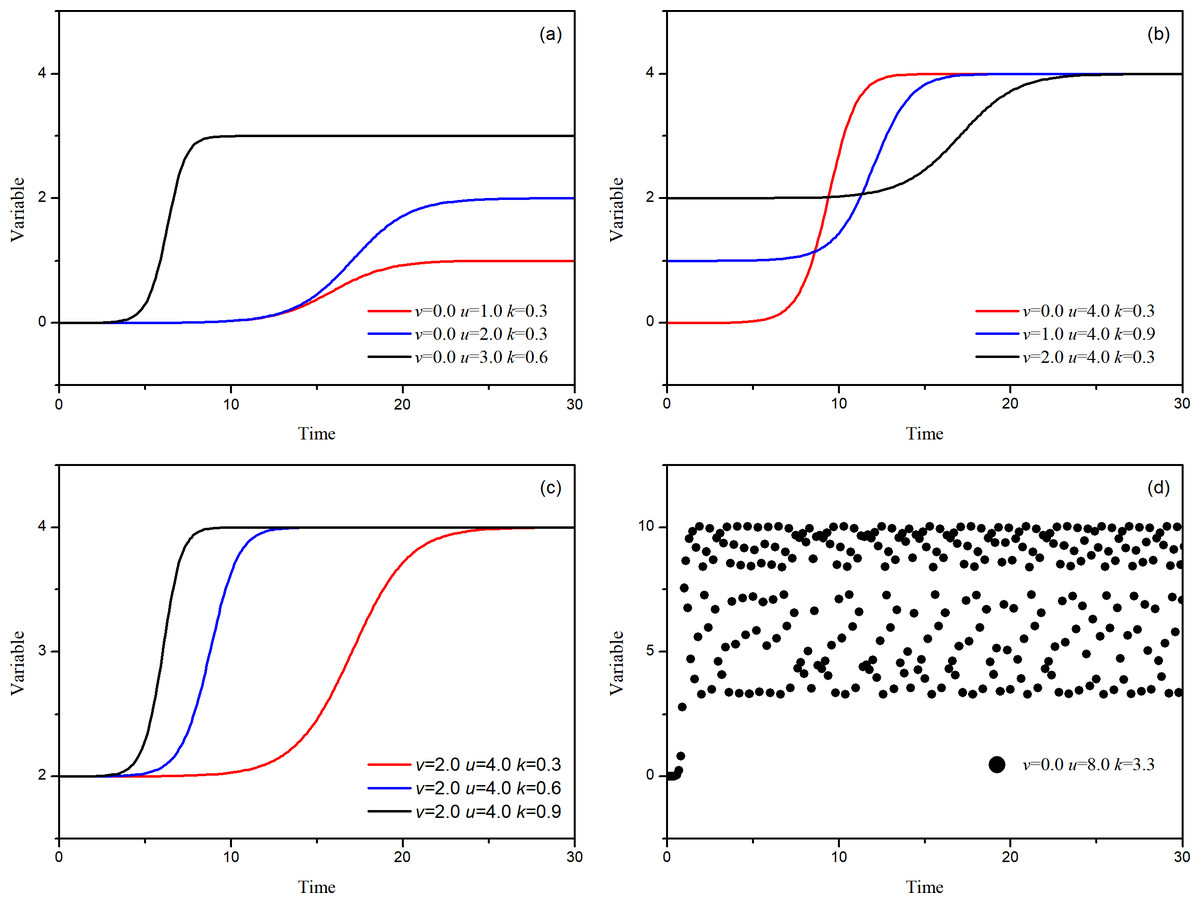
Figure 1: Numerical solutions of the logistic model.
(A) The model’s characteristics with different parameter values, (B) the overload situation when the transmission rate is too fast, (C) the system’s existence in different temperature states, (D) several different stages of an infectious disease outbreak.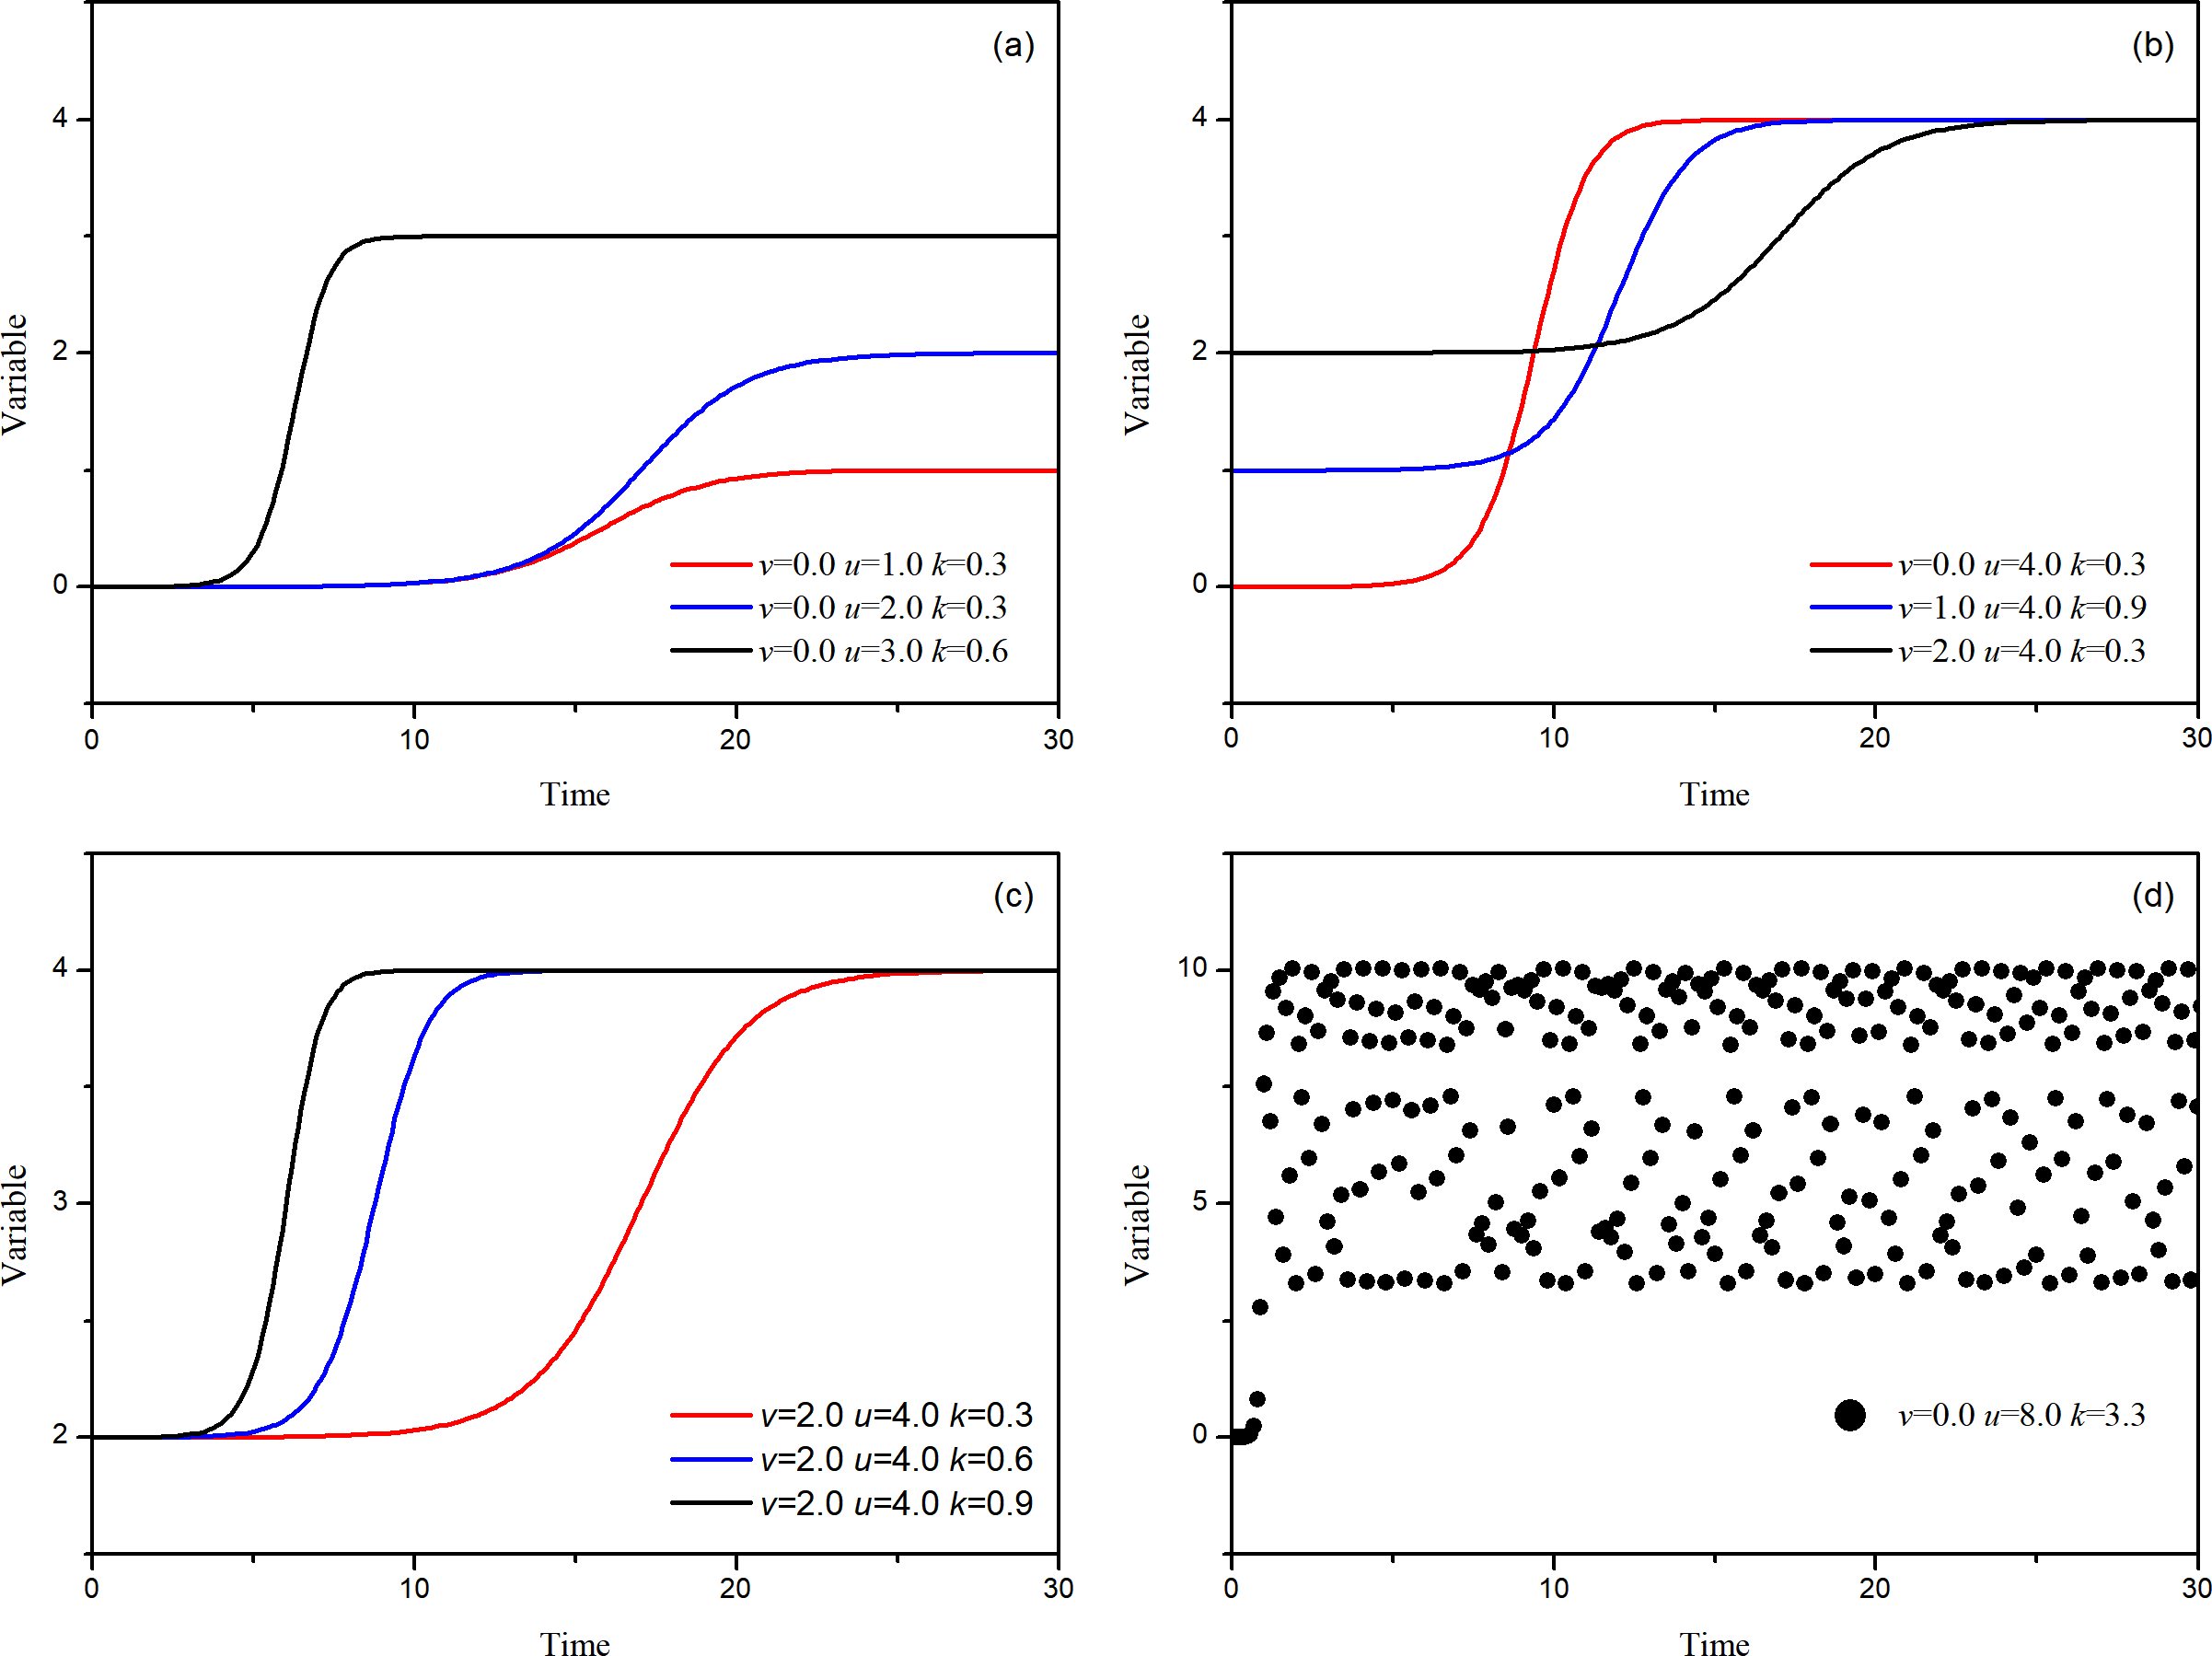
• Different initial infectors, controlled by different transmission stability parameters (transmission speed), result in the same final number of infectors (Fig. 1B);
• The same initial infectors, controlled by different transmission stability parameters, have different transmission speeds, but the final number of infectors is consistent (Fig. 1C);
• When the stability parameter is abnormally large, the final number of infectors becomes uncertain (Fig. 1D). (2)
When using the logistic model to fit the time series data of infectious diseases, we can obtain several parameters. These parameters allow us to derive more detailed statistics about the spread of the pandemic. The parameter h represents the transmission rate, Tu is the time when the number of infections is u, Tv is the time when the number of infections is v, and the parameter χ = 0.2164 is constant. Using the Logistic model, 27 ideal sequences with different parameters were constructed, and using Eq. (2), the parameters can be obtained. Table 1 presents the results of the parameter extraction for these ideal sequences, where the extraction value of parameter v has a maximum error rate not exceeding 4.02% compared to the given value, and the extraction value of parameter u has an error rate of no more than 1.25%. The parameter k is the most challenging to extract, with the highest error rate compared to parameters v and u but still no more than 9.80%. Overall, these extracted parameter values are almost consistent with the set values.
| v | u | k | ||||||||||
|---|---|---|---|---|---|---|---|---|---|---|---|---|
| Original value | Obtained value | Bias rate | Original value | Obtained value | Bias rate | Original value | Obtained value | Bias rate | ||||
| 1 | 1.0000 | 1.0122 | 1.22% | 2.0000 | 1.9749 | 1.25% | 0.3000 | 0.2954 | 1.54% | |||
| 2 | 1.0000 | 1.0119 | 1.19% | 2.0000 | 1.9960 | 0.20% | 0.6000 | 0.5577 | 7.05% | |||
| 3 | 1.0000 | 1.0122 | 1.22% | 2.0000 | 1.9979 | 0.10% | 0.9000 | 0.8340 | 7.34% | |||
| 4 | 1.0000 | 1.0217 | 2.17% | 3.0000 | 2.9917 | 0.28% | 0.3000 | 0.2783 | 7.22% | |||
| 5 | 1.0000 | 1.0216 | 2.16% | 3.0000 | 2.9974 | 0.09% | 0.6000 | 0.5483 | 8.61% | |||
| 6 | 1.0000 | 1.0235 | 2.35% | 3.0000 | 2.9985 | 0.05% | 0.9000 | 0.8316 | 7.60% | |||
| 7 | 1.0000 | 1.0300 | 3.00% | 4.0000 | 3.9937 | 0.16% | 0.3000 | 0.2748 | 8.41% | |||
| 8 | 1.0000 | 1.0315 | 3.15% | 4.0000 | 3.9975 | 0.06% | 0.6000 | 0.5529 | 7.85% | |||
| 9 | 1.0000 | 1.0355 | 3.55% | 4.0000 | 3.9985 | 0.04% | 0.9000 | 0.8441 | 6.22% | |||
| 10 | 1.0000 | 1.0390 | 3.90% | 5.0000 | 4.9946 | 0.11% | 0.3000 | 0.2736 | 8.79% | |||
| 11 | 1.0000 | 1.0377 | 3.77% | 5.0000 | 4.9980 | 0.04% | 0.6000 | 0.5412 | 9.80% | |||
| 12 | 1.0000 | 1.0402 | 4.02% | 5.0000 | 4.9987 | 0.03% | 0.9000 | 0.8271 | 8.10% | |||
| 13 | 2.0000 | 2.0121 | 0.61% | 3.0000 | 2.9749 | 0.84% | 0.3000 | 0.2954 | 1.53% | |||
| 14 | 2.0000 | 2.0119 | 0.59% | 3.0000 | 2.9960 | 0.13% | 0.6000 | 0.5577 | 7.05% | |||
| 15 | 2.0000 | 2.0122 | 0.61% | 3.0000 | 2.9979 | 0.07% | 0.9000 | 0.8340 | 7.34% | |||
| 16 | 2.0000 | 2.0217 | 1.08% | 4.0000 | 3.9917 | 0.21% | 0.3000 | 0.2783 | 7.22% | |||
| 17 | 2.0000 | 2.0215 | 1.08% | 4.0000 | 3.9974 | 0.07% | 0.6000 | 0.5483 | 8.61% | |||
| 18 | 2.0000 | 2.0235 | 1.18% | 4.0000 | 3.9985 | 0.04% | 0.9000 | 0.8315 | 7.61% | |||
| 19 | 2.0000 | 2.0299 | 1.50% | 5.0000 | 4.9937 | 0.13% | 0.3000 | 0.2748 | 8.41% | |||
| 20 | 2.0000 | 2.0315 | 1.57% | 5.0000 | 4.9975 | 0.05% | 0.6000 | 0.5529 | 7.86% | |||
| 21 | 2.0000 | 2.0354 | 1.77% | 5.0000 | 4.9985 | 0.03% | 0.9000 | 0.8440 | 6.22% | |||
| 22 | 3.0000 | 3.0121 | 0.40% | 4.0000 | 3.9749 | 0.63% | 0.3000 | 0.2954 | 1.53% | |||
| 23 | 3.0000 | 3.0119 | 0.40% | 4.0000 | 3.9960 | 0.10% | 0.6000 | 0.5577 | 7.05% | |||
| 24 | 3.0000 | 3.0122 | 0.41% | 4.0000 | 3.9979 | 0.05% | 0.9000 | 0.8340 | 7.34% | |||
| 25 | 3.0000 | 3.0217 | 0.72% | 5.0000 | 4.9917 | 0.17% | 0.3000 | 0.2783 | 7.22% | |||
| 26 | 3.0000 | 3.0215 | 0.72% | 5.0000 | 4.9974 | 0.05% | 0.6000 | 0.5483 | 8.61% | |||
| 27 | 3.0000 | 3.0235 | 0.78% | 5.0000 | 4.9985 | 0.03% | 0.9000 | 0.8315 | 7.61% | |||
Extreme value analysis
In statistical analysis, the maximum values for each transmission process are calculated for different countries. To mitigate the impact of data volatility, a maximum value occurring within a continuous 5-week period is defined as the maximum value of a process (Eq. (3)). Through the maximum values, each process can be identified. Figure 2A, for example, illustrates several infection processes and the identification of extreme values using actual infection numbers. Figure 2B focuses on a super transmission process from October 24, 2021, to March 27, 2022. Based on this process, the cumulative number of infections can be identified, and the number of people infected before the process can be determined as v = 45.11 ×10⁶, and the number of infected people after the end of the transmission as u = 79.30 ×10⁶. (3)
In the equation, C represents the number of infected individuals, Cmax denotes the extreme value during the transmission process, i represents the time sequence, and max refers to the extreme value obtained from the sequence within the parentheses.
Based on the extreme values, the entire sequence can be divided into several transmission processes. Taking the transmission process in Fig. 2B as an example, the parameter k can be calculated using the obtained parameters and Eq. (2). Then, through Eq. (1), the simulated curve in Fig. 2C, represented by the gray dashed line, can be plotted. It can be observed that the curve obtained through parameter back-tracing analysis is almost consistent with the actual number of infected individuals. Therefore, it is considered that the model can represent the transmission process of the virus effectively.
Results
Infection situation analysis
As of December 31, 2023, a total of 772,052,752 people worldwide had been infected, with 16 countries having more than 10 million infections (Table 2), totaling 569,818,140, accounting for 73.81% of the global total infections. Among them, the United States of America (USA) had the highest number of infections, reaching 103 million people, followed by China with 99 million people. Countries such as India had fewer than 50 million infections. Looking at the number of deaths, the USA had the highest number of COVID-19 related deaths among these 16 countries, exceeding 1.14 million people, followed by Brazil (700,000 people), and then India (530,000 people). In terms of mortality rate, Brazil had the highest mortality rate, reaching 1.87%; followed by RF, with a mortality rate of 1.72%. Other countries such as Argentina, India, and the USA had mortality rates exceeding 1.0%, far exceeding the mortality rate of the flu (0.01%–0.03%). It can be seen that the mortality rate of the COVID-19 infection is still too high, and there is an urgent need for continued research.
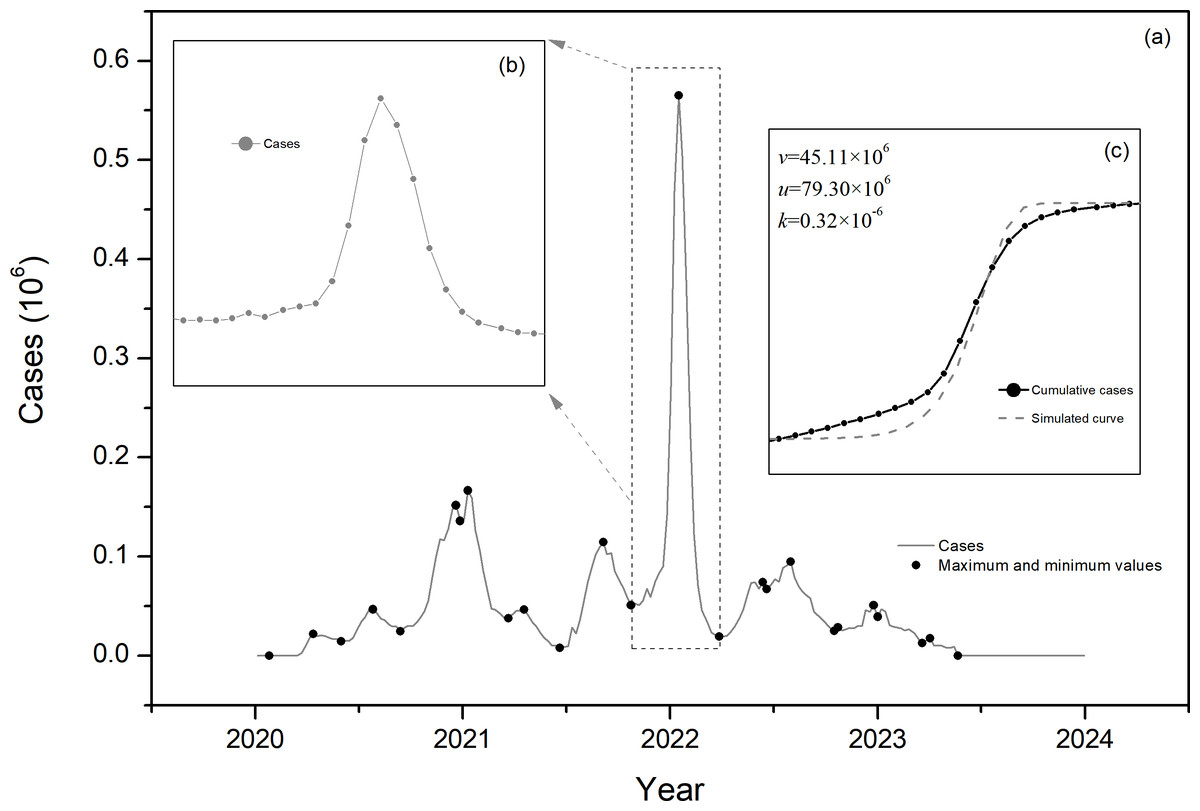
Figure 2: Schematic diagram of parameter identification.
(A) for example, illustrates several infection processes and the identification of extreme values using actual infection numbers. (B) focuses on a super transmission process from October 24, 2021, to March 27, 2022. (C) show a transition process of Fig. 2B.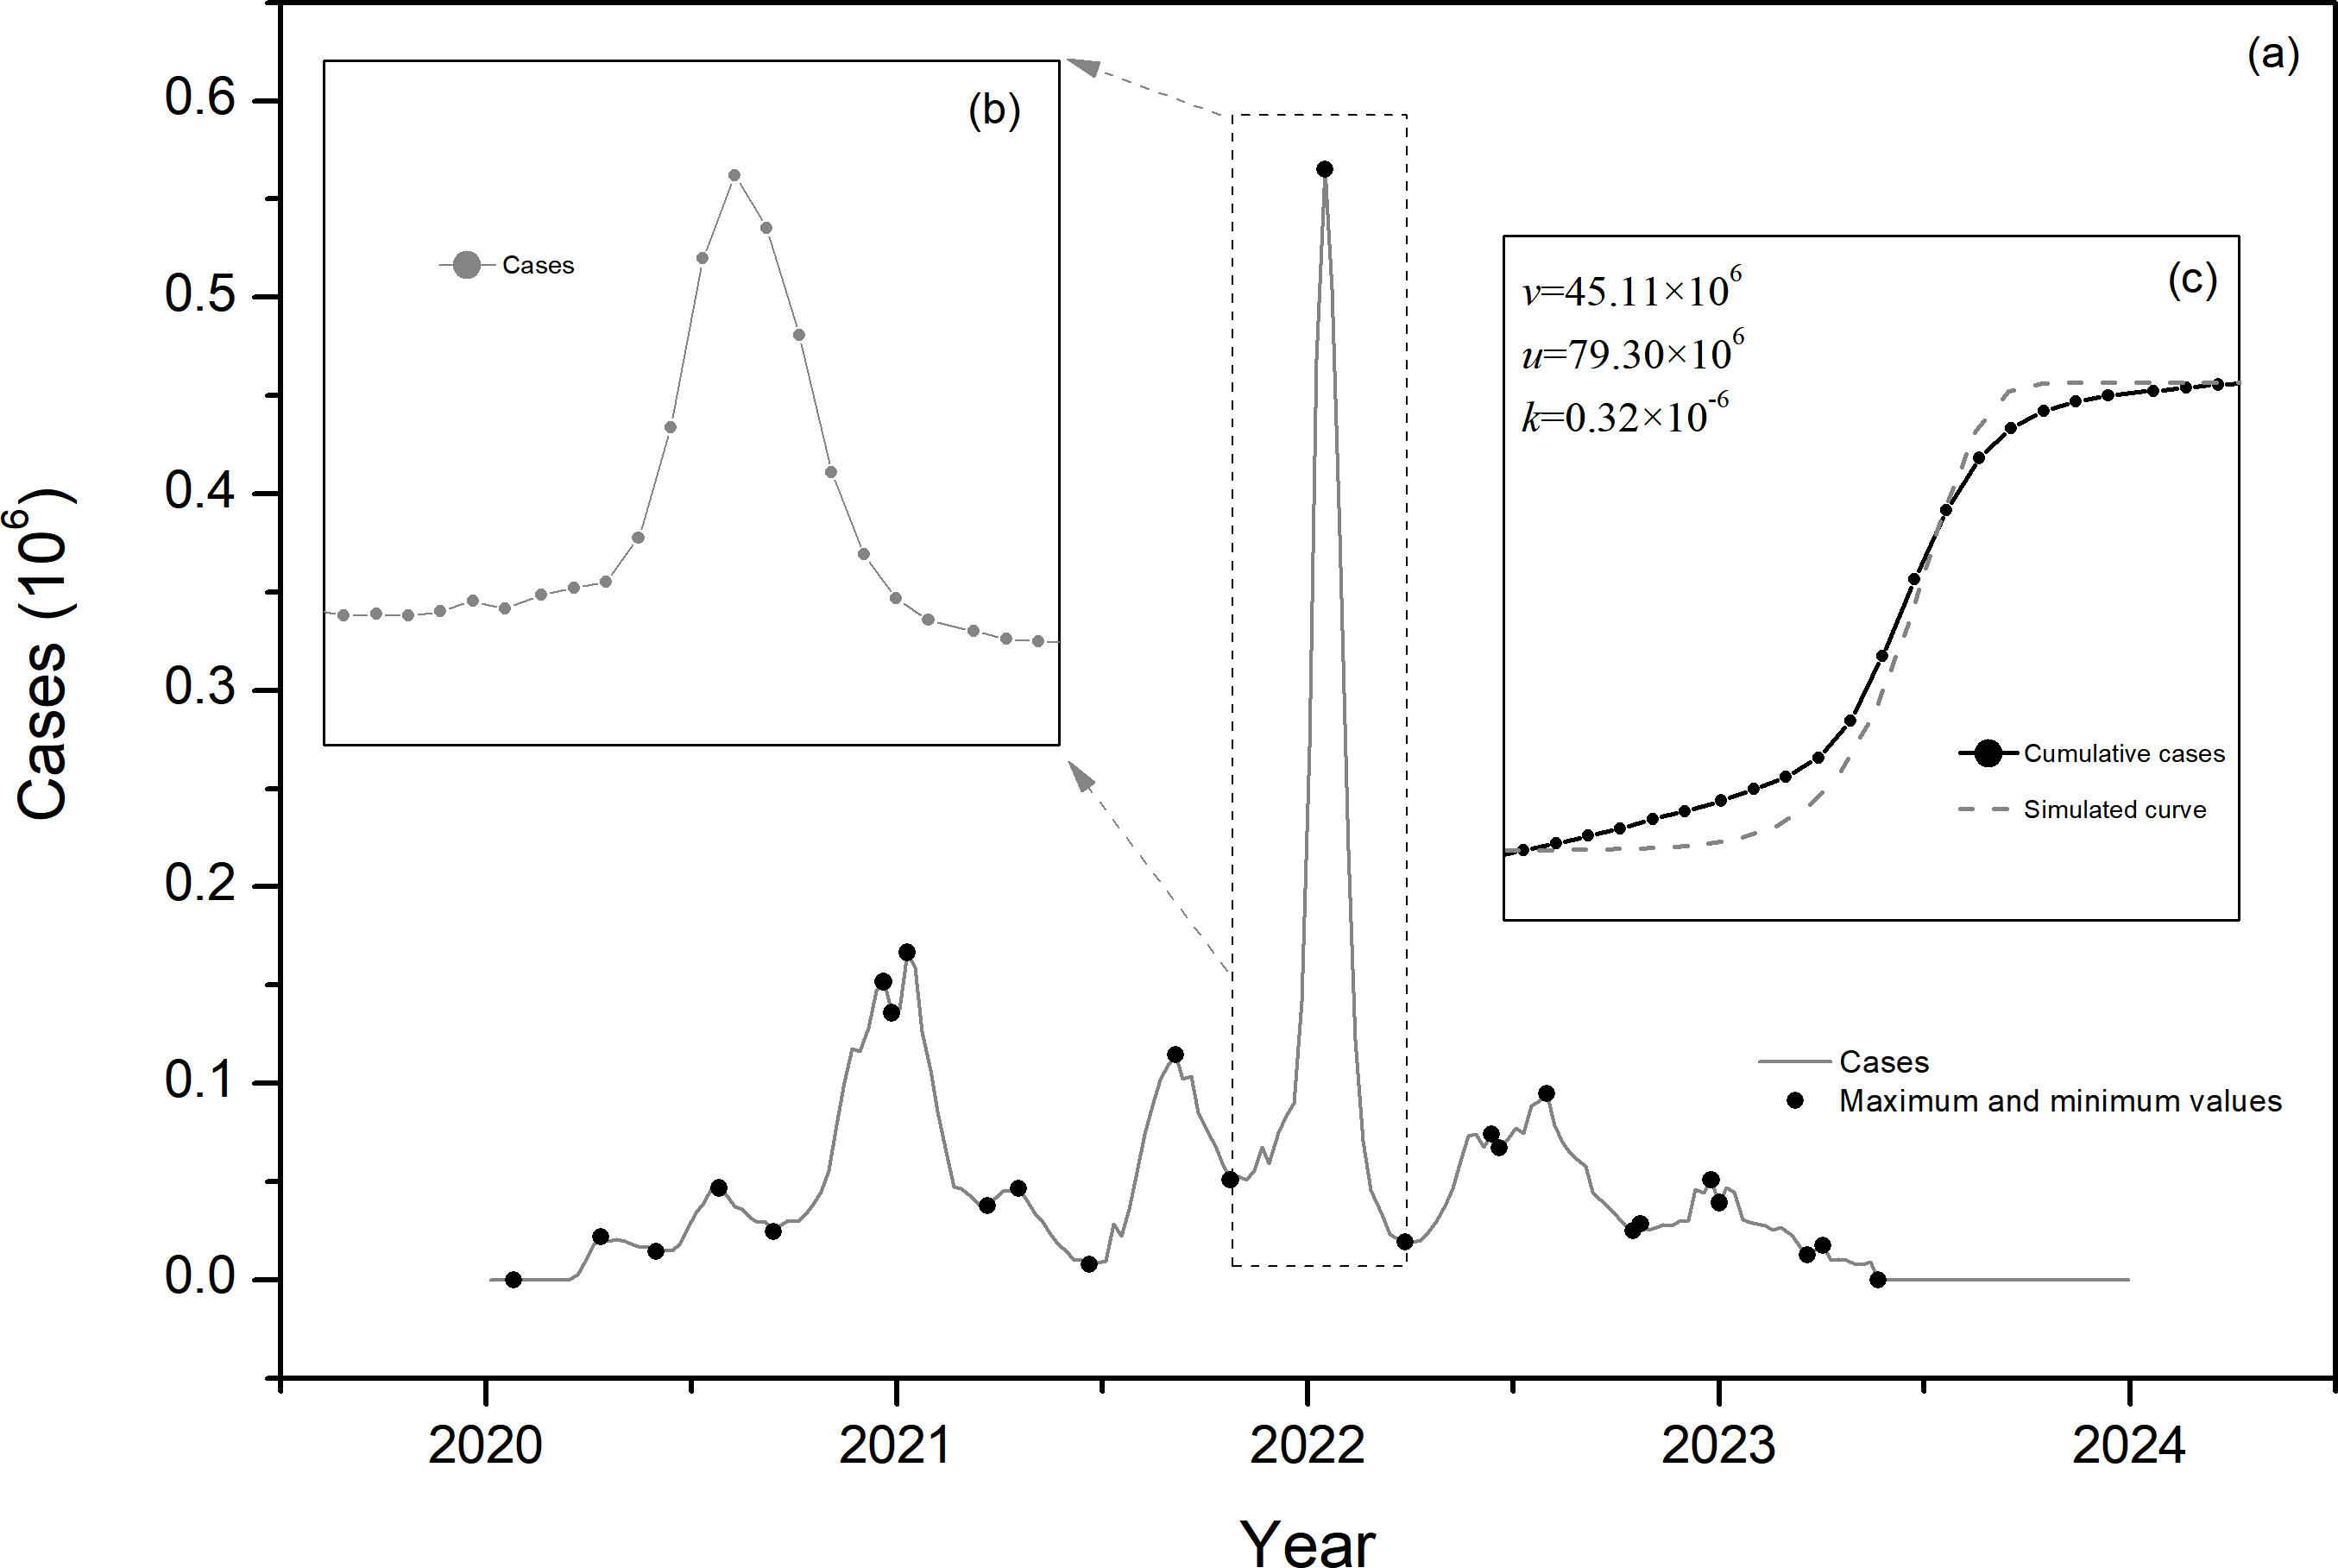
| Country | Cumulative cases | Cumulative deaths | Death rate |
|---|---|---|---|
| USA | 103,436,832 | 1,144,877 | 1.11% |
| China | 99,320,288 | 121,874 | 0.12% |
| India | 45,001,764 | 533,298 | 1.19% |
| France | 38,997,488 | 167,985 | 0.43% |
| Germany | 38,437,756 | 174,979 | 0.46% |
| Brazil | 37,519,960 | 702,116 | 1.87% |
| RK | 34,571,872 | 35,934 | 0.10% |
| Japan | 33,803,572 | 74,694 | 0.22% |
| Italy | 26,318,716 | 192,909 | 0.73% |
| UK | 24,812,582 | 232,112 | 0.94% |
| RF | 23,258,444 | 400,488 | 1.72% |
| Turkiye | 17,004,676 | 101,419 | 0.60% |
| Spain | 13,980,340 | 121,852 | 0.87% |
| Australia | 11,669,087 | 23,643 | 0.20% |
| VietNam | 11,624,000 | 43,206 | 0.37% |
| Argentina | 10,060,763 | 130,472 | 1.30% |
Transmission characteristics analysis
Initial transmission characteristics
Analyzing the initial case and the spread to the first peak of infection in 16 countries (Table 3), the earliest recording countries are China and Germany, both of which first appeared on January 5, 2020; followed by Republic of Korea (RK), Japan, and Spain, with the first case infection time recorded on January 19; then the USA, France, Australia, and Vietnam, with the first recording time on January 26. The UK, Italy, The Russian Federation (RF), and India recorded their first cases on February 2. Brazil, Argentina, and Turkiye recorded their first cases in March. India has the highest number of new infections per week at the peak value, with more than 600,000 infections per week, taking 33 weeks. Next are Brazil and the USA, with weekly infections exceeding 200,000, taking 18 weeks and 11 weeks, respectively. RF, Spain, Italy, Germany, the United Kingdom (UK), China, and Turkiye first reached the maximum number of infections exceeding 30,000 per week, with Turkiye taking the least time of only 5 weeks, and RF taking the longest time of 14 weeks. The remaining countries first reached the peak value with fewer than 10,000 infections, among which Vietnam had the fewest infections (only 222 people), taking 28 weeks.
| Country | First cases | First maximum | Duration (weeks) | ||
|---|---|---|---|---|---|
| Date | Cases | Date | Maximum | ||
| USA | 2020/1/26 | 7 | 2020/4/12 | 219,172 | 11 |
| China | 2020/1/5 | 1 | 2020/2/16 | 31,333 | 6 |
| India | 2020/2/2 | 2 | 2020/9/20 | 646,263 | 33 |
| France | 2020/1/26 | 3 | 2020/5/24 | 4,340 | 17 |
| Germany | 2020/1/5 | 1 | 2020/4/5 | 36,067 | 13 |
| Brazil | 2020/3/1 | 1 | 2020/7/5 | 264,107 | 18 |
| RK | 2020/1/19 | 1 | 2020/3/8 | 3,608 | 7 |
| Japan | 2020/1/19 | 1 | 2020/3/15 | 325 | 8 |
| Italy | 2020/2/2 | 3 | 2020/3/29 | 38,894 | 8 |
| UK | 2020/2/2 | 1 | 2020/4/12 | 32,630 | 10 |
| RF | 2020/2/2 | 2 | 2020/5/10 | 75,001 | 14 |
| Turkiye | 2020/3/15 | 6 | 2020/4/19 | 30,162 | 5 |
| Spain | 2020/1/19 | 2 | 2020/3/29 | 59,344 | 10 |
| Australia | 2020/1/26 | 4 | 2020/3/29 | 2,728 | 9 |
| Vietnam | 2020/1/26 | 2 | 2020/8/9 | 222 | 28 |
| Argentina | 2020/3/8 | 22 | 2020/4/26 | 1,398 | 7 |
To further analyze the initial spread of the virus at the beginning of the outbreak in early 2020, the monthly infection numbers from January 2020 to December 2020 for 16 countries were analyzed over time (Fig. 3), where Fig. 3A shows the situation for the USA, India, France, and Brazil. It can be observed that after the initial outbreak, the USA continued to develop rapidly, with two more extreme values appearing in July and December 2020, each stronger than the last. India had only one significant transmission process in 2020, and after reaching an extreme value in September, the infections continued, with weekly infections still exceeding 150,000 by the end of the year. France reached the extreme value of the first round of infections in November 2020, and after control measures were implemented, the number of infections decreased rapidly, with weekly infections falling below 100,000 by the end of the year. Brazil saw the extreme value of infections in August 2020 and then again at the end of the year, resulting in two rounds of transmission for the year. The UK, Italy, Turkiye, RF, Germany, Spain, and Argentina mainly experienced two rounds of transmission in 2020, with the first round mainly in March to May, with weekly extreme infection numbers ranging from 50,000 to 100,000 people; the second round of extreme values occurred between October and December, with weekly extreme infection numbers exceeding 100,000 people. China, Japan, RK, Australia, and Vietnam also mainly had two rounds of transmission in 2020, with the first mainly in February to May, with China’s weekly extreme infection number exceeding 30,000 people, and the other three countries having less than 5,000 weekly extreme infections; in the second round of transmission, China’s weekly extreme infection number was only 1,400 people, while Japan, RK, and Australia were 10,000, 2,000, and 3,000, respectively.
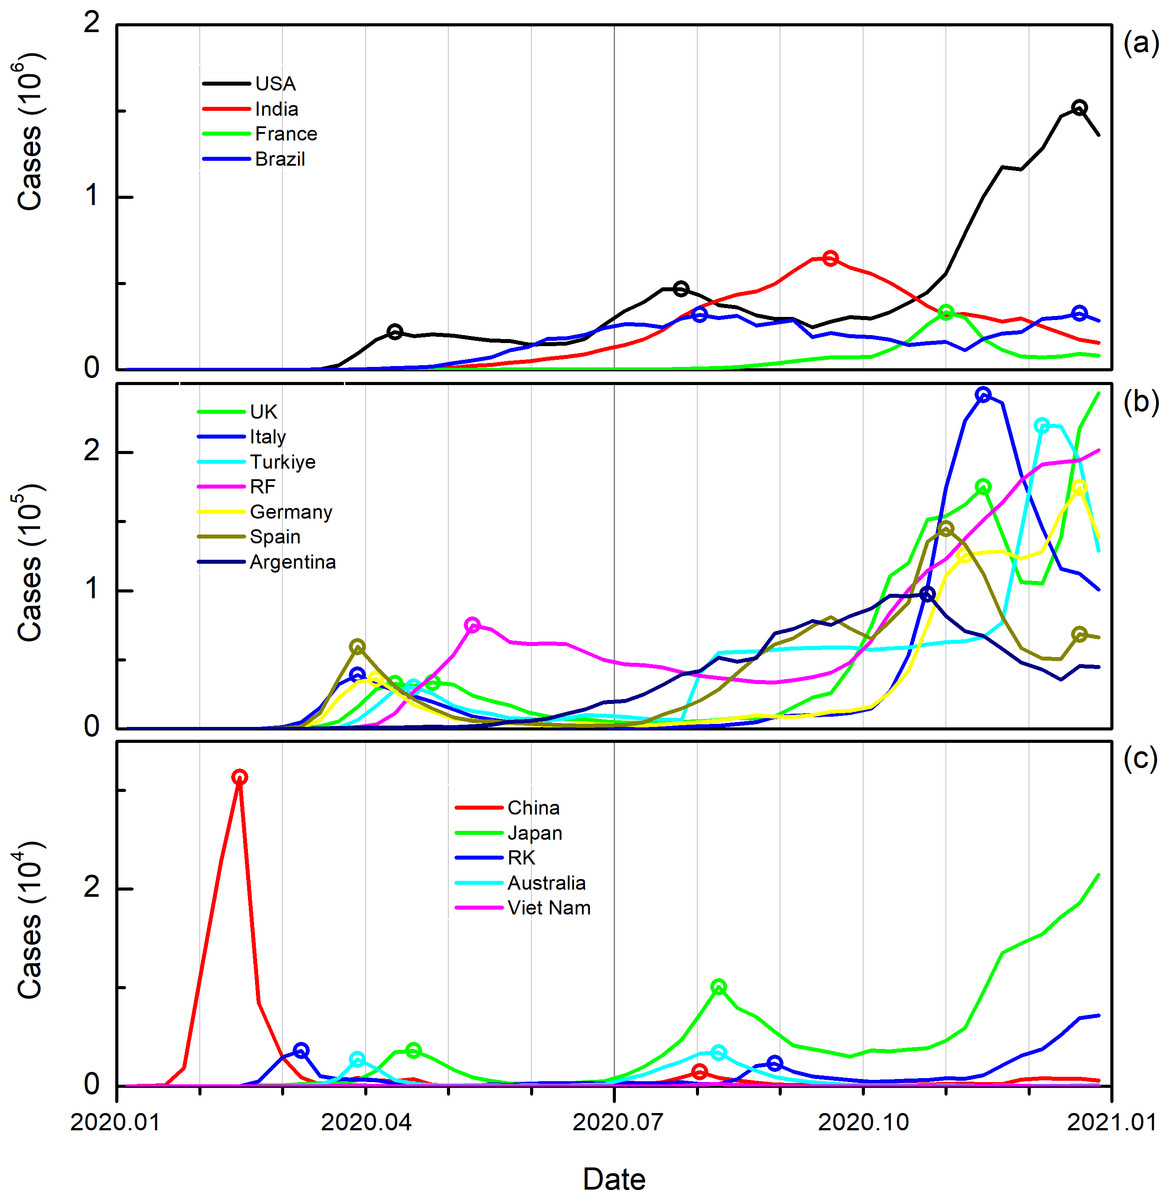
Figure 3: Weekly new infections in the first year of virus spread.
The line represents the change in new infections over time, and the hollow circles represent the extreme number of infections in each transmission process.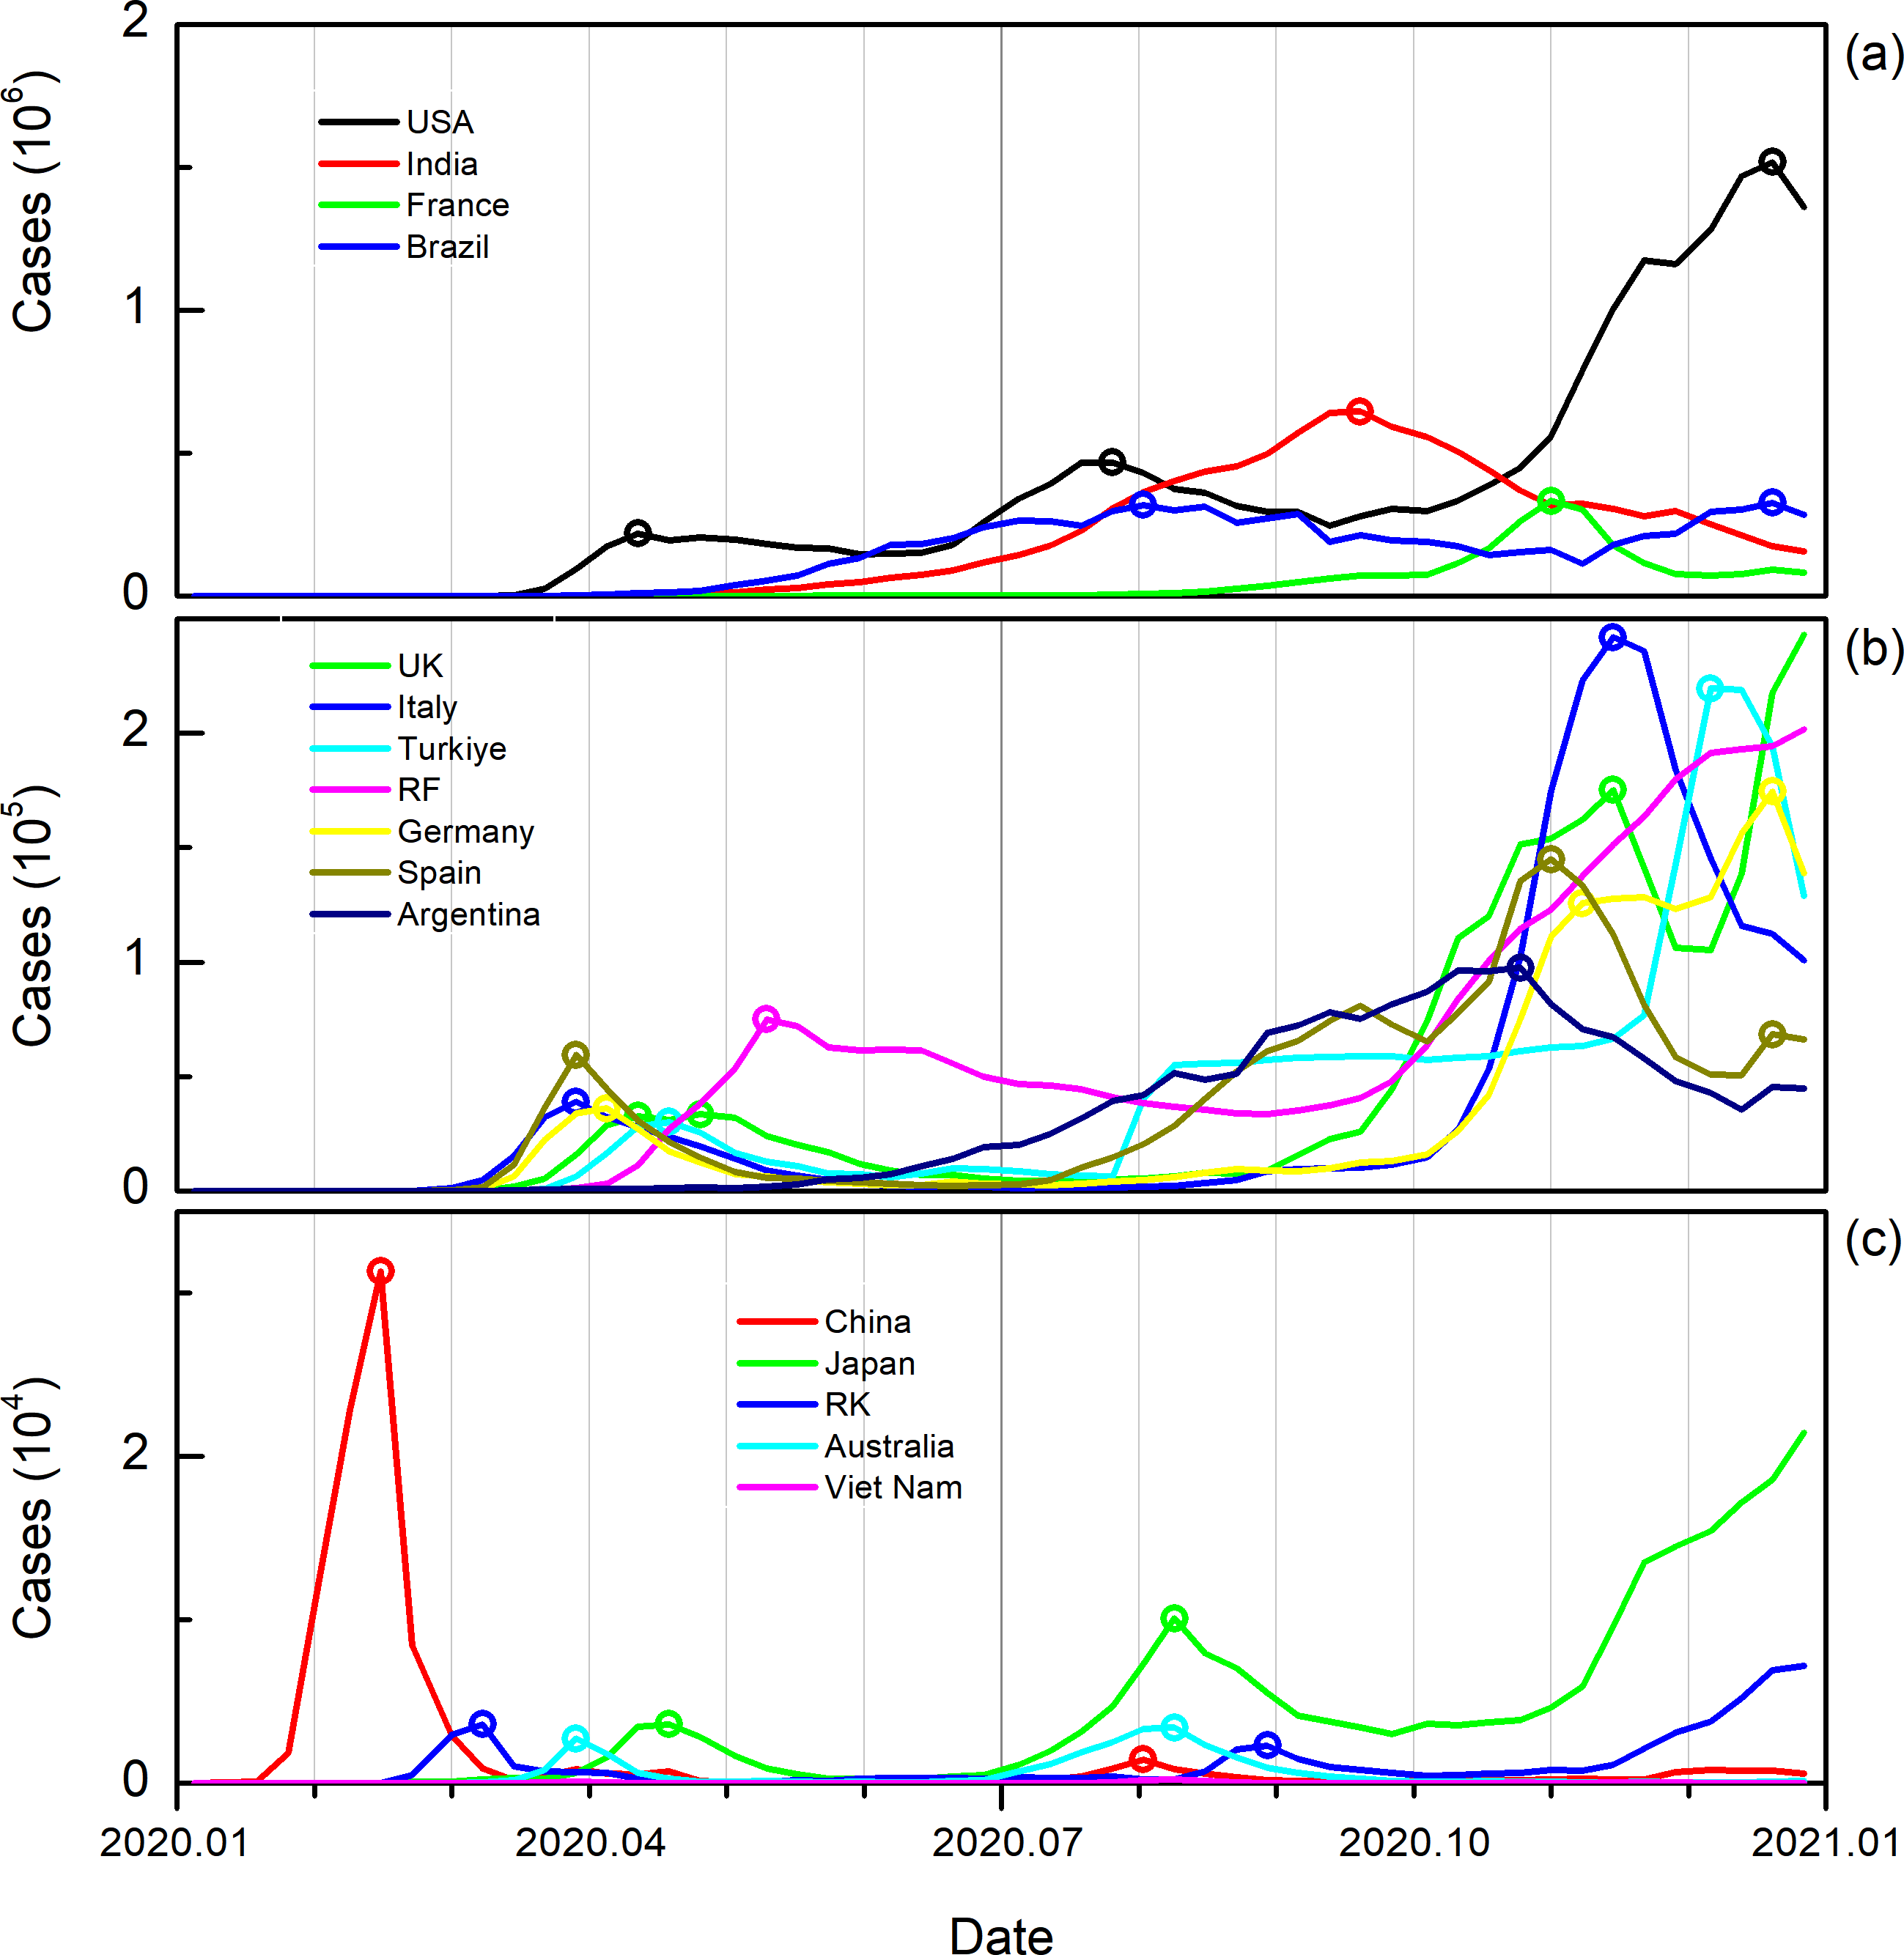
In summary, the COVID-19 began to break out at the beginning of 2020, and due to the implementation of different prevention and control measures, the duration of the first round of virus development varied among different countries and regions.
Transmission process characteristics
Analyzing the infectious characteristics of the COVID-19 in different countries, clarify the outbreak characteristics from 2020 to 2023 and across different seasons. Looking at the different years (Fig. 4), the COVID-19 mainly had a higher number of infections in 2021–2022, with the total number of infections in 16 countries reaching 206,292,542 (Table 4, same below) and 278,308,926 people, of which the USA had 49,788,796 infections in 2021, far greater than the 29,514,372 in 2020 and 23,241,424 in 2022. China saw the highest number of infections in 2022 with 98,844,792 people, accounting for 99.52% of the total infections over the four years. India also had the most infections in 2021, with 32,137,156 people, exceeding the sum of the other three years. France and Germany mainly had large-scale infection events in 2021 and 2022, with France’s infections in these two years being 19,089,232 and 16,116,768, respectively, and Germany had 12,510,148 and 22,828,916. Brazil’s main large-scale infections occurred in 2021, with the number reaching 22,638,118. RK and Japan are similar to China, with infections mainly occurring in 2022, with 30,031,644 and 27,037,740 people infected, accounting for 86.87% and 79.98% of the total infections over the four years, respectively. Italy had a higher number of infections in 2021 and 2022, with 10,365,125 and 12,730,831 people infected, respectively. The UK in 2021 and RF in 2022 each had more than 10 million people infected. Turkiye and Spain’s infections are similar to India and Brazil, with the highest number of infections in 2022, with Turkiye having 12,652,992 people infected and Spain reaching 8,121,429. Australia and Vietnam had the highest number of infections in 2022, with 7,990,657 and 9,184,979 people infected, respectively. Argentina had the most infections in 2021, with 6,909,146 people.
In summary, the infection patterns of these 16 countries can be categorized into three types: (1) Early Outbreak Pattern, where the majority of infections occur in the early stages, with the number of infections in 2021 approaching or exceeding 50% of the total infections over the four years. (2) Late Outbreak Pattern, where the majority of infections occur in the later stages, particularly in 2022, with the number of infections exceeding half of the total over the four-year period, including countries such as China, RK, Japan, Vietnam, and Australia. (3) Gradual Development Pattern, which is more prevalent in both 2022 and 2023, but slightly more so in 2023 compared to 2022, and overall, the development is relatively slow.
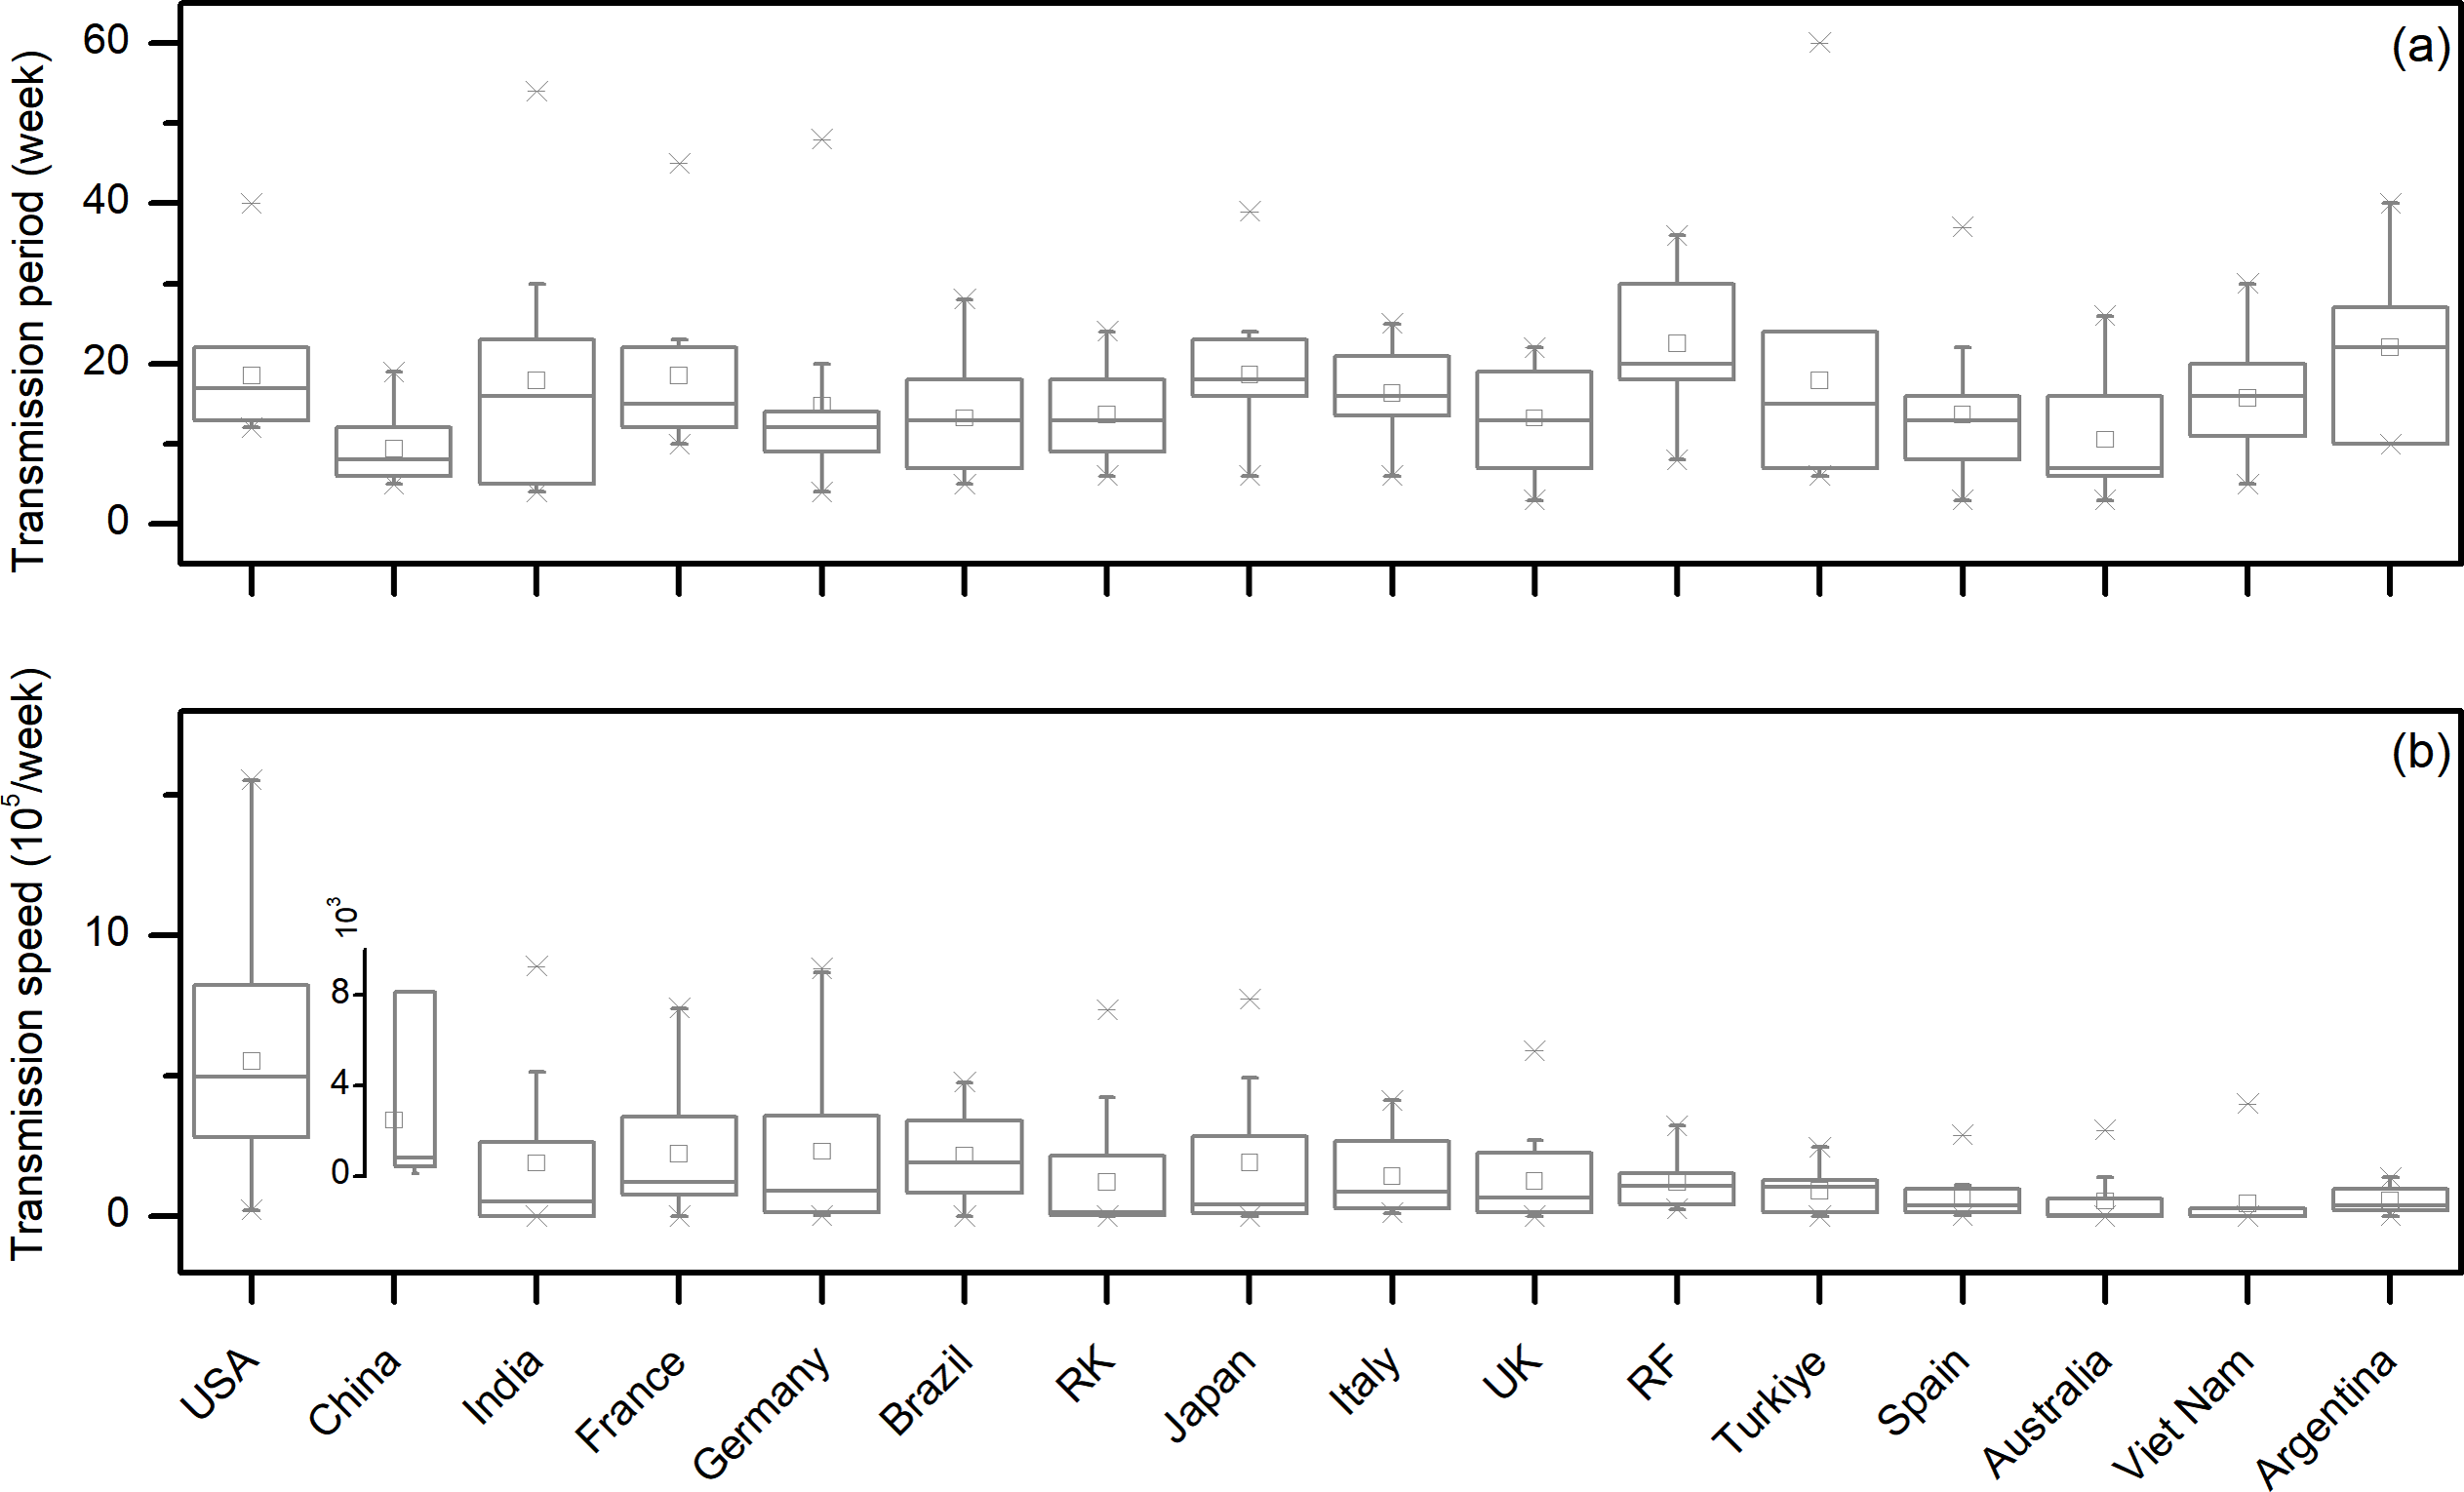
Looking at the duration of each viral outbreak from different countries (Fig. 5A), among the 16 countries, China has the shortest average duration, only 9.41 weeks, and is also the only country with a duration below 10 weeks. RF has the longest average duration of a single viral outbreak, reaching 22.56 weeks. Countries such as Australia, Brazil, the UK, RK, Spain, and Germany have an average duration of viral outbreaks of less than 15 weeks; while Vietnam, Italy, India, Turkiye, France, the USA, and Japan have an average duration of 15–20 weeks; Argentina and RF both have this value exceeding 20 weeks. The longest duration of a viral outbreak among different countries was Turkiye’s most recent outbreak, lasting for 60 weeks. Further analysis of the infection rate during viral outbreaks in different countries, that is, the number of infections per week in different transmission processes (Fig. 5B), shows that the country with the fewest average weekly infections is Vietnam, with only 46,922.27 people per week, while countries such as Australia, Argentina, Spain, and Turkiye have an average weekly infection rate of 50,000–100,000 people. RF, RK, the UK, Italy, India, and Japan have an average weekly infection rate of 100,000–200,000 people. Brazil, France, and Germany are in the range of 200,000–300,000 people per week. The most is China and the USA, reaching 342,916.31 people per week and 551,552.26 people per week, respectively. It is worth mentioning that the highest weekly infection rate was China’s large-scale infection at the end of 2023, with an average weekly infection rate of 6,874,966.00 people. This infection lasted for 13 weeks, causing a total of 89,374,560 people to be infected; if this super infection is excluded, China’s average weekly infection rate is only 31,866.32 people, the lowest among the 16 countries.
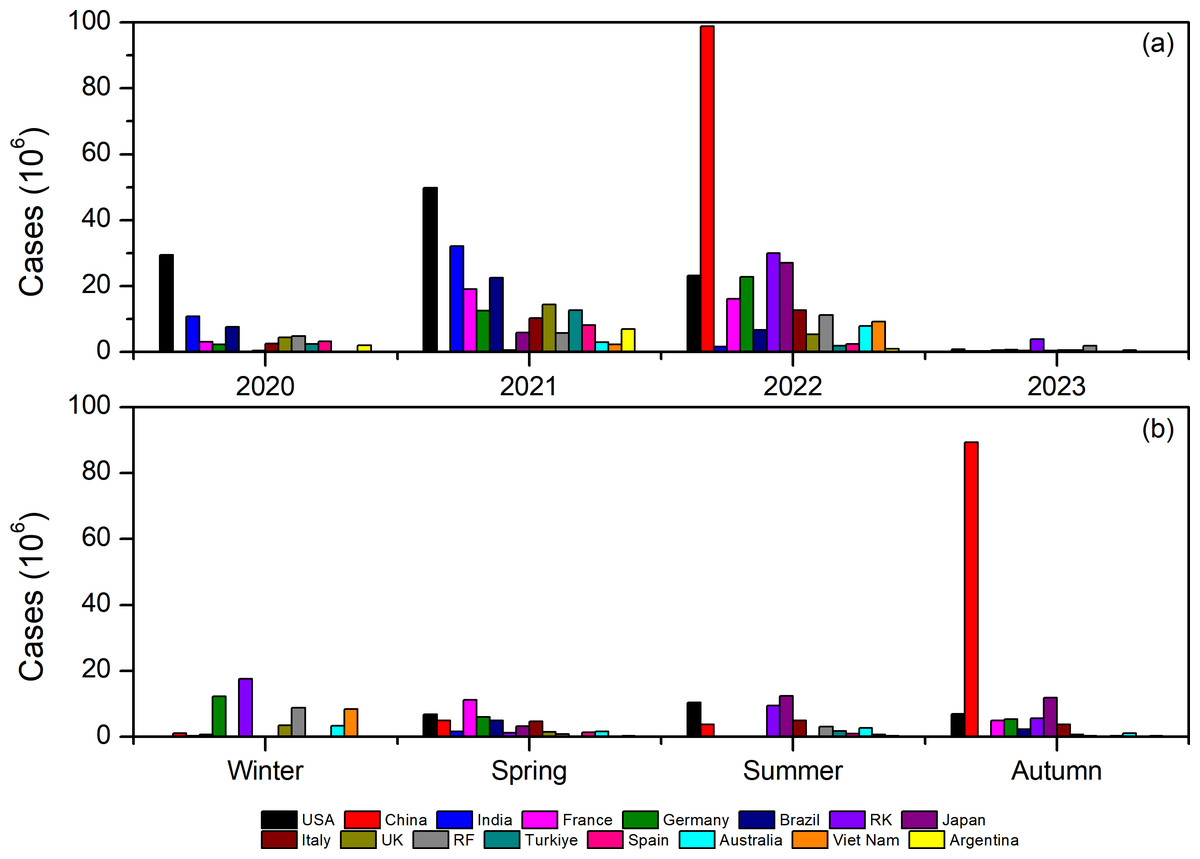
Figure 4: Number of infections during the virus spread process in different countries for different years (A) and different seasons (B).
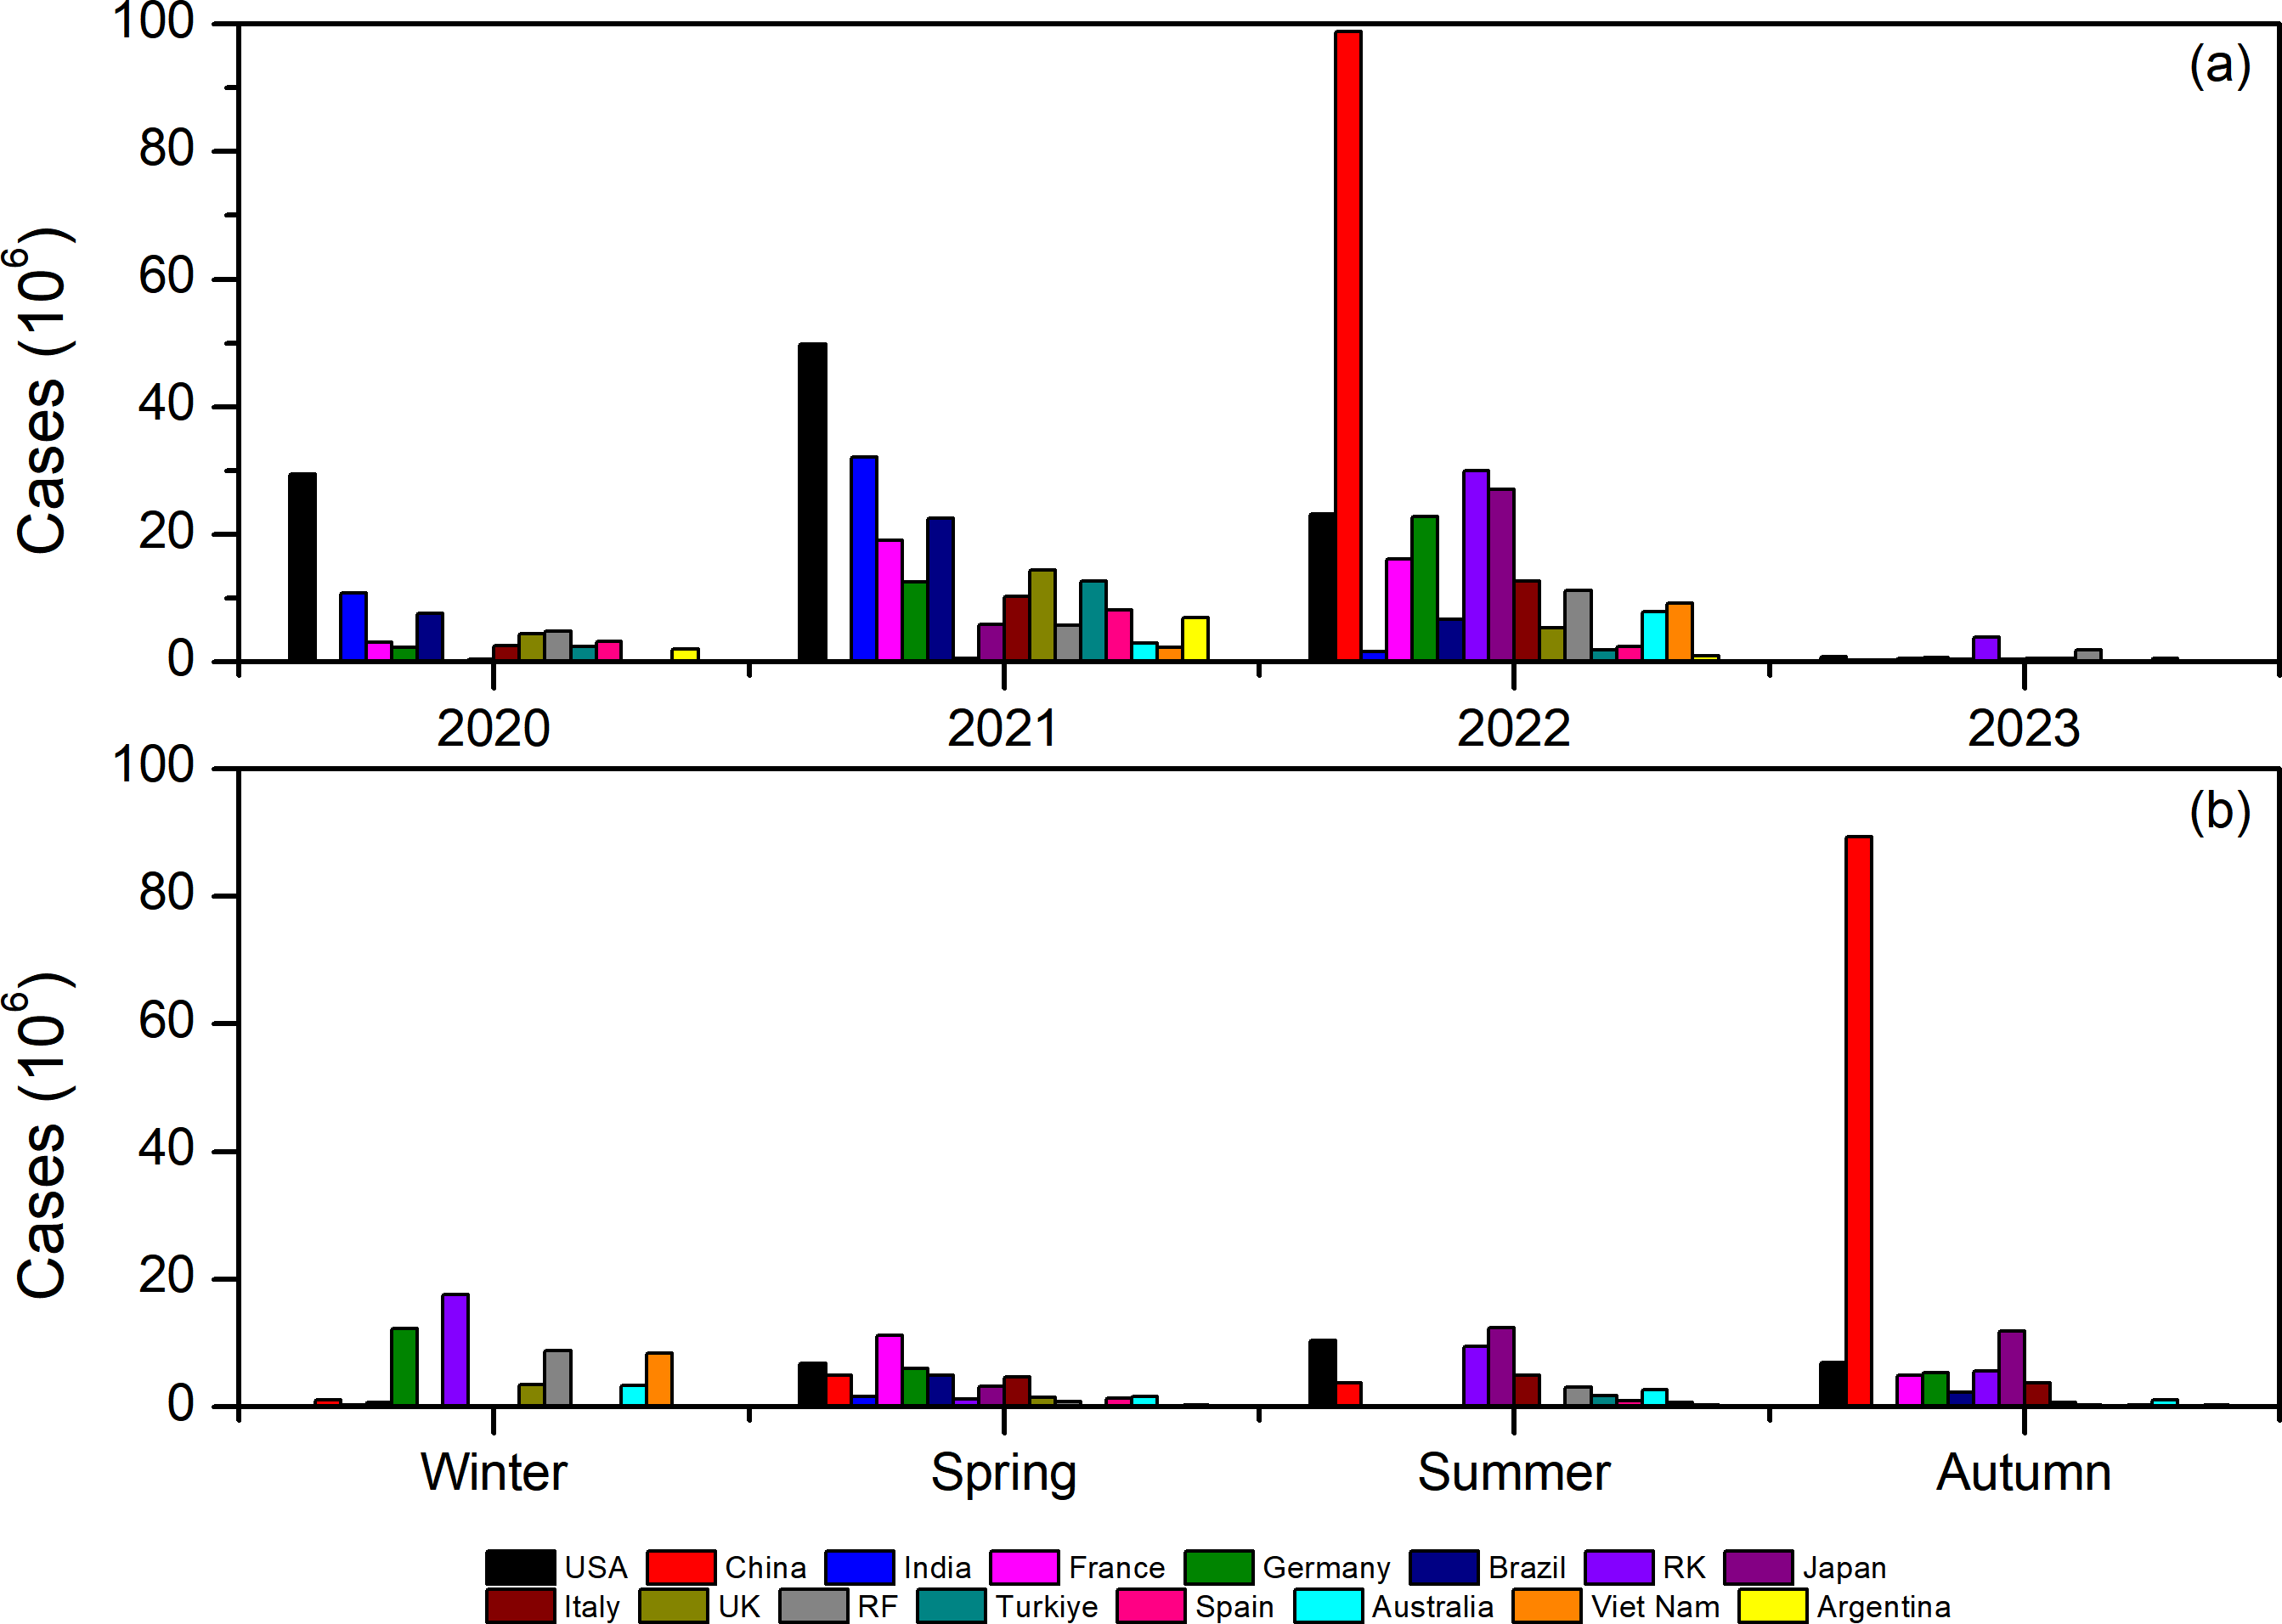
| Country | China | RK | Japan | Australia | Vietnam | Germany | Italy | RF |
|---|---|---|---|---|---|---|---|---|
| 2020 | 101,699 | 81,175 | 432,772 | 28,922 | 1,546 | 2,336,712 | 2,625,095 | 4,880,260 |
| 2021 | 35,650 | 586,210 | 5,944,946 | 2,987,907 | 2,340,423 | 12,510,148 | 10,365,125 | 5,770,587 |
| 2022 | 98,844,792 | 30,031,644 | 27,037,740 | 7,990,657 | 9,184,979 | 22,828,916 | 12,730,831 | 11,176,133 |
| 2023 | 340,000 | 3,872,842 | 388,112 | 671,687 | 97,050 | 761,980 | 546,666 | 1,860,774 |
| Percentage of cases in 2022 | 99.52% | 86.87% | 79.98% | 68.42% | 79.02% | 59.39% | 48.47% | 47.18% |
| Country | USA | India | France | Brazil | UK | Türkiye | Spain | Argentina |
| 2020 | 29,514,372 | 10,904,938 | 3,169,968 | 7,700,577 | 4,516,282 | 2,424,322 | 3,221,680 | 2,138,230 |
| 2021 | 49,788,796 | 32,137,156 | 19,089,232 | 22,638,118 | 14,414,677 | 12,652,992 | 8,121,429 | 6,909,146 |
| 2022 | 23,241,424 | 1,640,544 | 16,116,768 | 6,746,824 | 5,336,780 | 1,927,368 | 2,470,263 | 1,003,263 |
| 2023 | 892,232 | 318,816 | 621,516 | 434,440 | 554,270 | 0 | 166,966 | 25,891 |
| Percentage of cases in 2021 | 48.13% | 71.41% | 48.95% | 60.34% | 58.07% | 74.41% | 58.09% | 68.57% |
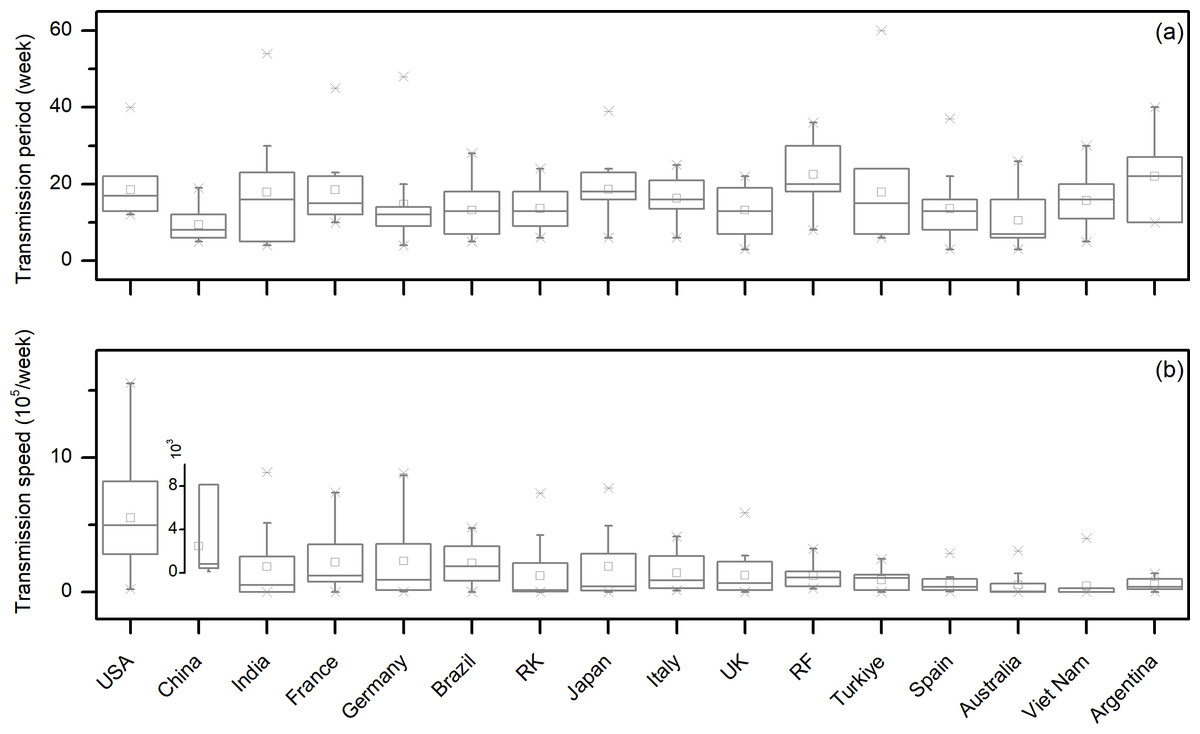
Figure 5: Box plots of the duration of virus outbreaks (A) and the transmission speed (B) in different countries.
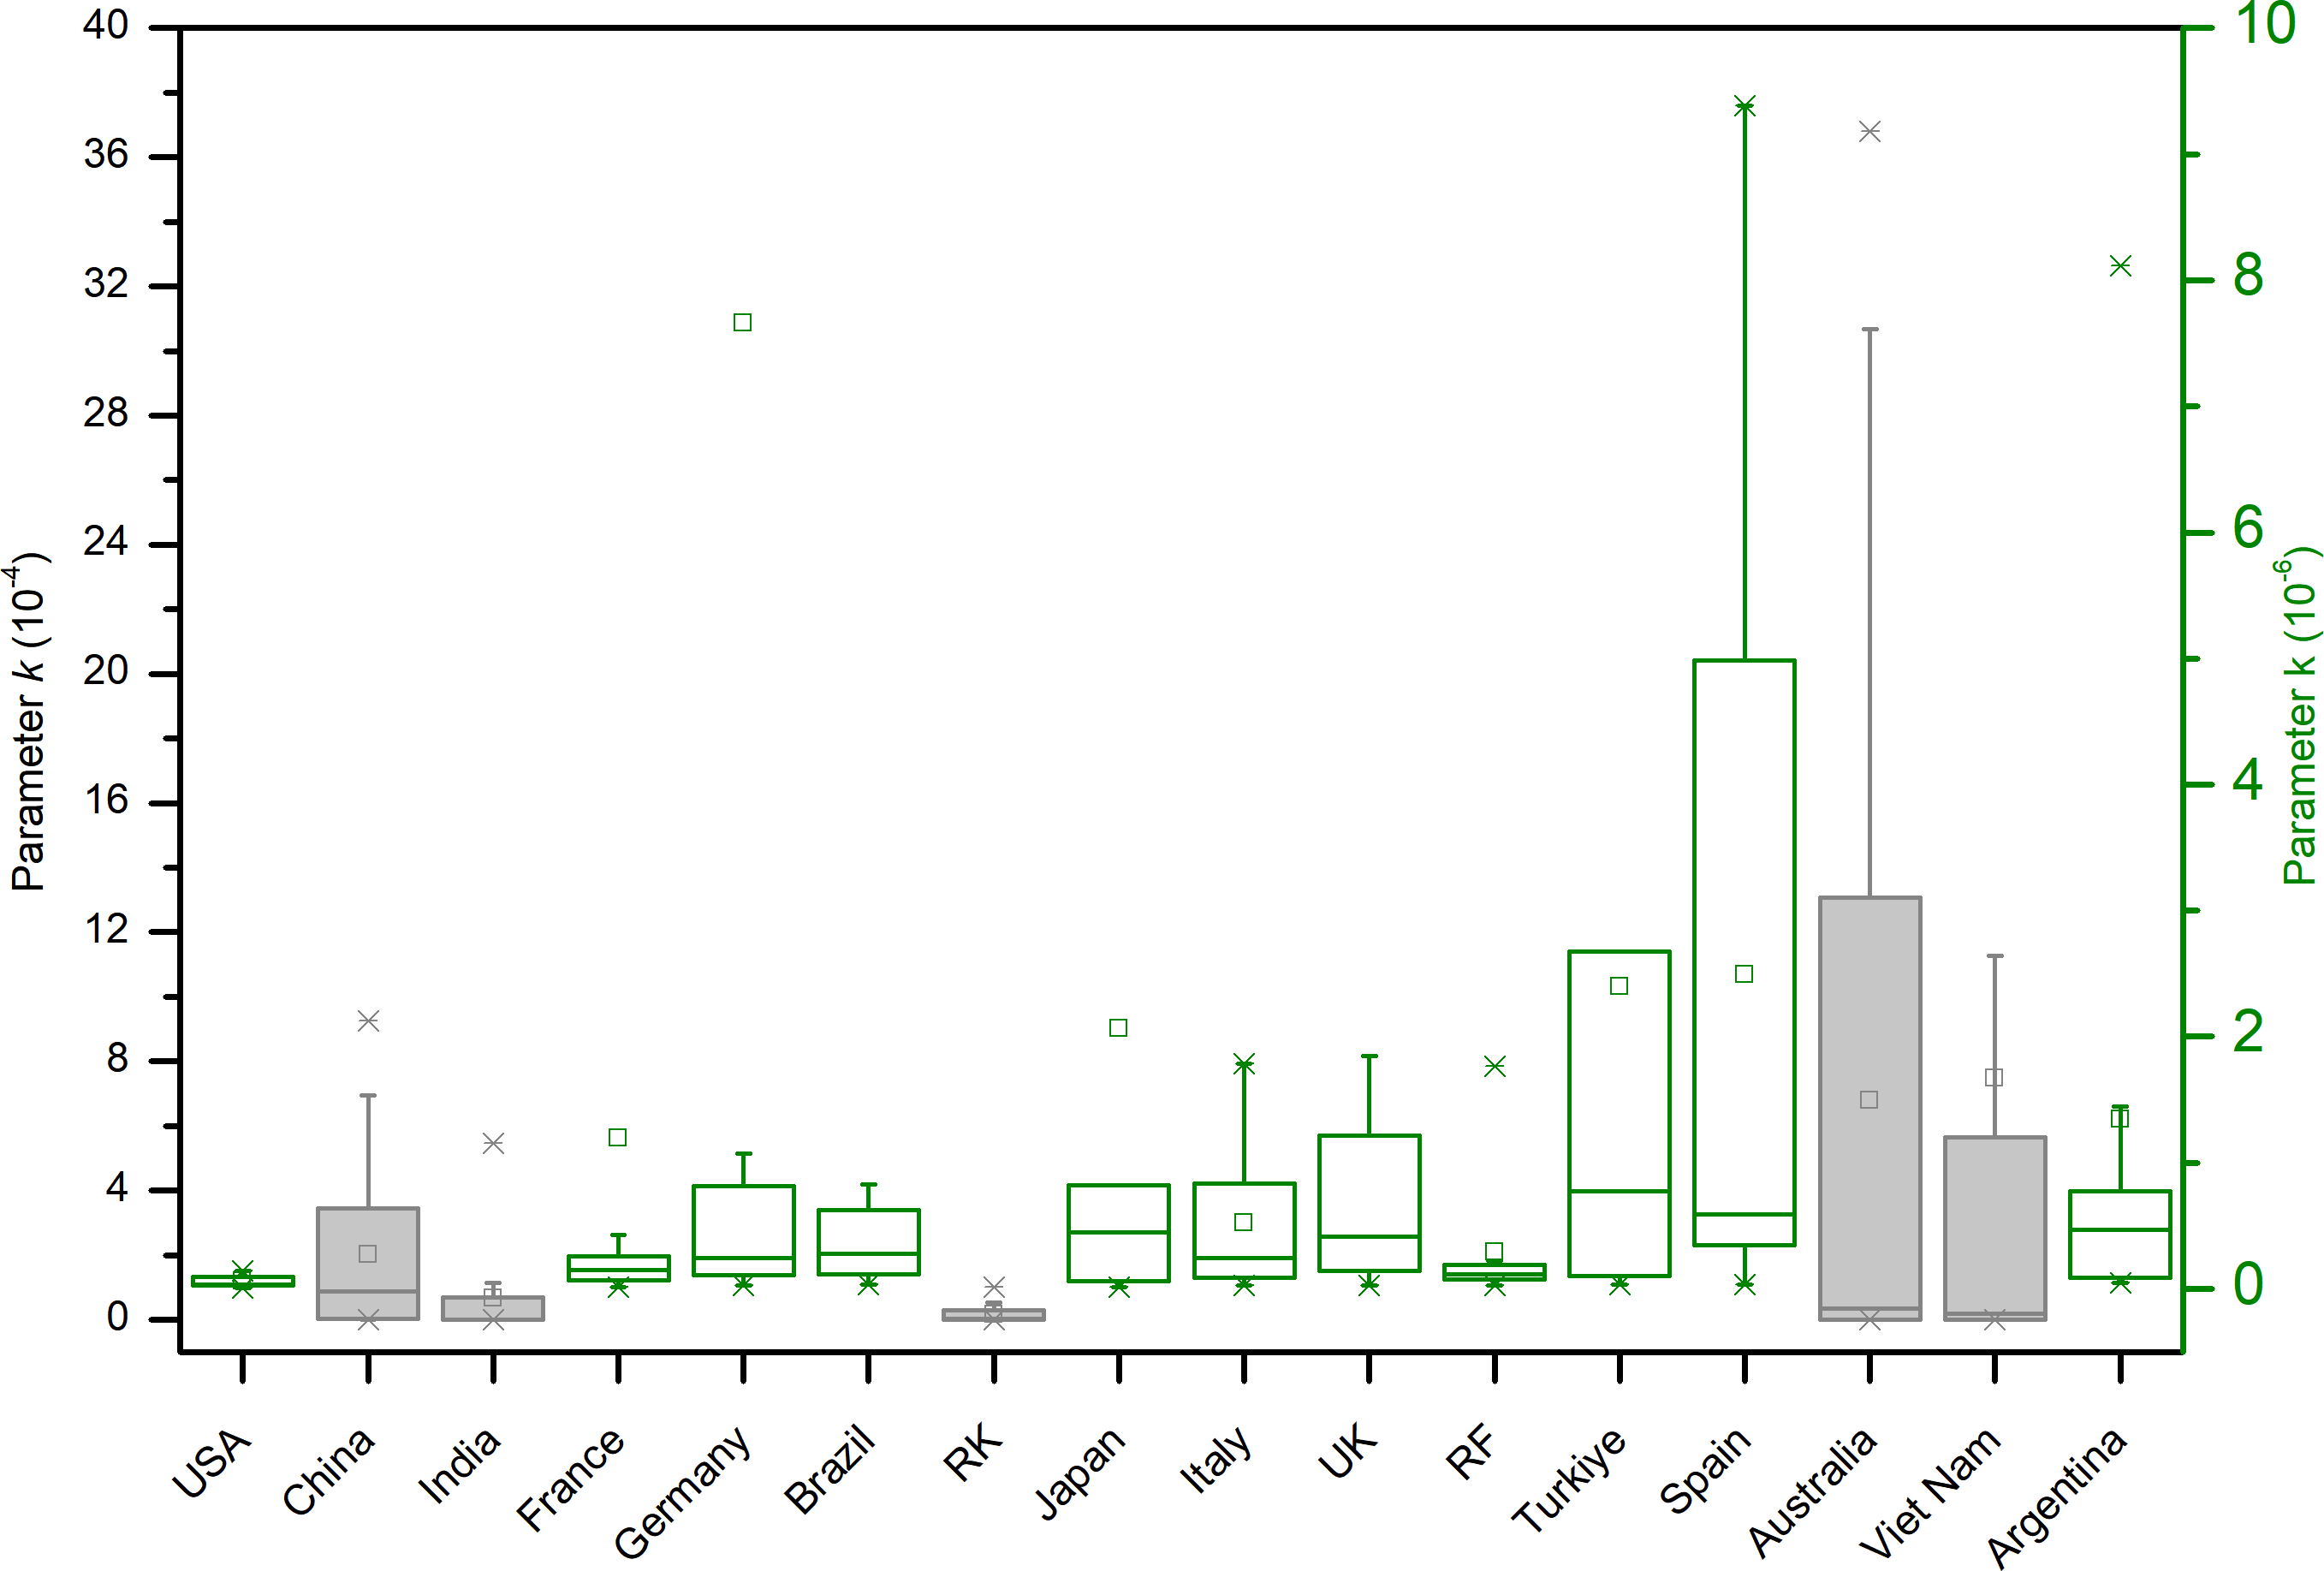
In the final analysis of the distribution of the parameter k values in the transmission process of the COVID-19 in different countries (Fig. 6), it can be seen that the range of k values for Australia, Vietnam, China, India, and RK is relatively large, indicating that there are significant differences in the outbreak processes over the years, suggesting that the epidemic prevention policies at different times are significantly different. Next, the range of k values for Spain, Turkiye, the UK, Italy, Japan, Argentina, and Germany is larger compared to that of the USA, France, and RF, indicating that the former’s epidemic prevention policies are in flux, while the latter’s epidemic control policies have seen less change.

Figure 6: Box plot of the statistical distribution of the virus transmission model parameter k in different countries.
Results and Discussions
In the past several years, the COVID-19 coronavirus has resulted in a substantial global burden of infection and mortality, garnering significant attention from both the public and governmental sectors. Nevertheless, the characteristics of the pandemic and the alterations precipitated by governmental policies necessitate further investigation to augment the capacity of governments to respond effectively to future epidemics. Based on the Logistic model, by analyzing the COVID-19 data published by the World Health Organization (WHO), we provide an in-depth examination of the transmission characteristics in 16 countries significantly impacted by the COVID-19 pandemic. The research reveals that by the end of 2023, the global number of infections surged to 772 million, with over seven million deaths. The United States and China topped the list in terms of infection numbers, while Brazil’s high mortality rate highlighted the differences in pandemic response strategies among countries. The inconsistency in the timing of the first case records and the occurrence of multiple infection peaks underscore the complexity of virus transmission. Particularly, China’s super-spreading events led to a massive number of infections in a short period, possibly related to specific controllable social activities or policy changes. The fluctuation in the parameter k of the Logistic model reflects the adaptability and changes in different countries’ epidemic prevention policies; Australia, Vietnam, and China showed significant policy adjustments, while the United States, France, and Russia remained relatively stable. These findings offer important perspectives for understanding global pandemic transmission patterns and assessing the effectiveness of various countries’ epidemic prevention strategies, aiding in guidance of future public health policy formulation and pandemic response measures. The results of this study provide a scientific basis for global pandemic control, helping governments and health organizations to develop more effective response strategies based on virus transmission characteristics, allocate medical resources rationally, and reduce societal harm. It can help countries develop customized prevention strategies, such as late—outbreak countries learning from early—outbreak countries to take preventive measures in advance. It also guides the planning of medical resources, as seen in China’s super outbreak at the end of 2022 highlighting the need for rapid and large—scale allocation of medical resources. Moreover, it promotes international cooperation and knowledge sharing, such as countries exchanging best practices and conducting joint research. In addition, it can be used for the validation and improvement of epidemiological models as well as the prediction of future pandemics.
Conclusions
This study employs real-time COVID-19 infection data from the World Health Organization and applies the Logistic model to analyze the pandemic transmission characteristics in 16 countries or regions with over ten million infections worldwide from January 1, 2020, to December 31, 2023. The findings reveal that as of December 31, 2023, the global cumulative infections exceeded 772 million with over seven million deaths. The USA and China had the highest infection numbers at 103 million and 99 million respectively, while Brazil had the highest mortality rate of 1.87%. The timing of the first cases varied across countries, ranging from January 2020 to March. Some countries like India, Brazil, and the USA experienced multiple infection waves after their initial peak, indicating three main outbreak modes: early outbreak, late outbreak, and gradual development.
Countries with early outbreaks, such as India, Brazil, USA, and Argentina, tend to have higher mortality rates (more than 1%). These countries failed to take strict prevention and control measures in the early stages of the outbreak, and their frequent international travel and business activities jointly accelerated the spread of the virus. In addition, the lack of medical facilities in remote areas of these countries leads to poor timely treatment, increasing the risk of severe illness and death. In contrast, countries such as China, PK, Japan, and Australia have had mortality rates of 0.1–0.2%. These countries have taken effective prevention and control measures in the late stages of the epidemic, such as strict quarantine policies, large-scale nucleic acid testing, and timely allocation of medical resources, which have effectively controlled the spread of the virus. The allocation of medical resources is more reasonable to ensure that severe patients can get timely treatment, so the mortality rate is low. Notably, China had a super outbreak at the end of 2022 with nearly 100 million infections in just 13 weeks, averaging over 6 million infections per week. Excluding this event, China’s average weekly infection number was the lowest at 31,866.32, while the USA had the highest at 551,552.26.
By examining the parameter k in the Logistic model, we observed differences in epidemic prevention policies. Australia, Vietnam, China, India, and RK exhibit a relatively large range of k values, indicating significant variations in the outbreak processes over the years. This suggests that their epidemic prevention policies have changed considerably over time. Additionally, Spain, Turkiye, the UK, Italy, Japan, Argentina, and Germany show a larger range of k values compared to the USA, France, and RF. This indicates that the former group’s epidemic prevention policies are more variable, while the latter group’s policies have been relatively stable.
Supplemental Information
Results of the box plots of the duration of virus outbreaks
The metadata downloaded from the WHO site
54940 lines, with data including 10 column: yearreported, month_reported, day_reported, Country_code, Country, WHO_region, New_cases, Cumulative_cases, New_deaths, Cumulative_deaths.