
The association between sleep latency and suboptimal self-rated health in medical students: a cross-sectional study
- Published
- Accepted
- Received
- Academic Editor
- Oyelola Adegboye
- Subject Areas
- Epidemiology, Public Health, Mental Health
- Keywords
- Sleep latency, Self-rated health, Medical students, China
- Copyright
- © 2025 Jin et al.
- Licence
- This is an open access article distributed under the terms of the Creative Commons Attribution License, which permits using, remixing, and building upon the work non-commercially, as long as it is properly attributed. For attribution, the original author(s), title, publication source (PeerJ) and either DOI or URL of the article must be cited.
- Cite this article
- 2025. The association between sleep latency and suboptimal self-rated health in medical students: a cross-sectional study. PeerJ 13:e19459 https://doi.org/10.7717/peerj.19459
Abstract
Background
Evidence has suggested that prolonged sleep latency was associated with negative health outcomes. Little is known about the association between sleep latency and health status in university students. This study examined the association between sleep latency and suboptimal self-rated health (SRH) in medical students.
Methods
A cross-sectional study was conducted involving 1,396 medical students aged 18 years and older selected through stratified cluster random sampling from an eastern Chinese university. Standardized measures of sleep latency and SRH were administered. Sleep latency was divided into four categories: <10 min, 10–19 min, 20–29 min, and ≥30 min, with “prolonged sleep latency” defined as a latency of ≥30 min. Logistic regression was used to investigate the association between sleep latency and suboptimal SRH.
Results
Of the 1,396 participants (mean age 19.6 ± 1.2 years; 58.6% female), 599 (42.9%) reported suboptimal SRH, and 390 (27.9%) reported prolonged sleep latency. Longer sleep latency was associated with higher odds of suboptimal SRH. Comparing those with sleep latency <10 min, multivariable-adjusted ORs (95% CIs) for those with sleep latency of 10–19 min, 20–29 min, and ≥30 min were 1.48 (1.07, 2.05), 2.03 (1.39, 2.97), and 2.12 (1.52, 2.96) (P for trend <0.001), respectively. The results of the stratified and sensitivity analyses were generally consistent with the main findings.
Conclusion
Our study found that prolonged sleep latency was strongly linked to higher odds of suboptimal SRH in medical students, even after accounting for potential confounders. Intervention programs targeting sleep latency may potentially promote health in this population.
Introduction
The medical profession is known for being difficult and hard, requiring tremendous effort from medical students. Beyond academic pressure, medical students grapple with challenges like peer competition, uncertain career prospects, and financial constraints (Dyrbye, Thomas & Shanafelt, 2005; Nunez-Mulder, 2018). Such stressors may pose detrimental effects on the students’ health, particularly their mental well-being (Dyrbye, Thomas & Shanafelt, 2006; Tosevski, Milovancevic & Gajic, 2010). Based on data from 167 cross-sectional and 16 longitudinal studies from 43 countries, Rotenstein et al. (2016) showed that the pooled prevalence of depressive symptoms among medical students was 27.2%, which was higher than that of non-medical school students (Eisenberg et al., 2007; Steptoe et al., 2007). The available evidence indicates that medical students experience worse health status compared to the general population (Dahlin, Joneborg & Runeson, 2005; Dyrbye, Thomas & Shanafelt, 2005). Self-rated health (SRH) is a measure that captures an individual’s evaluation of their general health condition, which has consistently demonstrated strong reliability, validity, and predictive power across various diseases and health conditions (Lundberg & Manderbacka, 1996). As medical students are the future medical workforce, their health status is paramount. So far, previous studies have linked several adverse lifestyle factors, such as smoking, drinking, higher body mass index (BMI), and physical inactivity, which may contribute to the poor health status of medical students (Liu et al., 2020; Mikolajczyk et al., 2008; Voltmer, Kotter & Spahn, 2012). However, more research is needed to identify other modifiable factors that may impact their suboptimal SRH.
Sleep is a critical health behavior central to human health. Sleep latency, the time it takes to fall asleep after going to bed, is an important indicator of sleep quality and reflects the degree of difficulty in falling asleep (Halson et al., 2021; Siddiquee et al., 2023). Healthy individuals typically fall asleep within 10–20 min (Jung et al., 2013). Studies have linked prolonged sleep latency to negative health outcomes, including poorer mental health, hypertension, and increased risk of mortality (Joshi, 2022; Siddiquee et al., 2023; Zhong et al., 2022). However, most of these studies have focused on middle-aged and elderly populations (Robbins et al., 2021; Siddiquee et al., 2023; Zhong et al., 2022). Medical students’ unique academic pressures and irregular work schedules make their sleep patterns and health status potentially different from that of the general population. Additionally, epidemiological data on sleep latency among young adults, particularly medical students, remains limited. To our knowledge, no studies have explored the association between sleep latency and suboptimal SRH in medical students. A systematic review suggests that cultural and ethnic factors may impact sleep patterns, including sleep latency (Jeon, Dimitriou & Halstead, 2021). Moreover, previous studies have generally not considered important confounding such as sleep duration, chronotype, and nap habits, which are potential confounders that are closely related to sleep latency and SRH (Baek, Jeong & Lee, 2024; Randler, Schredl & Göritz, 2017; Stefan et al., 2017; Walsh, Repa & Garland, 2022).
Given the above research limitations, our study aims to investigate whether sleep latency is associated with suboptimal SRH in Chinese medical students while accounting for confounders. We hypothesize that prolonged sleep latency is associated with an increased risk of suboptimal SRH and that this association may be moderated by lifestyle factors such as sleep duration, chronotype, afternoon nap, midnight snack habit, and BMI. Suboptimal SRH in medical students could inform targeted interventions to enhance their health outcomes. Additionally, these findings may offer epidemiological evidence to guide health assessment and management strategies for other high-stress occupational groups experiencing similar challenges.
Materials & Methods
Study population
This cross-sectional study employed stratified cluster random sampling to select medical university students in Zhejiang Province in China, between April to September 2021 (Ding et al., 2022). All students were first stratified by specialty (clinical medicine, nursing, and others) to ensure a representative sample from each group. Following stratification, classes were randomly selected by grade level within each specialty using a computer-generated random number table. The number of classes chosen was proportional to the number of students in each specialty relative to the total student population. All students enrolled in the selected classes were recruited in the survey. To verify the sample’s representativeness, we compared the final sample’s characteristics (gender, age, and grade distribution) with those of the overall student population, finding no significant differences (P > 0.05).
Participation in the survey was voluntary and information was collected after obtaining written informed consent. Inclusion criteria were age 18 and above, and majoring in medicine. Among the 1,635 participants surveyed (Ding et al., 2022), 24 were excluded for missing information on most variables, 85 for missing SRH data, and 130 for sleep latency data. The final sample comprised 1,396 medical students from over 12 majors. The Ethics Committee of Wenzhou Medical University approved this study (Ethics Approval Document No 2021-022).
Assessment of sleep latency
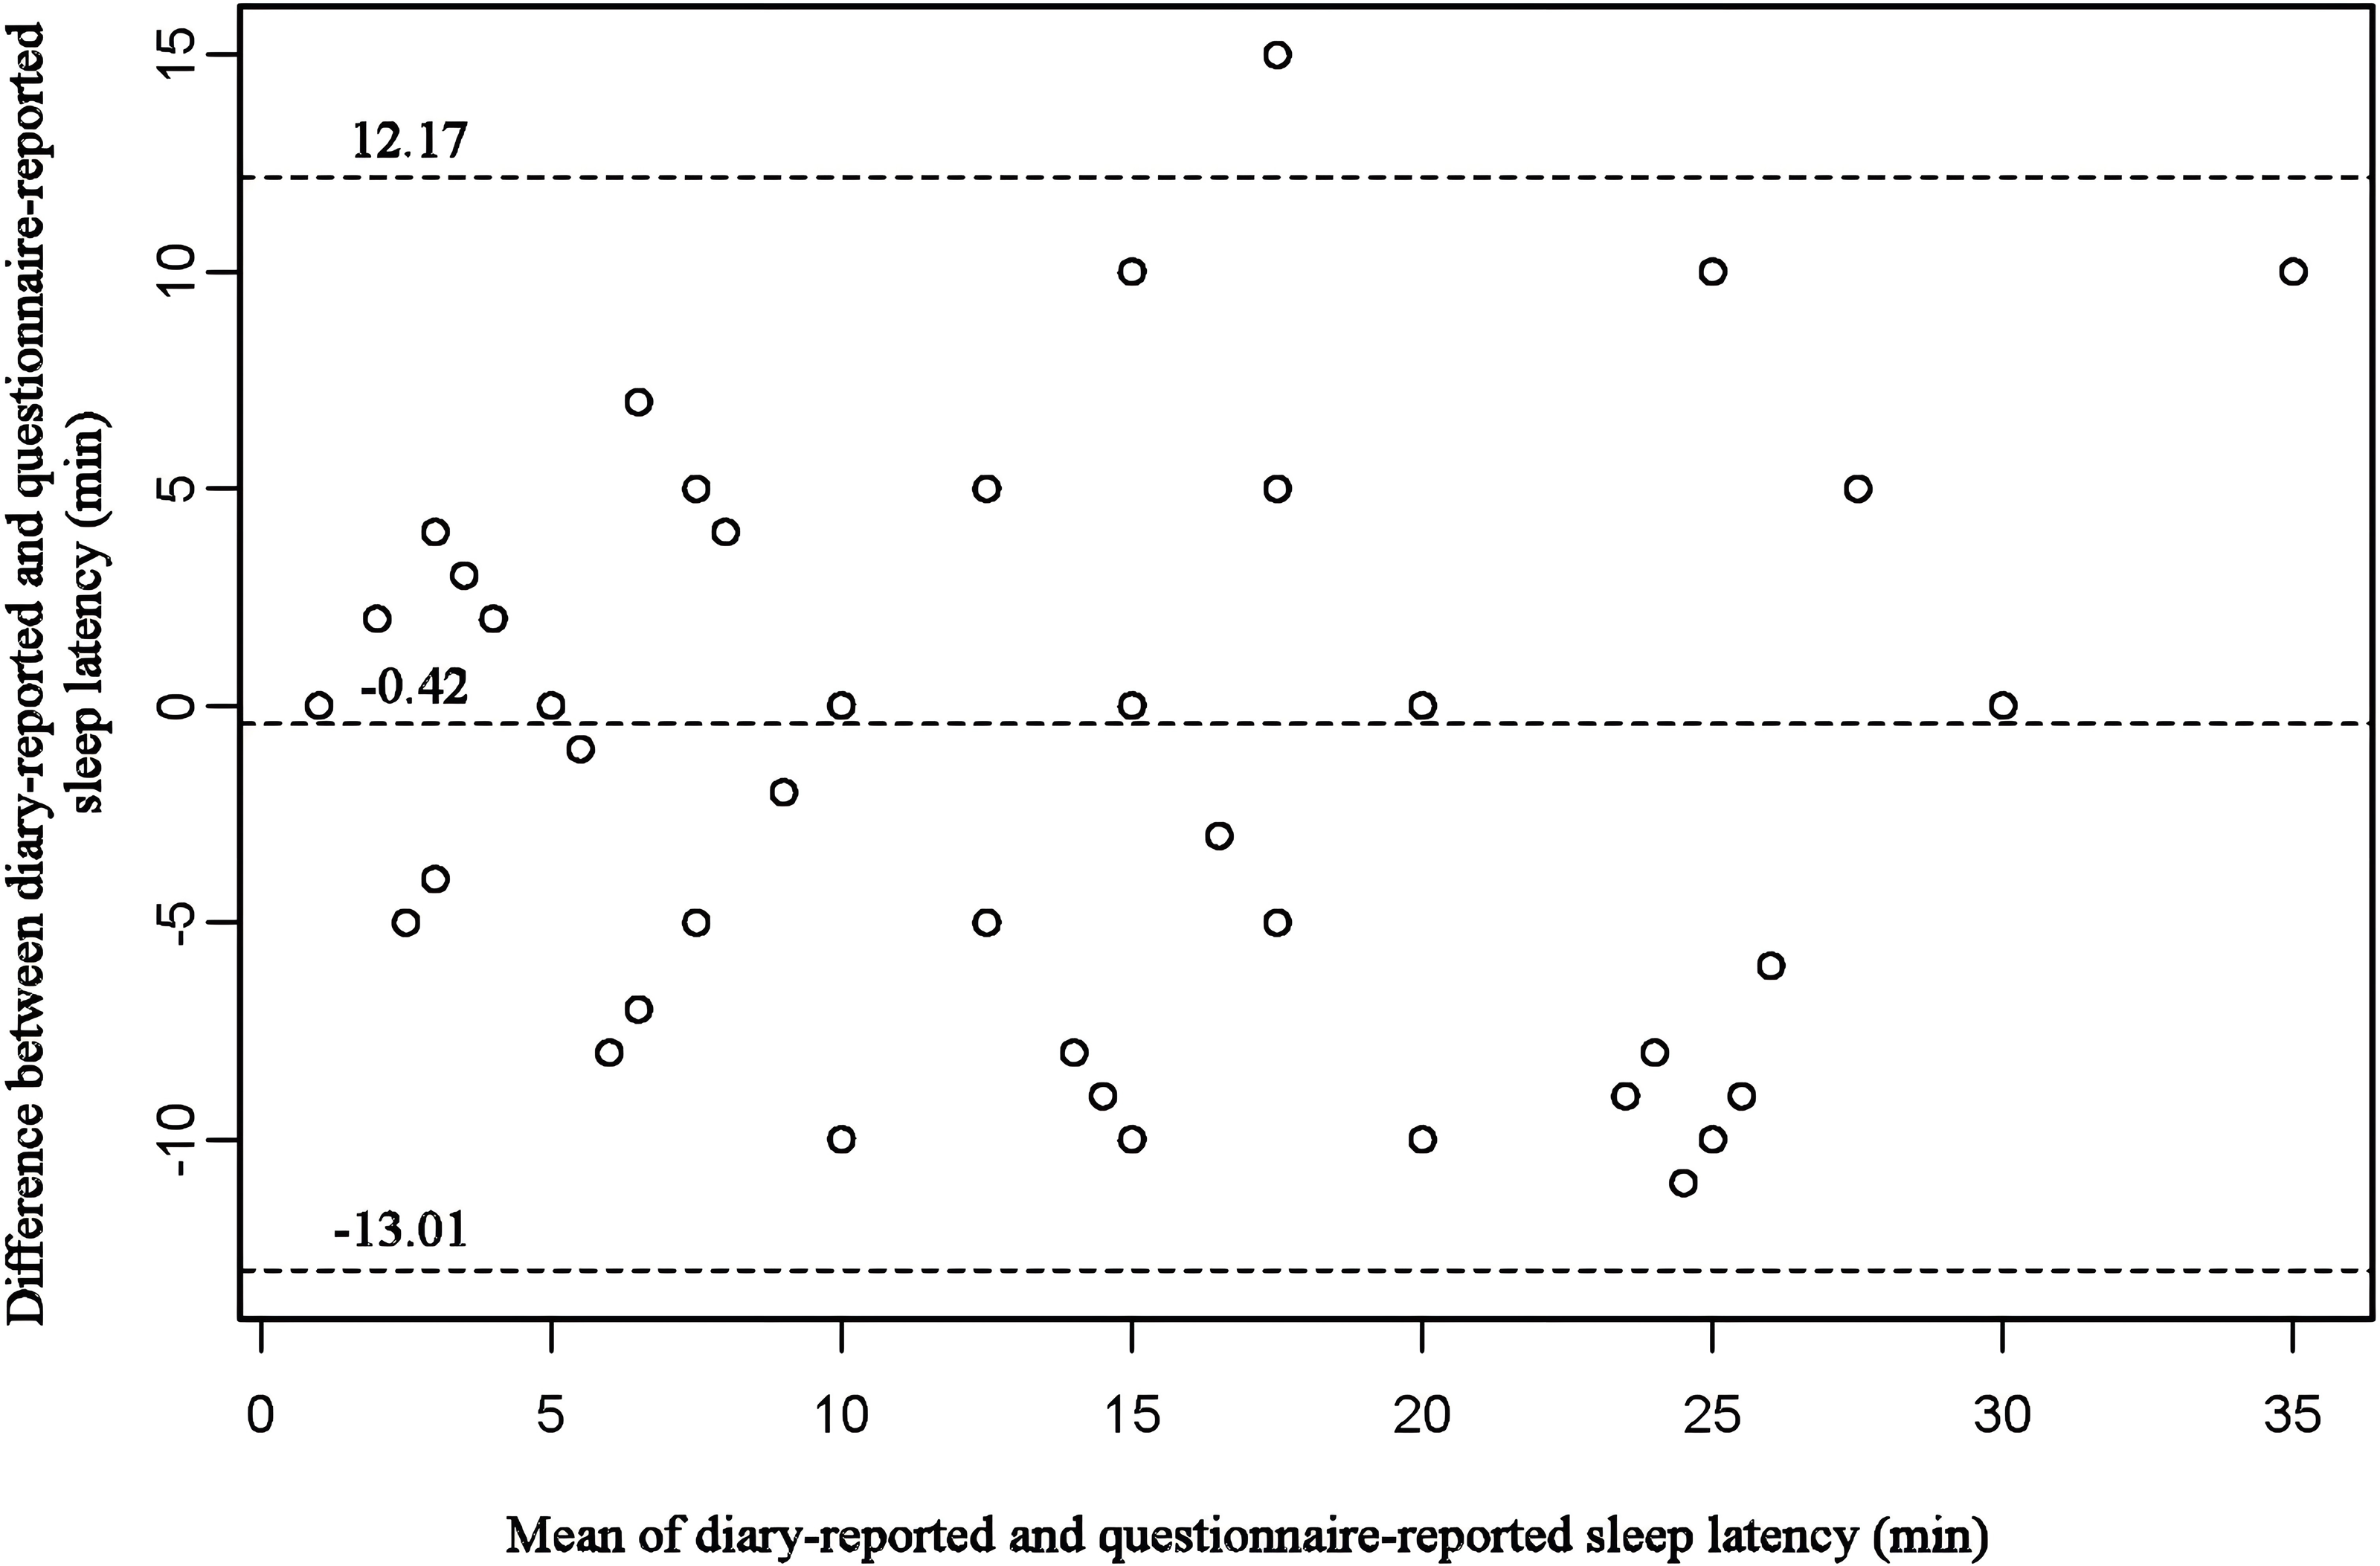
Sleep latency was determined by the question “During the past month, how long (in minutes) has it taken you to fall asleep each night?” Previous studies have demonstrated that self-reported sleep latency has been widely used and scientifically validated in sleep epidemiology studies (Siddiquee et al., 2023; Zhang et al., 2023). Prior studies have suggested that self-reported sleep latency is highly correlated with actigraphy-assessed sleep latency (r = 0.667, P < 0.001) (Biddle et al., 2015). To assess the test-retest reliability and calibration validity of our measurement, a repeat survey was conducted on 163 medical students, approximately 10 months after the initial survey. The median (P 25, P 75) sleep latency remained consistent, and the test–retest reliability was 0.72. Additionally, 60 participants were asked to record their sleep diary for five consecutive days (at least one weekend day), to confirm the consistency between diary-reported and questionnaire-reported sleep latency, which was presented through the Bland-Altman plot (Fig. 1). The sleep diary data were aggregated into representative values for each participant through a weighting process. The weighted average sleep latency for each participant was calculated as: average sleep latency on weekdays ×5/7 + average sleep latency on rest days or the value of a single rest day ×2/7 (Dashti et al., 2022; Kim et al., 2016). The intraclass correlation coefficient (ICC) for the repeatability of sleep latency recorded in the sleep diaries was 0.900 (P < 0.001), indicating good agreement. In this study, the restricted cubic spline (RCS) demonstrated that sleep latency had a dose–response relationship with suboptimal SRH (P for overall <0.001, P for non-linear = 0.200). According to the curve fit and previous literature (Albqoor & Shaheen, 2021; Lemma et al., 2012; Lohsoonthorn et al., 2013), sleep latency was categorized into four groups: <10 min, 10–19 min, 20–29 min, and ≥30 min.

Figure 1: Bland–Altman (difference vs average) of diary-reported sleep latency vs questionnaire-reported sleep latency.
Assessment of self-rated health
SRH, which provides a comprehensive reflection of a person’s subjective and objective health, has been widely used in health surveys of both adolescents and adults (Johnson & Richter, 2002; Kim et al., 2013; Li et al., 2019). SRH was assessed through the question “How would you perceive your health status?” using a 5-point Likert-type scale in this study, where “very good” and “good” indicated good health, while “fair”, “poor”, and “very poor” represented suboptimal SRH, as previously suggested (Ding et al., 2022; Stenholm et al., 2016). Through a repeat survey of 163 medical students, we observed a consistent response rate of 70.4%, and the test–retest reliability of SRH was 0.50, with a Cohen’s kappa coefficient of 0.41 (95% CI [0.27–0.55]). To evaluate the validity of SRH, the Self-Rated Health Measurement Scale (SRHMS) (Xu et al., 2010) was utilized among 104 medical students, and the correlation coefficient between SRH and SRHMS was 0.74. These results suggested that the SRH assessment method in our study was valid and reliable.
Covariates
Demographic characteristics such as gender, grade, residence, parental education, being a single child, and lifestyle factors such as BMI (kg/m2), smoking, alcohol consumption, physical activity, sitting time, and midnight snack habits were gathered through a self-reported questionnaire. BMI was calculated as weight (kg) divided by height squared (m2), and according to Chinese standards (National Health and Family Planning Commission of the People’s Republic of China (NHFPC China), 2013), body type was categorized into underweight (BMI < 18.5 kg/m2), normal weight (18.5 ≤ BMI < 24.0 kg/m2), overweight (24.0 ≤ BMI < 28.0 kg/m2), and obese (BMI ≥ 28.0 kg/m2). Based on the association between body shape and suboptimal SRH in this study, we divided body shape into two groups: overweight (BMI ≥ 24.0 kg/m2) and non-overweight (BMI < 24.0 kg/m2). Current drinking was defined as consuming alcohol three or more times a week for at least six months, and smokers were classified as individuals who smoked at least one cigarette per day for six months or longer. Additionally, sleep behavior factors such as sleep duration, chronotype, and nap were collected. Sleep duration was assessed by the question “During the past month, how many hours of actual sleep do you usually get per night? (not equal to bedtime)”, and the options were categorized into seven groups: ≤5 h, 6 h, 7 h, 8 h, 9 h, 10 h, and ≥11 h (Ma et al., 2020; Shi et al., 2021). Following previous studies (Liu et al., 2016; Shi et al., 2021), sleep duration was categorized into three groups: ≤6 h, 7 h, and ≥8 h. It has been found that there is a good correlation between self-measured sleep duration and the evaluation results of objective methods such as polysomnography (Biddle et al., 2015). Chronotype, was assessed with the question “People can be categorized into morning-type and evening-type, which type do you think you belong to?” The response options included five categories: morning-type (early to bed, early to wake), morning-type more than evening-type, intermediate-type, evening-type more than morning-type, and evening-type (late to bed, late to wake). The Cronbach’s alpha coefficient for this evaluation method has been confirmed to be 0.71 (Zhou et al., 2021). Considering the comparability with other studies and the sample size of each group, chronotype was combined into three groups: intermediate-type, morning-type, evening-type (Zhai et al., 2021). We chose to assess chronotype using a single question, which is consistent with the method of evaluating chronotype in previous studies (e.g., Nurses’ Health Study II) (Kianersi et al., 2023). Afternoon nap is divided into two categories: yes or no. The reliability and validity of these variables have been reported in prior studies (Lauderdale et al., 2008; Selvi et al., 2018).
Statistical analysis
Quantitative variables were reported as mean (SD) or median (P 25, P 75), and qualitative variables as frequency (percentage). We conducted one-way ANOVA, Chi-square, and rank-sum tests to compare covariates among students with different sleep latencies. A RCS was used to explore the form of the relationship between sleep latency and suboptimal SRH. For node selection, we employed an automatic method based on the minimum Akaike Information Criterion (AIC) value to determine node locations (Huang et al., 2022; Paluch et al., 2022). This approach, a widely used criterion for node selection, reduces the potential bias of manual node selection and improves model fit and reliability. We used logistic regression to estimate OR and 95% confidence intervals (CI) to investigate the independent association between sleep latency and suboptimal SRH. The reference group was “sleep latency ≤10 min”. Model 1 was adjusted for gender, grade, residence, parental education, and single child, while Model 2 was further adjusted for BMI, afternoon nap, midnight snack habit, sitting time, physical activity, sleep duration, and chronotype. The P for trend was obtained by modeling the median within each sleep latency group as a continuous variable. Additionally, considering that medical students may have the habit of eating late night snacks due to studying too late and that late night snacks can affect the quality of sleep (Faris et al., 2022), we examined the combined effect of sleep latency and midnight snack habit on suboptimal SRH. In this multivariable-adjusted logistic model, we combined four groups of sleep latency and two groups of midnight snack habits into eight subgroups, taking participants with sleep latency <10 min and no midnight snack habits as a reference.
Stratified analysis was conducted to test the consistency of the relationship between sleep latency and suboptimal SRH across different subgroups of medical students, including afternoon nap (yes, no), midnight snack habit (yes, no), BMI (<24 kg/m2, ≥24 kg/m2), sleep duration (≤6 h, 7 h, ≥8 h), and chronotype (intermediate-type, morning-type, evening-type). The P-values for the interaction effects were calculated using the likelihood ratio test.
Sensitivity analysis was conducted to test the robustness of the results by excluding individuals who smoked or consumed alcohol, as these factors are significant confounding factors potentially associated with both sleep latency and suboptimal SRH. Additionally, sleep latency was further included as a continuous variable in the logistic regression model. To assess the robustness of the results to the choice of classification criteria, we reanalyzed the data by categorizing sleep latency into three groups (≤15 min, 15–30 min, and >30 min), in line with previous studies (Siddiquee et al., 2023).
All statistical analyses were conducted using SPSS 23.0 and Empower® (http://www.empowerstats.com; X & Y solutions, Inc. Boston MA), with a significance level of 0.05 (two-sided).
Results
Basic characteristics of participants
The study included 1,396 participants, with a mean age of 19.6 ±1.2 years, and 58.6% female, of whom 599 (42.9%) reported suboptimal SRH and 390 (27.9%) reported prolonged sleep latency (≥30 min). Table 1 presents the basic characteristics of the participants. Participants with longer sleep latency had a higher percentage of suboptimal SRH, evening-type chronotype, and slept less than 6 h per night compared to those with sleep latency of less than 10 min (P < 0.05). However, there were no significant differences in gender, residence, single child, parental education, BMI, afternoon nap, sitting time, and physical activity among these groups.
| Variables | Sleep latency (min) | ||||
|---|---|---|---|---|---|
| <10 (n = 339) | 10–19 (n = 437) | 20–29 (n = 230) | ≥30 (n = 390) | P value | |
| Suboptimal SRH, n (%) | 106 (31.3) | 176 (40.3) | 109 (47.4) | 208 (53.3) | <0.001 |
| Gender (female), n (%) | 186 (54.9) | 247 (56.5) | 141 (61.3) | 244 (62.6) | 0.114 |
| Grade, n (%) | |||||
| Freshman | 41 (12.1) | 60 (13.7) | 22 (9.6) | 26 (6.7) | 0.044 |
| Sophomore | 152 (44.8) | 192 (43.9) | 116 (50.4) | 173 (44.4) | |
| Junior | 93 (27.4) | 129 (29.5) | 60 (26.1) | 123 (31.5) | |
| Senior and above | 53 (15.6) | 56 (12.8) | 32 (13.9) | 68 (17.4) | |
| Residence, n (%) | 0.518 | ||||
| City | 125 (37.1) | 169 (38.8) | 93 (40.4) | 143 (36.7) | |
| Town | 73 (21.7) | 101 (23.2) | 49 (21.3) | 73 (18.7) | |
| Countryside | 139 (41.2) | 166 (38.1) | 88 (38.3) | 174 (44.6) | |
| Single child (yes), n (%) | 167 (49.3) | 200 (45.8) | 106 (46.1) | 181 (46.4) | 0.781 |
| Parental education, n (%) | 0.819 | ||||
| Primary school and below | 25 (7.4) | 38 (8.7) | 17 (7.4) | 34 (8.7) | |
| Junior high school | 126 (37.2) | 169 (38.7) | 82 (35.7) | 142 (36.4) | |
| High school or Technical School | 102 (30.1) | 128 (29.3) | 81 (35.2) | 124 (31.8) | |
| Bachelor and above | 86 (25.4) | 102 (23.3) | 50 (21.7) | 90 (23.1) | |
| Body mass index, kg/m2 | 20.9 (2.9) | 20.5 (2.8) | 21.0 (2.8) | 20.7 (2.8) | 0.208 |
| Afternoon nap(yes), n (%) | 259 (76.4) | 340 (77.8) | 182 (79.1) | 290 (74.4) | 0.518 |
| Midnight snack habit (yes), n (%) | 63 (18.0) | 84 (19.2) | 20 (8.7) | 62 (15.9) | 0.004 |
| Sleep duration, n (%) | <0.001 | ||||
| ≤6 h | 57 (16.8) | 68 (15.6) | 46 (20.0) | 98 (25.1) | |
| 7 h | 161 (47.5) | 230 (52.6) | 134 (58.3) | 202 (51.8) | |
| ≥8 h | 121 (35.7) | 139 (31.8) | 50 (21.7) | 90 (23.1) | |
| Chronotype, n (%) | 0.003 | ||||
| Morning-type | 105 (31.0) | 122 (27.9) | 63 (27.4) | 83 (21.3) | |
| Intermediate-type | 95 (28.0) | 142 (32.5) | 74 (32.2) | 103 (26.4) | |
| Evening-type | 139 (41.0) | 173 (39.6) | 93 (40.4) | 204 (52.3) | |
| Sitting time, h/d | 8.0 (6.0,10.0) | 8.0 (6.0,10.0) | 8.0 (6.0,10.0) | 8.0 (5.0,10.0) | 0.196 |
| Physical activity, h/d | 1.0 (0.5,2.0) | 1.0 (0.5,2.0) | 1.0 (0.5,2.0) | 1.0 (0.5,1.5) | 0.276 |
Notes:
Values are mean (SD) or median (P 25, P 75) for continuous variables and frequency (percentage) for categorical variables.
Association of sleep latency with suboptimal SRH
Table 2 presents the multivariable-adjusted ORs of suboptimal SRH associated with sleep latency. Compared to participants with sleep latency of less than 10 min, those with longer sleep latency demonstrated an increased risk of suboptimal SRH. After adjusting for gender, grade, residence, parental education, and single child, the ORs (95% CIs) for those with sleep latency of 10–19 min, 20–29 min, and ≥30 min were 1.50 (1.11, 2.04), 2.05 (1.44, 2.92), and 2.46 (1.80, 3.36), respectively. With further adjustment for BMI, afternoon nap, midnight snack habit, sitting time, physical activity, sleep duration, and chronotype, the adjusted ORs (95% CIs) were 1.48 (1.07, 2.05), 2.03 (1.39, 2.97), and 2.12 (1.52, 2.96) (P for trend<0.001).
| Sleep latency, min | Suboptimal SRH, n (%) | OR (95%CI)*P value | ||
|---|---|---|---|---|
| Unadjusted (n = 1,396) | MV1-Adjusted† (n = 1,393) | MV2-Adjusted‡ (n = 1,300) | ||
| <10 | 106 (31.3) | Ref | Ref | Ref |
| 10–19 | 176 (40.3) | 1.48 (1.10, 2.00) 0.010 | 1.50 (1.11, 2.04) 0.009 | 1.48 (1.07, 2.05) 0.019 |
| 20–29 | 109 (47.4) | 1.98 (1.40, 2.80) <0.001 | 2.05 (1.44, 2.92) <0.001 | 2.03 (1.39, 2.97) <0.001 |
| ≥30 | 208 (53.3) | 2.51 (1.85, 3.40) <0.001 | 2.46 (1.80, 3.36) <0.001 | 2.12 (1.52, 2.96) <0.001 |
| P for trend | <0.001 | <0.001 | <0.001 | |
| Sleep latency (per increase of one minute) | 1.03 (1.02,1.04) <0.001 | 1.03 (1.02,1.04) <0.001 | 1.03 (1.02, 1.04) <0.001 |
Notes:
We also investigated the combined effect of sleep latency and midnight snack habit on suboptimal SRH (Fig. 2). Sleep latency was categorized into four groups (≤10 min, 10–19 min, 20–29 min, and ≥30 min). We found that individuals with long-sleep latency and a midnight snack habit had higher odds of suboptimal SRH than those without the habit and with sleep latency less than 10 min (fully-adjusted OR: 4.50; 95% CI: [2.43–8.33]).
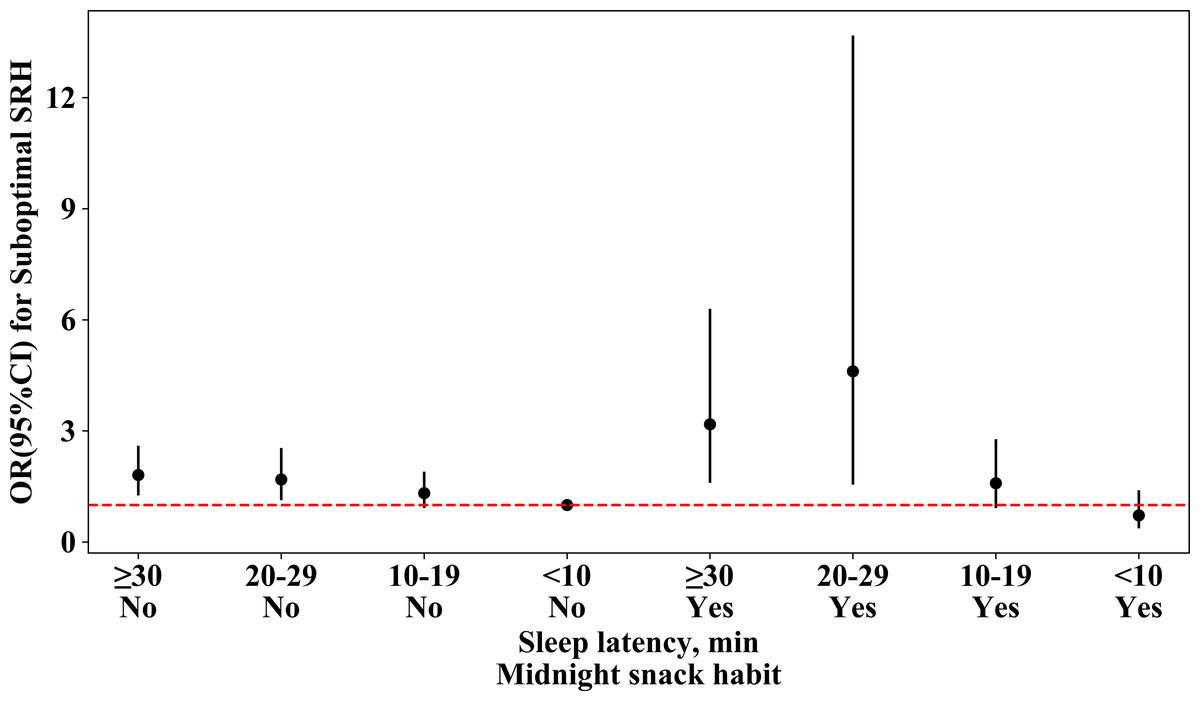
Figure 2: The joint effect of sleep latency and midnight snack habit on suboptimal self-rated health among medical students.
The model was adjusted for all the variables in MV2.
Stratified analysis by lifestyles
We conducted stratified analyses to investigate the association between sleep latency and suboptimal SRH among subgroups categorized by lifestyle factors, including afternoon nap, midnight snack habit, BMI, sleep duration, and chronotype (Table 3). Our findings indicated that longer sleep latency was consistently associated with higher odds of suboptimal SRH in most subgroups, although some associations did not achieve statistical significance (P for interaction > 0.05).
| Stratification factors | N | OR (95% CI)*P value | P for interaction | |||
|---|---|---|---|---|---|---|
| <10 min | 10–19 min | 20–29 min | ≥30 min | |||
| Afternoon nap | 0.331 | |||||
| No | 300 | Ref | 1.07 (0.52, 2.20) 0.857 | 2.28 (0.93, 5.57) 0.070 | 1.41 (0.68, 2.94) 0.355 | |
| Yes | 1,000 | Ref | 1.64 (1.13, 2.40) 0.010 | 2.13 (1.38, 3.29) 0.001 | 2.51 (1.70, 3.71) <0.001 | |
| Midnight snack habit | 0.076 | |||||
| No | 1,097 | Ref | 1.30 (0.90, 1.87) 0.156 | 1.66 (1.10, 2.50) 0.015 | 1.78 (1.24, 2.57) 0.002 | |
| Yes | 203 | Ref | 2.57(1.10, 5.96)0.028 | 9.33 (2.50, 34.84) 0.001 | 6.16(2.33,16.26)<0.001 | |
| BMI, kg/m2 | 0.297 | |||||
| <24 | 1,136 | Ref | 1.27 (0.89, 1.80) 0.183 | 1.93 (1.28, 2.91) 0.002 | 1.99 (1.39, 2.84) <0.001 | |
| ≥24 | 164 | Ref | 5.43 (1.84, 15.98) 0.002 | 3.21 (0.97, 10.65) 0.057 | 3.34 (1.13, 9.87) 0.029 | |
| Sleep duration, h | 0.357 | |||||
| ≤6 | 252 | Ref | 1.02 (0.45, 2.31) 0.958 | 1.11 (0.45, 2.73) 0.813 | 1.81 (0.81, 4.04) 0.148 | |
| 7 | 672 | Ref | 1.42 (0.89, 2.27) 0.144 | 1.95 (1.15, 3.31) 0.013 | 2.45 (1.52, 3.96) <0.001 | |
| ≥8 | 376 | Ref | 1.92 (1.04, 3.56) 0.038 | 2.96 (1.33, 6.58) 0.008 | 1.46 (0.74, 2.89) 0.274 | |
| Chronotype | 0.681 | |||||
| Intermediate-type | 390 | Ref | 1.17 (0.64, 2.16) 0.606 | 1.91 (0.93, 3.91) 0.078 | 1.54 (0.80, 2.93) 0.194 | |
| Morning-type | 342 | Ref | 3.37 (1.59, 7.10) 0.001 | 2.94 (1.27, 6.80) 0.012 | 4.53 (2.04, 10.04) <0.001 | |
| Evening-type | 568 | Ref | 1.32 (0.80, 2.18) 0.280 | 2.08 (1.15, 3.77) 0.016 | 2.00 (1.22, 3.29) 0.006 | |
Notes:
Sensitivity analysis
We conducted sensitivity analyses to assess the robustness of the relationship between sleep latency and suboptimal SRH. We included only non-smokers (n = 1,289) and found no changes in our results (Table 4). We also analyzed only non-drinkers and the results were largely unchanged. After including sleep latency as a continuous variable in the logistic regression model, the results were found to be consistent with our initial findings (Table 2). Furthermore, when sleep latency was reclassified into three groups for analysis, the findings aligned generally agreement with the main results (Table 4).
| Restrict participants | OR (95%CI)*P value | |||||
|---|---|---|---|---|---|---|
| <10 min | 10–19 min | 20–29 min | ≥30 min | |||
| Non-smokers (n = 1,284) | Ref | 1.46 (1.05, 2.03) 0.023 | 2.03 (1.38, 2.98) <0.001 | 2.12 (1.51, 2.97) <0.001 | ||
| Non-drinkers (n = 1,265) | Ref | 1.41 (1.01, 1.96) 0.042 | 1.96 (1.33, 2.87) 0.001 | 2.11 (1.50, 2.97) <0.001 | ||
| Using different cutoffs for sleep latency | ||||||
| ≤15 min | 15–30 min | >30 min | ||||
| All (n = 1, 396) | Ref | 1.46 (1.14, 1.87) 0.003 | 4.50 (2.43, 8.33) <0.001 | |||
Notes:
Discussion
Main findings
This cross-sectional study found that after adjusting for potential covariates, prolonged sleep latency was associated with higher odds of suboptimal SRH compared to sleep latency less than 10 min. These associations were consistently observed in stratified analyses by lifestyle factors and in the sensitivity analyses. To the best of our knowledge, this is the first study to demonstrate an association between sleep latency and suboptimal SRH among medical students.
Comparison with other studies
Our study found a high prevalence of prolonged sleep latency among medical students (27.9%). This is similar to the results of a meta-analysis that included 57 studies involving 82,055 Chinese university students, which found a 25.5% prevalence of prolonged sleep latency (Li et al., 2017). The incidence of prolonged sleep latency in other countries/regions is also roughly in the range of 20%–35% (Albqoor & Shaheen, 2021; Lohsoonthorn et al., 2013; Sweileh et al., 2011). However, Lemma et al. (2012) found a 48.5% prevalence of prolonged sleep latency among 2,230 college students in Ethiopia. This result is significantly higher than studies in other countries and regions and may be closely related to the prevalent caffeine intake habits of college students in the region and its relationship with sleep latency. Additionally, the differences in the detection rate of longer sleep latency across countries may be attributed to variations in education systems, academic disciplines, and sleep latency measurement methods, all of which can influence students’ sleep habits (Albqoor & Shaheen, 2021). In the context of China’s “involution” culture, it is well established that college students, particularly medical students, tend to study for extended hours, experience higher academic pressure, often engage in studying before bedtime, and report poorer sleep quality (Preisegolaviciute, Leskauskas & Adomaitiene, 2010). Furthermore, discrepancies may exist between objective sleep latency, as measured by actigraphy, and self-reported sleep latency.
In addition, we observed variation in the prevalence of suboptimal SRH among university students from different countries and regions. For instance, a study of 2,312 Chinese university students showed a suboptimal SRH rate of 71% (Li et al., 2019), while a longitudinal study of 568 Italian university students found a prevalence of 20.5% (Porru et al., 2022). A cross-sectional study of 326 Hungarian international medical students showed a prevalence rate of 32.5% (Umami, Paulik & Molnar, 2022); and a study of 27.3% in a cross-sectional study of 689 young Chicagoans (Stefan et al., 2017); and a study encompassing 24 countries, 27 universities, and 17,465 undergraduates showed a prevalence of 12% (Steptoe, Peacey & Wardle, 2006). These discrepancies may stem from differing definitions of suboptimal SRH, with some studies categorizing SRH as “average”, “poor”, or “very poor” as suboptimal, while others include only “poor” or “very poor”. Furthermore, although the Steptoe study reported a suboptimal SRH rate of 12% among college students (Steptoe, Peacey & Wardle, 2006), the study population consisted of students in non-medical or health-related majors. We also note that university students (especially medical students) may face unique challenges, such as intense academic pressure and high social expectations (Bayram & Bilgel, 2008; Mao et al., 2019).
Our study found that prolonged sleep latency was associated with a higher likelihood of experiencing suboptimal SRH, supporting previous research. For instance, Kim et al. (2021) reported that in a Korean adult population, individuals with prolonged sleep latency had a higher risk of subjective cognitive decline. Additionally, a cohort study highlighted the relationship between prolonged sleep latency and depression (Williams et al., 2020). Studies have also linked sleep latency to hypertension, with a Swedish study and a Chinese study both finding longer sleep latency in individuals with hypertension (Sahlin et al., 2009). Our study confirmed the association between prolonged sleep latency and poorer health, even after accounting for confounding factors like chronotype and sleep duration. While further research is necessary to fully validate these findings, our study underscores the importance of addressing sleep latency as a means of promoting health.
Potential mechanisms
There are some potential mechanisms for the association between prolonged sleep latency and suboptimal SRH. Firstly, habitual prolongation of sleep latency may lead to accumulation of sleep debt. For example, if a person needs 8 h of sleep per night, but only actually sleeps 7 h, a sleep debt of 1 h is accumulated. Sleep debt can accumulate over multiple nights and negatively impact a person’s health (Spiegel, Leproult & Van Cauter, 1999). Secondly, prolonged sleep latency is positively associated with anxiety (Narisawa, 2013), which may activate the sympathetic nervous system and elevate cortisol levels (Vgontzas & Chrousos, 2002), contributing to adverse health outcomes such as hypertension, depression, and metabolic syndrome (Duman, Malberg & Nakagawa, 2001; Lappin & Whaley, 1985; Miskiewicz et al., 2018). Thirdly, sleep efficiency is calculated as total sleep time divided by time in bed, multiplied by 100%. Time in bed is defined as sleep onset latency, total sleep time, time awake after initial sleep onset but before final awakening, and time spent attempting to sleep after final awakening (Reed & Sacco, 2016). When time in bed is constant, prolonged sleep latency directly reduces total sleep time, thereby decreasing sleep efficiency. Furthermore, prolonged sleep latency may indirectly impair sleep efficiency through the following mechanisms: (a) increased sleep fragmentation (Hermans et al., 2021), characterized by more frequent nighttime awakenings, which further reduces total sleep time; and (b) the induction of sleep-related anxiety (De Almondes, Castro & Paiva, 2022), leading to sympathetic nervous system overactivation, suppression of melatonin secretion (Li et al., 2023), and increased wakefulness time (Huang, Li & Leng, 2020). These factors collectively contribute to extended wakefulness during time in bed, ultimately diminishing sleep efficiency. Poor sleep efficiency has been shown to be associated with adverse health outcomes such as cardiovascular metabolic disease, cognitive impairment, psychological distress, and inflammatory response (Meerlo, Sgoifo & Suchecki, 2008; Irwin, 2019; Moon et al., 2022; Yiallourou & Carrington, 2021). Fourthly, excessive sleep latency may also be a manifestation of difficulty falling asleep (insomnia), and systematic reviews have consistently shown that insomnia is associated with multiple adverse health outcomes (Bos & Ferreira, 2019; Perlis et al., 2022). Finally, medical students with a prolonged sleep latency are more likely to be evening-type students, a group associated with higher anxiety levels and poorer sleep quality compared to morning-type students (Silva, Magalhaes & Duarte, 2020), which may negatively affect SRH.
Our study revealed that participants with both prolonged sleep latency and midnight snack habits had an increased risk of suboptimal SRH. Midnight snacks, as an unhealthy lifestyle, may disrupt biological circadian rhythms and increase metabolic imbalance (Gladka, Le Couteur & Simpson, 2023), thereby adversely affecting nighttime sleep, increasing the risk of overweight/obesity (Hess, Jonnalagadda & Slavin, 2016), and ultimately affecting one’s overall health evaluation.
Strengths and limitations
One of our key strengths is conducting groundbreaking research examining the relationship between sleep and suboptimal SRH in the context of Chinese medical students. However, this study has several limitations. As a cross-sectional study, we cannot determine the temporal sequence between prolonged sleep latency and suboptimal SRH, therefore it is difficult to discern whether prolonged sleep latency is a coping mechanism for poor SRH. Future studies should consider longitudinal study designs to explore the association between sleep latency and suboptimal SRH. Additionally, the self-reporting of sleep latency and suboptimal SRH may have introduced measurement bias. Nonetheless, our measurements showed high test-retest reliability and strong associations with objective measures (Biddle et al., 2015; Tamura et al., 2018). Moreover, it is important to note that self-reported sleep latency data summarize an individual’s sleep patterns over the past month, in contrast to polysomnography or actigraphy data, which are typically collected over a single night (Siddiquee et al., 2023). This distinction means that self-reported data are more revealing of a person’s long-term difficulty falling asleep. Finally, this research was carried out at a medical university located in Zhejiang Province, which might restrict the generalizability of our findings to other geographical areas. Nonetheless, it’s worth noting that the university’s students come from all over the country, which partially compensates for potential limitations in sample representativeness.
Conclusions
Our study demonstrated that poor SRH is common among university students in China and revealed a significant association between sleep latency and suboptimal SRH in medical students. Compared to sleep latency of less than 10 min, longer sleep latency (≥30 min) increased the odds of suboptimal SRH. Our findings underscore the importance of addressing sleep latency to enhance the health of medical students. The health of medical students with prolonged sleep latency and midnight snack habit warrants particular attention. Future research is needed to elucidate the mechanisms linking sleep latency and health.