
Stock assessment and management implications of sailfin sandfish (Arctoscopus japonicus) caught by multiple fishing gears with different selectivity in Korean waters
- Published
- Accepted
- Received
- Academic Editor
- Sercan Yapıcı
- Subject Areas
- Aquaculture, Fisheries and Fish Science, Marine Biology
- Keywords
- Selectivity, Multi-gear, Yield-per-recruit, Spawning biomass-per-recruit, Sailfin sandfish
- Copyright
- © 2025 Lee et al.
- Licence
- This is an open access article distributed under the terms of the Creative Commons Attribution License, which permits using, remixing, and building upon the work non-commercially, as long as it is properly attributed. For attribution, the original author(s), title, publication source (PeerJ) and either DOI or URL of the article must be cited.
- Cite this article
- 2025. Stock assessment and management implications of sailfin sandfish (Arctoscopus japonicus) caught by multiple fishing gears with different selectivity in Korean waters. PeerJ 13:e19602 https://doi.org/10.7717/peerj.19602
Abstract
The yield per recruit (YPR) model developed by Berverton & Holt in 1957 is widely used to determine the optimal age at first capture (tc) and optimal fishing intensity (F0.1) for the sustainable use of fish stocks. The YPR model is mainly applied to fishing gears, including trawlers and Danish seines, as individual gear types. In practice, fishery resources are predominantly harvested using multiple fishing gears rather than using a single fishing gear, with selectivity differing among the various gears employed. Therefore, management reference points, such as F0.1 or F40%, should be derived from stock assessments that account for multiple fishing gears and their respective selectivity. In this study, the traditional (single-gear) YPR and spawning biomass per recruit (SBPR) models were modified into multi-gear YPR and SBPR models to assess the stock status of fish species caught using multiple fishing gears with different selectivities. The modified models were applied to sailfin sandfish (Arctoscopus japonicus) stocks, primarily caught by the East Sea mid-sized Danish seine and coastal gillnet fisheries in Korean waters. The results showed that the optimal fishing intensities (F0.1, F40%) were higher for the multi-gear model than those for the single-gear model. The optimal fishing intensities of the multi-gear model considered the different selectivities and fishing intensities of multiple fishing gears; therefore, the estimation results of this model provided a more accurate assessment of the stock status of the sandfish. The optimal fishing intensity derived from the traditional (single-gear) model was underestimated because it considered only one fishing gear. Consequently, employing this fishing intensity for resource management poses a risk of overfishing. In the sensitivity analysis of the main parameters used in the multi-gear models, the natural mortality (M) and growth (K) coefficients resulted in YPR exhibiting greater sensitivity than SBPR in response to variations in M and K. Furthermore, YPR demonstrated a greater sensitivity to variations in K than those in M.
Introduction
The Korean government has been promoting a resource recovery project since the mid-2000s to restore declining sailfin sandfish resources. In 2009, a total allowable catch (TAC) system was implemented for two fisheries, namely the East Sea mid-sized Danish seine (DS) and East Sea mid-sized trawl fisheries, to manage the sandfish population. Nonetheless, sandfish resources have experienced a decline in recent years (Fig. 1A), necessitating integrated management at the macro level (Lee et al., 2024).
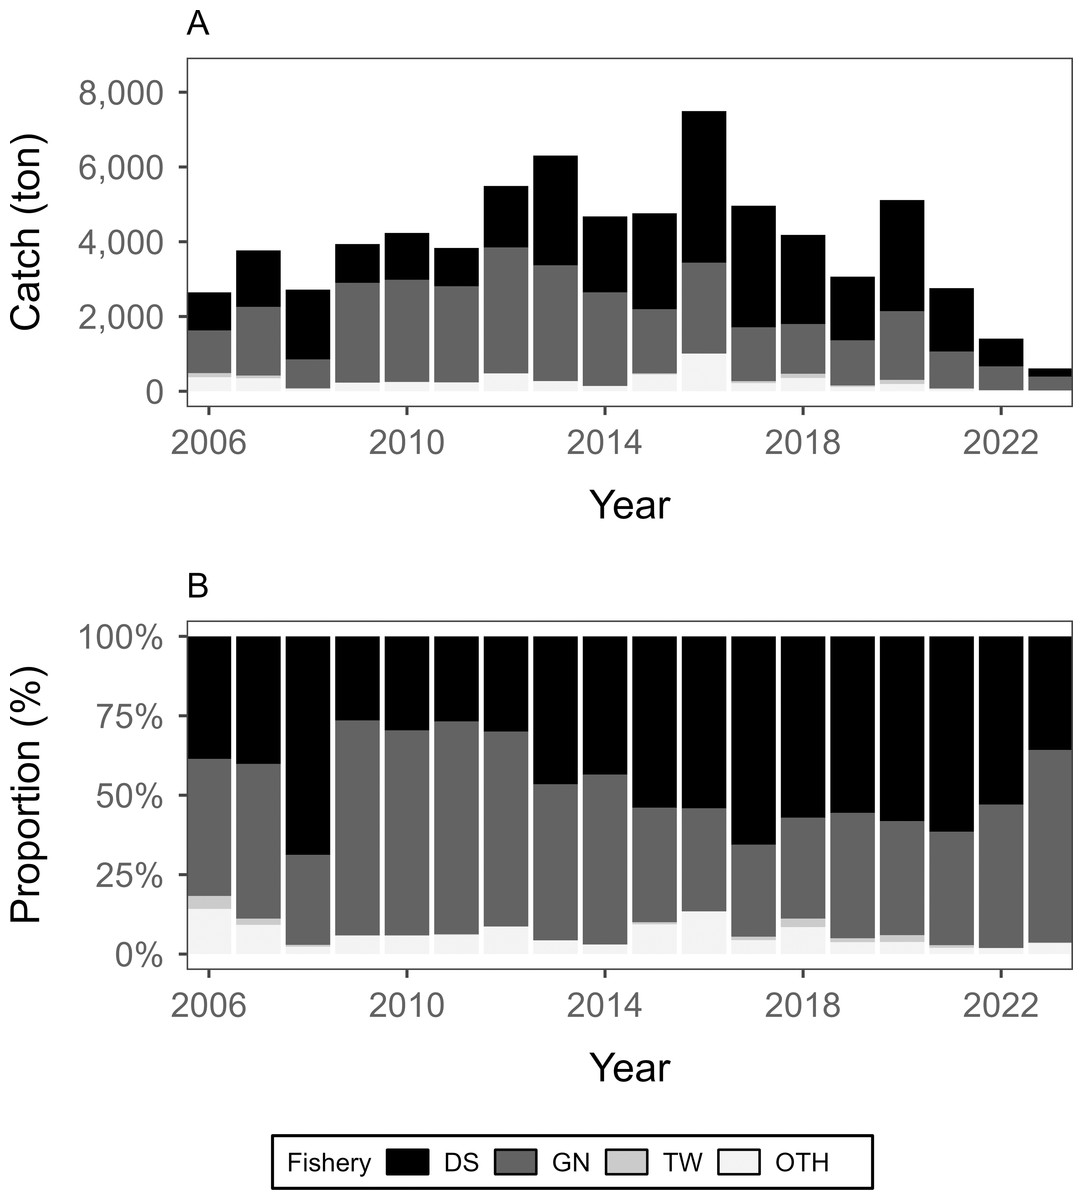
Figure 1: Annual catch variations and fishery proportions of sailfin sandfish in Korean waters (2006–2023).
(A) Annual catch. (B) Proportion of the annual catch by fisheries. DS, GN, TW, and OTH indicate the East Sea mid-sized Danish seine fishery, coastal gillnet fishery, East Sea mid-sized trawl fishery, and other fisheries, respectively. The catch has been declining since 2016. It is mainly caught by the DS and GN fisheries, accounting for more than 90% of the annual catch.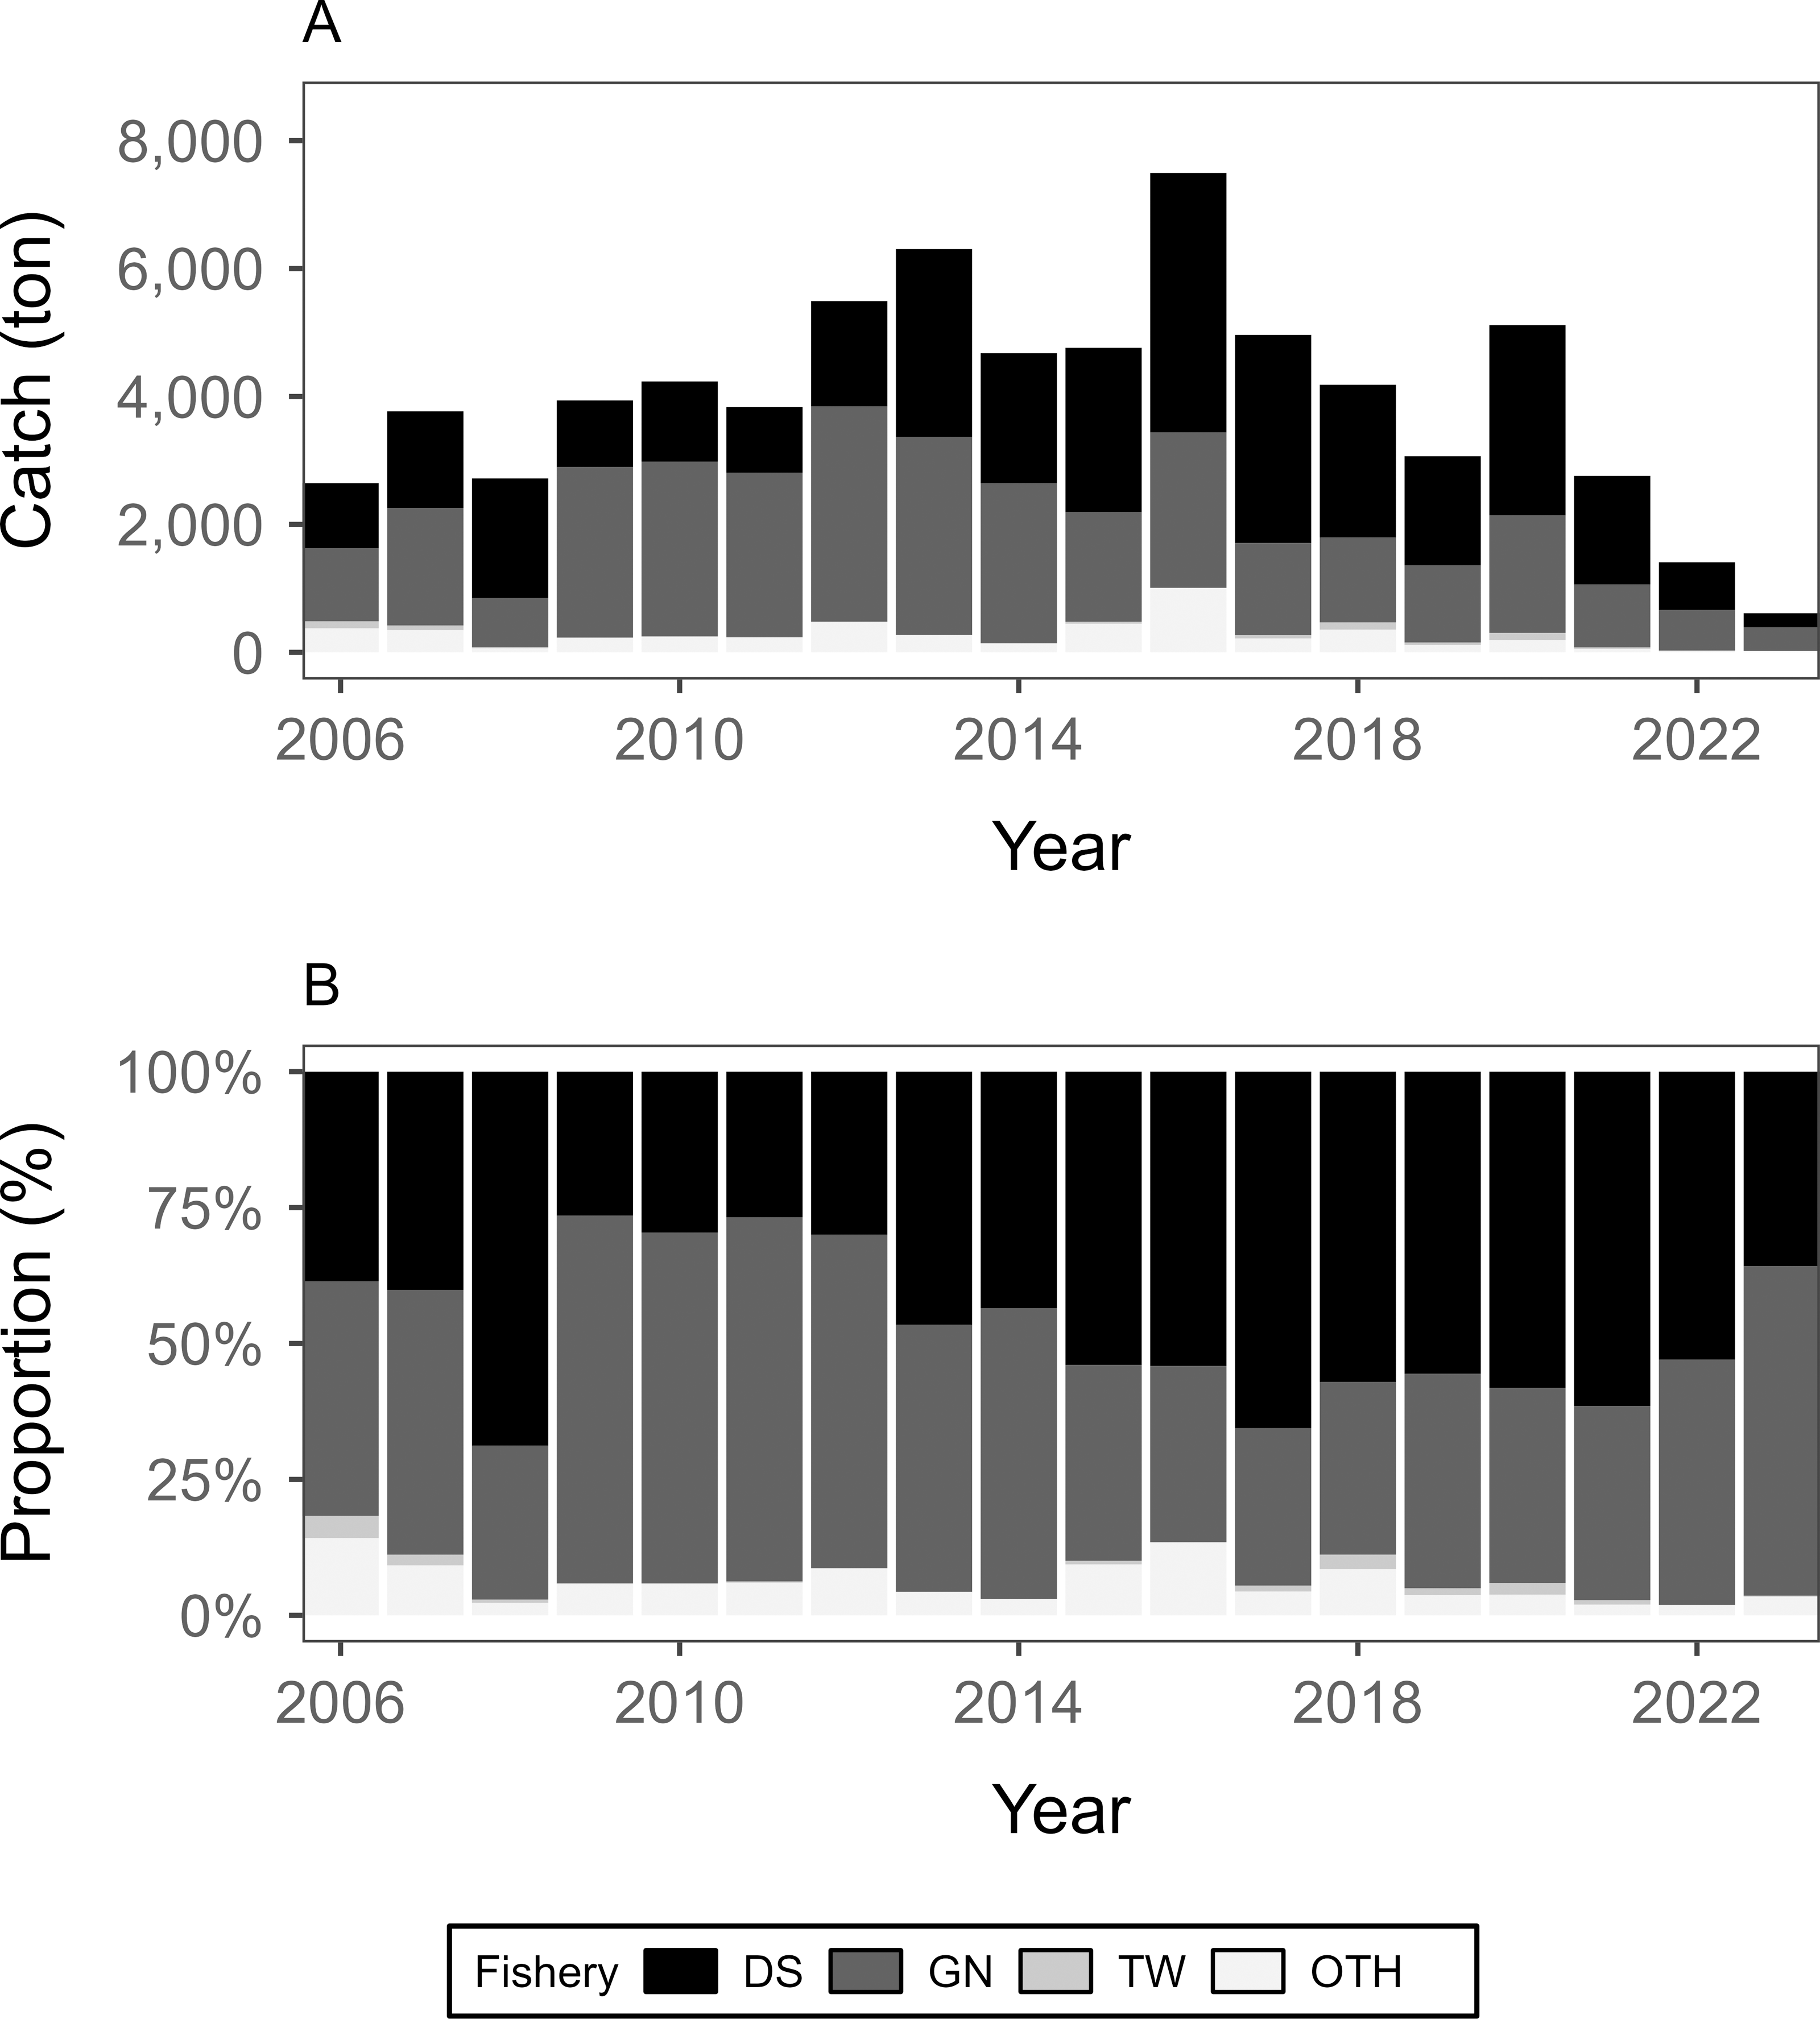
Sailfin sandfish are demersal, cold-water species inhabiting sandy or muddy bottoms at depths of up to 550 m in the coastal areas of the North Pacific and surrounding waters. They migrate seasonally by moving to the inshore waters in winter and subsequently moving to offshore waters. Larvae and juveniles (less than six cm in total length) spawned in winter inhabit inshore waters at depths of up to 50 m until June. Subsequently, they migrate to deeper waters, where adults reside during the summer months as sea temperatures rise (Yang et al., 2013). Sailfin sandfish are mainly caught by the DS and coastal gillnet (GN) fisheries in coastal and shallower waters, respectively.
Stock assessments for establishing resource management strategies for sailfin sandfish have been conducted solely using data from the DS fishery. In addition to the DS fishery, this species is caught using various fishing gears, including trawls, gillnets, and set nets. Among them, the catch by the GN fishery accounts for more than 40% of the annual catch. This has a major impact on fish stocks in Korean waters and is no less important than the DS fishery (approximately 55% of the annual catch rate) (Fig. 1) (KOSIS, 2024). Therefore, the impact of these two fisheries must be considered in stock assessments to determine the exact stock status of sandfish resources.
The yield per recruit (YPR) model developed by Beverton & Holt (1957) has been commonly used to determine the optimal age at first capture and optimal fishing intensity, among other management reference points for the sustainable use and conservation of fishery resources. This model can predict recruitment ages and catch rates that produce the maximum yield by reflecting the age structure of the target stock. This model is predicated on various assumptions: it is assumed that a steady-state condition exists where the age structure of the stock remains consistent from year to year, with natural and fishing mortalities being constant from the mean age at first capture. It is also assumed that after the age at first capture, all fish coming into contact with fishing gear have an equal probability of being captured (King, 2007).
However, this model is mainly applied to single fishing gear, such as trawls and Danish seines, based on the premise that all targeted individuals can be captured up to their maximum age (lifespan) and the probability of being captured in fishing gear remains constant regardless of age (Yamamoto & Katayama, 2022; Zhang & Lee, 2002).
In reality, some species are captured by multiple fishing gears rather than a single fishing gear (King, 2007), and small-scale multi-gear fisheries account for half of global fishery landings (Herron et al., 2018). Booth et al. (2000) stressed that traditional single-species-per-recruit models, which overlook important species and gear interactions, yielded only partial insights for fisheries; however, they employed a logistic selection curve for the gillnet fishery, despite the selection pattern in that fishery appearing to be normally distributed. Hilborn et al. (2020) stated that most unassessed fisheries, located in tropical and subtropical regions characterized by highly diverse mixed fisheries, render the single stock assessment and management practices used in these regions impractical. Because the age at first capture and fishing intensity varies among different fishing gears owing to their different selectivities, it is inappropriate to assess the status of fish stocks captured using multiple fishing gears and establish management goals based solely on parameters derived from a single fishing gear (Palmer et al., 2017; Hilborn et al., 2020). Consequently, for fish stocks caught using multiple fishing gears, a stock assessment should be made that considers all or at least the major fisheries that capture these fish stocks. Additionally, management criteria should be proposed based on this result.
Most studies employing the YPR model to assess fish stocks have been conducted using input parameters for singular fishing gear and considered only a single fishery in the assessment, although fish stocks are exploited by multiple fishing gears (e.g., Zhang, Baik & Lee, 1999; Kvamme & Bogstad, 2007; Baldé et al., 2018).
Few fish stock assessment studies address multi-gear fisheries, in contrast to the numerous studies on multi-species fisheries (Spencer, Wilderbuer & Zhang, 2002; Tirtadanu Suman et al., 2021). Shirakihara, Hidaka & Nagahama (1989) analyzed red snapper YPR for two fishing gears (i.e., the “one-boat gochi net” and “two-boat gochi net”) without accounting for the different selectivities of the two fishing gears. The study by Nedreaas, Soldal & Bjordal (1996) on the effects of fishing mortality of multiple fishing gears on bioeconomic parameters did not incorporate different selectivities for fishing gear. Seo & Zhang (2001) conducted a management criteria study using a surplus production model for multi-gear fisheries. They considered only the variation in fishing effort among fisheries and neglected the characteristics of fishing gear with different selectivities. Herron et al. (2018) evaluated the stock status of multi-gear fishery resources using the YPR model but did not consider the different selectivities of fishing gears. They suggested that fleet-specific selectivity be estimated for use in future analyses. Therefore, for a more accurate stock assessment, it is essential to consider different selectivities for each type of fishing gear.
In this study, the traditional YPR model developed by Beverton & Holt (1957); hereinafter referred to as single-gear YPR model) was modified into a multi-gear YPR model to assess the stock status of fish species captured by multiple fishing gears with different selectivity. Moreover, the existing spawning biomass per recruit (SBPR) model was also modified into a multi-gear SBPR model. In addition, we applied these multi-gear models to sailfin sandfish in Korean waters, conducted an analysis, and compared the results with those of the single-gear models to develop a management plan for the sustainable utilization of sandfish stock.
Materials & Methods
Selectivity and age at capture by fishing gears
The main sailfin sandfish fisheries analyzed in this study are the East Sea mid-sized Danish seine (DS) and coastal gillnet (GN) fisheries, which have different fishing selectivities owing to their different fishing gear and fishing methods. As illustrated in Fig. 2, the selectivity of the DS fishery follows the sigmoid curve of a cumulative normal distribution, whereas that of the GN fishery follows a bell-shaped normal distribution curve (Jones, 1963; Holt, 1963).
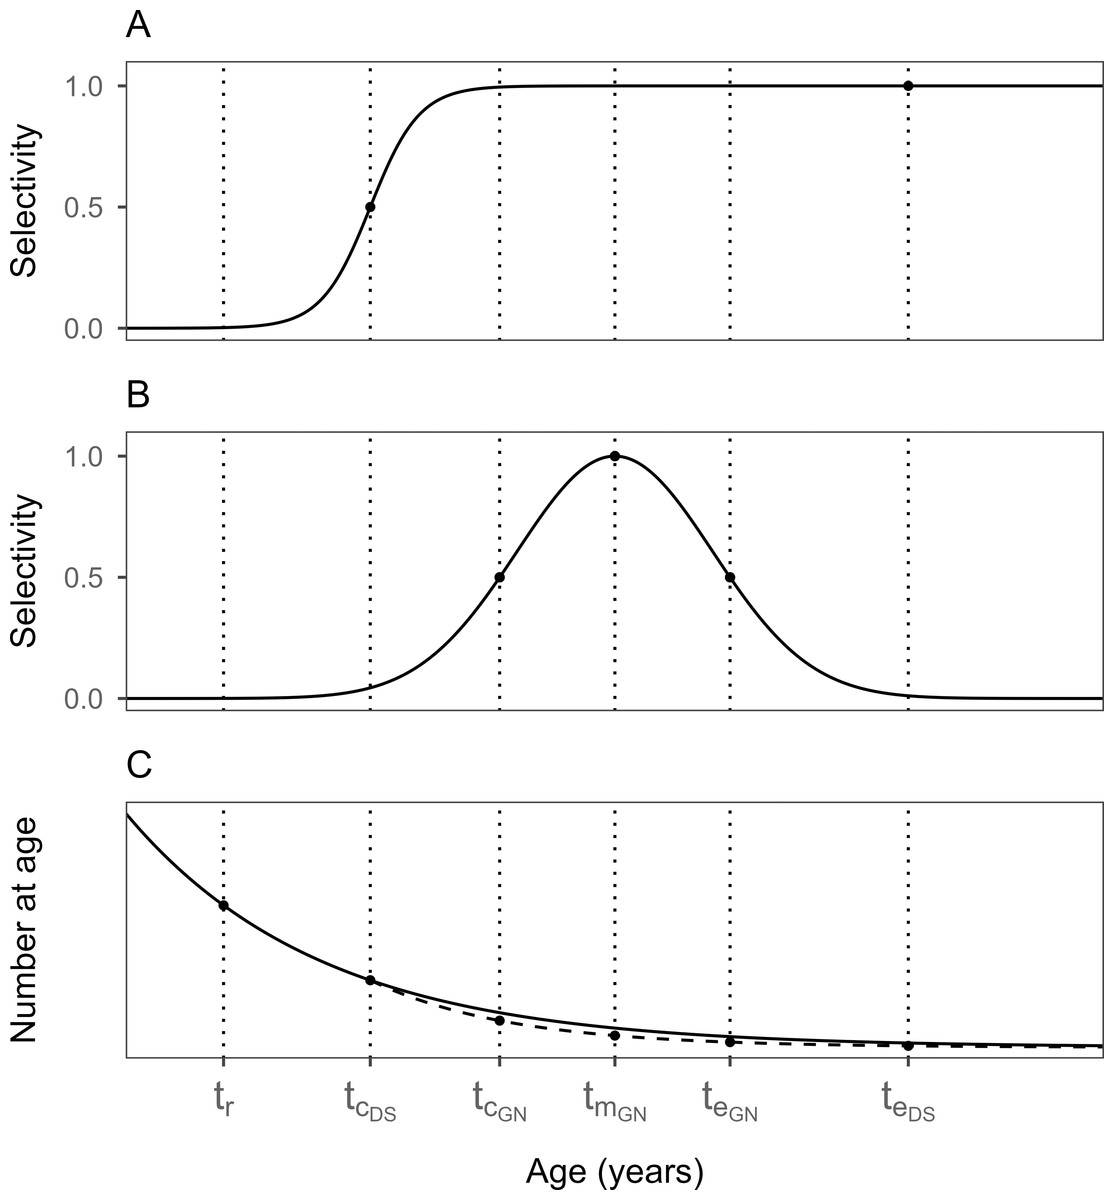
Figure 2: Curves showing the selectivity of different fishing gear types at different ages of fish.
(A) East Sea mid-sized Danish seine (DS) fishery. (B) Coastal gillnet (GN) fishery. (C) Population size over time (age). tr is the age at recruitment to the fishing ground, tc is the age at first capture, tm is the age at maximum (100%) capture, and te is the age at last capture. The selectivities of the DS and GN fisheries follow sigmoid and bell-shaped curves, respectively.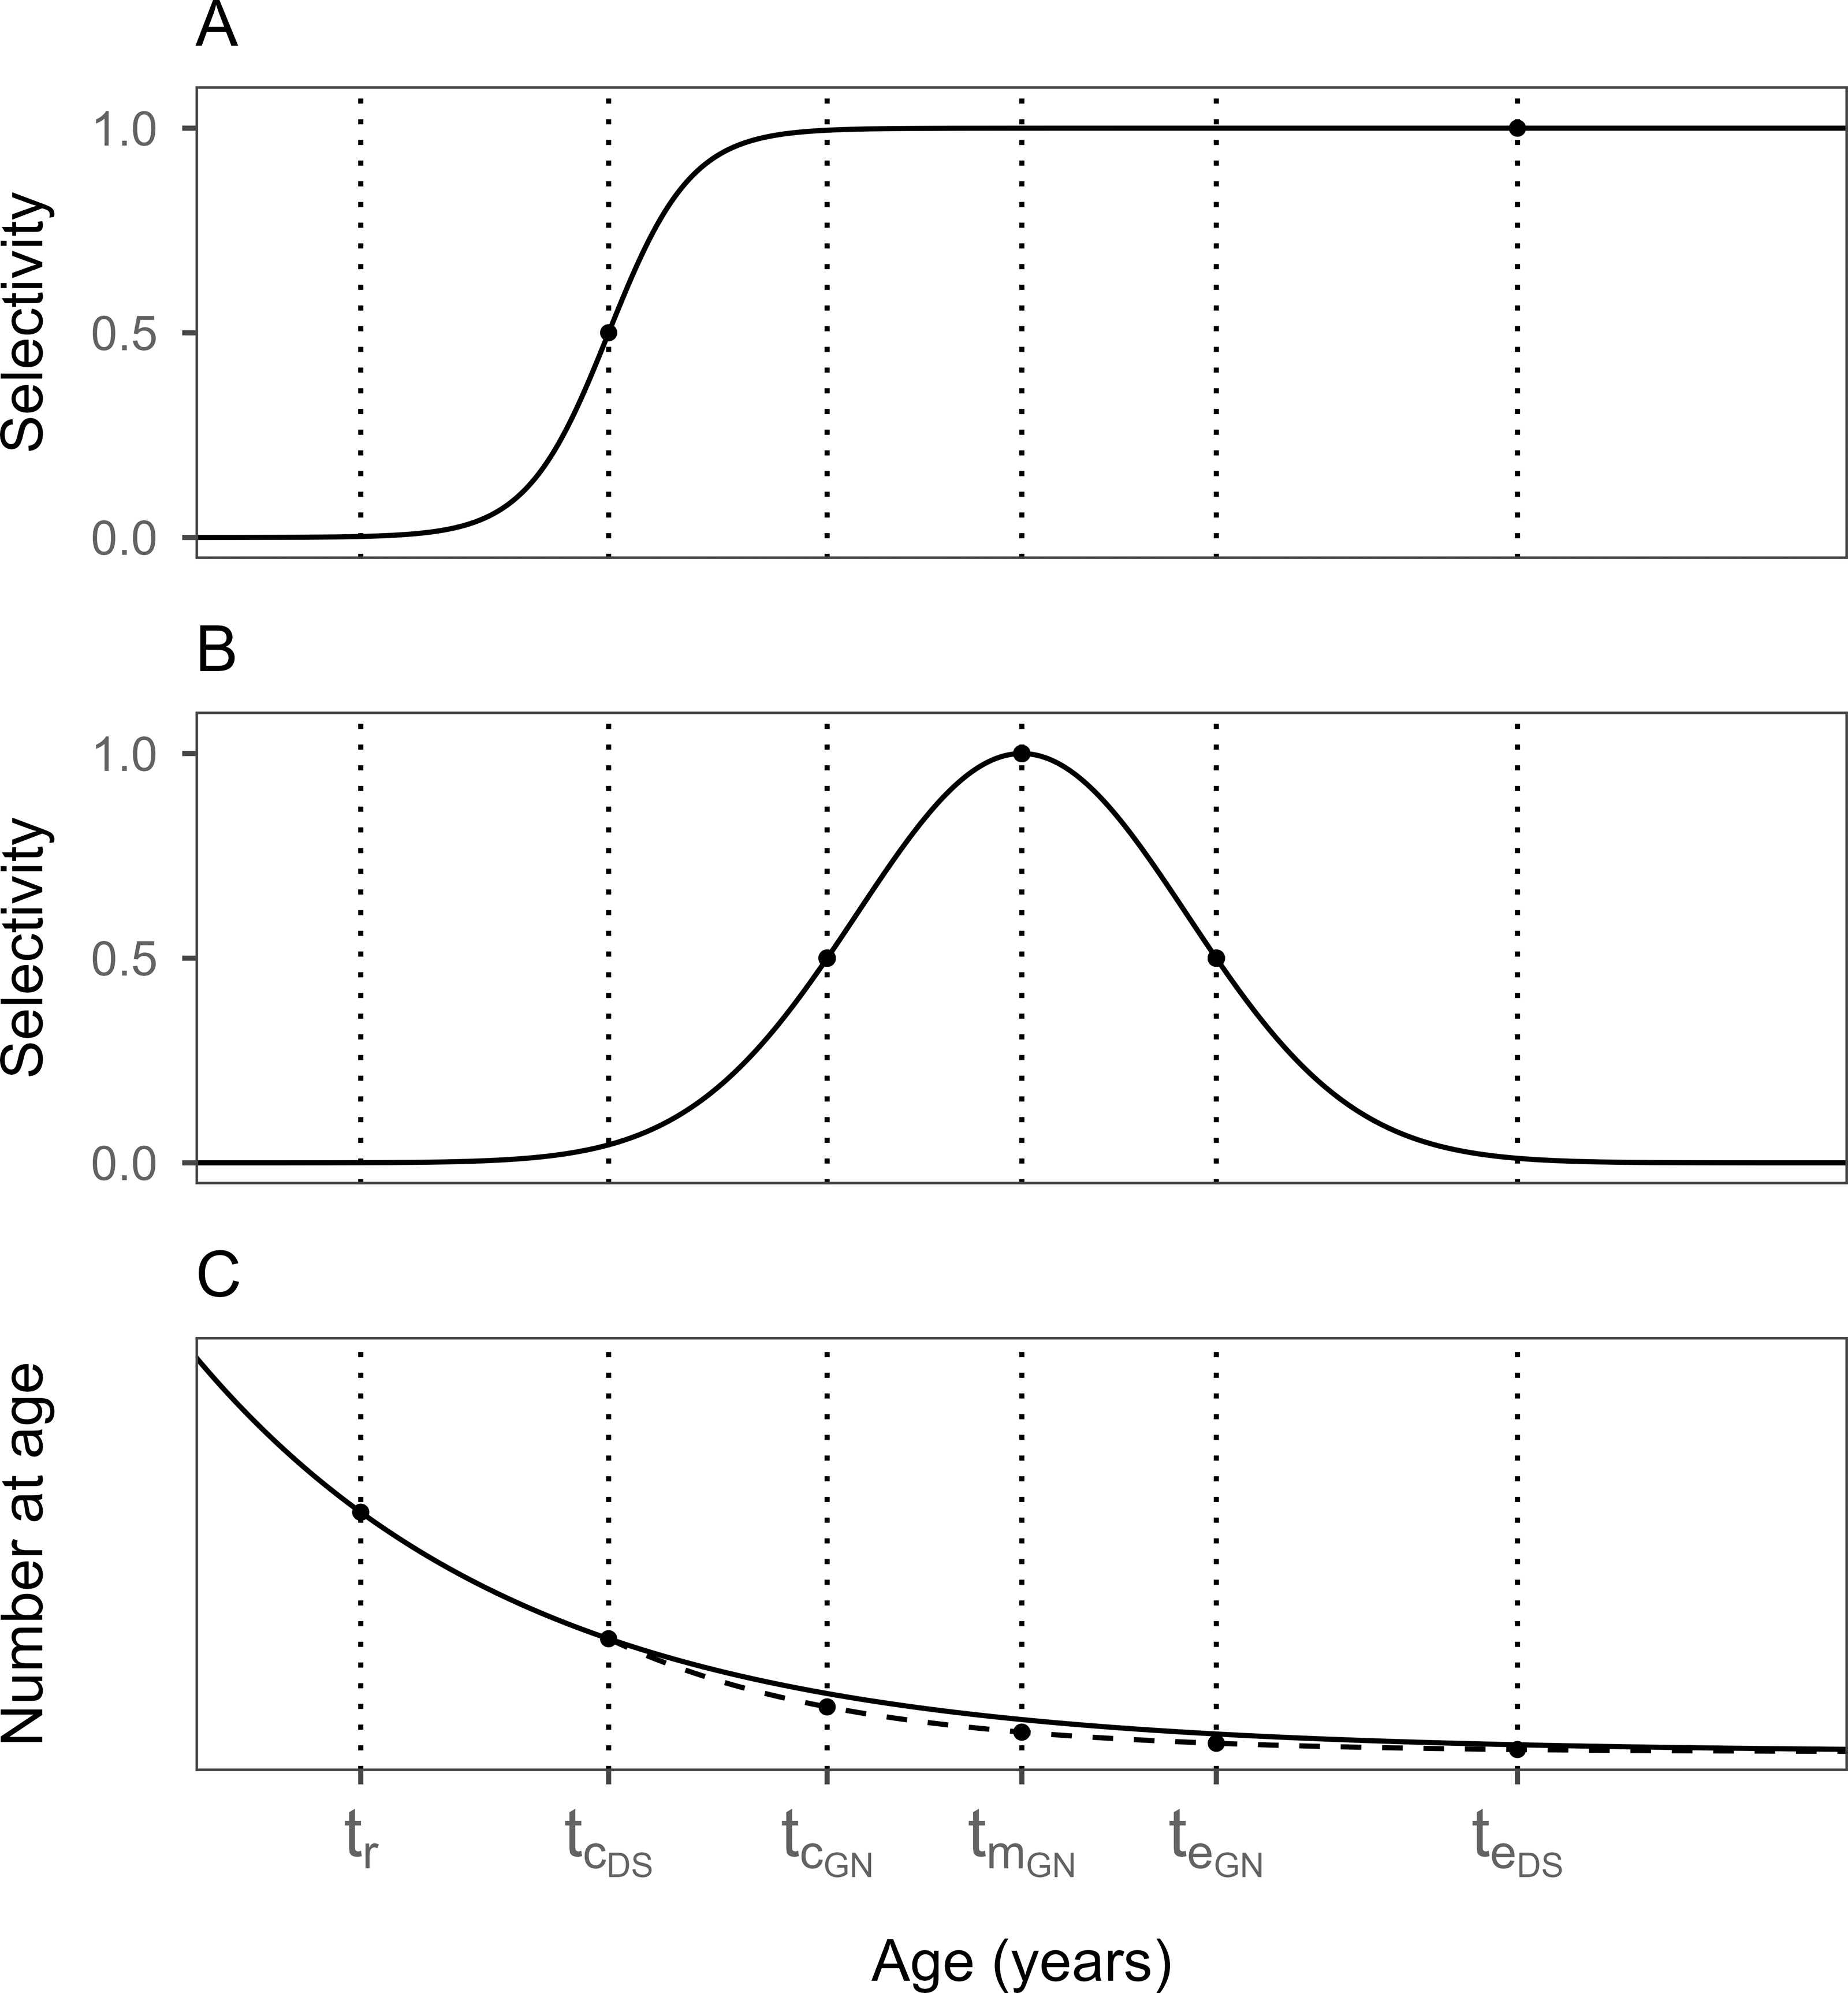
The age at which the fish enter the fishing ground (tr) is the same for both fishing gear types. The probability of a fish being caught in fishing gear after tr depends on the size (or age) of the fish. Even among fish of the same size, selectivity differs based on the specific characteristics of each gear (e.g., fishing method and mesh size).
In the case of sailfin sandfish (Fig. 2), the age at first capture (tc), which corresponds to 50% of the selection ratio, occurs in tcDS for the DS fishery and tcGN for the GN fishery. After tcDS, the rate of increase in the selection ratio with age gradually decreases in the DS fishery, as illustrated by the sigmoid curve in Fig. 2A. The selection ratio converges upon reaching a size corresponding to 100%, at which point all individuals exceeding this size are captured by the fishing gear. In other words, fish subject to fishing ranged from their age at first capture (tc) to their maximum age (tL).
Conversely, in the GN fishery, similar to the DS fishery, the rate of increase in the selection ratio after tcGN decreases until it reaches the age of 100% (tmGN), as illustrated by the bell-shaped curve in Fig. 2B. In contrast to the DS fishery, the selection ratio decreases to another 50% and continues to decrease thereafter. Two ages corresponded to a selection ratio of 50%: the age at which the catch starts (tcGN) on the left and the age at which the catch ends (teGN) on the right (Fig. 2B). Therefore, te in the GN fishery is the same concept as tL in the DS fishery, both representing the age at which fishing ends.
Models assessing yield per recruit and spawning biomass per recruit across multiple fishing gear
The single-gear YPR model developed by Beverton & Holt (1957) was modified into a multi-gear YPR model, as presented in Eq. (1). This multi-gear YPR model was applied to fish species captured using multiple fishing gears. To accurately reflect the characteristics of each fishing gear, as explained above, tL was substituted with the age at last capture tei for each fishery. Additionally, the instantaneous fishing mortality was weighted (wi) by the catch for each fishery to reflect the fishing mortality caused by each fishery. (1) where g is the number of fishing gear (fishery); tci is the age at the first capture of gear i; tei is the age at the last capture of gear i; and F is the instantaneous fishing mortality. Furthermore, wi is the weighting factor of the instantaneous fishing mortality for each gear (); and Ci is the catch of gear i (where the wi of DS and GN is w1 = 0.59 and w2 = 0.41, respectively), and the sum is 1. In addition, tr is the age at recruitment to the fishing ground; M is the instantaneous natural mortality; W∞ is the theoretical maximum weight; K is the growth coefficient; and t0 is the theoretical age when the length is zero. These parameters are the same as those of the traditional YPR model.
This multi-gear YPR model has the same assumptions as those of the traditional model (Beverton & Holt, 1957). However, the assumption that after the age at first capture all fish coming into contact with fishing gear have an equal probability of capture is invalid in the multi-gear model because the selectivity by the GN fishery has different capture probabilities by age.
The multi-gear SBPR model considered the selection ratio of each fishing gear within the age-specific selection ratio of the traditional SBPR model (Zhang, 2010), which did not account for the selection ratio for individual fishing gears. The instantaneous fishing mortality of each fishing gear was weighted, as shown in Eq. (1). The model is expressed in Eq. (2). (2) where Nt is the population size at age t (where, N0 = 1); mt is the maturity ratio at age t (m0 is the maturity ratio at age 0): Added m0 for clarity since m0 is in the formula; S(t)i is the selection ratio at age t for the fishing gear i; tλ is longevity; and the remaining parameters are consistent with those in Eq. (1).
Model parameters
The ecological characteristics of the sailfin sandfish used in the YPR and SBPR models were based on the results of previous studies. The parameters are listed in Table 1.
The analysis of the selectivity of the East Sea mid-sized Danish seine (DS) and coastal gillnet (GN) fisheries for sailfin sandfish involved determining the total length (TL) composition of the catch for each fishery. This was conducted using the latest 2019 data [modified from the (NIFS, 2022)], which provided a sufficient sample size and optimal representation of their characteristics (Fig. 3). The NIFS performed monthly port sampling to monitor the length composition of sailfin sandfish for catches from commercial fishing vessels. Samples acquired at landing ports were subsequently transported to the laboratory for length measurements. This study involved the random collection of more than 250 fish, which were measured monthly for each fishery whenever catches were available (all months except May for the DS fishery and November–December for the GN fishery). However, the sample sizes were small, comprising 57 fish in December for the DS fishery and 70 fish in November for the GN fishery, at periods of low catches. Moreover, given the samples were collected from commercial fishing vessels, there may have been sampling errors for extremely small and large individuals, especially for those within the DS fishery.
The main TL mode was 14 cm (range: 11–29 cm; 137,977 samples) for the DS fishery and 20 cm (range: 14–25 cm; 24,629 samples) for the GN fishery. This indicated that the fish caught by the GN fishery were larger than those caught by the DS fishery. The TL data from the DN and GN fisheries were combined as follows. First, the sample length data for each fishery were converted to body weight (W) using the relationship between TL and W (Table 1). Subsequently, the total weight of each sample was determined. The weighting factor for each fishery was calculated based on the respective catch amount and total sample weight corresponding to each fishery. Finally, the length composition representative of each fishery was generated by multiplying the sample length frequency by the weight factor, after which the results were combined.
The selectivity of the DS fishery was estimated using the logistic curve formula shown in Eq. (3), whereas that of the GN fishery was estimated using Eq. (4) as a third-order polynomial of Kitahara (1968) and Fujimori et al. (1996). (3) where t is the age, S(t) is the selection ratio for age t, and α and β are constants. (4) where R is the ratio (R = TL/m) of the total length (TL) to the mesh size (m = 51 mm); S(R) is the selection ratio to R; Smax is the maximum value of the approximated curve; and a3, a2, a1 and a0 are constants. Because S(R) represented the selection ratio for length, the von Bertalanffy growth formula (Bertalanffy, 1938) was used to convert it into the selection ratio for age.
| Parameters | Equations/values | Sources |
|---|---|---|
| von Bertalanffy growth | Yang et al. (2008) | |
| Relationship between length and weight | W = 0.0083FL3.01 | |
| Theoretical maximum weight (W∞) | 279.08 g | |
| Relationship between TL and FL | TL = 1.022 FL | NIFS (2022) |
| Maturity ogive | Lee, Kim & Kang (2006) | |
| Relationship between TL and BL | TL = 1.1455 BL+0.0069 | |
| Age at recruitment to the fishing ground (tr) | 0.68 years | Estimated from length-frequency data in this study |
Notes:
FL, BL, and TL denote the fork length, body length, and total length, respectively, in centimeters.
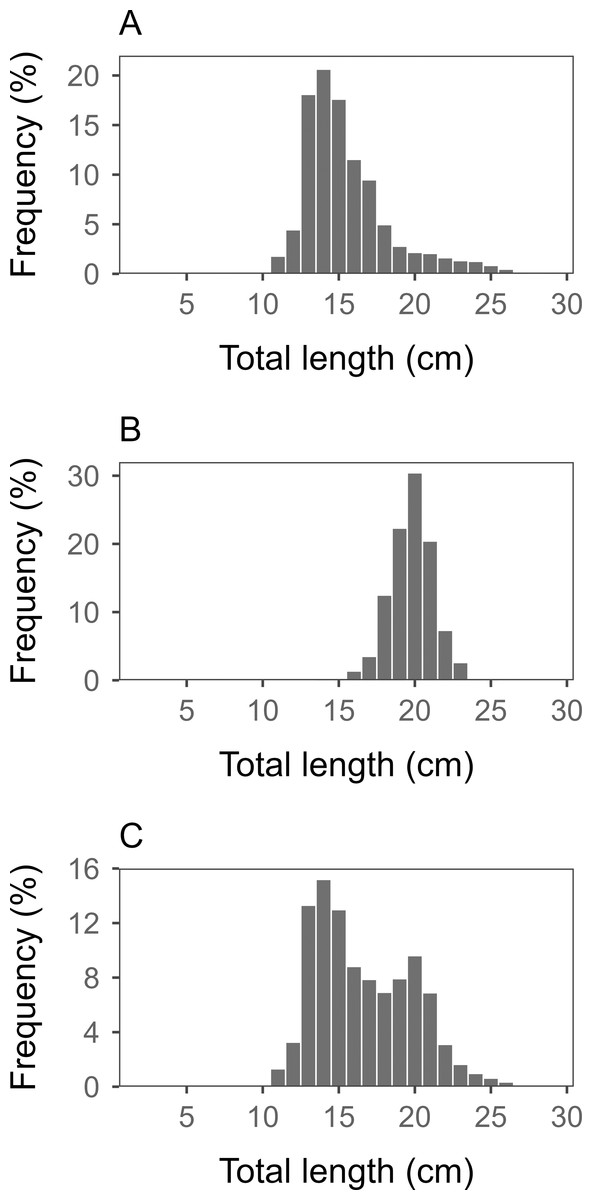
Figure 3: Length-frequency distributions of sailfin sandfish captured by fisheries in 2019.
(A) East Sea mid-sized Danish seine (DS) fishery. (B) Coastal gillnet (GN) fishery. (C) Combined data from the two fisheries. The main modes of total length (TL) were 14 cm for the DS fishery and 20 cm for the GN fishery, indicating that the catch size in the GN fishery was larger than that in the DS fishery.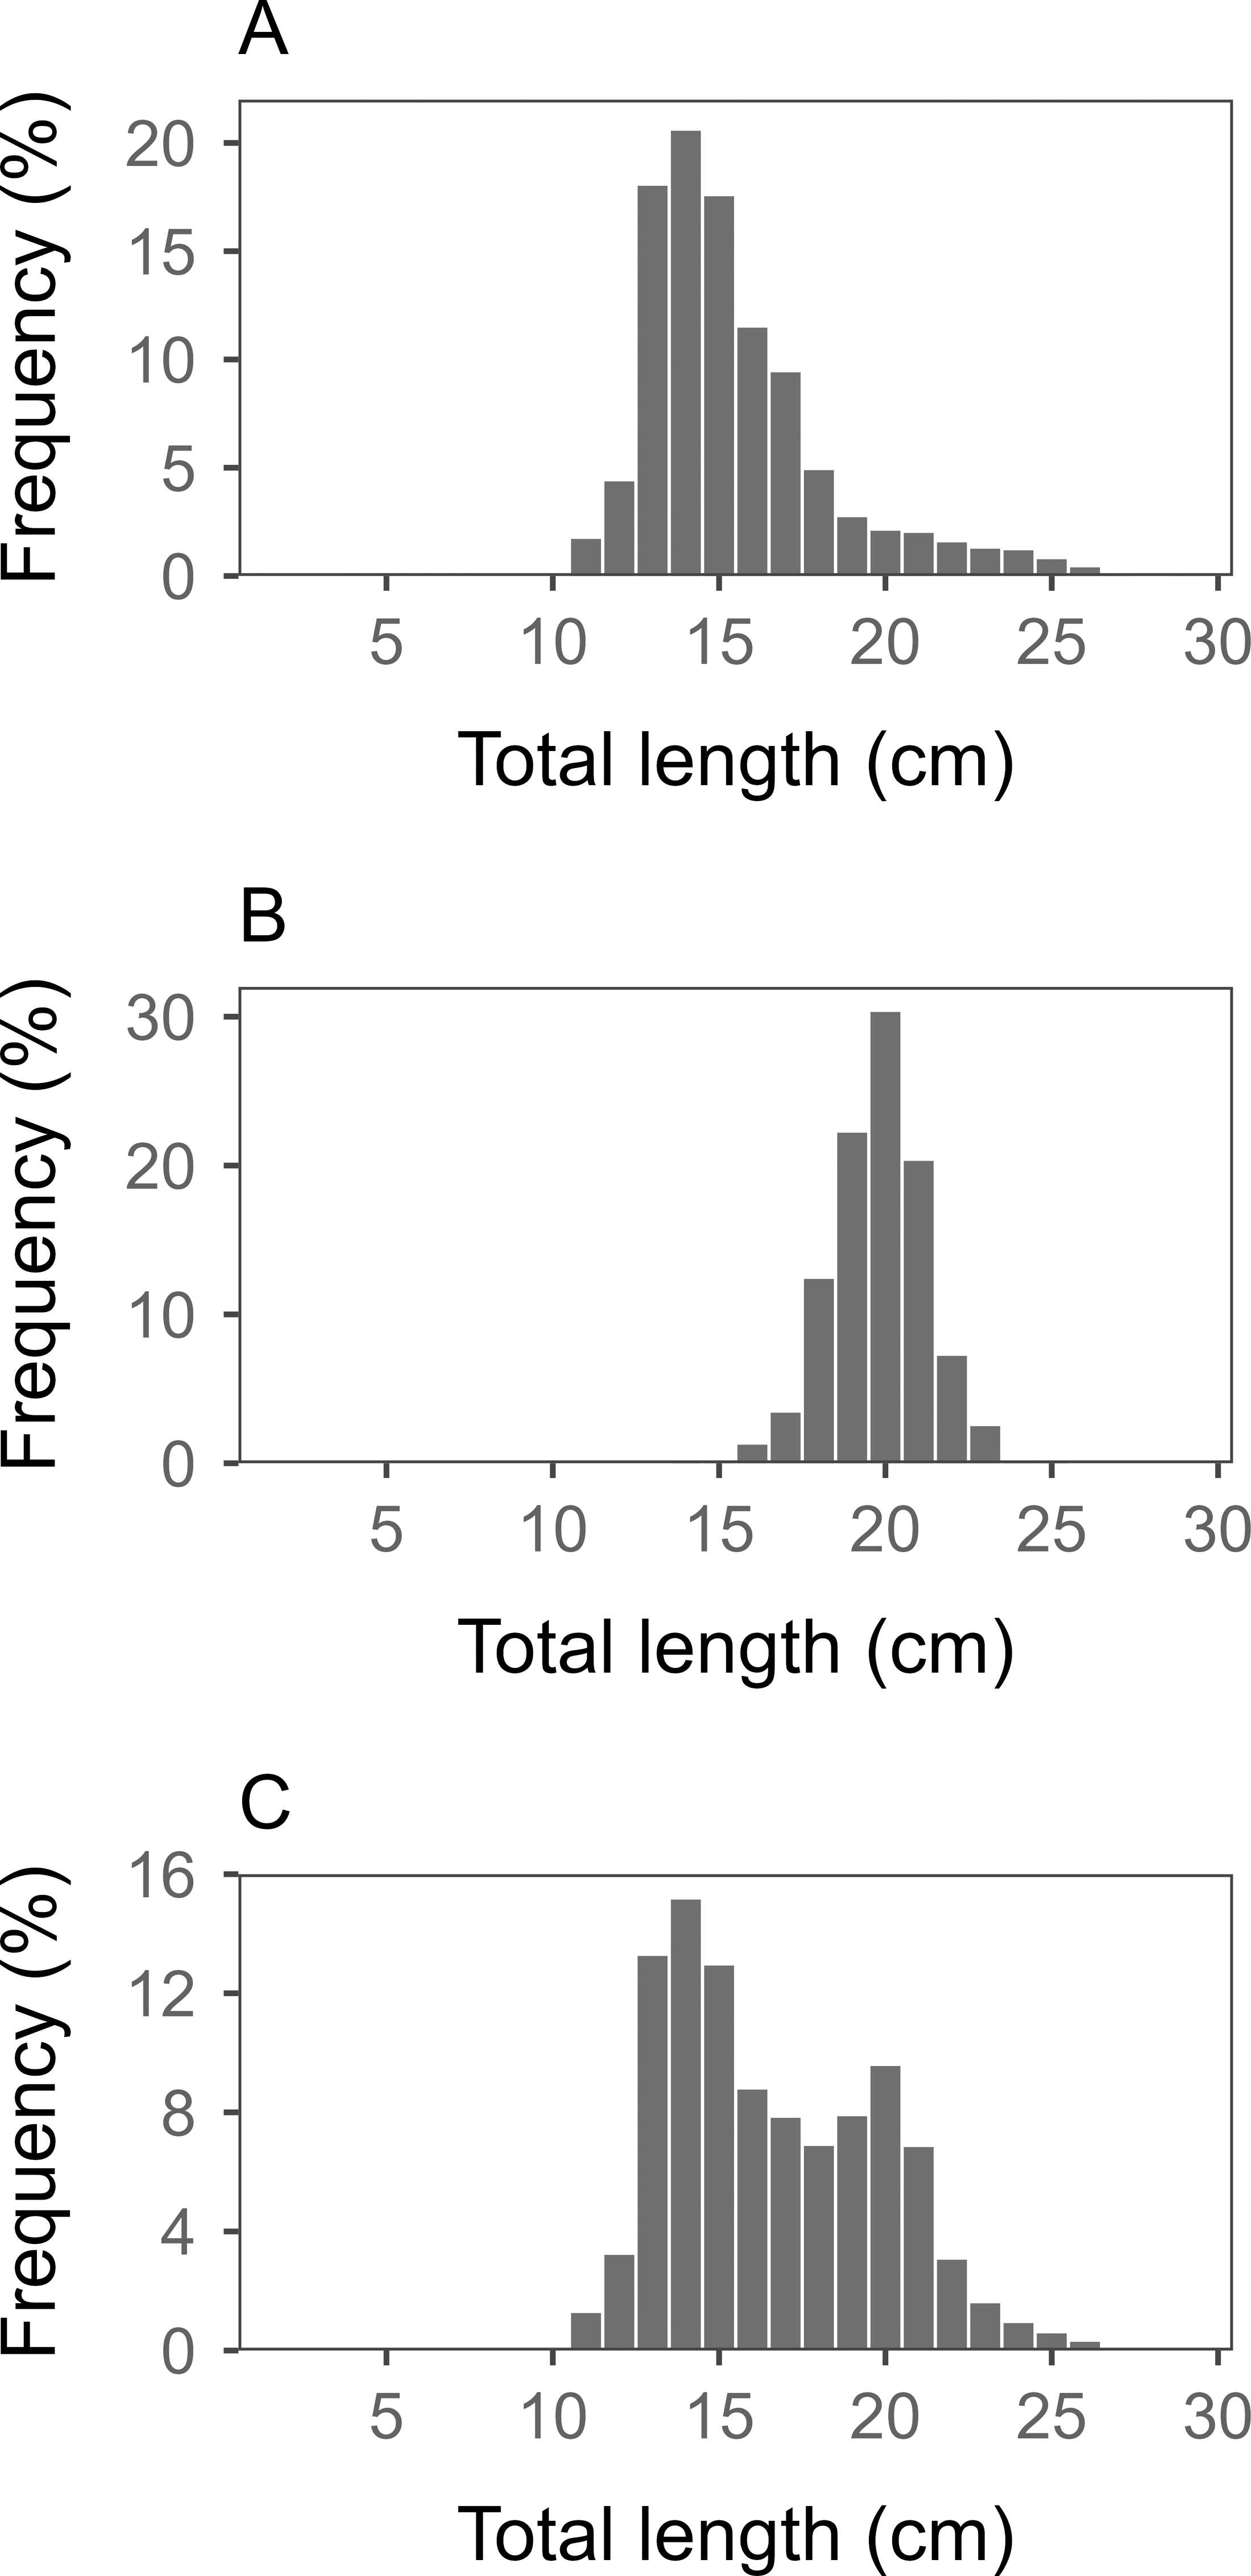
The instantaneous total mortality (Z) was estimated using the Pauly (1984) method based on the TL data from the catch. The Z for application to the single-gear model used the TL data (Fig. 3A) of the DS fishery, whereas those for application to the multi-gear model were weighted according to the catch from each fishery and summed (Fig. 3C). In addition, the instantaneous natural mortality (M) was estimated using the method of Zhang & Megrey (2006), which incorporates more comprehensive information on fish life history than other approaches, such as those by Alverson & Carney (1975) or Alagaraja (1984). The instantaneous fishing mortality (F) was obtained by subtracting M from Z.
Optimal fishing intensity (Fopt)
As the optimal fishing intensity (Fopt) for sailfin sandfish, an instantaneous fishing mortality of F0.1 at a 10% slope inclination when F = 0 on the YPR curve was determined by the YPR model. In the SBPR model, we estimated an instantaneous fishing mortality of F40%, which can sustain 40% of the spawning stock in the absence of fishing (F = 0) based on the SBPR curve. These optimal fishing intensities were estimated using single- and multi-gear models, respectively, and the results of these two models were analyzed and compared.
Sensitivity analysis
We assessed the impact of variations in the growth coefficient (K) and instantaneous natural mortality (M) in the multi-gear YPR and SBPR models on the estimates of each model. This was achieved by analyzing the sensitivity of the model estimates to 10% errors within a ±30% range of the two parameters based on the current values of these parameters.
Results
Fishing gear selectivity
Figure 4 shows the selectivity curve and age-specific selection ratio of the East Sea mid-sized Danish seine (DS) and coastal gillnet (GN) fisheries for sailfin sandfish. The estimated selectivity equations for each fishery are as follows: for the DS fishery and for the GN fishery. The age at first capture (tc) for the DS fishery was calculated by dividing α by β, whereas the age corresponding to the 50% selection ratio on the left of the bell-shaped curve was selected as tc for the GN fishery. The age at last capture (te) for the DS fishery was determined based on the lifespan of the sandfish, while the age corresponding to a 50% selection ratio on the right of the bell-shaped curve was selected for the GN fishery. Here, tc and te represent the knife-edged ages.
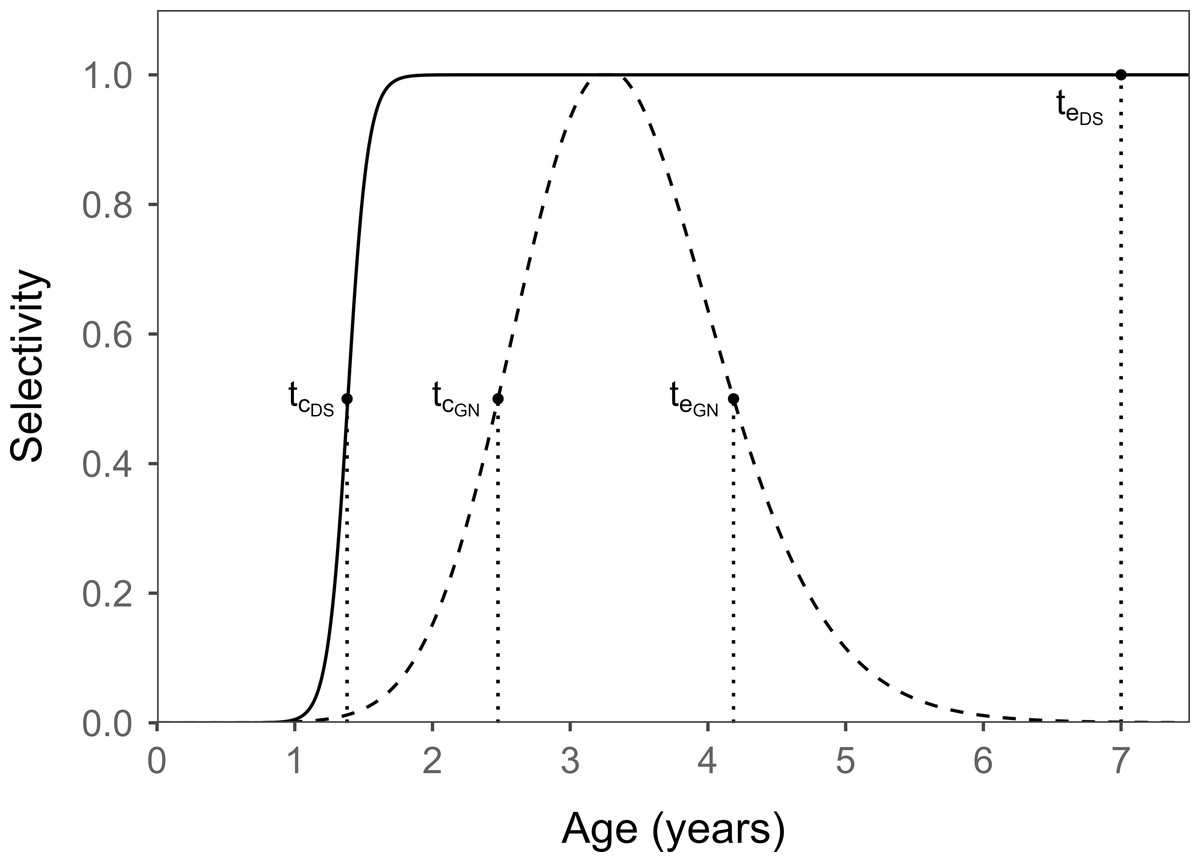
Figure 4: Selectivity curves and the knife-edged ages at first capture (tc) and at last capture (te) of sailfin sandfish caught by the East Sea mid-sized Danish seine (DS) and coastal gillnet (GN) fisheries.
The tc was higher in the GN fishery than that in the DS fishery, whereas the te was higher in the DS fishery than that in the GN fishery.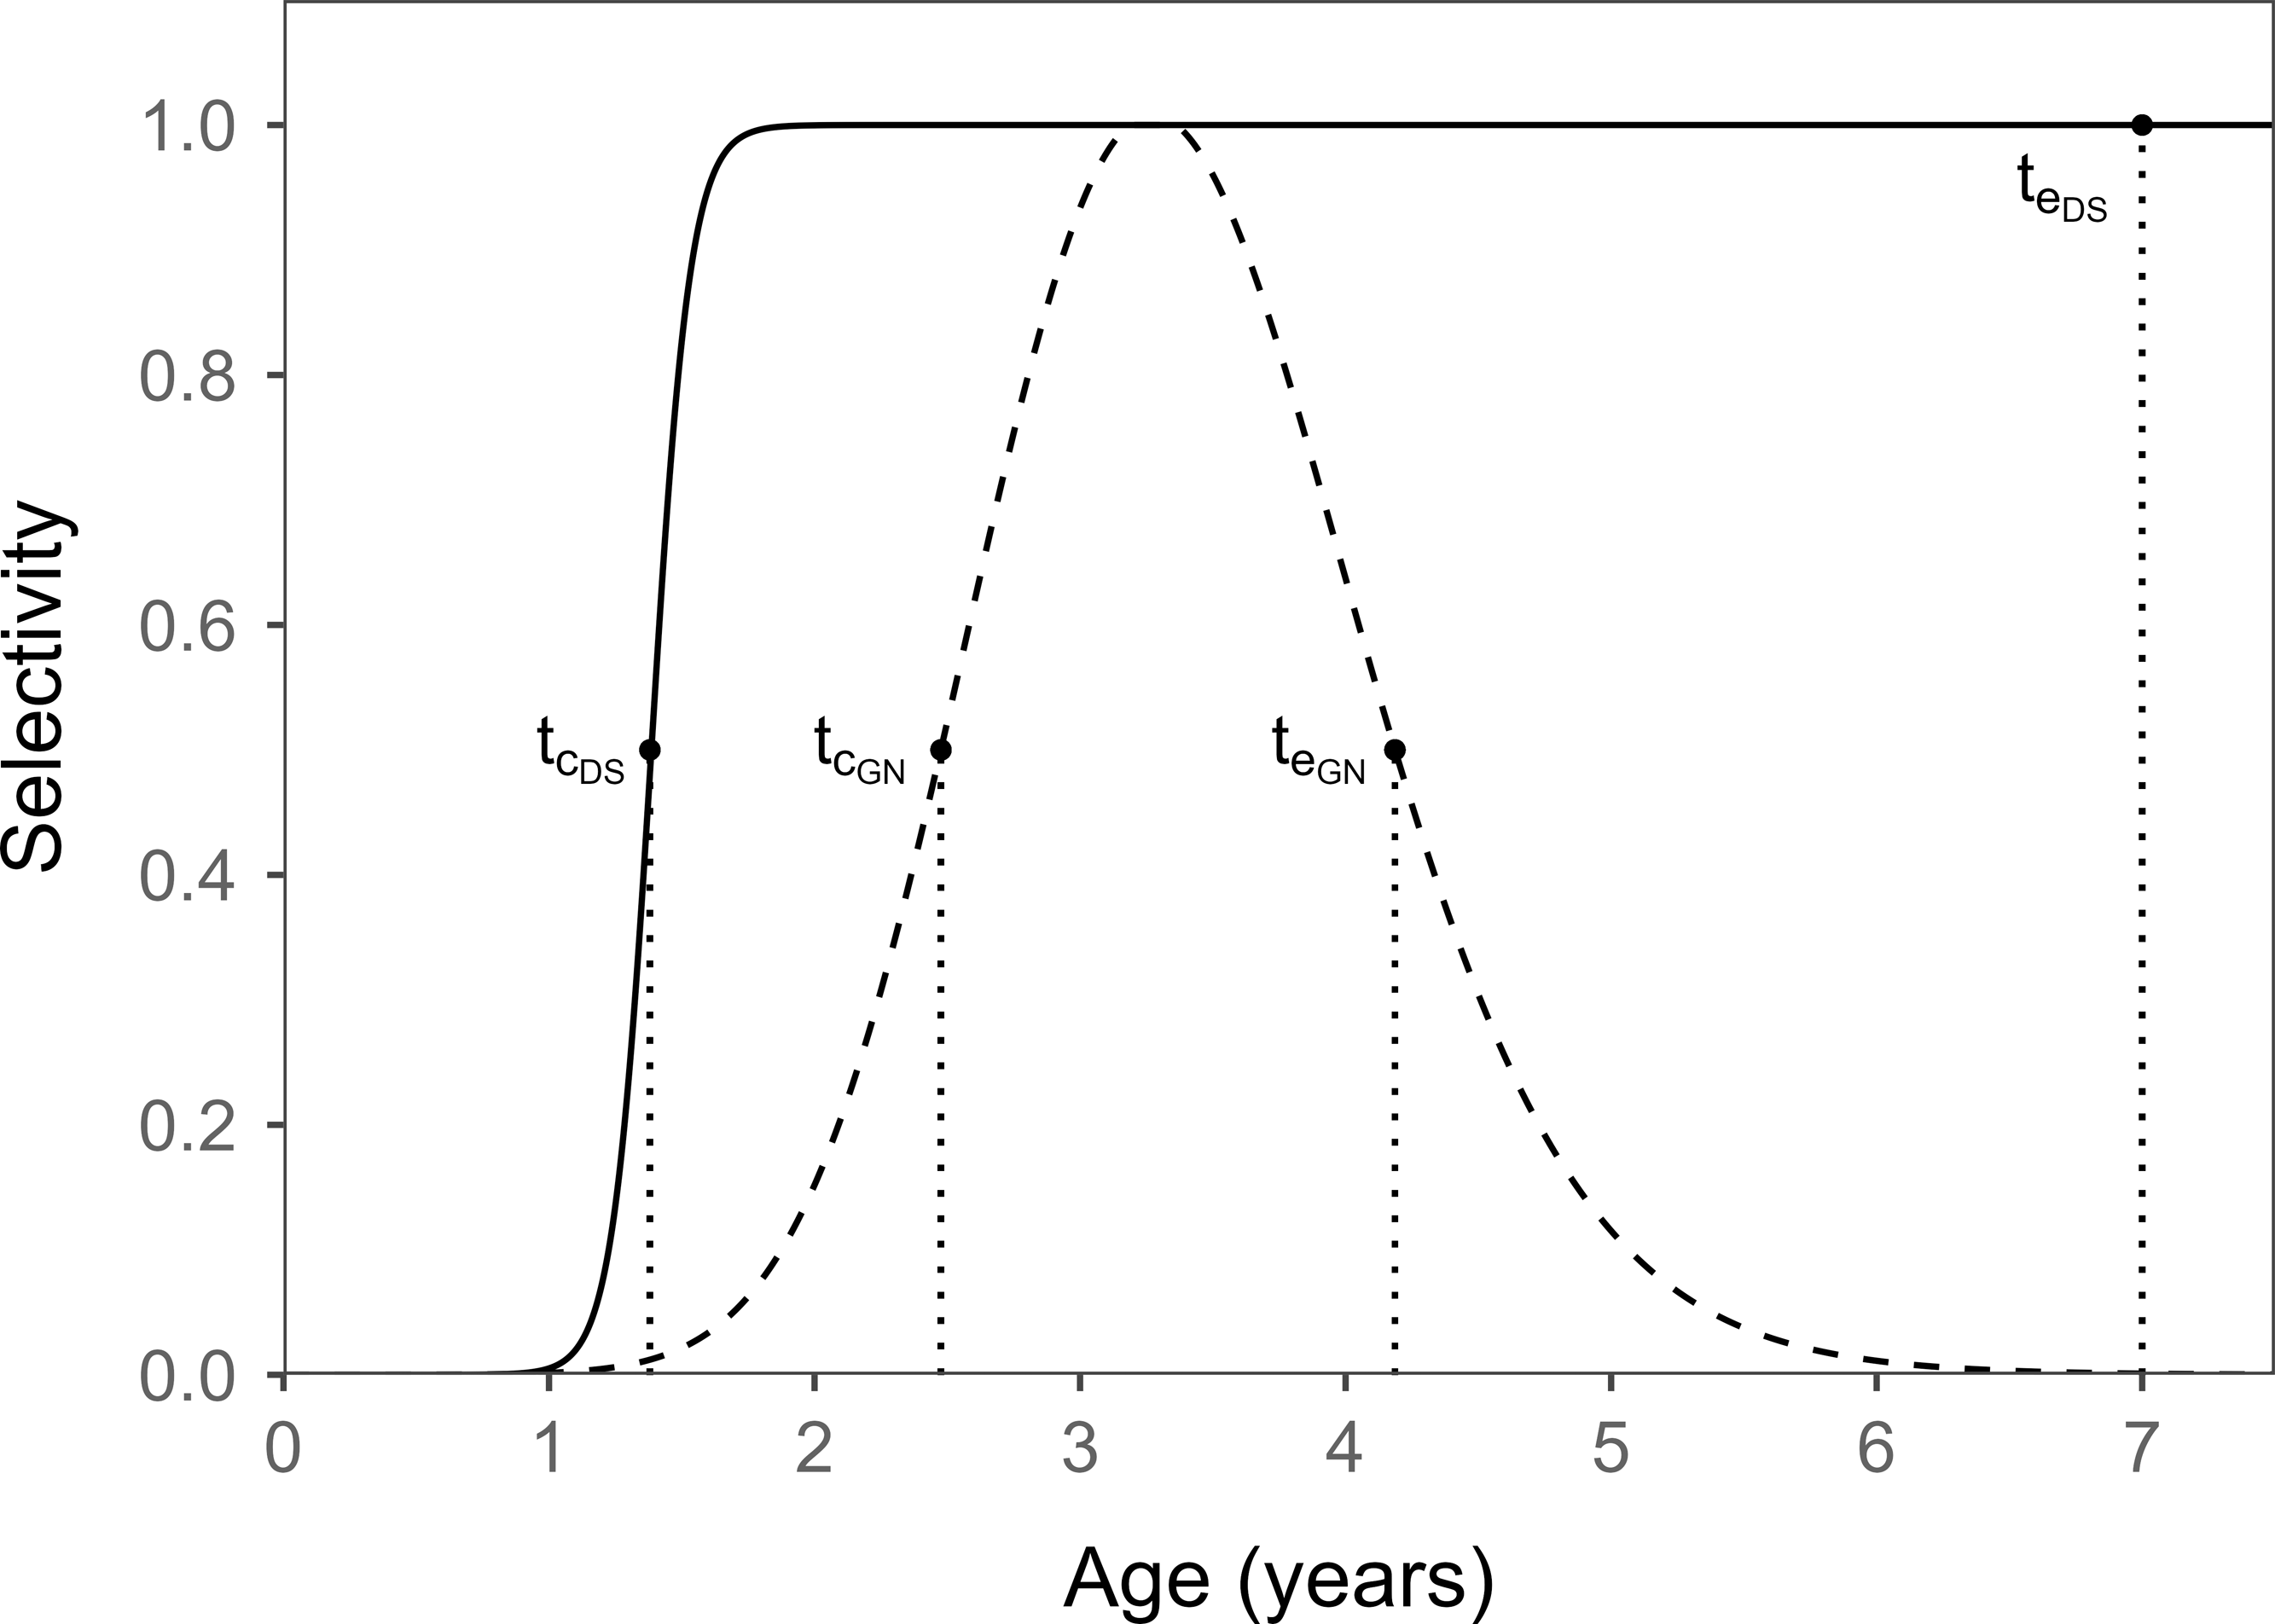
The tc of each fishing gear was estimated at 1.38 years for the DS fishery and 2.58 years for the GN fishery. This indicated a difference of 1.2 years higher for the tc of the GN fishery than that of the DS fishery. In addition, the age at last capture (te) for each fishing gear was estimated at 4.40 years for the GN fishery, and was considered to be 7 years (Lee et al., 2009) for the DS fishery.
Mortalities
The instantaneous total mortality (Z) estimated by the Pauly (1984) method using TL data (Fig. 3A for single-gear and Fig. 3C for multi-gear) for the single- and multi-gear models was 1.346/year and 1.515/year, respectively. Because the instantaneous natural mortality (M) obtained using the method of Zhang & Megrey (2006) was 0.480/year, the current instantaneous fishing mortalities (F) for the single- and multi-gear models were calculated to be 0.866/year and 1.035/year, respectively. The current F of each fishery for the multi-gear model was estimated at 0.611/year for the DS fishery and 0.424/year for the GN fishery, using the 2019 catch ratio (Fig. 1B) as the weighting (0.59 for the DS fishery and 0.41 for the GN fishery).
Yield per recruit
At the current age at first capture (tcDS = 1.38 years, tcGN = 2.58 years) and the current fishing intensity (FDS = 0.611/year, FGN = 0.424/year) of each fishery, the YPR values estimated by the multi-gear YPR model were 10.24 g for the DS fishery and 6.99 g for the GN fishery. This resulted in a total YPR of 17.23 g (FcMulti = 1.035/year) for the two fisheries (Fig. 5A).
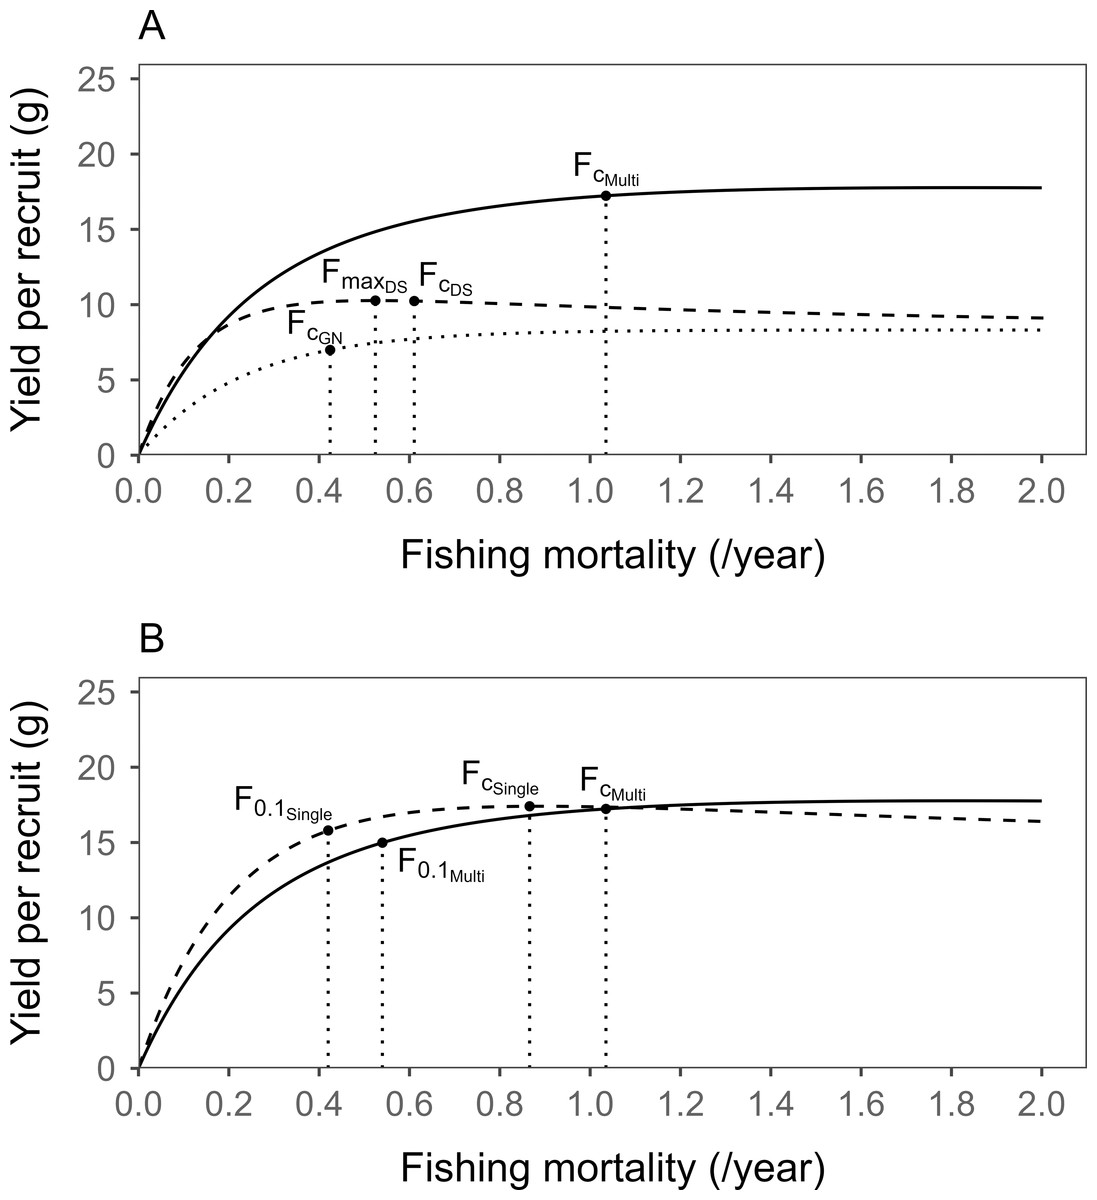
Figure 5: Comparison of the results from the multi-gear and the single-gear yield per recruit (YPR) models for sailfin sandfish in Korean waters.
(A) YPR curves plotted against fishing mortality at the current age at first capture (tc) derived from the multi-gear YPR model. The dashed and dotted curves represent the YPR for the East Sea mid-sized Danish seine (DS) and coastal gillnet (GN) fisheries, respectively, whereas the solid curve represents the combined YPR for the two fisheries. Fmax represents the fishing intensity yielding the maximum YPR. (B) YPR curves derived from the multi-gear model (solid line) and the single-gear (dashed line) models. FcMulti and F0.1Multi represent the current F and the F0.1 derived from the multi-gear YPR, respectively. Moreover, FcSingle and F0.1Single represent the current F and the F0.1 estimated from the single-gear YPR, respectively. At the current tc, the F0.1 derived from the multi-gear YPR model was higher than that from single-gear YPR model.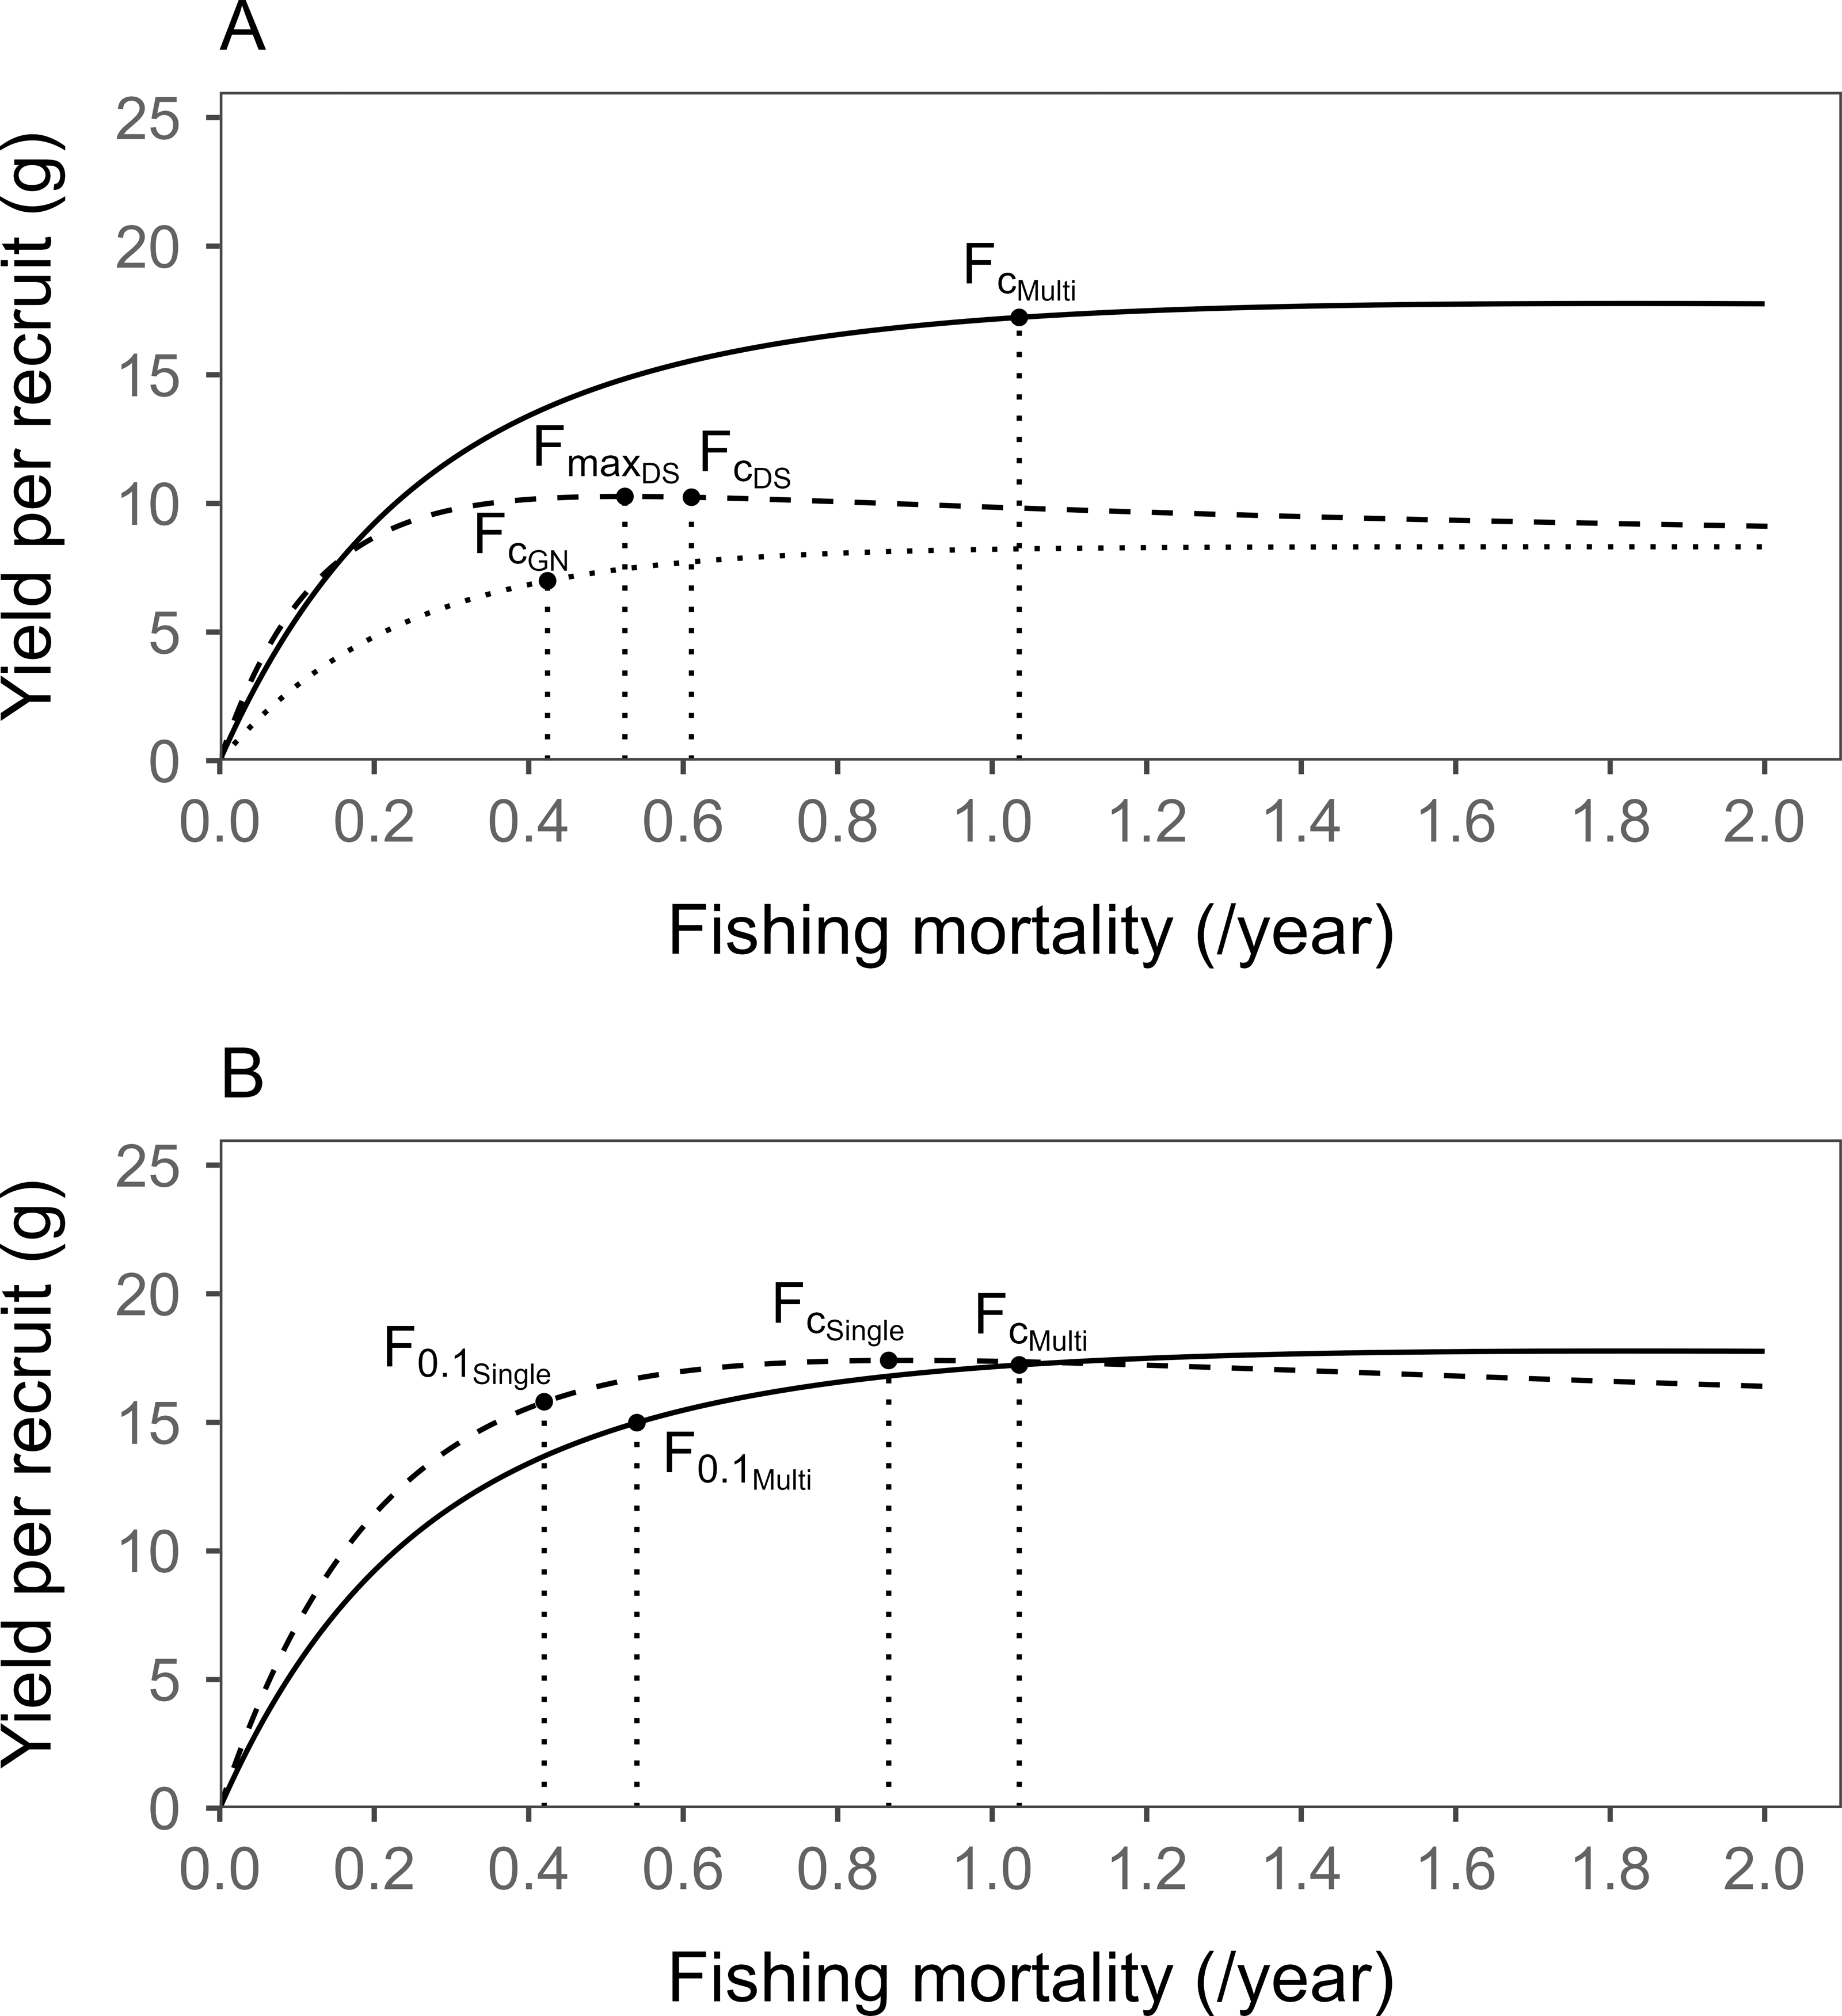
As shown in Fig. 5A, at the current level of fishing intensity, the YPR was higher for the DS fishery than that for the GN fishery owing to the different selectivities (Figs. 2A–2B). Additionally, the current fishing intensity for the DS fishery was higher than the fishing intensity (FmaxDS), which yielded the maximum YPR.
The YPR was 17.40 g at the current age at first capture (tcDS = 1.38 years) and current fishing intensity (FcSingle = 0.866/year) as per the single-gear YPR model (considering only the DS fishery) (Fig. 5B). Comparing the results of the two models (Fig. 5B), the current fishing intensity (1.035/year) from the multi-gear YPR model exceeded that from the single-gear model (0.866/year). The YPR was lower in the multi-gear model (17.23 g) than that in the single-gear model (17.40 g), although the difference was negligible.
Spawning biomass per recruit
Compared with the virgin spawning stock biomass, the current spawning stock biomass at the current fishing intensity (FcMulti = 1.035/year, FcSingle = 0.866/year) was estimated to be approximately 21% for the multi-gear model and approximately 18% for the single-gear model (Fig. 6). The estimate of F40% for the single-gear model, which only considered the DS fishery, was 0.400/year, which was lower than the estimate of 0.522/year for the multi-gear model.
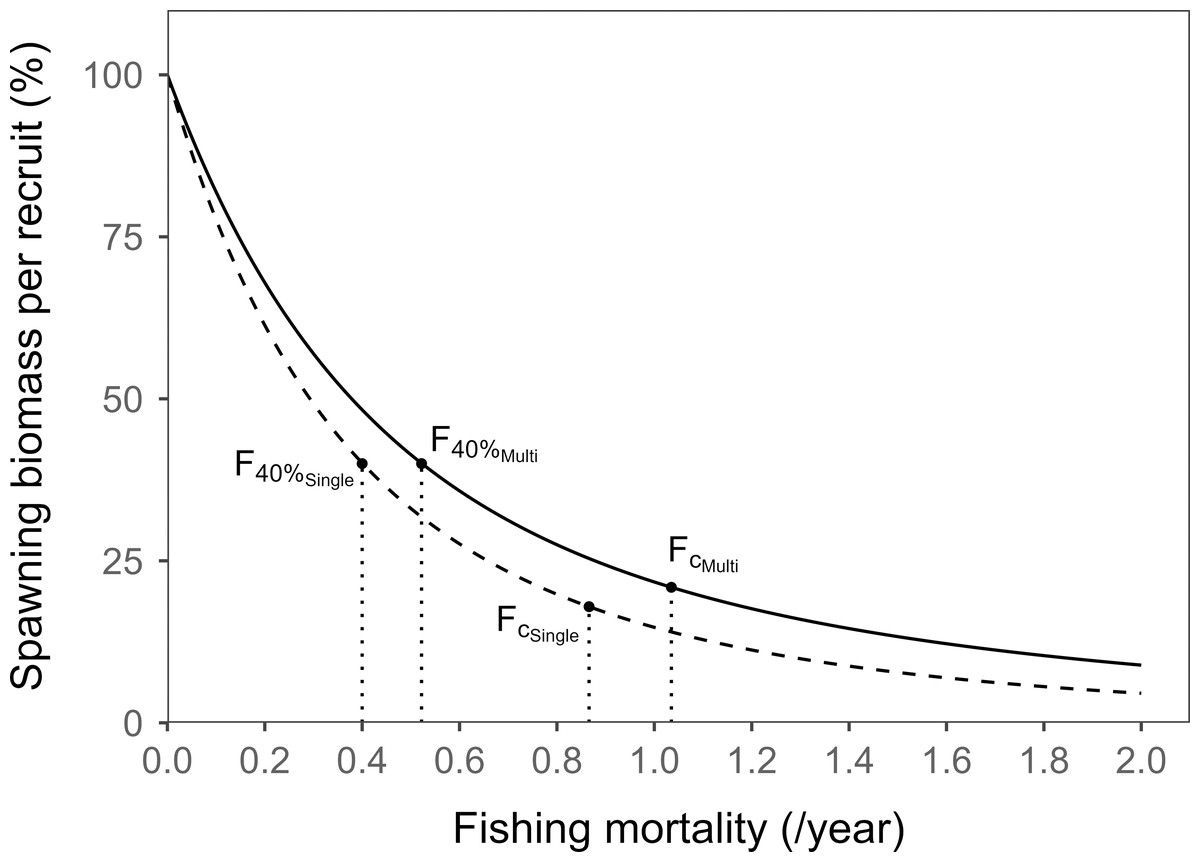
Figure 6: Comparison of the results from multi-gear spawning biomass per recruit (SBPR, solid line) and the single-gear SBPR (dashed line) of sailfin sandfish in Korean waters.
FcMulti, F40%Multi represent the current F level and the F40% derived from the multi-gear SBPR, respectively. FcSingle and F40%Single represent the current F level and the F40% derived from the single-gear SBPR, respectively. The two estimates of Fc and F40% from multi-gear SBPR model were higher than those from single-gear SBPR model.
Optimal fishing intensity and optimal age at first capture
In the case of F0.1 based on the YPR models (Fig. 5B), the F0.1Multi was estimated to be 0.540/year, and the F0.1Single was estimated to be 0.422/year. The YPR values at this time were 14.99 g and 15.78 g, respectively, indicating that the estimate of F0.1 was higher in the multi-gear model than that in the single-gear model. This phenomenon reflects the actual catch status, wherein the capture of older fish in the GN fishery gradually decreases because of their selectivity (Figs. 2 and 4). The F0.1 derived from the multi-gear model, which accounted for the two different selectivity curves (sigmoid for DS and bell-shaped for GN), was estimated to be higher than that of the single-gear YPR model, which only considered the DS fishery.
Conversely, in the single-gear model (traditional model), the catch of older fish was maintained until the age at end capture because of the nature of their sigmoid selectivity; therefore, fishing mortality could be lower to compensate for the necessary catch level or necessary spawning biomass using low fishing intensity. The current fishing mortality was underestimated by 16% in the single-gear model compared with the multi-gear model because the single-gear model only considered DS selectivity (sigmoid curve) and not combined DS and GN (bell-shaped curve) selectivity.
According to the SBPR model, the F40%Multi was 0.522/year and the F40%Single was 0.400/year, and the estimates were similar to F0.1. This also reflected the catch status of older fish in the GN fishery and YPR models; therefore, the estimate for the multi-gear model was higher than that for the single-gear model (Fig. 6).
Table 2 compares the YPR and SBPR at the current level of fishing intensity (Fc) estimated from the multi-gear and single-gear models and those at the optimal fishing intensity (F0.1, F40%) as management reference points. Overall, the fishing intensity was higher in the multi-gear model than that in the single-gear model.
| Reference points | Fc | F0.1 | F40% | |||
|---|---|---|---|---|---|---|
| Models | Multi | Single | Multi | Single | Multi | Single |
| F (/year) | 1.035 | 0.866 | 0.540 | 0.422 | 0.522 | 0.400 |
| YPR (g) | 17.23 | 17.40 | 14.99 (−13%) |
15.78 (−9%) |
14.82 (−14%) |
15.56 (−11%) |
| SBPR (%) | 20.91 | 17.92 | 39.00 (+46%) |
30.90 (+42%) | 40.00 (+48%) | 40.00 (+55%) |
Notes:
The numbers in parentheses indicate the percentage change in YPR and SBPR compared to the current level (Fc).
The F0.1 or F40% levels for the appropriate management of the sailfin sandfish stock by the multi-gear model were approximately half lower than the current fishing intensity (Fc), with no significant difference observed between YPR and SBPR (Fig. 7). Reducing the fishing intensity to F0.1 resulted in a YPR of 14.99 g, representing a 13% decrease from the current level. This also corresponded to a 46% increase in the SBPR from the current level. Compared to the current Fc level, F40% increased the SBPR by 48% and decreased the YPR by 14% (Table 2).
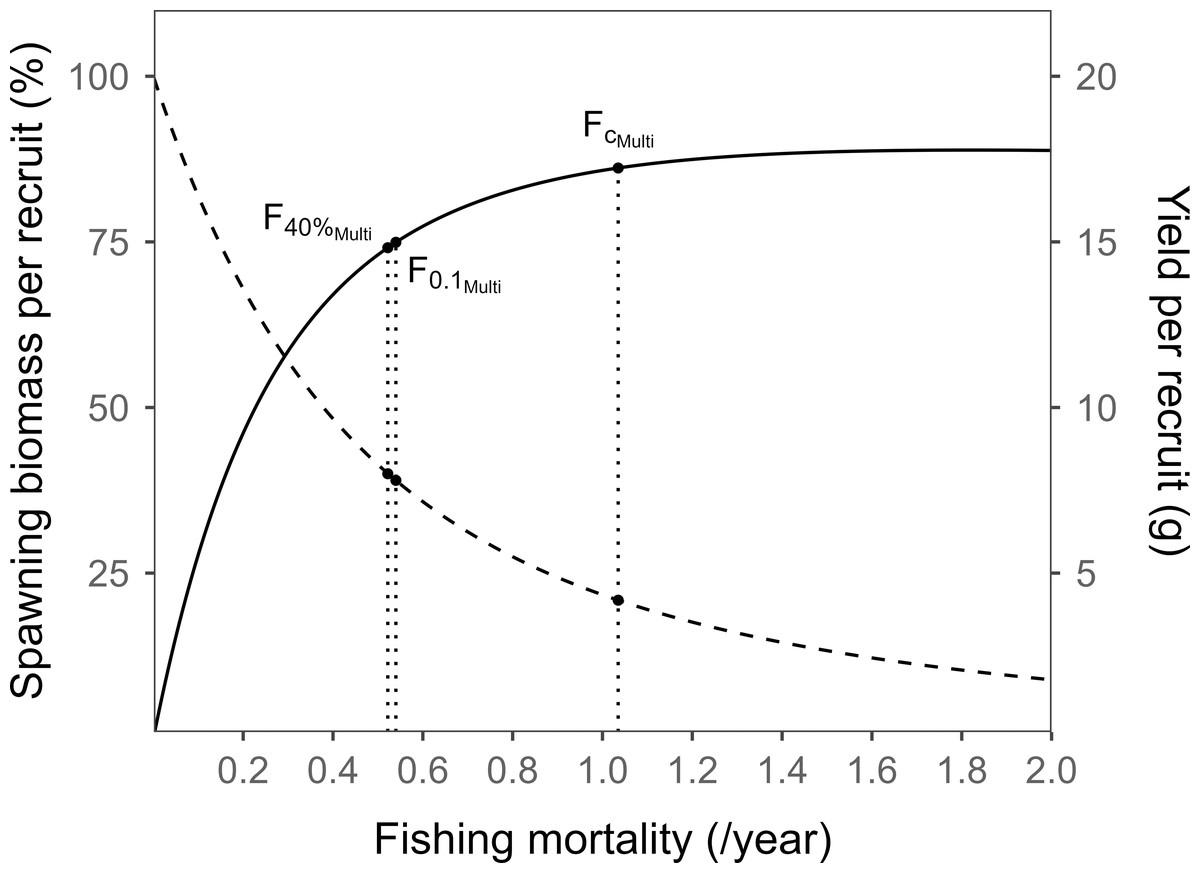
Figure 7: Curves showing the yield per recruit (solid line) and spawning biomass per recruit (dashed line) by the multi-gear models based on the fishing intensity for sailfin sandfish in Korea waters.
The F0.1 or F40% from the multi-gear model was approximately half of the current fishing intensity (Fc), with minimal difference observed between the two reference points.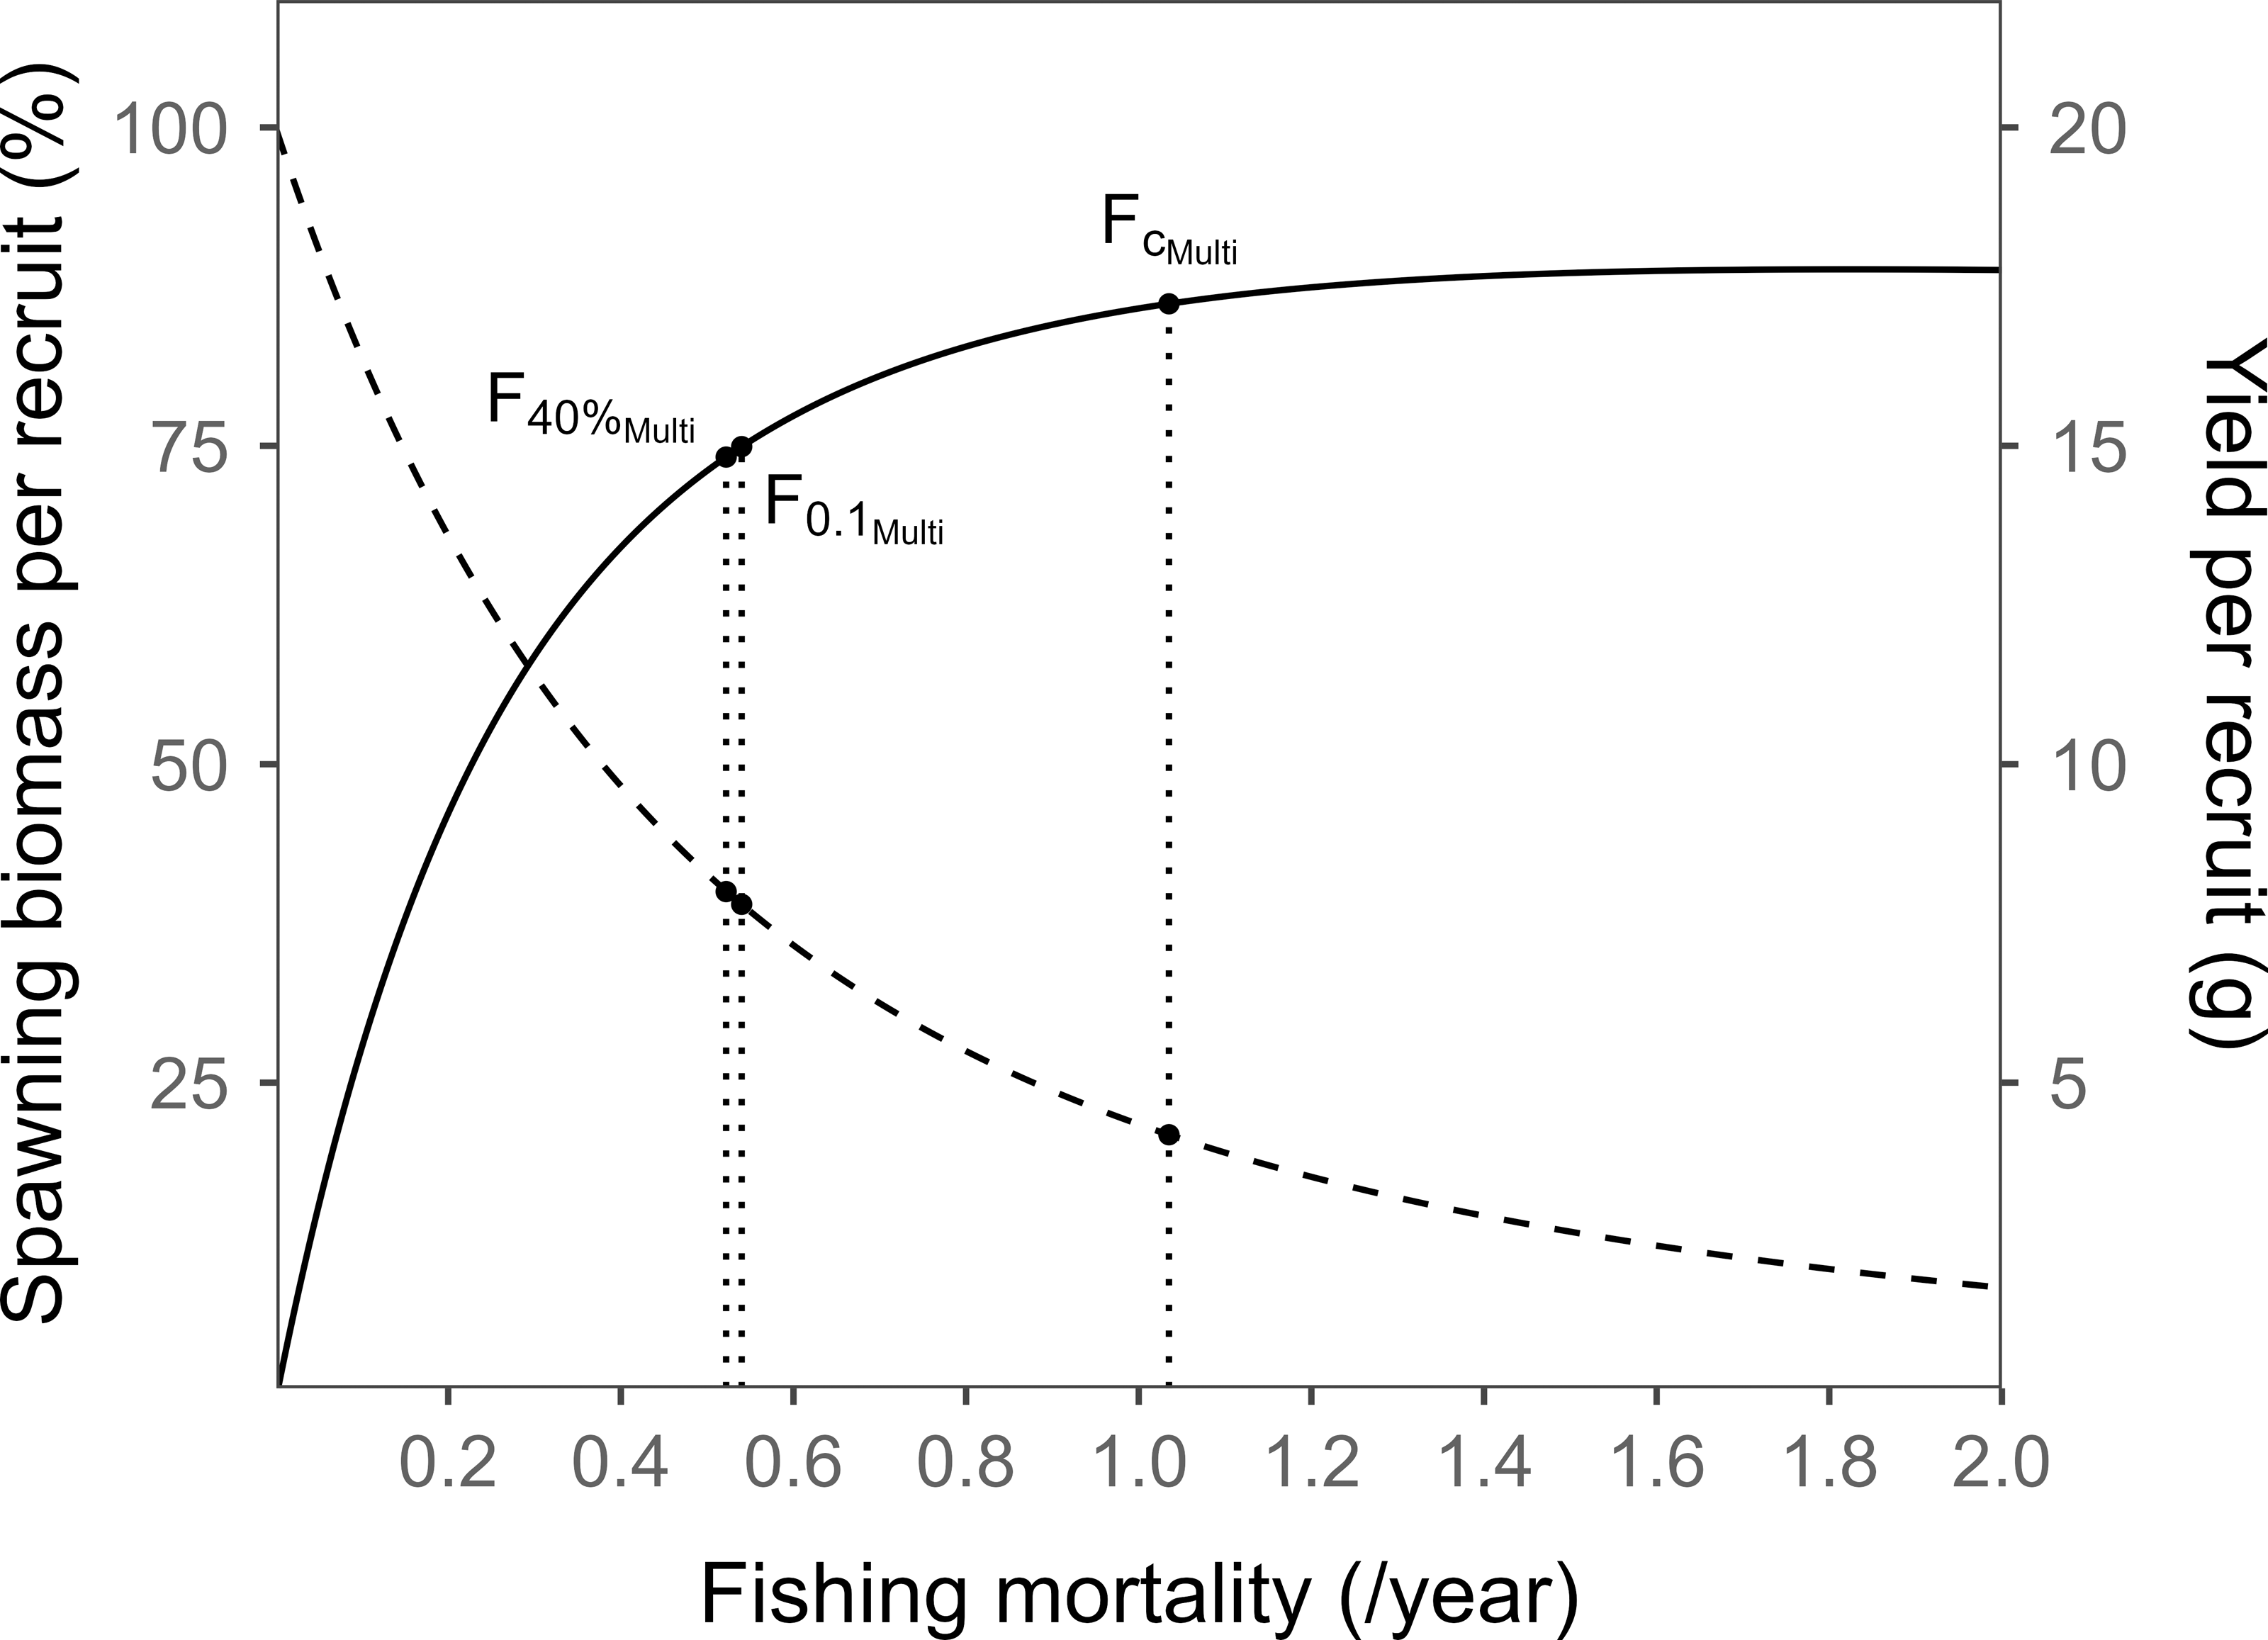
Sensitivity analysis
A sensitivity analysis was conducted to examine the perturbation of variations in the growth coefficient (K) and natural mortality (M) parameters used in the multi-gear YPR and SBPR models on the estimates of each model. Figure 8A shows the sensitivity of YPR to errors of M and K. YPR showed an inverse relationship, decreasing with increasing M. If the error of M is -30%, the YPR increases by 35%, and if the error of M is +30%, the YPR decreases by 25%. Conversely, if K error is -30%, YPR decreases by 50%, and if it is +30%, YPR increases by 60%. Therefore, YPR was found to be more sensitive to variations in growth coefficient (K) values than those in natural mortality (M) values.
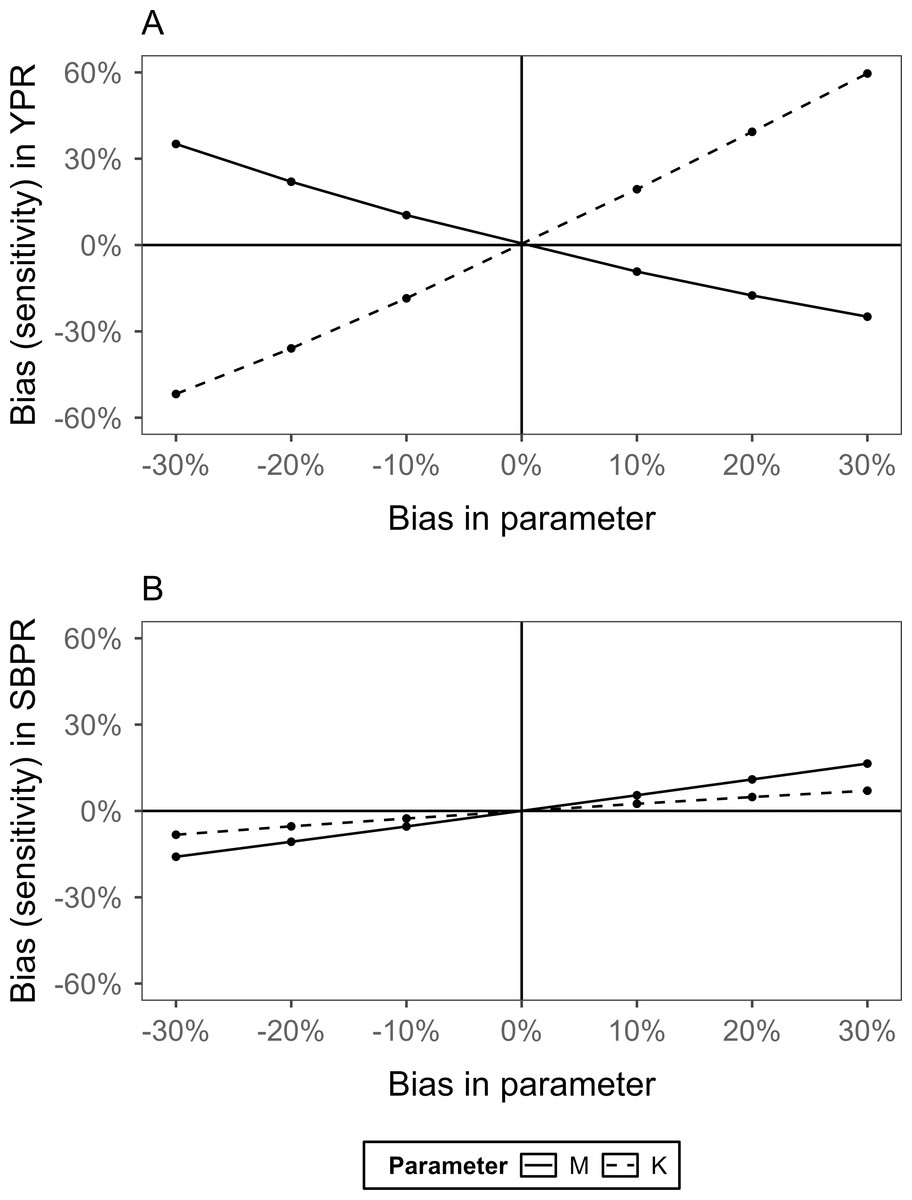
Figure 8: Changes in yield per recruit and spawning biomass per recruit in relation to variations in the natural mortality (M) and growth (K) parameters of the multi-gear models for sailfin sandfish.
(A) Yield per recruit (YPR). (B) Spawning biomass per recruit (SBPR). YPR was more sensitive to variations in these two parameters than SBPR, and YPR was more sensitive to variations in K than to variations in M.
Figure 8B shows the sensitivity analysis results of M and K for the SBPR. As the errors of both M and K increased, SBPR also increased, and SBPR showed changes of −16% to +16% and −8% to +7%, respectively, indicating greater sensitivity to M than to K. However, M and K significantly affected YPR but minimally influenced SBPR.
Discussion
Most target fish species are captured in multiple fisheries, with each fishery also catching multiple species. Therefore, they exhibit a structure characterized by multi-fishing gear and multi-species fishing. Managing fishery resources through stock assessments is impractical without considering these factors.
The traditional (single-gear) YPR model considers only one fishing gear, which is representative of the fishing intensity of the target fish species and the age at first capture of the species (Booth et al., 2000; King, 2007). However, because the actual target fish species are captured using multiple fishing gears, each with different selectivities, the assessment results may be misleading if only a single fishing gear is considered. Therefore, in this study, multi-gear YPR and SBPR models were presented that consider multiple fishing gears by modifying the single-gear models. Moreover, the single-gear and multi-gear model results were compared and analyzed for sailfin sandfish in Korean waters.
Over the past 20 years, the management of sailfin sandfish resources in Korea has involved various strategies, including the Fisheries Resources Recovery Project and TAC system implementation. Additionally, stock assessments have been conducted to develop management plans. However, in the past, only data from the East Sea mid-sized Danish seine (DS) fishery, a target fishery for TAC management, were used for stock assessment. More than 90% of the fish are captured by DS and coastal gillnet (GN) fisheries, while approximately 40% of the catch is attributed to GN fishery. Therefore, in this study, the traditional (single-gear) YPR model was transformed into a multi-gear model to incorporate the effects of the GN fishery in sailfin sandfish stock assessment.
To compensate for the shortcomings of the single-gear YPR model and consider the selectivity of different fishing gear, the multi-gear YPR model employs the term the age at last capture (te) instead of the maximum age of catch (tL) to define both the age at first capture (tc) and the age at last capture (te). This adjustment allows for a more accurate representation of the actual selectivity of each fishing within the model.
When comparing the YPR of the multi-gear and single-gear models, the optimal fishing intensity of F0.1 was higher for the multi-gear model. However, the YPR was higher for the single-gear model, with only a negligible difference observed between the two models. In evaluating the fishing intensity of each fishery for the target fish stock, the single-gear model used data from only one fishery (in this case, the DS fishery) to evaluate the entire stock, whereas the multi-gear model used data from several related fisheries (in this case, the DS and GN fisheries collectively) to obtain a more accurate estimate. The F0.1 estimate for the single-gear YPR model (only considering the DS fishery) was underestimated because it did not account for the phenomenon where the catch of older fish in the GN fishery decreased owing to its selectivity. Specifically, the te of the GN fishery was lower than that of the DS fishery, and the selectivity of the GN fishery reached zero after te (Figs. 2 and 4).
In the SBPR model, the optimal fishing intensity of F40% was higher in the multi-gear model, and this difference was attributed to the underestimation of F40% in the single-gear model for the same reason.
It is important to note that although the optimal fishing intensity of the multi-gear model is higher than that of the single-gear model, the fishing intensity of the single-gear model pertains solely to one fishery (DS fishery) when considering the different selection of fishing of each fishery. However, the fishing intensity of the multi-gear model pertains to two fisheries (the DS and GN fisheries); therefore, the fishing intensity of the DS fishery is much lower for the multi-gear model than that for the single-gear model. Consequently, a risk of overfishing exists when the results of the single-gear model are used for fishery management.
Based on the results of the multi-gear model, an effective management plan for the sustainable use of sailfin sandfish resources should consider F0.1 for productivity and F40% for spawning stock protection as the optimal fishing intensity. In this study, the two optimal fishing intensities were found to be at similar levels; therefore, effective management can be expected regardless of the fishing intensity chosen. However, recent years have witnessed an increase in recruitment overfishing (Lee et al., 2024), highlighting the need for management strategies to protect spawning stocks. In light of the need to prevent recruitment overfishing and variations in YPR and SBPR relative to optimal fishing intensity, the F40% appears to be a more appropriate management reference point for selection. In the TAC management for sailfin sandfish, estimating the acceptable biological catch (ABC) necessitates reducing fishing mortality from the current level of 1.035/year to the target reference point (F40%) of 0.522/year. This adjustment represents approximately a 50% decrease in the current fishing mortality to prevent recruitment overfishing.
The sensitivity analysis of the instantaneous natural mortality coefficient (M) and growth coefficient (K) for the multi-gear YPR and SBPR models indicated that YPR decreased and SBPR increased as the error of M increased. In contrast, the error of K showed a positive proportional relationship for both YPR and SBPR. YPR was sensitive to variations in both M and K and relatively more sensitive to variations in K. SBPR was more sensitive to M than to K; however, it was not significantly affected by the variations in the two parameters. Therefore, to avoid YPR errors, especially when using multi-gear YPR models, accurate and precise estimates of the parameters M and K are required.
This model has some limitations. Under the steady-state assumption, the total yield in any given year from all age classes is equivalent to that from a single cohort over its entire lifespan. Therefore, some biases may be expected if strong year classes emerge in any year. In addition, the assumption that natural and fishing mortalities are constant after the age at first capture can cause bias in this situation (King, 2007), although measuring natural mortality is difficult and leads to the common assumption of constancy for age classes of fishable size (Björnsson, Sólmundsson & Woods, 2022). However, the new multi-gear YPR model can avoid the assumption that, after the age at first capture, all fish coming into contact with fishing gear possess an equal probability of capture.
In this study, we introduced the concept and methodology of multi-gear models that account for different selectivities and fishing mortality coefficients across different fisheries in multi-gear contexts. An example was provided to illustrate the application of these models in stock assessment. The fishing mortality coefficient for each fishery using multiple fishing gear was calculated by simply weighing the catch amount. Future studies should focus on estimating fishing mortality coefficients and allocating ABC for each fishery of multiple fishing gear.
Conclusions
Multiple fishing gears are employed to capture more fishery resources than those captured using a single fishing gear, with selectivity differing among gear types. In this study, the traditional (single-gear) yield per recruit (YPR) and spawning biomass per recruit (SBPR) models were modified into multi-gear YPR and SBPR models that can be applied to multiple fishing gears with different selectivities. The modified models were applied to sailfin sandfish (Arctoscopus japonicus) stocks primarily caught by the East Sea mid-sized Danish seine (DS) and coastal gillnet (GN) fisheries in Korean waters. We hypothesized that management reference points should be estimated from stock assessments based on multiple fishing gears while considering the selectivity of each gear. The results obtained from the multi-gear model showed that the optimal fishing intensities (F0.1, F40%) were higher for the multi-gear model than those for the single-gear model, with no significant difference observed between the YPR and SBPR of the two models. Therefore, the optimal fishing intensity derived from the traditional (single-gear) model was underestimated because it accounted for only one fishing gear. Consequently, a risk of overfishing exists if this fishing intensity is used for resource management. In conclusion, the optimal fishing intensities of the multi-gear model consider the different selectivities and fishing intensities of multiple fishing gears; therefore, the estimation result of this model evaluated the stock status of sailfin sandfish more accurately. Because multi-gear fisheries account for half of global fishery landings (Herron et al., 2018), the multi-gear models developed in this study may be useful for assessing fish stocks in multi-gear fisheries worldwide. Also, the multi-gear models can be easily extended to species exploited by more than two fishing gears.