
The pht4;1-3 mutant line contains a loss of function allele in the Fatty Acid Desaturase 7 gene caused by a remnant inactivated selection marker—a cautionary tale
- Published
- Accepted
- Received
- Academic Editor
- Jenny Renaut
- Subject Areas
- Biochemistry, Genetics, Plant Science
- Keywords
- Transposon mutant, Trienoic fatty acids, FAD7, PHT4, Arabidopsis insertion mutant
- Copyright
- © 2017 Nilsson and Andersson
- Licence
- This is an open access article distributed under the terms of the Creative Commons Attribution License, which permits unrestricted use, distribution, reproduction and adaptation in any medium and for any purpose provided that it is properly attributed. For attribution, the original author(s), title, publication source (PeerJ) and either DOI or URL of the article must be cited.
- Cite this article
- 2017. The pht4;1-3 mutant line contains a loss of function allele in the Fatty Acid Desaturase 7 gene caused by a remnant inactivated selection marker—a cautionary tale. PeerJ 5:e4134 https://doi.org/10.7717/peerj.4134
Abstract
A striking and unexpected biochemical phenotype was found in an insertion mutant line in the model plant Arabidopsis thaliana. One of two investigated insertion mutant lines in the gene encoding the phosphate transporter PHT4;1 demonstrated a prominent loss of trienoic fatty acids, whereas the other insertion line was indistinguishable from wild type in this aspect. We demonstrate that the loss of trienoic fatty acids was due to a remnant inactive negative selection marker gene in this particular transposon tagged line, pht4;1-3. This constitutes a cautionary tale that warns of the importance to confirm the loss of this type of selection markers and the importance of verifying the relationship between a phenotype and genotype by more than one independent mutant line or alternatively genetic complementation.
Introduction
Reverse genetics is a powerful tool in plant biology to establishing causal relationships between genotype and phenotype. There are numerous mutagenesis strategies, both targeted (Felippes, Wang & Weigel, 2012; Gaj, Gersbach & Barbas, 2013; Yin, Gao & Qiu, 2017) and untargeted (Alonso et al., 2003; Henikoff & Comai, 2003; McCallum et al., 2000) for generating the starting material for reverse genetics studies. Once the genetic location of a mutation has been confirmed, and the corresponding gene product is shown to be affected, the work in connecting genotype to phenotype can begin (O’Malley & Ecker, 2010). But importantly, the plant line must also be cleared of off-target mutations that may have arisen during mutagenesis. The common recommendation to circumvent this problem is to use several independent mutant lines when inferring phenotype from genotype, or alternatively, the mutant line can be functionally complemented with the wild-type copy of the gene of interest.
The PHT4;1 gene in Arabidopsis thaliana (At2g29650) encodes a phosphate transporter localized to chloroplast membranes (Guo et al., 2008; Karlsson et al., 2015; Pavon et al., 2008; Yin, Vener & Spetea, 2015). Several loss-of-function mutant alleles for PHT4;1 have been described: pht4;1-1, pht4;1-2 and pht4;1-3 (Wang et al., 2011). The pht4;1-3 allele was isolated from a transposon insertion mutant population (Sundaresan et al., 1995; Wang et al., 2011) and has been used in at least two publications (Guo et al., 2008; Karlsson et al., 2015). The PHT4;1 transporter has not only been reported to be involved in maintaining chloroplast phosphate homeostasis (Karlsson et al., 2015) but also to play a role in plant pathogen defense by affecting salicylic acid levels (Wang et al., 2014; Wang et al., 2011). Further, plants devoid of PHT4;1 display reduced growth under standard cultivation condition, a phenotype that can be reverted by growing the pht4;1 mutants in high-phosphate conditions (Karlsson et al., 2015).
The membranes of plant chloroplast are mainly comprised of galactolipids, of which mono- and digalactosyl diacylglycerol (MGDG and DGDG, respectively) make up approximately 75% of the total chloroplastic acyl lipids (Li-Beisson et al., 2013). MGDG and DGDG are particularly enriched in trienoic fatty acids with 16 or 18 carbons in chain length (16:3 and 18:3, respectively, number of total carbon atoms:number of double bonds of the fatty acids). Arabidopsis mutants defective in the Fatty acid desaturase (FAD7) gene show reduced plastidial conversion of linoleic acid (18:2) to α-linolenic acid (18:3), and hexadecadienoic acid (16:2) to hexadecatrienoic acid (16:3) (Browse, McCourt & Somerville, 1986; Iba et al., 1993). Hence, fad7 plants have a fatty acid profile skewed to contain unusually high proportion of 16:2/18:2–16:3/18:3.
Under phosphate limiting conditions, plants can exchange a substantial part of the plasma membrane phosphoglycerolipids for galactolipids (Andersson et al., 2003). In light of these previous findings, we investigated whether pht4;1 mutants are affected in leaf lipid composition. To our surprise we identified a second mutation in the pht4;1-3 line located in the FAD7 locus that rendered plants defective in the synthesis of trienoic fatty acids. We propose that this phenotype, not connected to PHT4;1 per se, could potentially influence properties previously ascribed to absence of the phosphate transporter.
Materials and methods
Plant material, growth conditions and genotyping
Arabidopsis plants were cultivated as described under short day condition (Johansson et al., 2015). The pht4;1-2 and pht4;1-3 lines were a kind gift from professor Cornelia Spetea Wiklund and have been previously described (Karlsson et al., 2015). The fad7-1 knock-out line (NASC ID N8042) was acquired from the Nottingham Arabidopsis Stock Center (Browse, McCourt & Somerville, 1986; Scholl, May & Ware, 2000).
Plant DNA was extracted by heating a small leaf piece (approximately 10 mm2) in 750 µL extraction buffer (200 mM Tris–HCl pH 7.5, 250 mM NaCl, 25 mM EDTA, 0.5% SDS) for 5 min at 95 °C. The solution was left in room temp for a few hours before the DNA was precipitated through the addition of 750 µl 2-propanol. The supernatant was removed after centrifugation and the pellet washed once in 70% ethanol. Samples were dried in room temperature and the pellet containing DNA was reconstituted in 150 µL H2O.
PCRs was performed using a BioRad S1000 Thermal Cycler (Bio-Rad Laboratories, Inc., Hercules, CA, USA) with Titanium Taq polymerase (Clontech Laboratories, Inc., Mountain View, CA, USA) or AccuPrime Pfx DNA Polymerase (Invitrogen, Life Technologies, Carlsbad, CA, USA) according to manufacturers’ instructions with primers listed in Table 1. PCR condition were as follows: 2 min initial denaturation at 95 °C, 30 s denaturation at 95 °C, 30 s annealing at 58 °C, 0.5–3 min extension at 68 °C (35 cycles), and final extension for 3–5 min. PCR products were analyzed by agarose gel (1–2% agarose; Seakem LE, Lonza, Switzerland) electrophoresis after staining with GelStar™ (Lonza, Basel, Switzerland).
| Primer | Sequence |
|---|---|
| FAD7_FP1 | AAGACATAAGCGTGCGAACC |
| FAD7_FP2 | TGTTGCTAGTAGACCAACCCA |
| FAD7_FP3 | TACCTGCATCACCATGGTCA |
| FAD7_FP4 | AATCTCACATCACACCATCACT |
| FAD7_RP1 | TCAAAGCAGATTACACAGTTGCA |
| FAD7_RP2 | TTACCTTGCCACGGTACCAA |
| FAD7_RP3 | CTAACTCTCTGGTGGGTGACA |
| FAD7_RP4 | CGCACCTGGATCGAATCTCT |
| pht4;1-3 _FP | CCACCTTTGGATCCTGCCTTTAT |
| pht4;1-3 _RP | ATCAACAAACCACTGATTCAACTACACTT |
| CSHL_ DS5-2 | CCGTTTTGTATATCCCGTTTCCGT |
The transposon in pht4;1-3 in crosses with fad7-1 or Ler were genotyped using gene specific primers pht4;1-3 _FP + pht4;1-3 _RP and transposon specific primers pht4;1-3 _FP+CSHL_ DS5-2 (Table 1).
Extraction and quantification of lipids
The galactolipid species composition was analyzed as previously described (Nilsson et al., 2014) and total lipids fatty acid methyl esters was analyzed by GC-MS after direct transmethylation of leaf material. Leaf pieces were placed in boiling 2-propanol and supplemented with a known amount of di-nonadecanoyl phosphatidylcholine as internal standard. The samples were dried under a stream of nitrogen and transmethylated in 0.5 M sodium methoxide in dry methanol. The fatty acid methyl esters were extracted into heptane and analyzed by GC-MS as described (Najm et al., 2017).
Results and Discussion
Since PHT4;1 has been suggested to regulate phosphate transport inside the chloroplast (Karlsson et al., 2015), and since phosphate starvation is known to trigger exchange of phospholipids for galactolipids (Andersson et al., 2003), we profiled membrane lipids in the two PHT4;1 mutant alleles pht4;1-2 and pht4;1-3, and compared them to the parent wild type Ler (Fig. 1). While there were no significant differences in the amount of the major membrane lipid classes, the pht4;1-3 line displayed an altered species composition of several membrane lipids. This was clear for both major thylakoid lipid classes MGDG and DGDG (Fig. 1A), which demonstrated a substantial reduction in the highly unsaturated species 34:6 and 36:6. The pht4;1-2 mutant line, on the other hand, did not differ from wild type Ler in its membrane lipid composition. Analysis of fatty acid methyl esters from a total lipid extract of the pht4:1-3 mutant confirmed a decrease in linolenic- (18:3) and hexadecatrienoic (16:3) acids concomitant with an increase in the less saturated linoleic- (18:2) and hexadecadienoic (16:2) acids (Fig. 1C, Table 2). In particular, 16:3 was almost completely absent from the mutant line. This phenotype is very similar to that reported for mutants of the FAD7 gene (Browse, McCourt & Somerville, 1986; Iba et al., 1993), leading us to suspect that a second site mutation affecting FAD7 might be present in the pht4;1-3 line.

Figure 1: The pht4;1-3 line has a deficiency in trienoic fatty acids.
Lipids were extracted from the indicated lines and subjected to LC-MS/MS and the species distribution of MGDG and DGDG is shown (A). Mean and standard deviation of four biological replicates are shown. Fatty acid methyl esters from wild type (Ler) (B) and pht4;1-3 (C) were analyzed by GC-MS and total ion chromatograms are shown.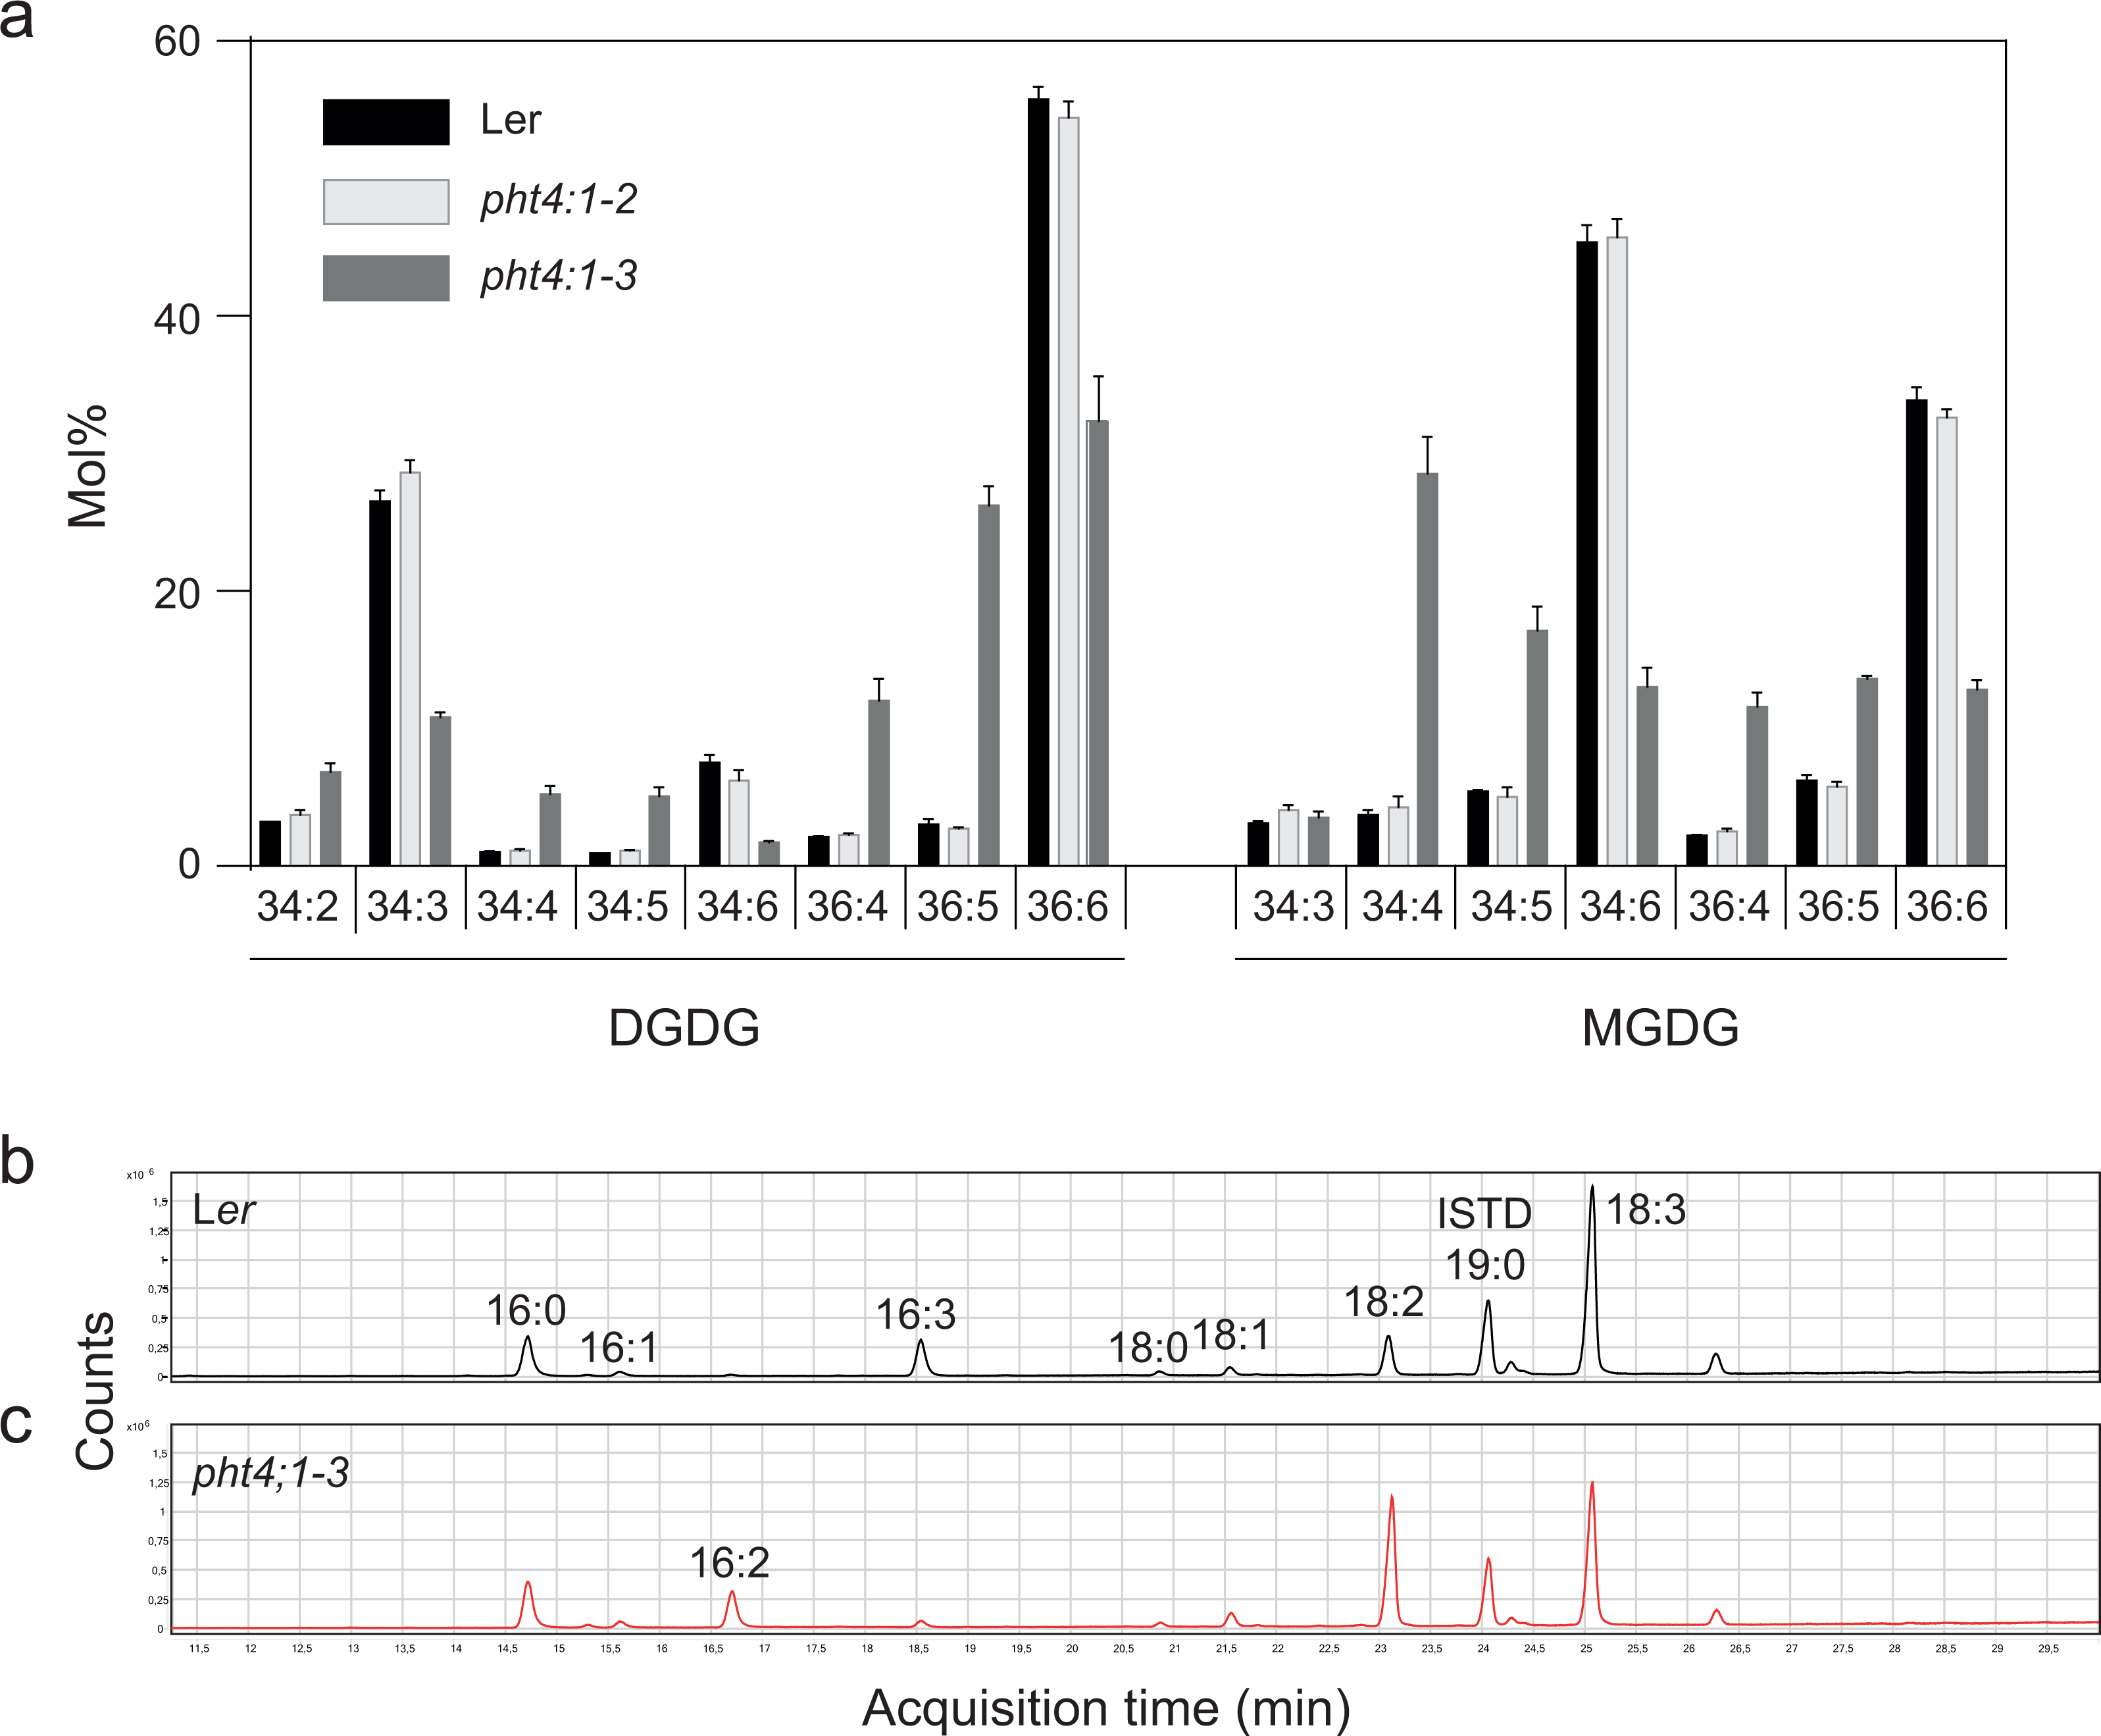
To investigate this, we performed PCR on genomic DNA obtained from pht4;1-3 and wild type Ler using primers spanning different regions of the FAD7 gene (Figs. 2A and 2B). A product containing the first exon and the 5′ UTR of FAD7 was found to be absent in reactions from the mutant line (Fig. 2B). Further PCR with extended elongation time revealed an approximately 2.5 kbp insertion to be present in pht4;1-3 in this region (Fig. 2C). Sequencing (sequence available in Data S1) of the insertion revealed it to contain an inactivated copy of the indole acetic acid hydrolase (IAAH) negative selection marker used to create the transposon line (Sundaresan et al., 1995). Further, the insertion was found to be located in the first exon of the FAD7 gene (Fig. 2A, Data S1).

Figure 2: The pht4;1-3 line contains an insertion in the FAD7 gene.
(A) Gene model of FAD7 and locations of primers used for PCR. (B) and (C) Agarose gel electrophoresis of PCR products from the indicated lines and primers. Expected fragment sizes are shown below lanes. An approximately 2.5 kbp insertion in FAD7 in the pht4;1-3 line is seen (C).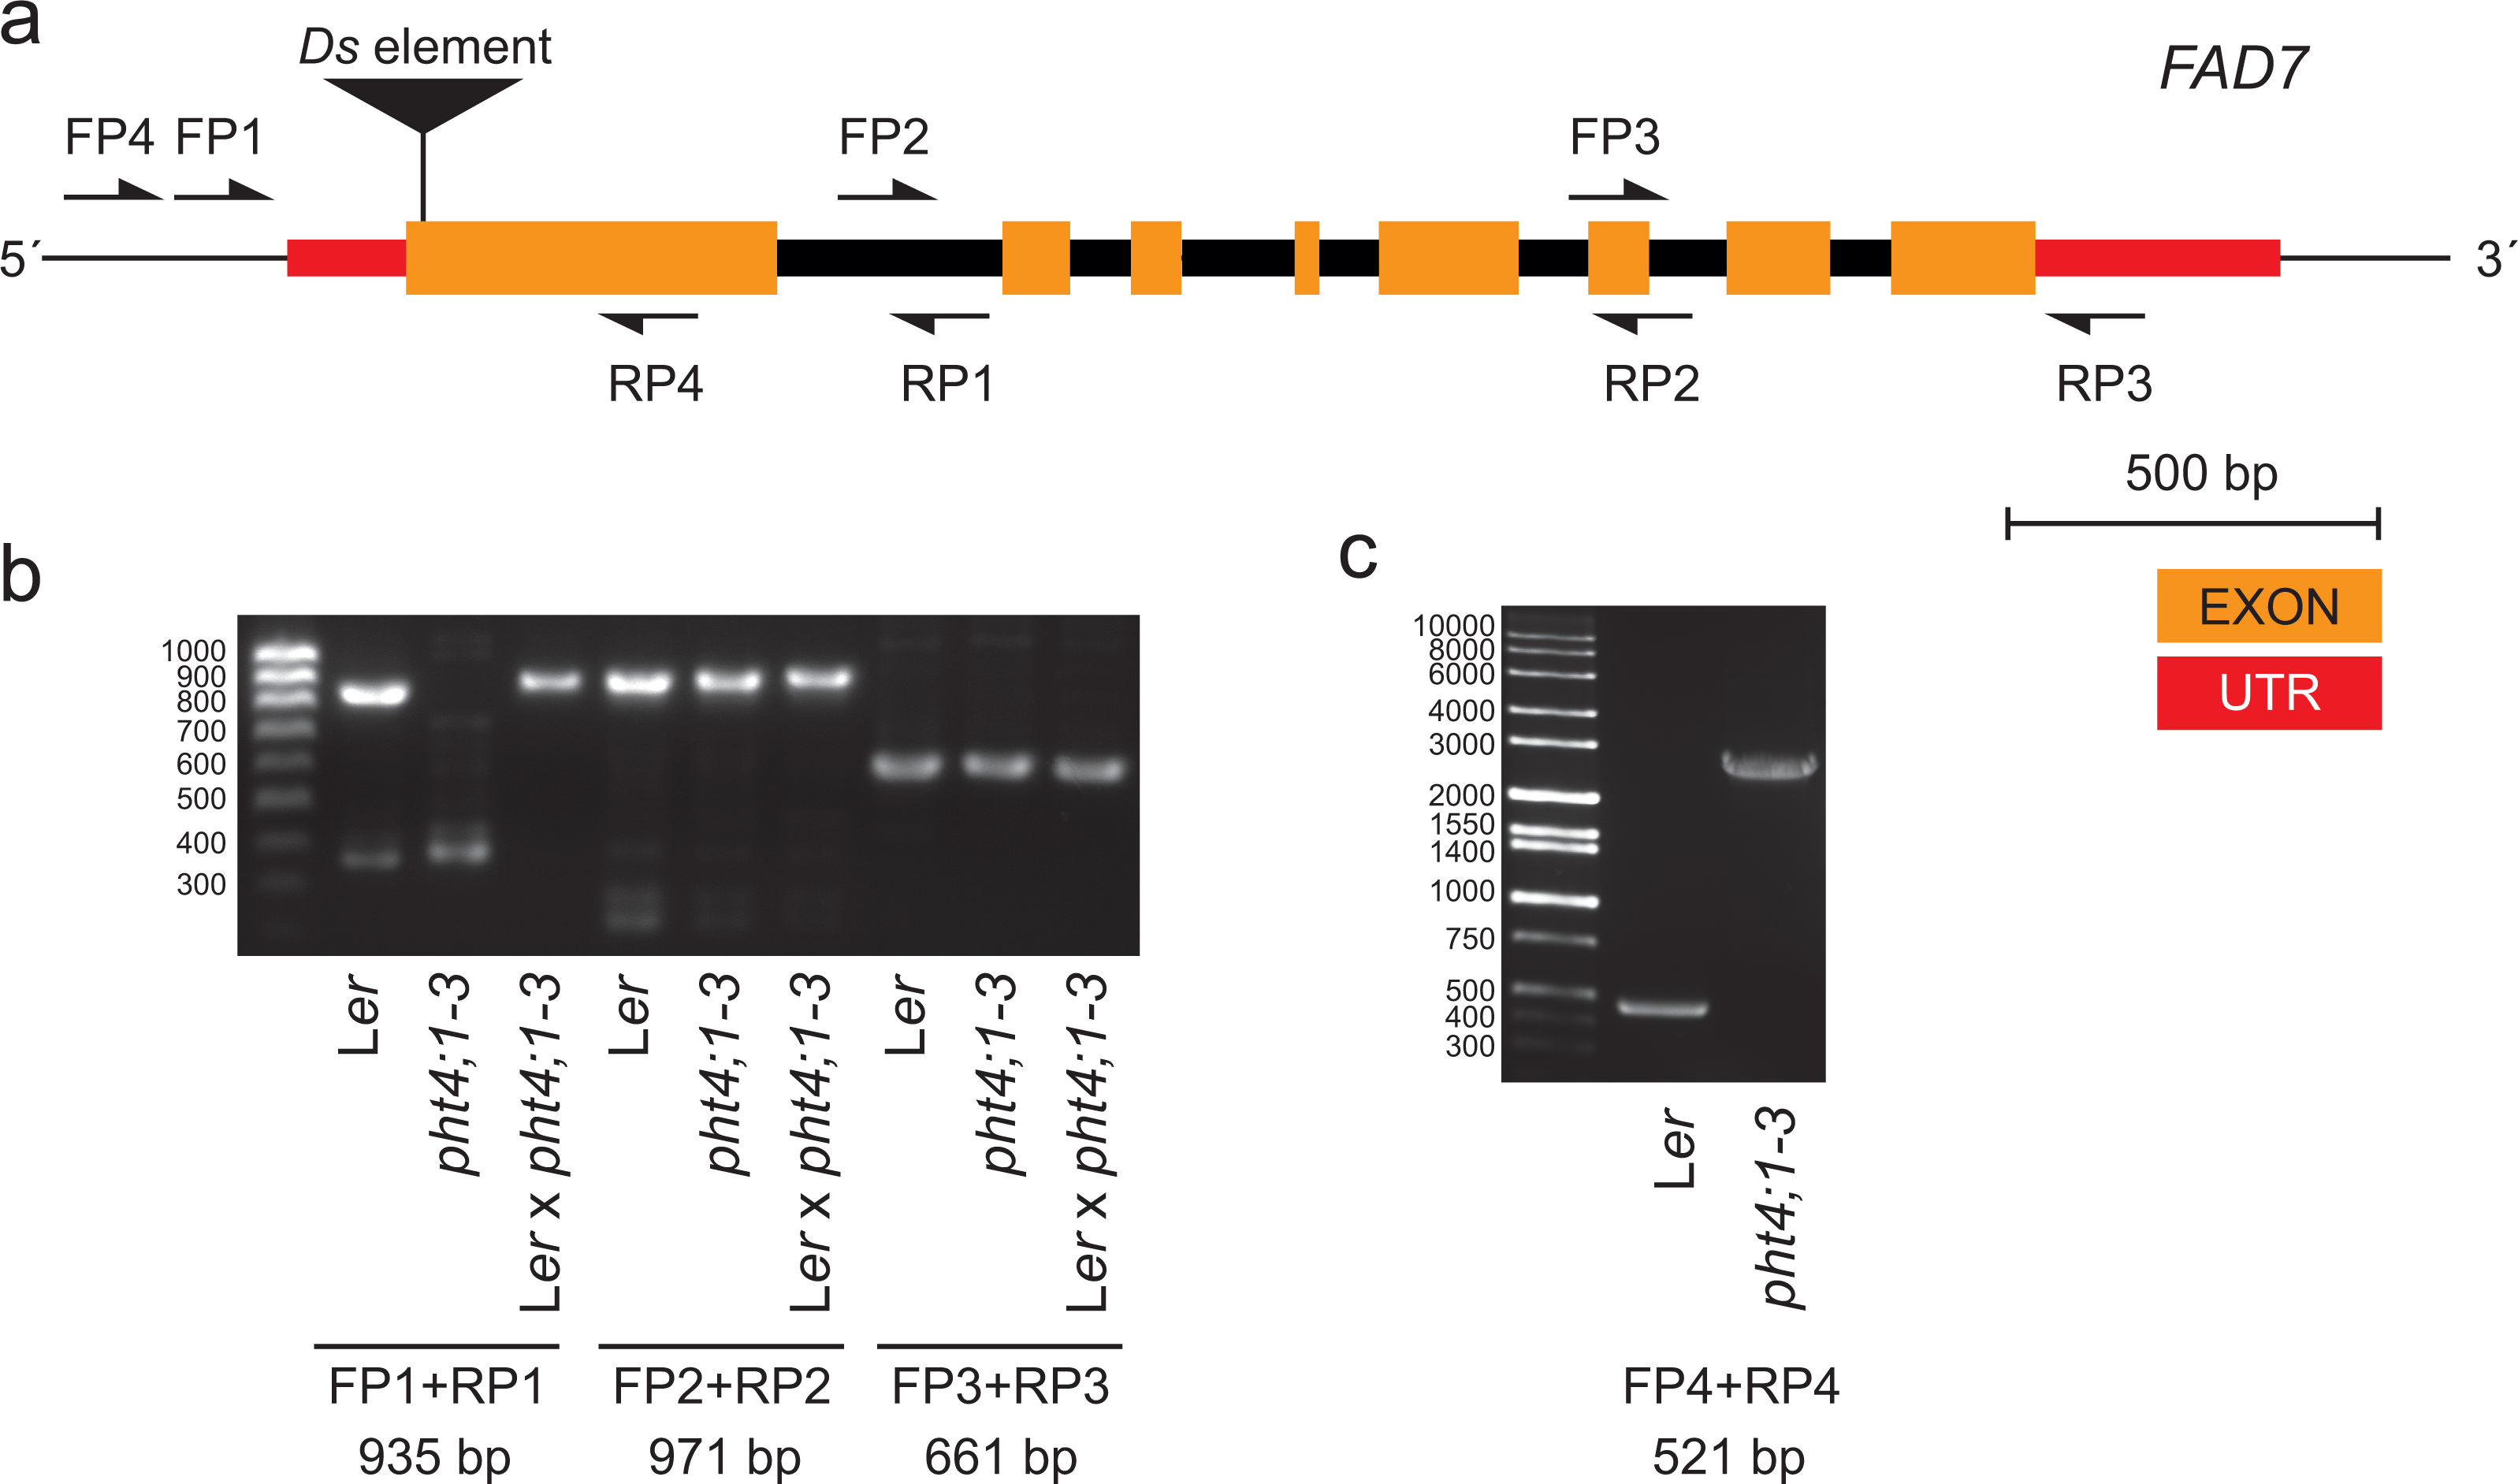
| Line | 16:0 | 16:1 | 16:2 | 16:3 | 18:0 | 18:1 | 18:2 | 18:3 | Replicates |
|---|---|---|---|---|---|---|---|---|---|
| Ler | 15 ± 0.9 | 1.5 ± 0.5 | 0.5 ± 0.1 | 12 ± 1.5 | 1.2 ± 0.4 | 3.1 ± 0.8 | 14 ± 2.0 | 57 ± 6.6 | 7 |
| pht4;1-2 | 15 ± 0.2 | 2.0 ± 0.1 | 0.4 ± 0.1 | 14 ± 0.2 | 0.9 ± 0.1 | 2.2 ± 0.1 | 11 ± 1.1 | 55 ± 1.2 | 2 |
| pht4;1-3 | 14 ± 0.9 | 1.5 ± 0.3 | 9.0 ± 1.8 | 2.0 ± 0.4 | 1.1 ± 0.3 | 4.3 ± 0.6 | 30 ± 1.6 | 38 ± 2.7 | 8 |
| fad7-1 | 12 ± 0.2 | 1.4 ± 0.1 | 8.5 ± 0.1 | 1.7 ± 0.1 | 0.8 ± 0.1 | 4.1 ± 0.1 | 33 ± 0.2 | 39 ± 0.1 | 2 |
| pht4;1-3, fad7-1, F1 | 12 ± 1.4 | 1.2 ± 0.1 | 8.4 ± 0.7 | 1.6 ± 0.1 | 1.2 ± 0.2 | 3.8 ± 0.3 | 32 ± 0.3 | 41 ± 2.2 | 2 |
| pht4;1-3, Ler, F1 | 16 ± 0.1 | 1.4 ± 0.1 | 1.2 ± 0.1 | 9.8 ± 0.1 | 1.6 ± 0.1 | 4.6 ± 0.4 | 17 ± 0.4 | 50 ± 0.9 | 2 |
| pht4;1-3, Ler, F2, fad7-1 | 12 ± 0.3 | 1.5 ± 0.1 | 8.7 ± 0.1 | 2.0 ± 0.1 | 0.7 ± 0.1 | 5.1 ± 0.3 | 30 ± 0.7 | 39 ± 0.8 | 3 |
| pht4;1-3, Ler, F2, FAD7 | 13 ± 0.2 | 1.6 ± 0.1 | 1.1 ± 0.8 | 10 ± 0.8 | 0.8 ± 0.1 | 3.2 ± 0.5 | 15 ± 2.1 | 56 ± 2.1 | 6 |
The Ds transposable element of the pht4;1-3 starter line DsG6 has previously been mapped to the FAD7 gene (Parinov et al., 1999). It thus appears that a part of the Ds element has remained in place in the pht4;1-3 line due to the inability to use the negative selection based on IAAH. Rearrangements of the Ds element after transposase activation and subsequent inability to select against progeny carrying the starter line cassette have previously been reported (Parinov et al., 1999).
To confirm that that the altered lipid profile of pht4;1-3 is indeed caused by the second insert in FAD7, a genetic test was conducted. The pht4;1-3 line was crossed to fad7-1 or wild type Ler and fatty acid profiles of the resulting F1 and parental lines were analyzed (Table 2). This clearly shows that the fatty acid desaturation defect in pht4;1-3 is recessive and that the F1 of pht4;1-3 and fad7-1 show an identical phenotype to their parents, supporting the notion of an inactivation of FAD7 in the pht4;1-3 line. Finally, pht4;1-3 was backcrossed to Ler and the resulting F2 plants were genotyped using PCR primers for the insertion in FAD7 and the previously described insertion in pht4;1-3. Selected F2 plants homozygous for the two different insertions were tested for acyl lipid fatty acid composition. This fully supported the inferred linkage between loss of trienoic fatty acids and the FAD7 insertion.
The pht4;1-3 mutant line has, as far as we could find, only been used in two publications (Karlsson et al., 2015; Wang et al., 2011). Careful scrutiny of these reports shows that in fact all but one experiments are based on the use of at least one additional allele of pht4;1. The one experiment only including the pht4;1-3 allele and wild type describes the spacing of thylakoids membranes in grana stacks (Karlsson et al., 2015). Since this is a phenotype that could at least partially be attributed to the physicochemical properties of the thylakoid lipids, it seems critical that this result is confirmed with a bona fide pht4;1 mutant.
Conclusions
To conclude, this study underlines the importance that every inferred phenotype-genotype relationship is confirmed by at least two independent genetic lines of evidence, i.e., through the use of several independent knock-out or silenced mutant lines, or by genetic complementation.
Supplemental Information
DNA sequence of insert located in FAD7 in the pht4;1- 3 mutant line
Letters marked in blue indicate IAAH stop codon and letters in yellow indicate FAD7 genomic sequence.
Genomic sequence of FAD7 from wild type Col-0 (TAIR12, http://www.arabidopsis.org). Start and stop codon are highlighted in blue. Capital letters indicate exon and lower case letters indicate introns. Yellow letters indicate sequence identified in the pht4;1-3 mutant (see sequence above).
Raw data for Fig. 1A and Table 1
Figure 1A. Galactolipid species composition in wt and pht. A total lipid extract from the indicated lines was analysed by LC-MS/MS and the composition of MGDG and DGDG was determined.
Table 1. Fatty acid composition of leaf tissue. Fatty acid methykl esters were obtained by direct alkaline transmethylation of leaf tissue and analyzed by GC-MS, fatty acids quantified as mol%