
Characterization of the acoustic community of vocal fishes in the Azores
- Published
- Accepted
- Received
- Academic Editor
- María Ángeles Esteban
- Subject Areas
- Animal Behavior, Aquaculture, Fisheries and Fish Science, Conservation Biology, Ecology, Marine Biology
- Keywords
- Passive acoustic monitoring, Azores, Seamounts, Fish sounds, Acoustic communication
- Copyright
- © 2019 Carriço et al.
- Licence
- This is an open access article distributed under the terms of the Creative Commons Attribution License, which permits unrestricted use, distribution, reproduction and adaptation in any medium and for any purpose provided that it is properly attributed. For attribution, the original author(s), title, publication source (PeerJ) and either DOI or URL of the article must be cited.
- Cite this article
- 2019. Characterization of the acoustic community of vocal fishes in the Azores. PeerJ 7:e7772 https://doi.org/10.7717/peerj.7772
Abstract
Sounds produced by teleost fishes are an important component of marine soundscapes, making passive acoustic monitoring (PAM) an effective way to map the presence of vocal fishes with a minimal impact on ecosystems. Based on a literature review, we list the known soniferous fish species occurring in Azorean waters and compile their sounds. We also describe new fish sounds recorded in Azores seamounts. From the literature, we identified 20 vocal fish species present in Azores. We analysed long-term acoustic recordings carried out since 2008 in Condor and Princesa Alice seamounts and describe 20 new putative fish sound sequences. Although we propose candidates as the source of some vocalizations, this study puts into evidence the myriad of fish sounds lacking species identification. In addition to identifying new sound sequences, we provide the first marine fish sound library for Azores. Our acoustic library will allow to monitor soniferous fish species for conservation and management purposes.
Introduction
Acoustic communication in fishes is widespread and occurs in different environmental and behavioural contexts (Zelick, Mann & Popper, 1999). More than 800 fish species are known to produce sounds (Fish & Mowbray, 1970; Rountree et al., 2006). These sounds are species-specific and are associated with courtship, spawning, parental care, feeding, aggressive or territorial behaviours, and can be effective indicators of fish species richness and diversity in biological processes (Fine, Winn & Olla, 1977; Amorim et al., 2008; Lobel, Kaatz & Rice, 2010). The majority of fish sounds are low frequency (<3 kHz, mostly <1 kHz) and are made up of repetitive elements such as sound pulses (Amorim, 2006). Sounds made by fish species differ in fundamental frequency, dominant frequency, number of pulses and frequently in pulse period (Amorim et al., 2008; Colleye et al., 2011; Ladich, 2013). Fish sounds also differ from those made by other marine organisms such as cetaceans. Fish sounds frequently have a short duration (<5 s), are made of broad-band pulses, and often present multiple frequency harmonics (Fish & Mowbray, 1970). Sounds produced by cetaceans range from low frequencies (<1 kHz) up to 200 kHz, frequently have a long duration (>10 s), and often exhibit strong frequency modulation (Richardson et al., 1995). For example, Odontocetes produce a wide variety of whistles and broadband sounds (clicks) with main energies ranging from a few kHz (thus well detectable by humans) to ultrasonic frequencies of >100 kHz for echolocating prey and screening the environment. Baleen whales produce high intensity, lower frequency sounds (mostly <1 kHz, but can reach 24 kHz) lasting less than 1 s to over 30 s, spanning from simple growls to loud complex modulated songs (Mellinger et al., 2007; Au & Hastings, 2008). Fish sounds also differ from invertebrate sounds; the latter are typically broadband pulses with frequencies between 2 and 12 kHz (Au, 1998; Radford et al., 2008; Bittencourt et al., 2016), although some invertebrates may also produce much lower frequency sounds (e.g., Staaterman et al., 2011; Di Iorio et al., 2012). These differences allow discrimination of fish sounds in marine soundscape studies and offer a non-invasive way (through acoustic monitoring) to assess biodiversity of acoustic communities (Farina & James, 2016). Here, we consider the definition of acoustic community proposed by Farina & James (2016), i.e., a temporary aggregation of species that interact acoustically either in aquatic or terrestrial environments, producing sounds with internal or extra-body tools.
Owing in part to cost reduction and to technological improvements, Passive Acoustic Monitoring (PAM) of fish sounds has been increasingly used (e.g., Wall, Lembke & Mann, 2012; Tricas & Boyle, 2014; Rice et al., 2016). Besides having a negligible impact on biota, PAM supports long-term field studies of seasonal activities, and has been shown to be a useful tool in the conservation and management of vocal species (Mann & Lobel, 1995; Luczkovich, Mann & Rountree, 2008; Parmentier et al., 2018). In addition, monitoring the diversity of sounds made by marine organisms, including fish, can help assess ecosystem health (Bertucci et al., 2016). But PAM also presents limitations in its effectiveness. PAM will only record animal sounds when their sound pressure levels (or particle motion levels) are higher than the ambient noise levels, which means that taxa that produce low amplitude vocalizations (e.g., gobies; Lugli & Fine, 2003) will not be detected. Most importantly, there is a paucity of data on the sounds made by fish in their natural habitat and numerous fish sounds have not yet been identified (Tricas & Boyle, 2014; Ruppé et al., 2015; Mouy et al., 2018).
| Speciesa | Familya | Conservation statusb | Commercial statusc | Depth range (m)b,c |
|---|---|---|---|---|
| Balistes capriscus (Grey triggerfish)3 | Balistidae | VU | Commercial; gamefish; public aquariums | 0–100 (0-55) |
| Caranx crysos (Blue runner)3 | Carangidae | LC | Minor commercial; gamefish | 0–100 |
| Elagatis bipinnulata (Rainbow runner)3 | Carangidae | LC | Highly commercial; gamefish | 0–150 (2–10) |
| Naucrates ductor (Pilotfish)9 | Carangidae | LC | Minor commercial, gamefish, public aquariums | 0–300 |
| Seriola dumerili (Greater amberjack)3 | Carangidae | LC | Minor commercial; aquaculture; gamefish; public aquariums | 1–360 (18-72) |
| Trachinotus ovatus (Pompano)3 | Carangidae | LC | Minor commercial; aquaculture; gamefish | 50–200 |
| Dactylopterus volitans (Flying gurnard)3 | Dactylopteridae | LC | Minor commercial; gamefish; aquarium | 1–100 |
| Diodon hystrix (Porcupine fish)3 | Diodontidae | LC | Minor commercial; aquarium | 2–50 (3-20) |
| Gobius paganellus (Rock goby)5 | Gobiidae | LC | Minor commercial; aquarium | 0–15 |
| Pomatoschistus pictus (Painted goby)6 | Gobiidae | LC | No interest | 1–55 (1-50) |
| Kyphosus sectatrix (Bermuda sea chub)3 | Kyphosidae | LC | Minor commercial; gamefish; public aquariums | 1–30 (1-10) |
| Mola mola (Sunfish)3 | Molidae | VU | Minor commercial | 30–480 (30-70) |
| Abudefduf luridus (Canary damsel)1 | Pomacentridae | LC | Minor commercial | 0–25 |
| Pomatomus saltatrix (Blue fish)3 | Pomatomidae | VU | Highly commercial; aquaculture; gamefish; bait | 0–200 |
| Scorpaena plumieri (Spotted scorpionfish)3 | Scorpaenidae | LC | Minor commercial; aquarium | 1–60 (5-55) |
| Epinephelus marginatus (Dusky grouper)4 | Serranidae | EN | Highly commercial; gamefish | 8–300 (8-50) |
| Canthigaster rostrata (Sharpnose puffer)3 | Tetraodontidae | LC | Aquarium | 0–40 |
| Chelidonichthys cuculus (Red gurnard)2 | Triglidae | LC | Minor commercial | 15–400 (30-250) |
| Chelidonichthys lastoviza ( Streaked gurnard)7 | Triglidae | LC | Commercial | 10–150 (10-40) |
| Zeus faber (John dory)8 | Zeidae | DD | Commercial; gamefish; aquarium | 5–400 (50-150) |
Notes:
Sound production source:
Conservation status from IUCN: LC, Least Concern; VU, Vulnerable; NT, Near Threatened; EN, Endangered; DD, Data deficient; Depth range with most frequent depths presented in brackets. Commercial status: indication of the degree of commercial interest referring to fisheries followed by other types of commercialization. All species are found frequently in Azorean waters.
Seamounts and nearshore bank areas of the Azores are important hotspots of marine biodiversity, harboring fish species of commercial and conservation interest (Pitcher et al., 2007), several of which are known to vocalize (e.g., dusky grouper Epinephelus marginatus, ocean sunfish Mola mola, tarpon Megalops atlanticus, (Fish & Mowbray, 1970; Bertucci et al., 2015). Despite its large fish biodiversity (about 460 marine fish species were recognized in the Azores, (Santos, Porteiro & Barreiros, 1997), only 20 species present in waters of this archipelago have been reported as soniferous (Table 1) suggesting that more remain to be identified. Because seamounts are subjected to increasing anthropogenic pressure, caused by overfishing and marine pollution (e.g., plastic and noise pollution), it is paramount to develop effective tools, such as PAM, to monitor ecosystems in support of conservation and management. With this objective in mind we (1) listed the known vocal fish species occurring in Azorean waters and compiled their sounds; (2) characterized new sound types and proposed their association to known fish sounds; and (3) built a fish sound database to be used as a steppingstone both for future research and for conservation and management.
Materials & Methods
Study sites
The Azorean archipelago is a group of nine volcanic islands located in the North Atlantic Ocean about 1,600 km off the Portuguese continental coast, comprising several seamounts (Fig. 1). The Condor seamount, located about 17 km southwest of Faial Island, is about 1,800 m in height, 39 km long and 23 km wide, extending from a depth of 185 m to 2,003 m. In 2008, Condor was designated as a Scientific Observatory, a protected area for scientific research, through an agreement among local authorities, researchers, fishermen and other stakeholders (Giacomello, Menezes & Bergstad, 2013). Since 2010, demersal fisheries are forbidden, and only the seasonal pole-and-line tuna fishing, big game fishing, eco-touristic (e.g., shark diving) and scientific activities are permitted under a special authorization (Giacomello, Menezes & Bergstad, 2013; Ressurreição & Giacomello, 2013).
Princesa Alice bank is located about 90 km southwest of Pico Island and 80 km southwest of Faial Island (see Fig. 1). The Bank occupies more than 100 km2, has a minimum depth of 35 m and maximum depth of 500 m. It is an important fishing area for demersal and pelagic fishes and a popular recreational diving spot.
Vocal species
A bibliographic research was conducted to identify fish species recorded in the Azores that are either known to be vocal, or that belong to genera and families containing vocal species (Santos, Porteiro & Barreiros, 1997). Several databases and online open access libraries of animal sounds were consulted (e.g., Macaulay Library (2017), DOSITS (2017), The British Library (2017), Fish Base (2017), Chorus Acoustics (2017), see Table S1), to compile a sound database for this region. Sounds were also requested from the authors. However, it should be noted that sounds obtained from different sources may differ in their acoustic parameters due to geographical variations in fish sounds (e.g., Parmentier et al., 2005) and because they may have been recorded in different circumstances such as under different water temperatures; this variability should be considered when comparing sounds recorded in different locations or when building sound databases.
Acoustic recordings and analysis
Ecological Acoustic Recorders (EARs, Lammers et al., 2008) were bottom-moored on the Condor seamount at an approximate depth of 190 m, 5–10 m from the seafloor, and at a depth of 36 m in Princesa Alice bank, on the seafloor. The EAR is an autonomous acoustic recorder provided with a Sensor Technology SQ26-01 hydrophone that has a flat frequency response (±1.5 dB) from 18 Hz to 28 kHz and a response sensitivity between −193 and −194 dB re 1 V/µPa. (varying between deployments) at Condor and −193.6 dB at Princesa Alice.
From the available deployments, 10 at Condor and 4 at Princesa Alice, we selected recordings from three in Condor (deployments 2, 7 and 10) and from one in Princesa Alice (deployment 3), based on duration and recording quality. The EARs were programmed to record on duty cycles: Condor deployment 2 and 7, 90 s of sound recorded every 900 s at a sampling rate of 50 kHz; deployment 10, 3,600 s every 12,600 s, at 2 kHz; Princesa Alice deployment 3, 90 s every 900 s, at 50 kHz.
Recordings from the following months were analysed. Condor: April, June, August and November 2010; June and August 2012. Princesa Alice: June 2010. From these recordings the Acoustic Complexity Index (ACI) was calculated using the plug-in SounsdscapeMeter in the WaveSurfer software (Pieretti, Farina & Morri, 2011). ACI presents higher values in sounds with inner variability over time (as sounds of biological origin) and low values for more constant sounds (e.g., passing vessels) (Pieretti et al., 2017). Within each month, a subsample of 5 days (24 h periods) was selected from those presenting higher ACI values, expected to be associated with a higher biophony (Pieretti, Farina & Morri, 2011; Bolgan et al., 2018).
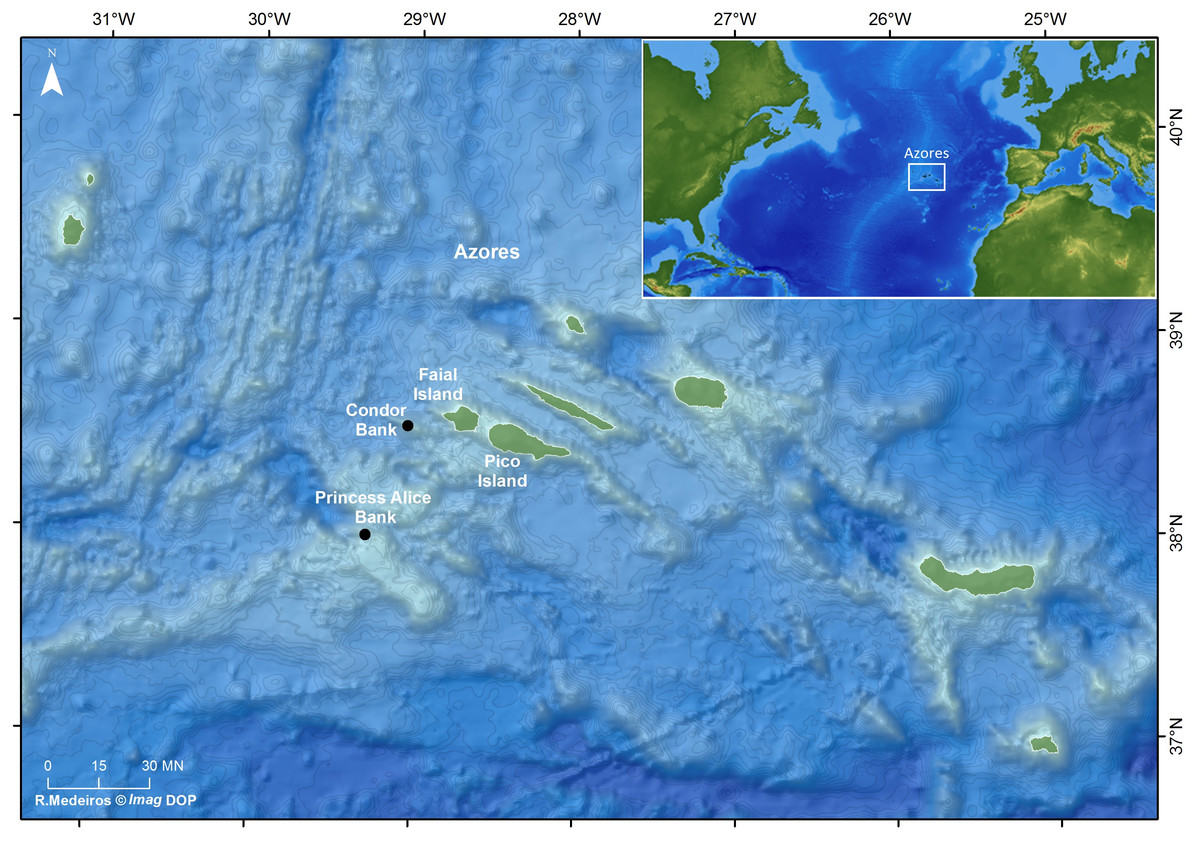
Figure 1: Location of the study sites: Ecological Acoustic Recorders (EARs) deployment locations in the Azores archipelago (black dots) (Ricardo Medeiros @Imag DOP).
Sound recordings were downsampled to 8 kHz and analyzed with Adobe Audition 3.0, both aurally and visually with spectrograms (FFT 2048 points, Hamming window, frequency range up to 4 kHz, fixed display settings). To inspect low amplitude sounds, a 25 dB amplification was used. Fish sounds were discriminated based on their similarity to reported fish calls, in frequency, relative energy level, duration, and timing (e.g., Parsons et al., 2016a; Parsons et al., 2016b). Because most sounds occurred in sequences and since in many sounds we could not analyse its fine structure due to the likely distance of the sound emitter to the hydrophone, we focussed on identifying sound sequence types rather than sound types. The following parameters were measured for seven types of sound sequences that had at least 14 occurrences, and were identified as fish calls: sequence duration (time elapsed from the start of the first sound in a sequence to the end of the last sound, s); number of sounds; sound duration (the mean duration of a sound in a sequence, s); sound period (mean time elapsed between the peak amplitude of two consecutive sounds within a group, s); peak frequency (frequency at which the sound presents its highest energy in the power spectrum, Hz); minimum and maximum frequency (the lower and the higher frequency of each sound in the spectrogram, Hz) and signal to noise ratio—SNR (ratio between the sound Root Mean Square (RMS) amplitude and the background noise RMS amplitude). Each sound sequence (Fig. 2) was defined based on frequency, duration and temporal patterns. Raven Pro Sound Analysis Software 1.5 (Cornell Lab of Ornithology, USA) was used to measure the temporal acoustic parameters. WaveSurfer was used to draw spectrograms and oscillograms. Fourteen to 20 sound sequence per sound sequence type with SNR > 1.03 were selected and characterized. In addition, 1 sound per soniferous species present in Azores was also characterised and used for comparison with sound sequences. Of the 20 known soniferous species (Table 1) only 9 species were included in this analysis (see Figs. 3 and 4) due to the lack of available sounds. Pomatoschistus pictus was not considered since it inhabits shallow waters and its sounds can only be recorded when a fish is very close (a few centimetres) to the hydrophone, thus being unlikely detected by the EARs. Note that caution should be taken when doing this comparison as we only considered one sound per identified vocal species and the analysis is thus not considering intraspecific variability.
We used the software PRIMER 6.0 to explore multivariate similarity profiles among the seven sound sequences and sounds from identified species using a Bray–Curtis Similarity matrix, followed by a Cluster plot and a non-metric multidimensional scaling approach (nMDS) with a 2D Stress of 0.13. The nMDS and the cluster plot were derived from the similarity matrix to evaluate similarities among sound sequences and sounds from known species and to investigate the acoustic parameters that contribute to those similarities (Clarke & Gorley, 2006; Sun et al., 2013). We used a similarity profile test (SIMPROF; Clarke & Warwick, 2001; Clarke, Somerfield & Gorley, 2008) to determine significant differences between the clusters.
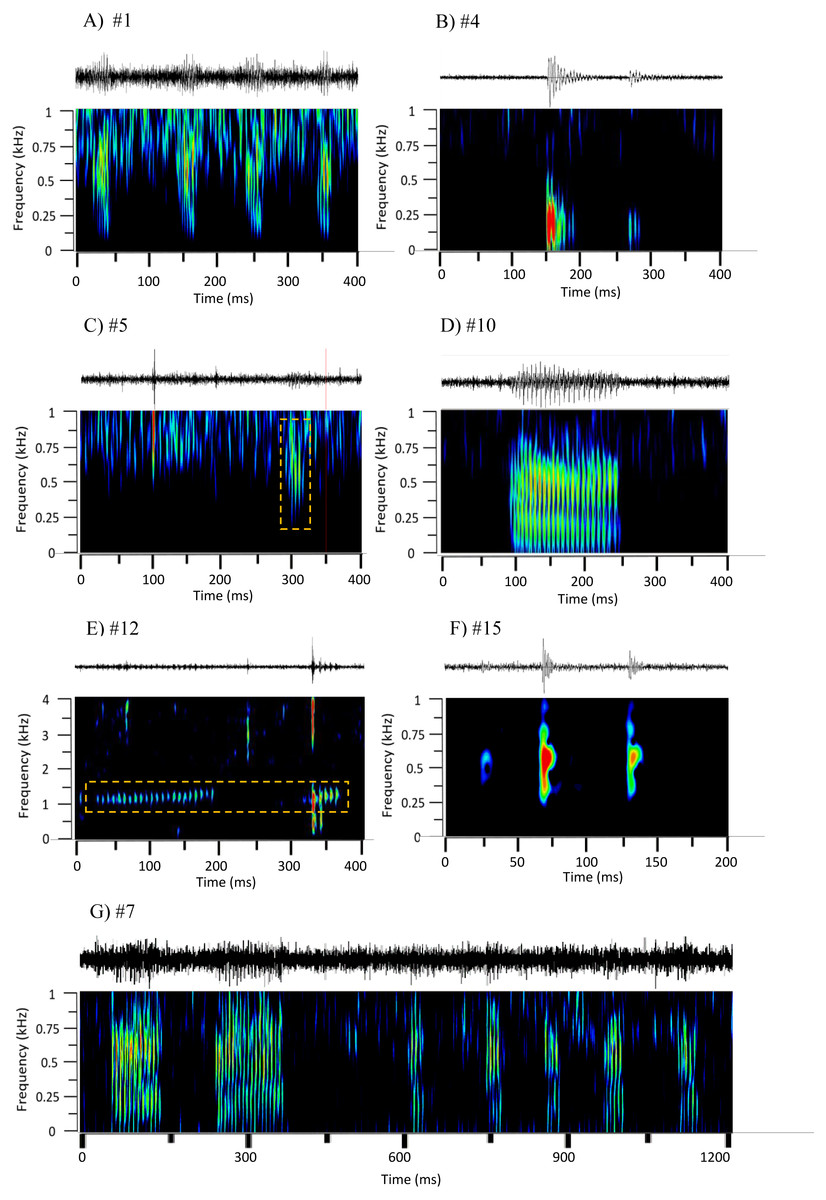
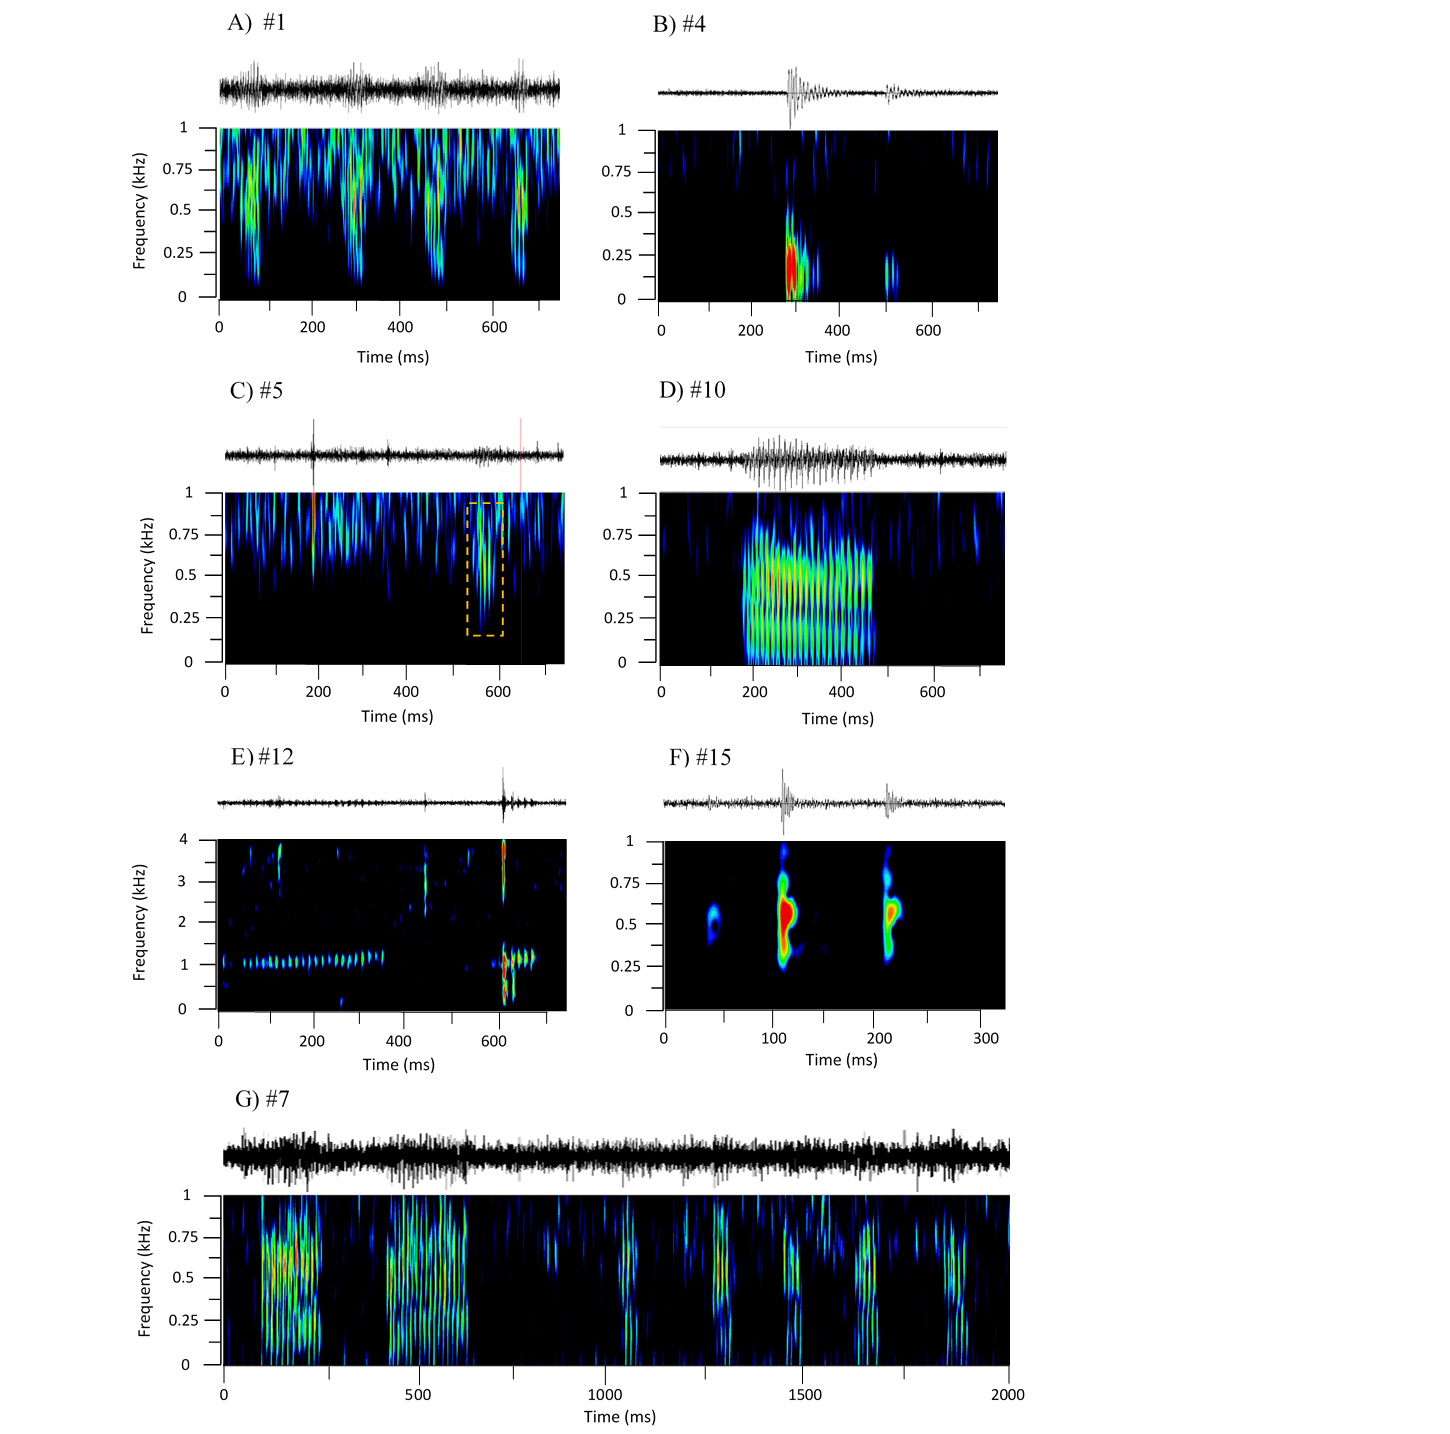
Figure 2: Oscillograms and spectrograms of the seven frequently occurring sound sequences, that were identified as fish calls.
Each sound sequence was identified through a # plus number. (A) #1; (B) #4; (C) #5; (D) #10; (E) #12; (F) #15 and (G) #7. Warmer colours indicate higher sound energy. The yellow rectangle helps to highlight the sound in the spectrogram.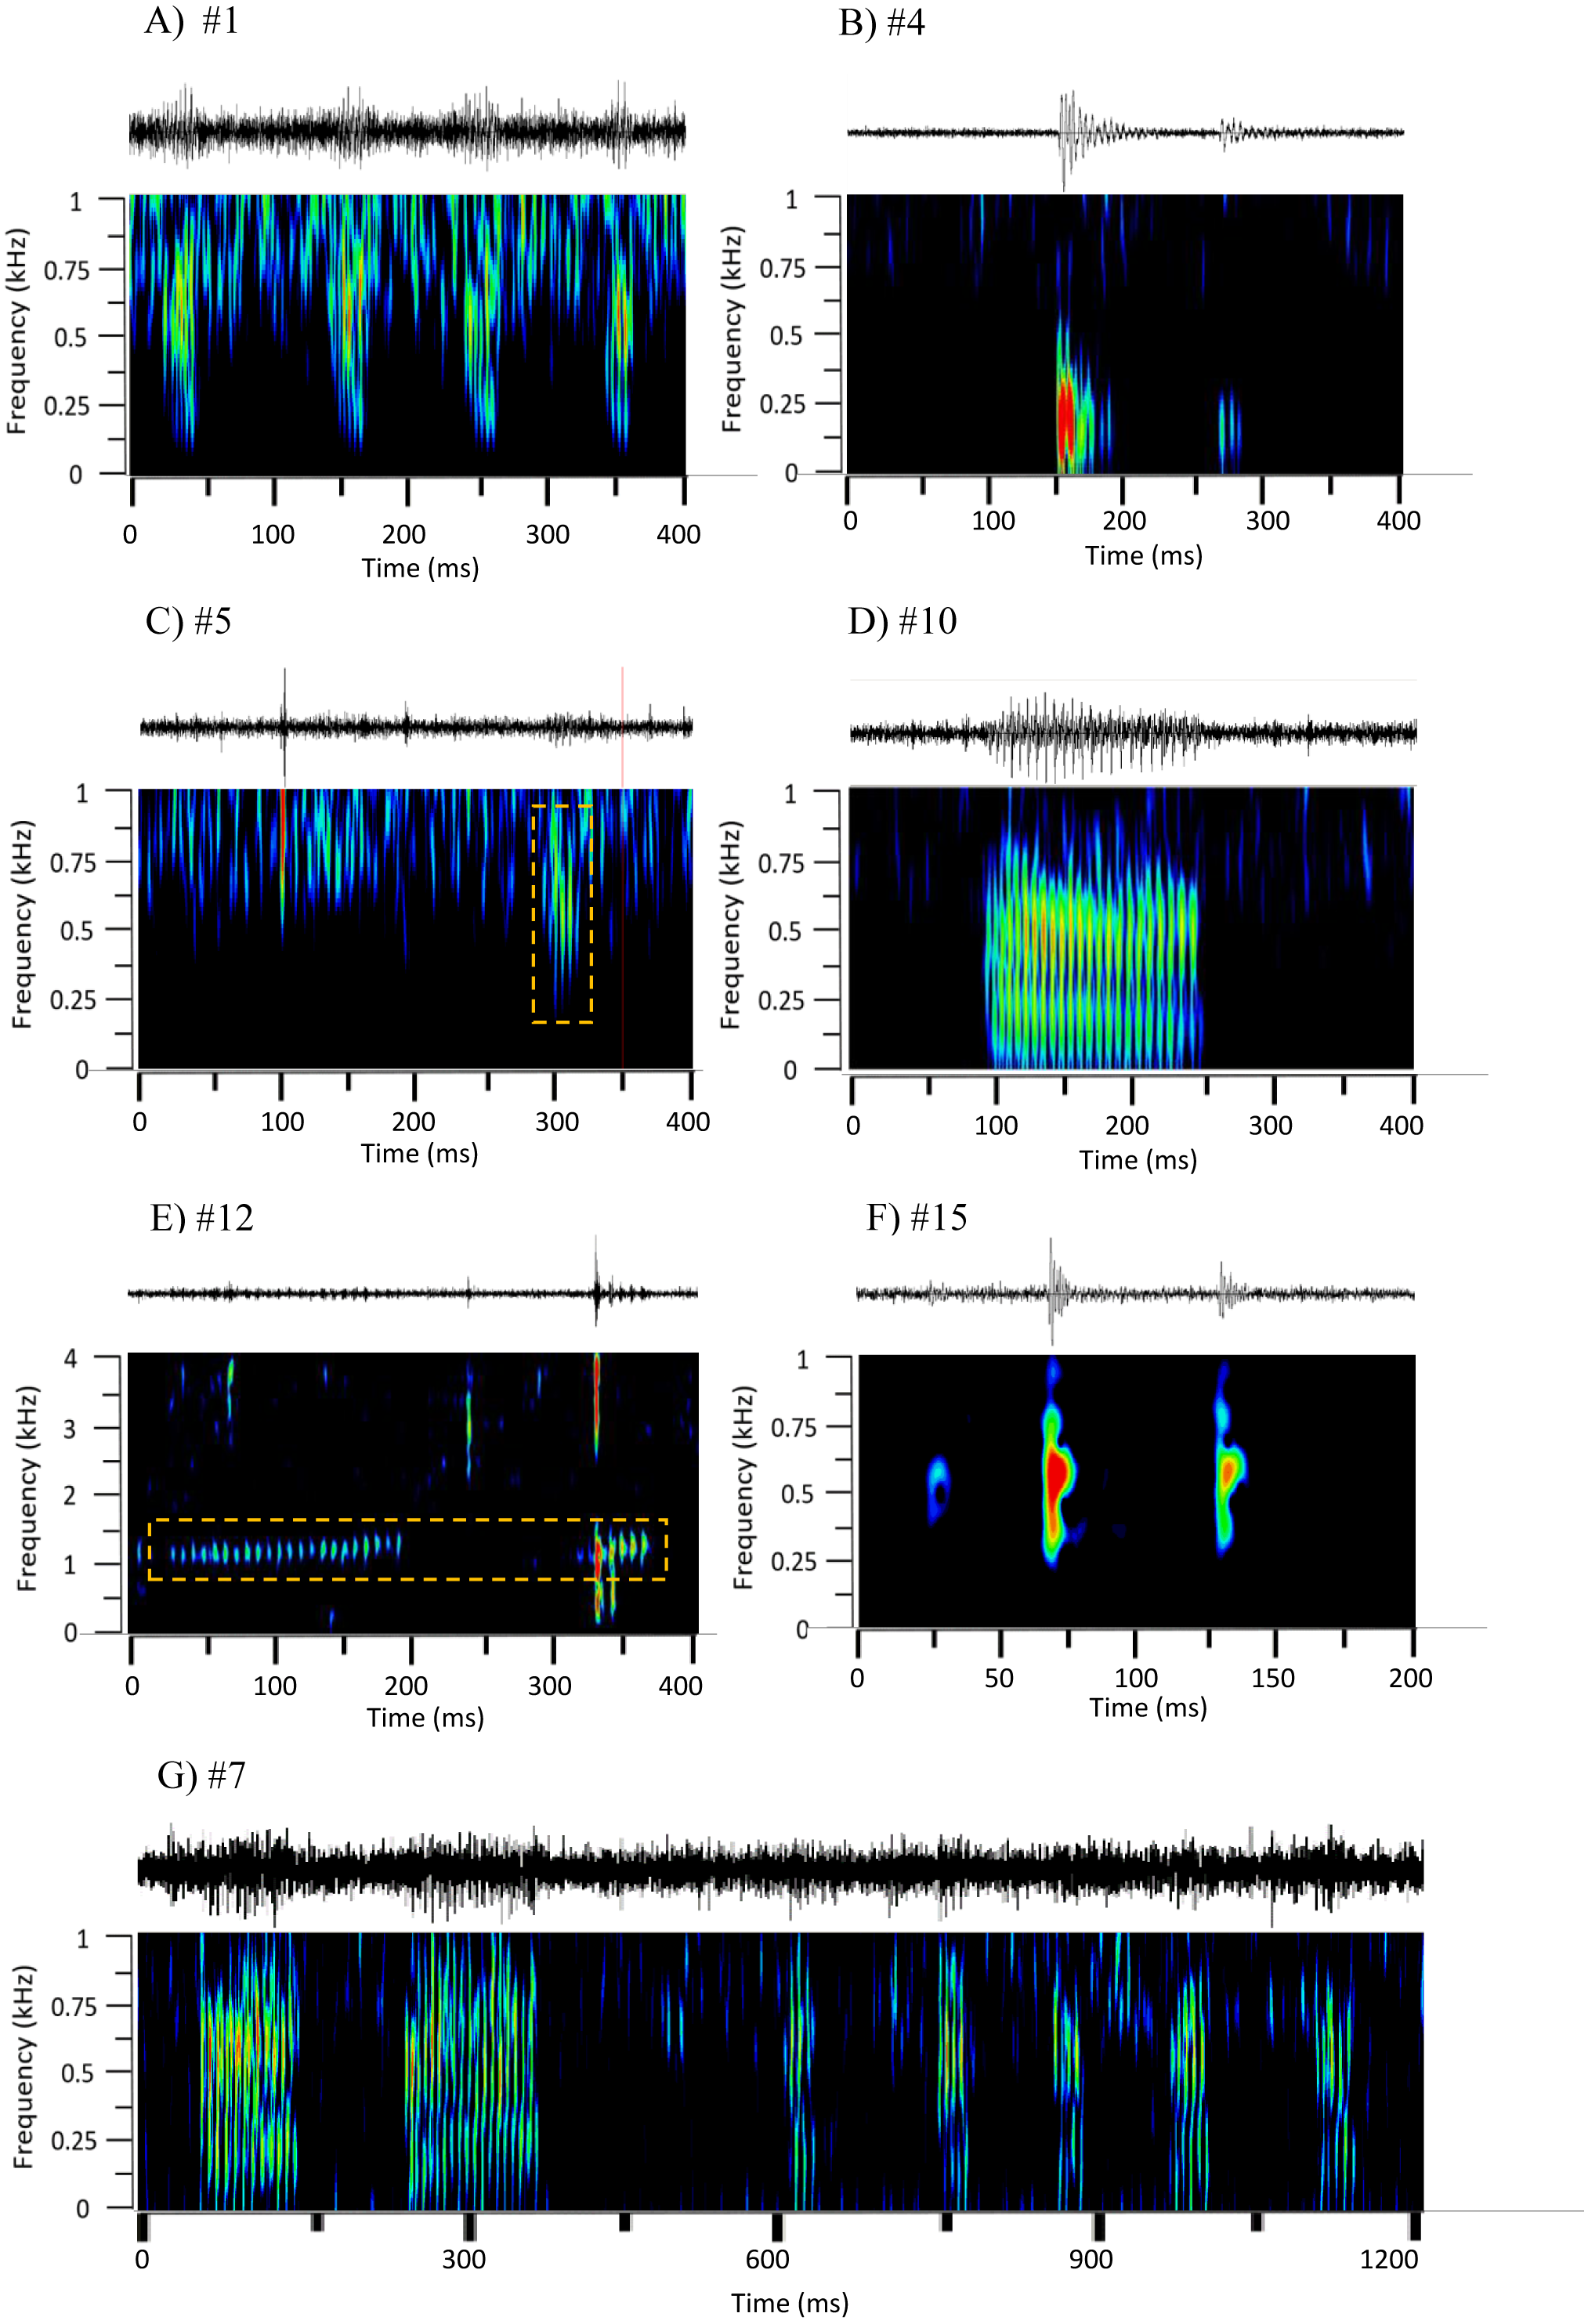
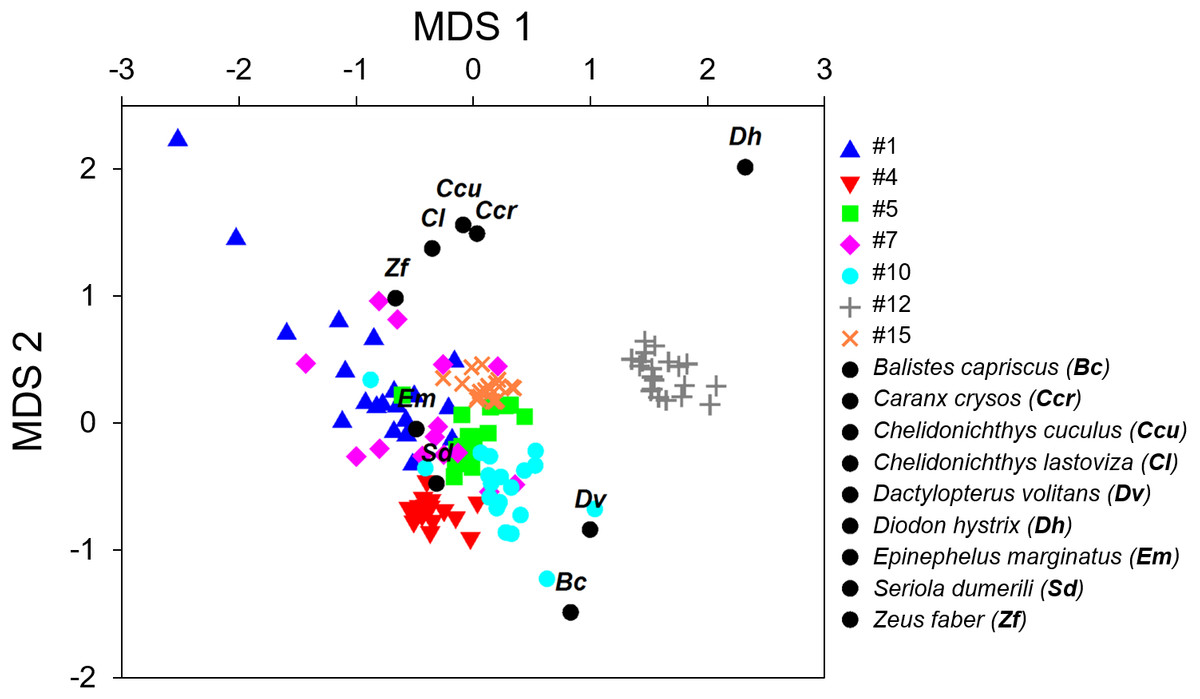
Figure 3: Non-metric multi-dimensional scaling plot (nMDS) of the fish calls exploring the resemblance between the seven recorded sound sequences (Table 4) and the sounds produced by 9 soniferous species that could occur in the surveyed ecosystems.
The variables used in these multivariate analyses were peak frequency, maximum frequency, minimum frequency, sequence duration, sound duration and number of sounds. Variables were standardized prior to analyses. For this effect the mean was subtracted from each data point and divided by the standard deviation. Two units were further added to eliminate negative values that were not accepted by the analysis.
Since the relation between fish sound abundance and diversity has not been validated for the present study sites, we compared mean ACI values (for the frequencies 15–2,000 Hz) between two months with contrasting fish sound abundance and diversity (August 2009 and June 2010 for Condor).
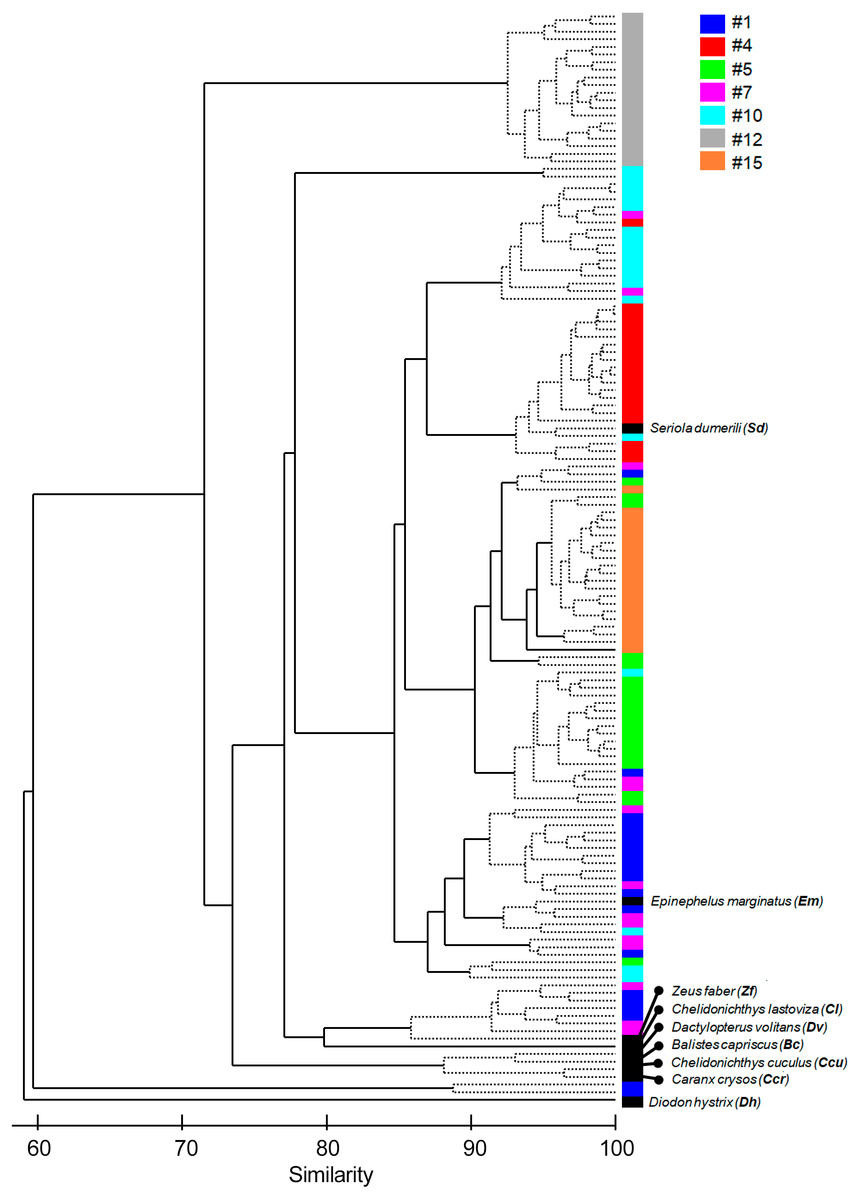
Figure 4: Cluster of the seven most common sound sequences (#1, #4, #5, #7, #10, #12, #15) and sounds from nine identified soniferous species that may occur in the surveyed ecosystems.
The Cluster plot shows the degree of similarity between the several sound sequences and the sounds from identified species.
Results
Soniferous fish species present in Azores
We identified 20 soniferous species from the fish occurring in the Azores (Table 1). Other species belonging to the same genera (n = 27) or families (n = 52) of known vocal species are listed in Table 2. These latter 79 species are potentially sound producers but future studies are needed for confirmation.
The sound sequences produced by the vocal fishes listed in Table 1 are indicated in Table 3 together with the associated behavioural contexts. Examples of these sounds are presented as waveforms and spectrograms in the Supplemental Information (Fig. S1). Available sound files (n = 12) are presented in Audio S1 to Audio S12.
Characterization of fish sounds from Condor and Princesa Alice
In the recordings from Condor seamount and Princesa Alice bank, 20 sound sequences were identified as being likely produced by fishes (Fig. 2, Fig. S2). Seven of these sound sequences (n ≥ 14 occurrences) were characterized quantitatively (Table 4) while the remaining 13 (n <14) were only characterized qualitatively (Table 5, see Supplemental Information for sound files in Audio S13 to Audio S32 and Video S1).
The main characteristics of the different sound sequences detected at Condor seamount and Princesa Alice bank are presented in Tables 4 and 5. Most sounds, were broadband frequency pulse trains with variable spectral range / peak frequency and pulse rates, often produced in sequences. In all of these sounds the pulsed structure could be distinguished by the human ear. From these, sounds #7, #22, #38, #48 stood out. Sound #7 was a sequence of pulse trains with the first elements being more tonal (resembling sound #10); sound #22 had a high spectral range up to 2 kHz; sound #38 presented higher frequency components (1,000–1,400 Hz) and very fast pulse trains with marked amplitude modulation; and #48 showed low frequency components. From the remaining sound sequences, i.e., non-broadband pulse trains, #4, #14, #15 were composed of isolated pulses often in doublets, #10 was more tonal and #12 presented high frequencies and a smaller frequency range.
The multivariate exploratory analyses (Figs. 3 and 4) discriminated sound sequences #4, #5, #10, #12 and #15. These analyses were unable to discriminate between sounds #1, #7 and #10 (Fig. 3). In fact, sound #7 starts with elements that resemble #10 followed by a sequence of sounds that resemble #1. Consistently, the SIMPROF analysis did not reveal significant differences among sound sequences #1, #7 and #10 and showed statistically significant differences among sounds #4, #5, #12 and #15, also supporting our ad-hoc groups of sound sequences that included sounds #1, #5, #7 as broadband pulse trains, #10 as a more tonal sound, #12 as a high frequency sound, and #4 and #15 as isolated pulses.
Comparisons between fish sounds identified in the libraries and the analysed fish sound sequences (Figs. 3 and 4) revealed similarities between the sound emissions of Dactylopterus volitans with sound #10, Seriola dumerilli with sound #4, as well as of Epinephelus marginatus with sounds #1, #5 and #7. However, a more careful inspection of the sounds, made both aurally and by visually analysing the spectrograms and oscillograms, do not support a match with any of the soniferous species available in the inspected databases.
The variation in abundance and diversity of sound sequences detected in each of the 5 sampled days in August 2009 and June 2010 in Condor (2 months with contrasting abundance and diversity) did not match the variation in the mean ACI values for the same days (Fig. 5). Inspection of the recordings suggests that ACI values presented higher values when cetacean sounds or boat noise were present within the considered frequency band (15–2,000 Hz). Cetacean sounds and boat noise were discriminated based on aurally and visually analyses of the spectrograms and oscillograms and assessing the respective sound parameters.
Discussion
Many fish species produce species-specific sounds (Amorim, 2006; Fine & Parmentier, 2015) that can be detected (Vieira et al., 2015) and discriminated (Lillis, Eggleston & Bohnenstiehl, 2014) from other sound sources present in aquatic soundscapes. In this study several fish species present in the Azorean archipelago were identified as sound producers (20 species from 14 families) or potential sound producers (79 species from 24 families) based on the literature. Consistently, we found a considerable diversity of putative fish sounds during the analysis of acoustic recordings from Princesa Alice and Condor, contributing for the marine soundscape of the surveyed Azorean ecosystems. We described 20 sound sequences. From these, seven were sufficiently abundant to be characterized for several acoustic parameters.
| Speciesa | Familya | Conservation statusb | Commercialc | Depth range (m)b,c | Similarityd |
|---|---|---|---|---|---|
| Anguilla anguilla (Eel) | Anguillidae | CR | Commercial; aquaculture; gamefish | 0–700 | G, F(2,9) |
| Canthidermis maculatus (Rough triggerfish) | Balistidae | LC | Commercial | 1–110 | F(2,9,10) |
| Blennius ocellaris (Butterfly blenny) | Blenniidae | LC | Minor commercial | 10–100 | F(8,16) |
| Coryphoblennius galerita (Montagu’s blenny) | Blenniidae | LC | No interest | 0–2 | F(8,16) |
| Lipophrys pholis (Shanny) | Blenniidae | LC | No interest; public aquariums | 0–8 | F(8,16) |
| Lipophrys trigloides | Blenniidae | LC | 0–15 | F(8,16) | |
| Ophioblennius atlanticus atlanticus (Redlip blenny) | Blenniidae | LC | No interest; aquarium | 0–8 | F(8,16) |
| Parablennius incognitus (Mystery blenny) | Blenniidae | LC | 0–2 | G, F(8,16) | |
| Parablennius parvicornis (Rock-pool blenny) | Blenniidae | LC | 0–2 | G, F(8,16) | |
| Parablennius ruber (Portuguese blenny) | Blenniidae | LC | 0–20 | G, F(8,16) | |
| Seriola rivoliana (Longfin yellowtail) | Carangidae | LC | Commercial; gamefish | 5–245 (30–35) | G, F(2,9) |
| Decapterus macarellus (Mackerel scad) | Carangidae | LC | Commercial; gamefish; bait | 1–400 (40–200) | F(2,9) |
| Pseudocaranx dentex (Guelly jack) | Carangidae | LC | Commercial; aquaculture; gamefish | 10–238 (10–25) | F(2,9) |
| Trachurus picturatus (Blue jack mackerel) | Carangidae | LC | Commercial | 305–370 | F(2,9) |
| Sardina pilchardus (Sardine) | Clupeidae | LC | Highly commercial | 10–100 | F(2,9) |
| Gadiculus argenteus argenteus (Silvery pout) | Gadidade | Not evaluated | Minor commercial; bait: usually | 100–1000 | F(3,5,9) |
| Micromesistius poutassou (Blue whiting) | Gadidade | Not evaluated | Highly commercial | 150–3000 (300–400) | F(3,5,9) |
| Molva macrophthalma (Spanish ling) | Gadidade | LC | No interest | 30–754 | F(3,5,9) |
| Thorogobius ephippiatus (Leopard-spotted goby) | Gobiidae | LC | 6–120 | F(4,7,11) | |
| Kyphosus incisor (Yellow sea chub) | Kyphosidae | Not evaluated | Minor commercial; gamefish | 1–15 | G, F(2) |
| Acantholabrus palloni (Scale-rayed wrasse) | Labridae | LC | Commercial | 30–500 | F(9,10,12) |
| Centrolabrus trutta (Emerald wrasse) | Labridae | LC | 1–30 | F(9,10,12) | |
| Coris julis (Rainbow wrasse) | Labridae | LC | Minor commercial; gamefish; aquarium | 1–120 | F(9,10,12) |
| Labrus bergylta (Ballan wrasse) | Labridae | LC | Subsistence fisheries; gamefish; aquarium | 1–50 | F(9,10,12) |
| Labrus bimaculatus (Cuckoo wrasse) | Labridae | LC | Subsistence fisheries; gamefish; public aquariums | 20–200 (40–80) | F(9,10,12) |
| Pseudolepidaplois scrofa (Barred hogfish) | Labridae | VU | Minor commercial | 20–200 | F(9,10,12) |
| Symphodus mediterraneus (Axillary wrasse) | Labridae | LC | Subsistence fisheries; gamefish; aquarium | 1–70 | F(9,10,12) |
| Thalassoma pavo (Ornate wrasse) | Labridae | LC | Minor commercial; gamefish; aquarium | 1–150 (1–50) | F(9,10,12) |
| Xyrichthys novacula (Cleaver wrasse) | Labridae | LC | Minor commercial; gamefish; aquarium | 1–90 | F(9,10,12) |
| Masturus lanceolatus (Sharptail mola) | Molidae | LC | 0–670 | F(2) | |
| Ranzania laevis (Slender sunfish) | Molidae | LC | 1–140 | F(2) | |
| Mullus surmuletus (Red mullet) | Mullidae | LC | Commercial; gamefish | 5–409 | F(2) |
| Manta birostris (Giant manta) | Myliobatidae | VU | Minor commercial | 0–1000 | F(2) |
| Mobula mobular (Devil ray) | Myliobatidae | EN | 0–700 | F(2) | |
| Myliobatis aquila (Eagle ray) | Myliobatidae | DD | Minor commercial; gamefish | 1–300 | F(2) |
| Brotulotaenia brevicauda | Ophidiidae | Not evaluated | No interest | 0–2650 | F(1,9,14) |
| Brotulotaenia crassa (Violet cuskeel) | Ophidiidae | Not evaluated | No interest | 249–1100 | F(1,9,14) |
| Holcomycteronus squamosus | Ophidiidae | LC | No interest | 1147–5055 | F(1,9,14) |
| Monomitopus metriostoma | Ophidiidae | LC | No interest | 235–1570 | F(1,9,14) |
| Parophidion vassali | Ophidiidae | DD | No interest | F(1,9,14) | |
| Spectrunculus grandis (Pudgy cuskeel) | Ophidiidae | LC | Minor commercial | 800–4300 | F(1,9,14) |
| Acanthostracion notacanthus (Island cowfish) | Ostraciidae | DD | 3–25 (?-10) | F(2,10) | |
| Gaidropsarus granti (Azores rockling) | Phycidae | DD | Commercial | 120–823 | G, F(3) |
| Gaidropsarus guttatus (Spotted rockling) | Phycidae | DD | Subsistence fisheries | 0–20 | G, F(3) |
| Gaidropsarus mauli (Deep sea rockling) | Phycidae | Not evaluated | 900–1700 | G, F(3) | |
| Phycis blennoides (Greater forkbeard) | Phycidae | Not evaluated | Commercial | 10–1308 | F(3) |
| Phycis phycis (Forkbeard) | Phycidae | LC | Minor commercial | 13–614 | F(3) |
| Chromis limbata (Azores chromis) | Pomacentridae | LC | Minor commercial | 5–45 | G, F(7,9,12) |
| Sparisoma cretense (Parrotfish) | Scaridae | LC | Commercial | 2–50 | G, F(10,12) |
| Helicolenus dactylopterus (Blackbelly rosefish) | Scorpaenidae | LC | Commercial | 20–1100 | F(2,9) |
| Pontinus kuhlii (Offshore rockfish) | Scorpaenidae | DD | Commercial | 91–600 | F(2,9) |
| Scorpaena azorica | Scorpaenidae | Not evaluated | G, F(2,9) | ||
| Scorpaena laevis (Senegalese rockfish) | Scorpaenidae | LC | Commercial | 1–100 | G, F(2,9) |
| Scorpaena maderensis (Madeira rockfish) | Scorpaenidae | LC | Commercial | 20–40 | G, F(2,9) |
| Scorpaena notata (Small red scorpionfish) | Scorpaenidae | LC | Commercial; aquarium | 10–700 | G, F(2,9) |
| Scorpaena porcus (Black scorpionfish) | Scorpaenidae | LC | Minor commercial; aquarium | 10–90 | G, F (2,9) |
| Scorpaena scrofa (Red scorpionfish) | Scorpaenidae | LC | Commercial; public aquariums | 20–200 | G, F(2,9) |
| Setarches guentheri (Channeled rockfish) | Scorpaenidae | LC | Minor commercial | 150–800 | F(2,9) |
| Trachyscorpia cristulata echinata (Spiny scorpionfish) | Scorpaenidae | DD | Commercial | 140–2230 | F(2,9) |
| Anthias anthias (Swallowtail seaperch) | Serranidae | LC | Commercial; gamefish; aquarium | 15–300 | F(9,12,13) |
| Mycteroperca fusca (Island grouper) | Serranidae | EN | Commercial | 1–200 (20–30) | G, F(9,12,13) |
| Serranus atricauda (Blacktail comber) | Serranidae | DD | Commercial | 2–90 | G, F(9,12,13) |
| Serranus cabrilla (Comber) | Serranidae | LC | Minor commercial; gamefish; aquarium | 1–450 | G, F(9,12,13) |
| Boops boops (Bogue) | Sparidae | LC | Highly commercial; gamefish; bait usually | 0–350 | F(2,9) |
| Diplodus sargus cadenati (Moroccan white seabream) | Sparidae | LC | Commercial | 1–150 | G, F(2,9) |
| Pagellus acarne (Axillary seabream) | Sparidae | LC | Commercial; gamefish | 40–500 (40–100) | F(2,9) |
| Pagellus bogaraveo (Blackspot seabream) | Sparidae | NT | Commercial; gamefish: yes | 1–800 | F(2,9) |
| Pagrus pagrus (Red porgy) | Sparidae | LC | Commercial; aquaculture; gamefish; aquarium | 0–250 (10–80) | F(2,9) |
| Sarpa salpa (Salema) | Sparidae | LC | Commercial; gamefish; bait occasionally | 5–70 | F(2,9) |
| Sphyraena viridensis (Yellowmouth barracuda) | Sphyraenidae | LC | Commercial | 0–100 | G, F(2) |
| Entelurus aequoreus (Snake pipefish) | Syngnathidae | LC | No interest; public aquariums | 5–100 | F(2) |
| Hippocampus hippocampus (Short-snouted seahorse) | Syngnathidae | DD | Minor commercial; public aquariums | ?–60 | G, F(2) |
| Hippocampus ramulosus (Seahorse) | Syngnathidae | DD | Minor commercial; aquarium | 1–20 | G, F(2) |
| Nerophis maculatus (Spotted Pipefish) | Syngnathidae | DD | ?–30 | F(2) | |
| Syngnathus acus (Greater pipefish) | Syngnathidae | LC | No interest | 0–110 (3–12) | F(2) |
| Lagocephalus lagocephalus (Oceanic puffer) | Tetraodontidae | LC | Commercial; gamefish | 10–476 (10–100) | G, F(2,9) |
| Sphoeroides marmoratus (Guinean puffer) | Tetraodontidae | LC | Commercial | 1–100 | G, F(2,9) |
| Sphoeroides pachygaster (Blunthead puffer) | Tetraodontidae | LC | Commercial | 50–480 (50–250) | G, F(2,9) |
| Zenopsis conchifer (Sailfin dory) | Zeidae | LC | Commercial | 50–600 (150–300) | F(6,9,15) |
Notes:
Conservation status from IUCN: LC, Least Concern; VU, Vulnerable; NT, Near Threatened; EN, Endangered; CR, Critically Endangered; DD, Data deficient. Depth range with most frequent depths presented in brackets. Commercial status: indication of the degree of commercial interest referring to fisheries followed by other types of commercialization; denoted when available. Similarity: G, fish species belonging to the same genus of known sound-producing species; F, fish species belonging to the same family of known sound-producing species.
Exploratory multivariate analyses based on the Bray-Curtis Similarity index agree with an ad-hoc classification made through comparison of the sound spectrograms and by listening to the sounds, suggesting this method produced a valid classification. The only exception being sound #7 that presented similarities with sounds #1 and #10 regarding their spectrograms (Figs. 3 and 4). This suggests that these three sound sequences might belong to closely related species, the same species or even be variants of the same sound type. The remaining sounds are more likely to be produced by different species. In particular sound #12, with energy at higher frequencies, appears to be quite different from the other groups. We cannot ensure, however, that all the identified sound sequences were made by fish, although they exhibited general characteristics common in fish sounds, i.e., they were low frequency short duration sounds, with no frequency modulation, and temporal patterns within the range of other reported sounds (e.g., Fish & Mowbray, 1970; Amorim, 2006; Parsons et al., 2016a; Parsons et al., 2016b).
| Species | Sound type | Behavioural context | References |
|---|---|---|---|
| Abudefduf luridus (Canary damsel) | Single-pulse, two pulses, train of pulses | Agonistic | Santiago & Castro (1997) |
| Chelidonichthys cuculus (Red gurnard) | Knocks, grunts and growls | Agonistic | Amorim (1996) |
| Balistes capriscus (Grey triggerfish) | Toothy grunts; low thumps | During manual and electric stimulation | Fish & Mowbray (1970) |
| Canthigaster rostrata (Sharpnose puffer) | n/a | Moderate sound under manual stimulation | Fish & Mowbray (1970) |
| Caranx crysos (Blue runner) | Weak scrapes, loud grunts | Under duress | Fish & Mowbray (1970) |
| Dactylopterus volitans (Flying gurnard) | n/a | Strong sound under manual stimulation | Fish & Mowbray (1970) |
| Diodon hystrix (Spot-fin porcupinefish) | Defensive inflation with associated sounds of jaw stridulation | Feeding | Fish & Mowbray (1970) |
| Elagatis bipinnulata (Rainbow runner) | n/a | Under manual stimulation | Fish & Mowbray (1970) |
| Epinephelus marginatus (Dusky grouper) | Single booms, serial booms, growls | Courtship | Bertucci et al. (2015) |
| Gobius paganellus ( Rock goby) | Tonal sounds | Agonistic, courtship | Malavasi, Collatuzzo & Torricelli (2008) |
| Kyphosus sectatrix (Bermuda sea chub) | Grunts, thumps, knocks | Alarm calls | Fish & Mowbray (1970) |
| Mola mola (Ocean sunfish) | n/a | Strong sound under manual stimulation | Fish & Mowbray (1970) |
| Naucrates ductor (Pilotfish) | n/a | n/a | Fish (1954) |
| Pomatomus saltatrix (Blue fish) | Escape sounds, clicks & thumps | Under duress | Fish & Mowbray (1970) |
| Pomatoschistus pictus (Painted goby) | Thump and drums | Agonistic, courtship | Amorim & Neves (2008) |
| Scorpaena plumieri (Spotted scorpionfish) | n/a | Weak sound under stimulation | Fish & Mowbray (1970) |
| Seriola dumerili (Greater amberjack) | Thumps & knocks | Competitive feeding | Fish & Mowbray (1970) |
| Trachinotus glaucus (Pompano) | n/a | Weak sound under manual and electric stimulation | Fish & Mowbray (1970) |
| Chelidonichthys lastoviza ( Streaked gurnard) | Knocks and growls | Competitive feeding | Amorim (1996) |
| Zeus faber ( John dory) | Low frequency growl, barks | Agonistic | Onuki & Somiya (2004) |
Notes:
- n/a
-
not available
Previous studies have shown that the Acoustic Complexity Index (ACI) is a useful tool to track variations in the soundscapes (e.g., Pieretti et al., 2017). Our results showed that higher values of the ACI might not indicate a higher abundance and diversity of fish sounds since we did not observe a relation between the abundance and diversity of fish sounds and the ACI values (Fig. 5). In fact, the ACI apparently increased in the presence of cetacean sounds or boat noise. Although this index is known to respond well to biological sounds in recordings with low background noise, it may fail in the presence of anthropogenic or environmental noise (Lin, Fang & Tsao, 2017), under continuous noise such as that created by fish choruses (Bolgan et al., 2018), or in the case reported here where the fish sounds are sparse and with a low signal to noise ratio. In fact, better results can be obtained when using ACI in combination with other methods (Phillips, Towsey & Roe, 2018). This paper supports the approach that multiple acoustic indices are required to understand a soundscape.
| Sound sequence ID | Recording site | N | Peak frequency (Hz) | Min frequency (Hz) | Max frequency (Hz) | Sequence Duration (s) | Sound duration (s) | SoundPeriod (s) | N° of sounds |
|---|---|---|---|---|---|---|---|---|---|
| #1 | Condor; P. Alice | 20 | 318.8 ± 131.3 (125–625) | 94.2 ± 25.1 (55–148) | 662.6 ± 162.1 (430–1109) | 3.45 ± 2.97 (0.62–13.14) | 0.05 ± 0.02 (0.03–0.09) | 0.27 ± 0.09 (0.18–0.48) | 16 ± 17 (4-72) |
| #4 | Condor; P. Alice | 20 | 131.3 ± 28.0 (125–250) | 57.8 ± 18.5 (31–94) | 300.2 ± 87.8 (172–539) | 0.23 ± 0.12 (0.06–0.41) | 0.09 ± 0.04 (0.04–0.19) | 0.22 ± 0.03 (0.15–0.27) | 2 ± 0.5 (1-2) |
| #5 | Condor; P. Alice | 20 | 462.5 ± 146.8 (250–875) | 149.2 ± 68.4 (86–313) | 736.6 ± 158.9 (492–1008) | 0.39 ± 0.84 (0.03–3.81) | 0.06 ± 0.02 (0.03–0.10) | 0.47 ± 0.42 (0.20–1.23) | 2 ± 0.8 (1-4) |
| #7 | Condor; P. Alice | 14 | 357.1 ± 201.3 (125–750) | 74.4 ± 20.2 (47–117) | 713.3 ± 215.2 (367–1094) | 2.12 ± 1.61 (0.49–5.64) | 0.10 ± 0.06 (0.03–0.24) | 0.31 ± 0.11 (0.18–0.56) | 8 ± 6.6 (2-23) |
| #10 | Condor; P. Alice | 20 | 350 ± 104.2 (250–625) | 89.2 ± 20.8 (55–133) | 630.5 ± 190.9 (391–1031) | 0.78 ± 1.20 (0.12–5.09) | 0.22 ± 0.09 (0.06–0.46) | 0.75 ± 0.43 (0.35–1.37) | 2 ± 1.1 (1-5) |
| #12 | Condor; P. Alice | 20 | 1175 ± 85.1 (1000–1375) | 919.9 ± 100.3 (805–1094) | 1468.8 ± 139.6 (1266–1727) | 0.56 ± 0.26 (0.09–1.01) | 0.21 ± 0.07 (0.09–0.38) | 0.44 ± 0.10 (0.30–0.68) | 2 ± 0.7 (1-3) |
| #15 | P. Alice | 20 | 543.8 ± 73.4 (375–625) | 238.0 ± 40.4 (141–297) | 922.7 ± 118.0 (750–1219) | 0.52 ± 0.38 (0.11–1.62) | 0.02 ± 0.004 (0.02–0.03) | 0.16 ± 0.05 (0.09–0.27) | 4 ± 1.5 (2-7) |
| Sound sequence | ID Recording site | Description |
|---|---|---|
| #1 | Condor; P. Alice | Series of relatively short (<50 ms) trains of pulses with broadband frequency and peak frequency of about 300 Hz |
| #2 | Condor; P. Alice | Tonal sound with a frequency range of 20–1,200 Hz. Fundamental frequency of about 100 Hz. Peak frequency at about 200 Hz and a duration of 51 ms |
| #3 | Condor; P. Alice | Isolated pulse train and tonal with frequency range of 300–600 Hz, fundamental frequency at about 350 Hz and peak frequency of about 500 Hz. Duration of about 600 ms |
| #4 | Condor; P. Alice | Broadband sound with two pulsed portions and a peak frequency about 100 Hz |
| #5 | Condor; P. Alice | Similar to sound #1, one or two isolated broadband pulse-trains with a peak frequency of about 450 Hz |
| #6 | Condor | Tonal sound with a frequency range of 100–200 Hz, a fundamental frequency at about 150 Hz, and a duration of about 400 ms |
| #7 | Condor; P. Alice | Long pulse trains followed by shorter trains, similar to sound #1. Peak frequency of about 350 Hz |
| #8 | Condor | Long pulsed sound followed by 4 or 5 shorter pulsed elements. Broadband with a frequency range of 300–800 Hz, main frequency about 350 Hz. and a duration about 600 ms |
| #10 | Condor; P. Alice | Mostly a tonal sound, with a fundamental frequency at about 100 Hz and a peak frequency at about 350 Hz |
| #12 | P. Alice | Two similar elements. Peak frequency at about 1,100 Hz |
| #14 | P. Alice | Group of double short elements; pulsed sound, including one or two pulses, frequency range of 100–1,200 Hz, with a peak frequency of 350–450 Hz and a duration of about 400 ms |
| #15 | Condor; P. Alice | Pulsed sound. Set of 4 pulses grouped two by two. Peak frequency of about 550 Hz |
| #17 | P. Alice | Broadband pulse train composed by 11 or 12 pulses, with a frequency range of 20–900 Hz. Duration of about 200 ms |
| #22 | P. Alice | Broadband sound, with a frequency range of 20–2,000 Hz. Duration about 200 ms |
| #28 | P. Alice | Series of 4 pulse trains, broadband consisting each of a sequence of 4 pulses. Frequency range of 50–300 Hz. Duration of 1.5 s |
| #35 | P. Alice | Pulse train and a broadband sound, with a frequency range of 20–1,400 Hz. Peak frequency of 400–500 Hz and a duration of about 200 ms |
| #38 | P. Alice | High frequency pulsed broadband sound, with a frequency range of 700–1,700 Hz. Peak frequency of 1,000–1,400 Hz and a duration of about 1.3 |
| #47 | P. Alice | Broadband pulsed sound composed by groups of two pulses and a frequency range of 100–1,400 Hz. It lasts about 500 ms |
| #48 | P. Alice | Broadband pulse train with 1 or 2 pulses. Frequency range of 50–600 Hz. It has a duration of about 350 ms |
| #50 | Condor | Broadband sound with a peak frequency of 350 Hz and with a duration of about 1.1 s |
All 20 sound-producing fish species present in the Azores partially or fully overlap their depth distribution range with the study sites. Of the 79 species occurring in the Azores that potentially produce sounds only six are unlikely to be found in either study sites due to their depth distribution range, all others thus being potential source candidates for the recorded fish sounds. Known acoustic detection distances are usually short for fish, so detected sounds can be assumed to have been produced relatively close to the recorders. Indeed, fish sound propagation distances can vary from a few centimeters (e.g., gobies; Lugli & Fine, 2003) to a few meters (e.g., toadfish and damselfish; Fine & Lenhardt, 1983; Myrberg Jr, Mohler & Catala, 1986; Alves, Amorim & Fonseca, 2016; sweeper; Radford et al., 2015). Exceptions are sciaenids which have been estimated to be detectable from tens to few hundred meters (Locascio & Mann, 2011; Parsons et al., 2012). Most of the above acoustic detection distances, however, have been reported for fish calling in shallow water, thus facing strong propagation constraints due to the frequency cutoff phenomenon (Rogers & Cox, 1988). In deeper waters such as Condor, fish sounds will likely propagate to longer distances than in shallow water (Mann, 2006) but proximity to the recorder will still be a constraint for monitoring most soniferous species.
Figure 5: Comparison of mean Acoustic Complexity Index (ACI) values with abundance and diversity of fish sound sequences in two contrasting months.
Graphs compare mean Acoustic Complexity Index (ACI) values (line graph) with the abundance and diversity of the seven recorded sequences of sounds (histograms) in August 2009 and June 2010 on the Condor seamount.
Can any of the described sound sequences be attributed to a known vocal fish species? Comparisons made between the reference fish sounds and the seven recorded sound sequences (Figs. 3 and 4) must be considered with care since only one sound from each species was available. We found some resemblance in the analysis between some sound sequences (e.g., #4 with Seriola dumerilli, sounds #1, #5 and #7 with Epinephelus marginatus, the sound #10 with Dactylopterus volitans) but a more careful inspection revealed that none of these species sounds matched the identified sound sequences. Sound sequences #1, #5, #7 and #10 displayed similarities with sounds produced by species of Batrachoididae, which generate tonal sounds with several harmonics and dominate soundscapes in different habitats across the world (Bass & McKibben, 2003; Maruska & Mensinger, 2009; Rice et al., 2016). Sound sequences #1, #5 are similar to grunt trains, #10 resembles boatwhistles from toadfishes and #7 resembles boatwhistles followed by grunts trains. For example, advertisement calls of Opsanus beta are composed by grunt and tonal elements (Thorson & Fine, 2002). No Batrachoididade species are known for the Azores, though Halobatrachus didactylus occurs in the eastern Atlantic, and both Opsanus tau and Opsanus phobetron in the western Atlantic (Amorim, 2006; Amorim, Simões & Fonseca, 2008; Fine, 1978). Sound sequence #1 sounds like an Ophidiiform (M Bolgan, pers. comm., 2019). Sound sequence #12 (duration: 0.56 s, peak frequency: 1,175 Hz; Table 4) exhibits similarities with the /kwa/ recorded in Posidonia oceanica meadows in the Mediterranean Sea, recently attributed to Scorpaena spp. (0.27s duration and 747 Hz peak frequency; Di Iorio et al., 2018; Bolgan et al., 2019). This sound presents several acoustic features which are typical of the “kwa” sound. In particular, peak frequency is always higher than 600 Hz, the pulse envelop presents a highly stereotyped amplitude modulation where cycle period corresponds to peak frequency; finally, the sound presents a typical pseudo-harmonic structure where the pseudo-harmonic interval corresponds to the inverse of the pulse period (Di Iorio et al., 2018; Bolgan et al., 2019). Interestingly sound sequence #12 also shows some resemblance in frequency and duration with the chatter sound made by cusk-eels Ophidion marginatum (Ophidiidae) (Sprague & Luczkovich, 2001; Mann & Jarvis, 2004), although they do not seem similar to the human ear. Both members of the Scorpaenidae and Ophidiidae can be found in Azores (Table 2).
Although we could not suggest a potential candidate for sound sequence #15, similar sounds were also found during boat-based recordings around Faial Island at depths between 2–10 m (R Carriço, pers. comm., 2017) indicating that its emitter may also inhabit shallow waters. Sound sequences #1, #2, #3, #4, #5, #7, #10 and #15 were recorded in both study locations, suggesting a wide depth distribution. In contrast, sounds #6 and #8 were recorded only in Condor (190 m) while sounds #12, #14, #17, #22, #28, #35, #38, #47 and #48 were recorded only in Princesa Alice (36 m) indicating that these soniferous fishes may be somewhat stenobathic.
Potential vocal fish species present in Condor at the studied depth (Table 2) produce sounds similar to the sound sequences that were recorded. For example, Phycis phycis, Phycis blennoides, Anthias anthias, and Molva macrophtalma are potential source species for the calls #6 and #8, while Pagellus bogaraveo and Helicolenus dactylopterus are potential source species for the sound sequences #1, #2, #3, #4, #5, #7, #10 or #15 (Menezes & Giacomello, 2013). On the other hand, Sphyraena viridensis and Seriola rivoliana have confirmed presence in Princesa Alice (Fontes & Afonso, 2017), being eventually potential source species for the sound sequences #12, #14, #17, #22, #28, #35, #38, #47 or #48.
Conclusions
The present study highlights the wealth of fish sounds awaiting to be described and challenges associated with PAM. For example, only some soniferous fish species produce loud conspicuous sounds easily detectable by PAM. Also most fish sounds are still unidentified making it difficult to identify the sources of most fish sounds detected with PAM. However, these monitoring studies can contribute to evaluate fish presence and abundance, to identify spawning seasons of species of commercial, conservation and scientific interest. It can also be used to investigate fish community structure (Harris, Shears & Radford, 2015; McWilliam & Hawkins, 2013). To increase the effectiveness of PAM, basic research is needed on sound source identity, behavioral context of sounds production, and spatial and temporal distribution of the sounds/species (Rountree et al., 2006; Sirovic et al., 2009; Wall et al., 2014). Two important approaches to overcome these main challenges are coupling PAM with in situ visual monitoring techniques (e.g., Mouy et al., 2018), and recording more species in laboratory conditions.
Our results provide baseline data on a collection of sounds, contributing to building a comprehensive open access library of both identified and unknown fish sounds that will boost the usefulness of PAM.
Supplemental Information
Video with the sound files and spectrograms of the twenty fish sound sequences found in Azores
Fish sounds databases
List of databases and online open access libraries of animal sounds including fish.
Oscillograms and spectrograms of vocal fish species present in the Azorean archipelago
Oscillograms and spectrograms of vocal fish species present in the Azorean archipelago: (A) Red gurnard (Amorim, 1996); (B) Streaked gurnard (Amorim, 1996); (C) Grey triggerfish (Macaulay Library); (D) Blue runner (Fish Base); (E) Painted goby –drum (Amorim & Neves, 2008); (F) Painted goby –courtship thump (Amorim & Neves, 2008); (G) John dory (Mensinger et al., 2016); (H) Flying gurnard (Macaulay Library); (I) Porcupine fish (Macaulay Library); (J) Dusky grouper (Bertucci et al., 2015); (K) Blue fish (Fish Base) and (L) Greater amberjack (Fish Base). Spectrograms were created using a 2048 points FFT with a Hamming window from wav files. Warmer colours indicate higher sound energy
Oscillogram and spectrogram of other less abundant identified fish calls detected in the Azorean archipelago
Oscillogram and spectrogram of other less abundant identified fish calls detected in the Azorean archipelago, Portugal: A –#2; B - #3; C - #6; D - #8; E - #14; F - #17; G - #22; H - #28; I - #35; J - #38; K - #47; L - #48 and M - #50. Spectrograms were created using a 2,048 points FFT with a Hamming window from wav files recorded at 50 kHz. Warmer colours indicate higher sound energy.