
Obesity genetics in mouse and human: back and forth, and back again
- Published
- Accepted
- Received
- Academic Editor
- Juan Riesgo-Escovar
- Subject Areas
- Genetics, Diabetes and Endocrinology
- Keywords
- Polygenic obesity, Monogenic obesity, Genetics, Integrative biology, Human, Mouse, Genome-wide association study, Next generation sequencing, Knock-out, Transgenic
- Copyright
- © 2015 Yazdi et al.
- Licence
- This is an open access article distributed under the terms of the Creative Commons Attribution License, which permits unrestricted use, distribution, reproduction and adaptation in any medium and for any purpose provided that it is properly attributed. For attribution, the original author(s), title, publication source (PeerJ) and either DOI or URL of the article must be cited.
- Cite this article
- 2015. Obesity genetics in mouse and human: back and forth, and back again. PeerJ 3:e856 https://doi.org/10.7717/peerj.856
Abstract
Obesity is a major public health concern. This condition results from a constant and complex interplay between predisposing genes and environmental stimuli. Current attempts to manage obesity have been moderately effective and a better understanding of the etiology of obesity is required for the development of more successful and personalized prevention and treatment options. To that effect, mouse models have been an essential tool in expanding our understanding of obesity, due to the availability of their complete genome sequence, genetically identified and defined strains, various tools for genetic manipulation and the accessibility of target tissues for obesity that are not easily attainable from humans. Our knowledge of monogenic obesity in humans greatly benefited from the mouse obesity genetics field. Genes underlying highly penetrant forms of monogenic obesity are part of the leptin-melanocortin pathway in the hypothalamus. Recently, hypothesis-generating genome-wide association studies for polygenic obesity traits in humans have led to the identification of 119 common gene variants with modest effect, most of them having an unknown function. These discoveries have led to novel animal models and have illuminated new biologic pathways. Integrated mouse-human genetic approaches have firmly established new obesity candidate genes. Innovative strategies recently developed by scientists are described in this review to accelerate the identification of causal genes and deepen our understanding of obesity etiology. An exhaustive dissection of the molecular roots of obesity may ultimately help to tackle the growing obesity epidemic worldwide.
Introduction
Obesity is a worldwide epidemic affecting over 400 million adults (World Health Organization, 2011), and is defined as the accumulation of excess body fat to the extent that it results in other health complications and reduces life expectancy (Bahreini et al., 2013). Co-morbidities associated with obesity include psychological distress, osteoarthritis, type 2 diabetes mellitus, hypertension, hyperlipidemia, liver steatosis, cardiovascular disease and certain types of cancer (Switzer, Mangat & Karmali, 2013). The steady increase in life expectancy due to advanced medical treatment may be reversed by negative impacts of obesity on youth today in Westernized countries (Olshanky et al., 2005).
Unfortunately, attempts to prevent obesity have had limited success thus far. The individualistic lifestyle approach of “eat less, move more” has been ineffective as a preventive measure for obesity (Kirk et al., 2012). Effective obesity prevention and management is dependent on the acknowledgement that obesity goes beyond the individual behavior and is influenced by genetics, psychology, society and public policy (Kirk, Penney & McHugh, 2010).
The rise of obesity coincided with several major societal and environmental changes that are likely causal factors. The umbrella term ‘obesogenic’ has been applied to these changes, which include excessive consumption of energy dense foods, sedentary lifestyles, urbanization, and socioeconomic-dependent access to a healthy diet (Hill, 1998; Misra & Khurana, 2008; Must et al., 1999). Aside from environmental factors, considerable evidence from twin, adoption, and family studies indicates that 40 to 70% of BMI variation is due to genetic factors (Choquet & Meyre, 2011). Obesity is a heritable neurobehavioral condition that is highly sensitive to the environment (Ahmad, Varga & Franks, 2013; O’Rahilly & Farooqi, 2008). Understanding the molecular roots of obesity is an important prerequisite to improve both prevention and management of this condition (Bessesen, 2008). This has prompted considerable effort to identify the genes predisposing to obesity by conducting studies in rodents and humans. This review summarizes the progress in the elucidation of obesity genes focusing on the synergies developed between mouse and human obesity genetic fields. The paper also reviews the innovative strategies that synergize the two disciplines to comprehensively uncover the genetic architecture of obesity.
What Have Mouse Models Taught us About Human Obesity?
Mouse models are the most common experimental animals in obesity genetics. General advantages of mouse models include: low maintenance cost, small size, ease of breeding and short gestation period. They reach sexual maturity faster than other mammals and have a shorter life span (Lee & Cox, 2011; Rosenthal & Brown, 2007). The availability of genetically defined strains, the complete genome sequence of numerous strains, dense single nucleotide polymorphism (SNP) characterization of many others, and well-developed genetic manipulation tools facilitate sophisticated genetic analyses. Genetic manipulation techniques employed in mouse models, such as knock-out/knock-in, overexpression or tissue-specific expression methods can be used to test the functionality of genes associated with obesity (Cox & Church, 2011). Additionally, since homozygote null mutations are exceptionally rare in humans, knock-out mouse models are an attractive alternative to study such rare occurrences (Rees & Alcolado, 2005). Mice also exhibit obesity and metabolic phenotypes that are comparable to humans and can be measured with standardized diagnostic tests (Toye et al., 2004). More detailed phenotyping, such as direct metabolic measurements and assessment of body fat content, that are difficult and costly in large numbers of humans are also possible in mice (Butler & Kozak, 2010; Ellacott et al., 2010; Kaiyala et al., 2010). Importantly, environmental factors can be carefully controlled and specifically manipulated in mouse models (Ayala et al., 2010). Reducing environmental heterogeneity results in an increased power to link genetic variation to the phenotypic differences observed. Specific environmental manipulations allow direct testing of hypotheses to inform about gene-environment interactions. Mice also provide obesity-related tissues such as brain tissue that are otherwise difficult to obtain in humans (Tung et al., 2010).
However, it should be noted that mouse models of obesity are not without their limitations. Different conclusions may arise in mouse and human because of the use of different phenotypes in the study. For instance, BMI measurements are typical in human studies, whereas the direct measurement of percent body fat or body fat mass is more common in mouse models. Unlike humans, there is no defined threshold for obesity based on BMI in mice. Also, in comparison to humans, the secondary complications of obesity substantially depend upon the background strain (Clee & Attie, 2007). Moreover, some physiological differences between humans and mice make studying certain important genes or pathways difficult. For example, the role of β-MSH in control of energy balance was overlooked in humans mainly due to the fact that mouse models lack β-MSH (Lee et al., 2006).
Tools and Approaches Available in Mouse and Human
Human genetics approaches
Linkage analysis
This approach aims to map the location of a disease causing loci by looking for genetic markers that co-segregate with the disease within pedigrees (Teare et al., 2005). Different linkage approaches are applied depending on the type of the disease or trait. For example, parametric analysis is used if the disease is a Mendelian disease (Li & Meyre, 2014).
Homozygosity mapping
This is a powerful method to map genes responsible for recessive Mendelian disorders in consanguineous pedigrees. This approach requires less than a dozen of affected individuals, and no additional family members are required to identify the disease causing locus (Lander & Botstein, 1987).
Candidate gene studies
Candidate gene approach is hypothesis-driven and has been widely used before the rise of GWAS. Candidate genes have a known biological function that directly or indirectly influence the trait being investigated (Zhu & Zhao, 2007). The main disadvantage of this approach is that it is heavily reliant on the current level of knowledge of a specific gene (Hirschhorn et al., 2002). Candidate genes also have a low success rate overall, as consistent associations have been reported only for a selected few candidate genes (Vimaleswaran et al., 2012).
Genome-wide association studies
This approach exhaustively tests the genotype/phenotype associations across up to 4.8 million genetic markers and to date represents the most efficient way to identify common variants (MAF>1%) associated with complex diseases (Visscher et al., 2012).
Whole exome/whole genome sequencing
This relatively new approach is efficiently applied to identify rare variants associated with Mendelian or complex traits for a reasonable cost in comparison to classical approaches such as Sanger sequencing. It is powerful because it detects mutations in novel genes not previously detected by candidate gene approaches. The main challenge is to identify a causal gene analyzing the large sequencing dataset (Li & Meyre, 2014). With advances in sequencing technology, it is now possible to sequence approximately 95% of all protein-coding bases of all known genes (the “exome”) at a cost that is comparable to sequencing a single gene by the Sanger method (Shendure, 2011; Singleton, 2011). Despite the fact that whole-genome sequencing experiments are more expensive than whole-exome sequencing experiments, they are more and more used to identify genetic variants associated with Mendelian and complex traits (Morrison et al., 2013; Styrkarsdottir et al., 2014).
Mouse genetic approaches
Natural mutations
Naturally occurring mutations are spontaneous mutations in mice that could be linked to the trait of interest. Natural mutations can range from simple single nucleotide substitution to complex rearrangements (Justice, Siracusa & Stewart, 2011). They occur by chance and transmission from parent to offspring results in fixation of these mutations within a population (Justice, Siracusa & Stewart, 2011). These mutations are often studied by quantitative trait loci (QTLs), which link a chromosomal region to the trait of interest (Chiu et al., 2006; Diament, Fisler & Warden, 2003).
Although studying natural variants may be appealing, regrettably the spontaneity of their appearance is often matched by their impromptu disappearance (Stanford, Cohn & Cordes, 2001). Furthermore, studying obesity genes in mouse models with natural mutations may be a more time consuming approach compared to chemically induced mutations.
Chemically induced mutations
Chemical mutagenesis increases frequency and variety of mutations for functional genetic studies. Furthermore, with the use of inbreeding techniques, chemical mutagenesis can create a genetic variant that is identical to parent strain except for the induced mutation that may be responsible for phenotypic diversity compared to parent strain (Svenson, Bogue & Peters, 2003). This approach creates a set of mutants that differ minimally in genotype from parental strain, but differ robustly in phenotype, making it a promising approach in functional genetic studies (Svenson, Bogue & Peters, 2003).
Successful genetic manipulation requires DNA modifications of germ-line cells so that the modification is heritable (Strachan & Read, 1999). Target cells usually can differentiate into different cells or give rise to germ-line cells, which makes embryonic stem cells (ES) ideal because they can differentiate to somatic and germ line cells (Strachan & Read, 1999).
X-ray mutagenesis
This method induces mutations 20–100 times greater than spontaneous mutations. It causes chromosomal rearrangements which can range from simple deletions, inversions and translocations to complex rearrangements (Silver, 1995). In this approach, several genes are affected by chromosomal rearrangements, therefore this method adds complexity to genetic studies and makes it difficult to dissect individual gene function (Stanford, Cohn & Cordes, 2001).
Chlorambucil
Chlorambucil (CAB) induces similar chromosomal translocations and multigene deletions to X-ray (Russell et al., 1989). CAB is an alkalyting agent that impacts cell division and results in aneugenic activity (Efthimiou et al., 2007). CAB causes smaller deletions and translocations in comparison to X-ray mutagenesis, but it does not lead to single-gene identification and therefore, is not used in high-throughput approaches (Stanford, Cohn & Cordes, 2001).
Ethylnitrosourea
Ethylnitrosourea (ENU) is an alkylating agent that induces point mutations in the DNA of spermatogonial stem cells via single-base mismatching to the unrepaired alkylated base (Svenson, Bogue & Peters, 2003). ENU is advantageous since it is easy to administer, results in higher mutagenesis rate and is amendable to high-throughput screening (Justice, 2000). Through international collaborative efforts several archives of DNA, embryonic stem (ES) cells or typically sperm, from mutagenized mice have been created and catalogued along with some standardized phenotypic data and the listing of mutations they contain. The corresponding ES cells/sperm can be ordered and used to regenerate mice harboring the mutation of interest (Acevedo-Arozena et al., 2008).
Insertional mutagenesis
Pronuclear injection
This approach involves microinjection of DNA into fertilized oocytes to affect the function of an endogenous gene. This approach requires the cloning of cDNA (coding sequence of a selected gene). The sequence is then inserted in frame with a constitutively active promoter that drives transcription (Gordon & Ruddle, 1981; Harbers, Jahner & Jaenisch, 1981). This method disturbs endogenous gene expression and can generate chromosomal rearrangements and deletions (Belizário et al., 2012). Pronuclear injections are labor intensive and highly technical, thus they are not used in high-throughput screening (Stanford, Cohn & Cordes, 2001).
Gene targeting
Targeted mutagenesis by homologous recombination in embryonic stem cells is used to efficiently target a single gene (Sun, Abil & Zhao, 2012). Gene targeting was first pioneered by Thomas & Capecchi (1987) who were able to exchange the endogenous gene with a mutated copy in cultured mammalian cells by using a homologous sequence of the gene. This approach is able to produce specific alterations to the mouse genome to analyze targeted gene function (Menke, 2013).
Gene trapping
Gene trapping is a vector insertion that disrupts the regular transcription of endogenous genes (O’Kane & Gehrin, 1987). Gene trapping includes enhancer, promoter and exon traps. The enhancer trap is used for gene identification, and it involves the introduction of a reporter construct that requires a cis-acting DNA to activate gene expression. Genes are then identified depending on the expression information (Yamamura & Araki, 2008). The promoter and the exon traps are mainly used for mutagenesis. The promoter trap contains the coding sequence of the reporter gene and can interfere with normal coding capacity of endogenous genes and create a mutation. The exon trap is designed to create spliced fusion transcripts between the reporter and the endogenous gene (Yamamura & Araki, 2008). Gene trapping is an efficient system for simultaneous studies of gene function, sequence and expression (Stanford, Cohn & Cordes, 2001). Many of the targeted ES cells produced by the international consortia include gene-trap vectors.
Lentivirus vectors
Viral vectors are a stable, long-term gene delivery system of genetic information to host cells. The system depends on replicating viruses that have the genetic information for the targeted gene instead of their own coding regions (Kootstra & Verma, 2003). Lentiviral vectors are often preferred over other viral vectors because they are more efficient at delivering complex gene expression cassettes (May et al., 2000), they can mediate long term gene expression (Seppen et al., 2001) and they are relatively safe (Brown et al., 2010). They provide high control over the manipulated gene, and are ideal for studying gene function in small populations (Osten, Dittgen & Licznerski, 2006). Other viral vectors that are commonly used, particularly adeno-associated virus (AAV) vectors, have different tissue tropisms that can be used for the over-expression of genes of interest even within the central nervous system, that may be of particular relevance for obesity (Lentz, Gray & Samulski, 2012). The development of novel viral vectors is ongoing (Huang & Kamihira, 2013). Recent advances in materials and nanotechnologies may also facilitate non-viral methods of direct gene delivery (Yin et al., 2014), although these are not yet routinely used.
Inbreeding methods
Once a mutation is successfully induced, a mutant model is obtained and the next step is to dissect the genetic roots of the phenotype. Figure 3 is a graphical representation of different inbreeding techniques (Rogner & Avner, 2003). This section provides an overview of the different inbreeding approaches used to reach this objective.
Genetic cross
Genetic cross is a classical cross where two inbred strains are mated and their offspring are either mated to each other (an intercross F2 design) or to a progenitor strain (a backcross design) (Flint & Eskin, 2013). Second-generation offspring are then phenotyped and genotyped, and linkage analysis is carried out to identify a region that is associated with the trait of interest (Silver, 1995).
The classical inbred strains
This method provides a higher mapping resolution than the genetic cross, since the inbred mouse strains are separated from their founders by more generations, thus increasing the recombination events between the genomes of the founding strains (McClurg et al., 2007). These strains are commercially available for purchase from vendors, and no breeding steps are required in this approach.
The recombinant inbred lines
Recombinant inbred lines are created through cross breeding of inbred mice, amplifying the genotypic/phenotypic diversity found across inbred mice. The power of recombinant inbred lines are in that they represent a fixed polygenic model that can be phenotyped deeply, in multiple environments (Zou et al., 2005). This fixed model is established via crossing two different inbred parental strains to produce F1 offspring, and then generating a series of brother-sister mating for at least 20 generations. This produces fully inbred strains which are homozygous at all loci for a unique combination of the original parental genomes (Pomp, 2007). An example of recombinant inbred lines is the Hybrid Mouse Diversity Panel (HMDP). This is a panel of approximately 100 strains that are phenotyped and association is carried out after correcting for population structure using efficient mixed-model association and made available to the scientific community. The combined populations in the HMDP provide a high statistical power and a high resolution (Flint & Eskin, 2013), which makes this model ideal for systems-level analysis of gene by environment interactions (Parks et al., 2013).
Another illustration of recombinant lines is the Collaborative Cross, which is a large-scale effort to create a set of recombinant inbred strains that are specifically designed for mapping traits (Aylor et al., 2011). By using wild derived strains, a substantial amount of genetic diversity is introduced, giving the collaborative cross the advantage of covering more genetic variations compared to other approaches (Philip et al., 2011).
Chromosome substitution strains or consomic strains
Chromosome substitution occurs when a single, full-length chromosome from one inbred strain has been transferred onto the genetic background of a second strain by repeated backcrossing (Nadeau et al., 2000). The method involves construction of chromosome substitution strains (CSS) between a donor and a host strain, which partitions the variation between two strains and becomes a resource for studying genetic control of phenotype variation (Singer et al., 2004).
Long-term selection lines
Long-term selection lines are developed through selective breeding for a wide variety of phenotypes (Paigen, 2003). Several of these lines can be joint and inbred to characterize different metabolic traits together and develop models for gene mapping. For example, the body fat phenotype in mice were developed by long-term selection of fat (F) and lean (L) mice in over 60 generations (Horvat et al., 2000). A genome-wide quantitative trait locus (QTL) analysis of a cross between F and L lines revealed QTLs that mapped to regions that were previously described as obesity QTLs (Horvat et al., 2000).
The heterogeneous stock
The heterogeneous stock (HS) uses outbred mice to increase statistical power compared to recombinant inbred strains. The outbred mice are similar to F2 animals from a cross, but they have ancestry from eight founder strains instead of only two, and the population is bred for more generations (Valdar et al., 2006). Commercial outbred stock animals have been maintained for many generations, and they provide high-resolution mapping (Flint & Eskin, 2013).
Genetic manipulations in mice
Gene manipulation techniques allow for definitive alterations of specific genes at the systemic level. They also enable gene alterations in a time or tissue specific manner (Speakman et al., 2007).
Over-expression of target genes
This method involves cloning of a full-length coding sequence downstream of a promoter, which may provide a global or tissue-specific overexpression of a target gene in the transgenic offspring (Speakman et al., 2007). This technique is straightforward and inexpensive, but the extent of changes in gene and protein expression is not always predictable. It can also disturb endogenous gene expression (Justice, Siracusa & Stewart, 2011; Stanford, Cohn & Cordes, 2001).
Knock-out models
Knock-out models involve the total ablation of the target gene in all tissues, but the ablation of target genes could reveal unpredicted effects (Davey & MacLean, 2006). For example, homozygous knock-outs may result in embryonic death (eg: Sim1−/−) (Michaud et al., 2001), or developmental compensation (eg: Npy) (Erickson, Hollopeter & Palmiter, 1996; Erikson, Clegg & Palmiter, 1996) in which no particular phenotype will be observed. In the example of Sim1, heterozygous knock outs of this gene survive, but develop severe obesity associated with increase in food intake without measurable energy expenditure. This is indicative of how Sim1 plays a role in energy homeostasis (Ramachandrappa et al., 2013).
SiRNA/shRNA
Conditional gene knockdown is a powerful tool for studying gene function, and methods of gene knockdowns are in constant evolution (Brown et al., 2010). The discovery of small interfering RNA (siRNA) as a viable mechanism for eliciting RNA interference (RNAi) expanded opportunities for functional genetic studies (Elbashir et al., 2001). Vector directed siRNA technology allows for rapid generation of large number of knockdown mice in any strain of interest (De Souza et al., 2006), which produces strong and specific suppression of gene expression with no cytotoxicity (Elbashir et al., 2001).
Short hair pin RNAs (shRNA) provide a more straightforward approach for down regulation of gene expression, because unlike siRNAs, they can be stably expressed within the cell and are not lost with cell division (Brown et al., 2010). Lentivirus vectors containing polymerase III promoters for shRNA expression and polymerase II promoter for fluorescent protein expression (for labeling the cell) can be used in order to knock-down endogenous genes (Dittgen et al., 2004). An example of this application is silencing of the leptin receptor gene related protein (OB-RGPR) that was accomplished via lentiviral vector encoding a shRNA directed against OB-RGPR in the hypothalamus (Couturier et al., 2007). Silencing of OB-RGPR in hypothalamus prevents the development of diet-induced obesity in mice fed high-fat diet (HFD) (Couturier et al., 2007). Expression of microRNAs (miRNA) can also be used to modulate gene expression (Casola, 2010).
Knock-in models
These models involve the replacement of the endogenous gene with the mutated form and are used to study more specific roles of the changes in protein function (Speakman et al., 2007). This technique could also be used to confirm the impact of target mutations on phenotype of the disease. For example, humans with dominant negative PPARγ L466A mutation display severe insulin resistance, dyslipidemia and hypertension (Freedman et al., 2005). Further studies of the mutation in mice revealed that mice with Pparγ knock-in L466A mutation exhibit lipodystrophy, decrease in adipogenic genes, high circulating free fatty acids (FFAs), and low adiponectin. Human studies of this mutation, coupled with the animal experiments confirm the importance of PPARγ in adipose tissue maintenance (Freedman et al., 2005)
The Cre/loxP system
This is a tool for tissue-specific and time specific knock out genes. When Cre is expressed in mice with a loxP containing gene, the desired gene is excised (Kühn & Torres, 2002). The expression of Cre can be driven either through a transgenic under a tissue specific and/or temporally regulated promoter, or by direct delivery to cells. Depending on the specific tissue or time of Cre expression, modifications can be restricted to a certain cell type or a development stage (Kühn & Torres, 2002). Delivery of Cre via viral vectors provides a more specific gene delivery in the nervous system (Kaspar et al., 2002), particularly if performed by targeted injection.
Newer gene expression manipulation techniques such as zinc fingers and TALENs are also used in obesity genetics field, albeit less frequently than Cre/loxP. Zinc fingers are a versatile DNA recognition domain that have been combined in a modular fashion to generate fusion proteins that recognize unique DNA sites in complex eukaryotic genomes (Urnov et al., 2010). Similarly, transcription activator-like effector nuclease (TALENs) from pathogenic bacterium Xanthomonas can be engineered to virtually bind to any DNA sequence (Boch, 2011). Each TALEN can travel to the nucleus, bind to the promoters of target genes and induce transcription based on their specific DNA-binding site (Boch, 2011).
The Golden Age of Mouse Obesity Genetics
Monogenic obesity mouse models and candidate gene studies in human
The identification of genes underlying monogenic obesity relied heavily on mouse genetic studies. By searching the available literature on mouse models of obesity, we collected 221 genes that have been linked to obesity or weight gain via knock-out or transgenic mice, or by utilizing techniques such as over-expression or Cre/loxP (Table 1). We conducted this literature review by searching key terms in PubMed and OMIM databases. We have focused on the obesity and weight gain phenotype and did not detail genes responsible for leanness phenotypes. Leanness may truly result from the manipulation of a gene important in energy balance (e.g., FTO inactivation leads to leanness, FTO overexpression leads to obesity). However, leanness may also be linked to toxicity and sickness of the animal due to genetic manipulations (Reed, Lawler & Tordoff, 2008). The study of monogenic obesity in mice pioneered our understanding of the mechanisms underlying the regulation of body weight in humans. The genes underlying monogenic forms of obesity in humans all encode members of these highly conserved pathways, which are essential in regulation of body weight and energy homeostasis (Fig. 1) (Choquet & Meyre, 2011; Farooqi & O’Rahilly, 2008). Since a detailed discussion of all the genes listed in Table 1 is not feasible for one review paper, we will focus on a subset of the genes that are all part of the leptin/melanocortin or paraventricular nucleus development pathways in the section below.

Figure 1: Genes involved in the leptin-melanocortin pathway that have been associated with monogenic obesity through their influence on food intake and energy expenditure.
Leptin secreted from adipose tissue binds to the leptin receptor in the hypothalamus. Leptin binding inhibits the neuropeptide Y/agouti-related protein (NPY/AgRP) production and stimulates pro-opiomelanocortin (POMC) production, which undergoes post-translational modifications to produce peptides such alpha and beta-melanocyte-stimulating hormone (α and βMSH) via the processing of prohormone convertase 1(PC1/3) and carboxypeptidase E (CPE) enzymes. Alpha and βMSH bind to melanocortin 3 and melanocortin 4 receptors (MC3R and MC4R) and induce their activity. Melanocortin 2 receptor accessory protein 2 (MRAP2) can reduce the responsiveness of both MC3R and MC4R to α and βMSH and result in obesity. On the other hand, Single-minded 1 (SIM1) acts as a facilitator of MC4R activity. Increase in the MC3R and MC4R activities result in a decrease in food intake and increase in energy expenditure. MC4R activity also stimulates release of Brain-derived neurotrophic factor (BDNF) which will bind to the neurotrophin receptor (TrkB) and influence food intake and energy expenditure. Aside from activation of the POMC, leptin binding to its receptor also activates the Janus kinase/signal transducer and activator of transcription (JAK/STAT) signaling. This pathway, through the help of Src homology 2 B adapter protein 1 (SH2B1), results in activation of Signal transducer and activator of transcription 3 (STAT3). STAT3 will then migrate to the nucleus with the help of Tubby bipartite transcription factor (TUB) and activate its target genes related to energy homeostasis and mediate in the anorexigenic effects of leptin.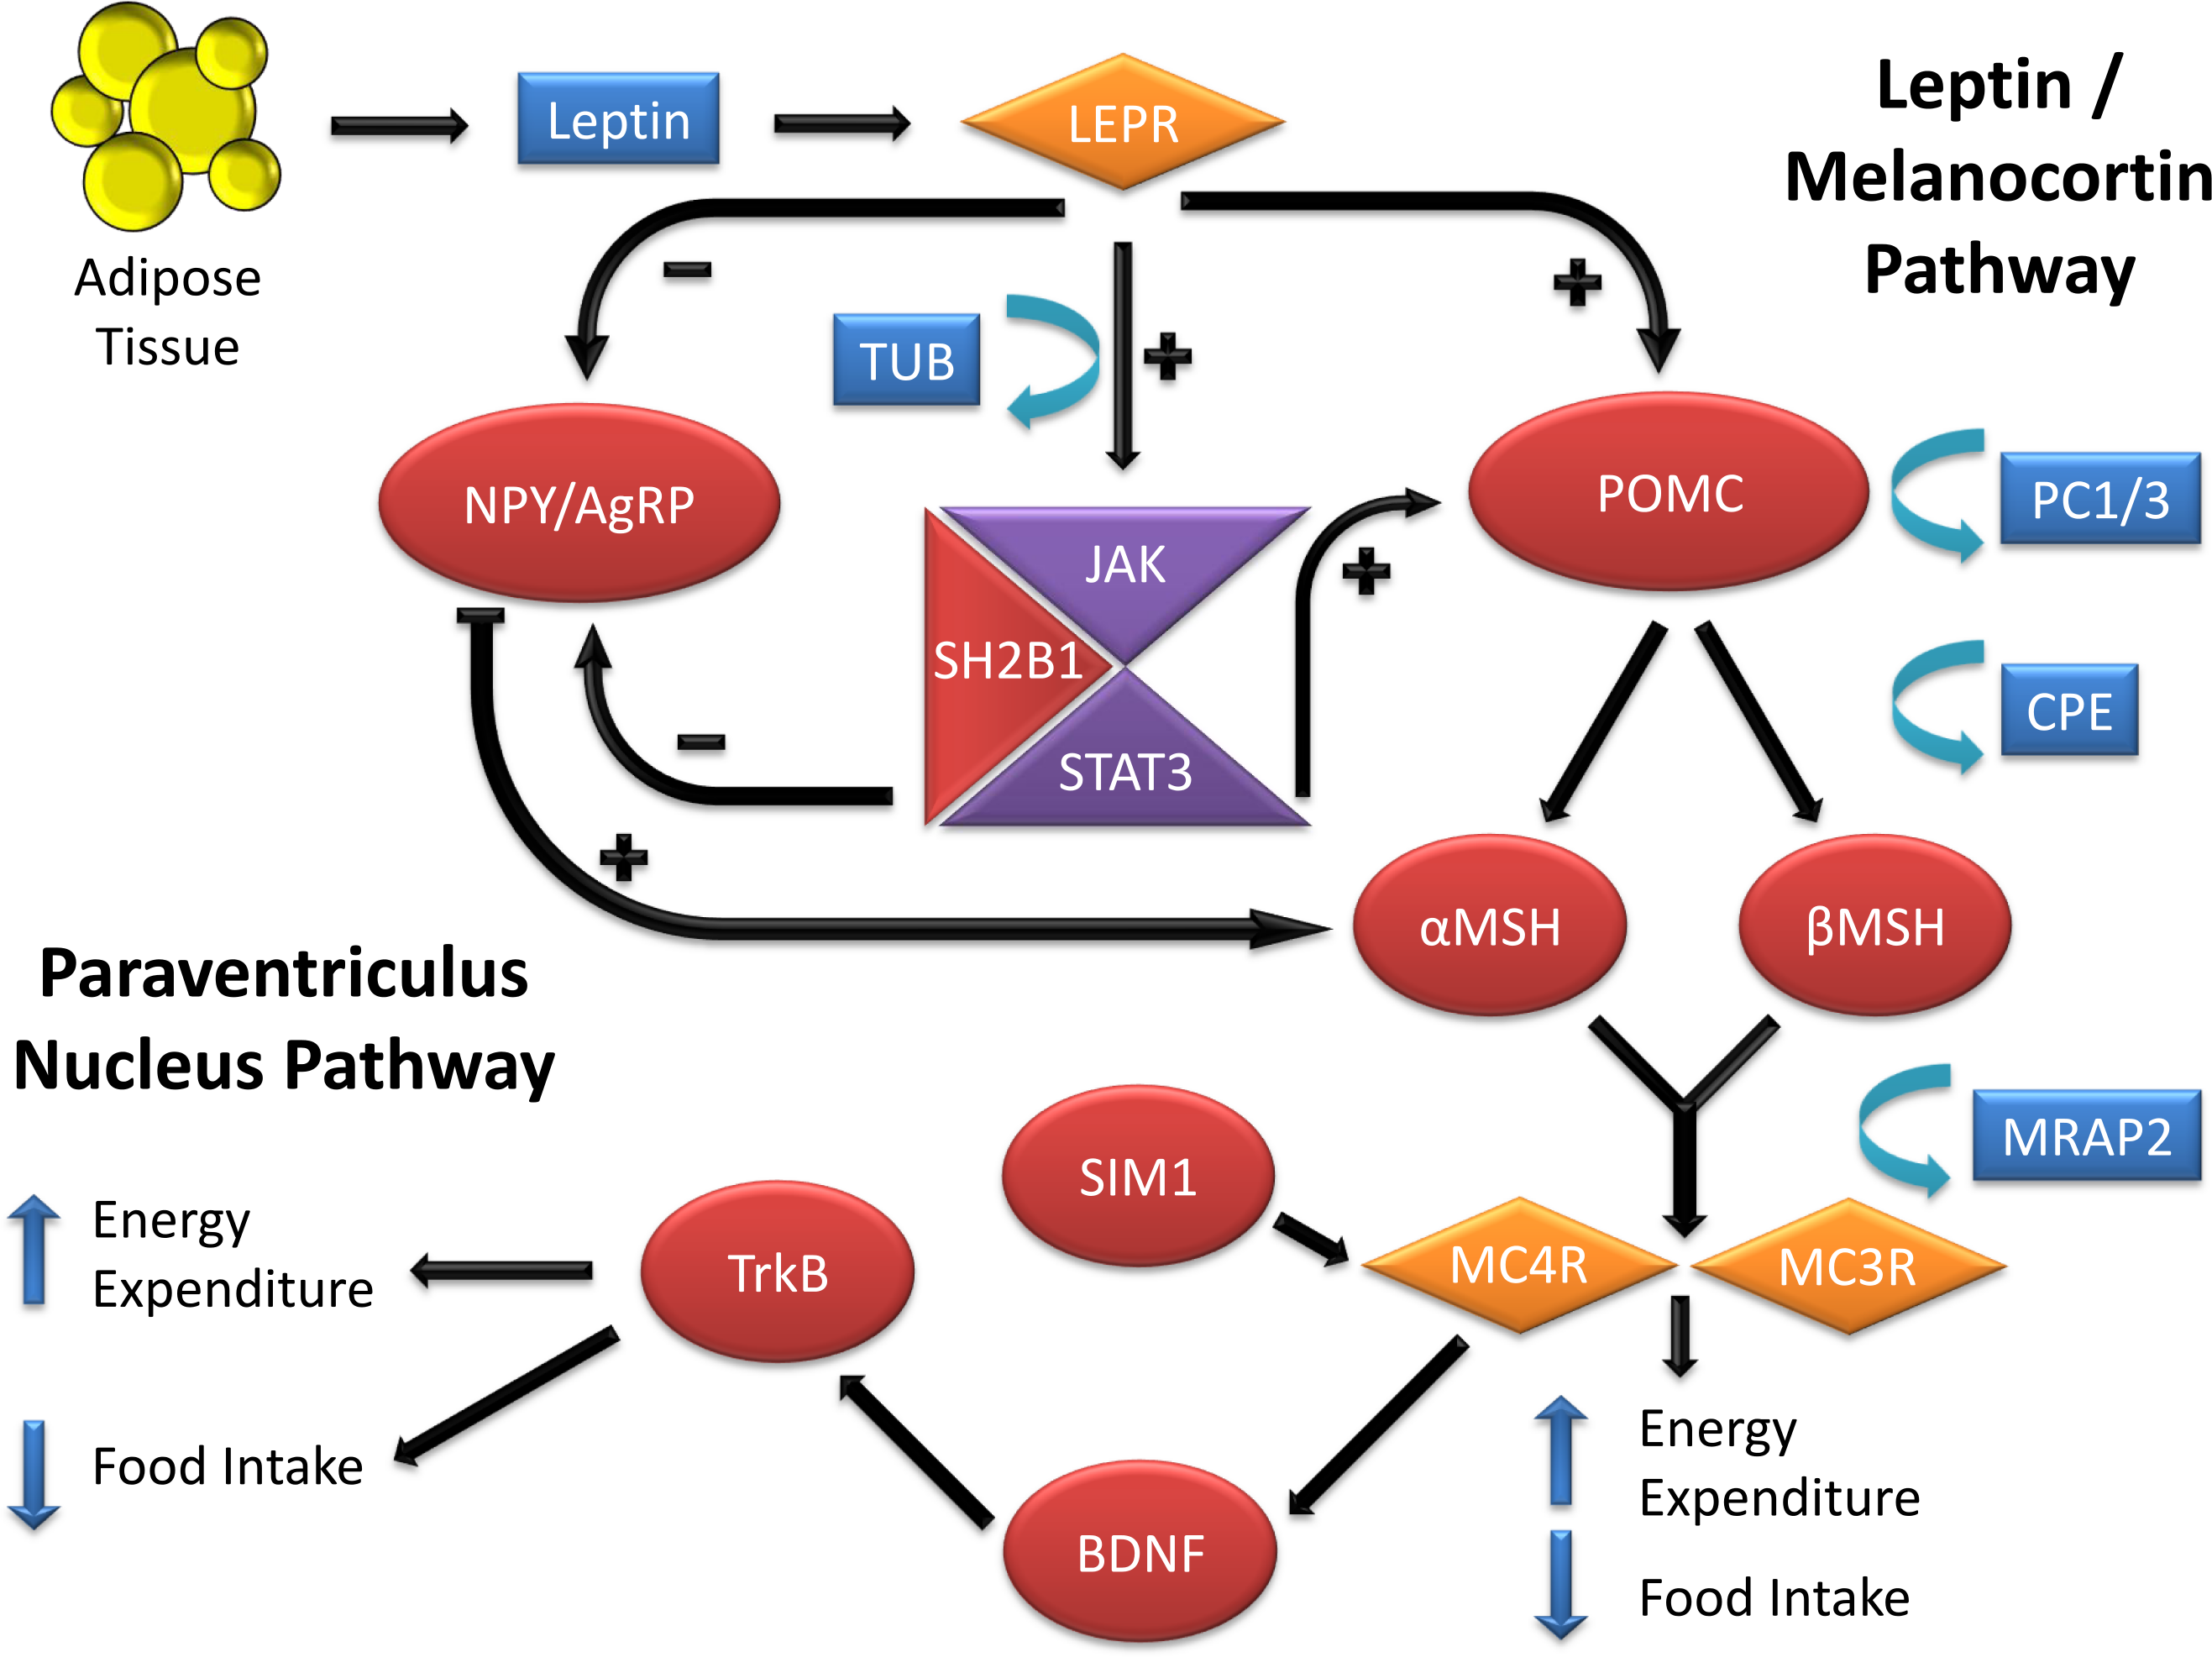
| Num | Cand. genes | Phenotypic details | Technique | Ref |
|---|---|---|---|---|
| 1 | ACADVL | Adult-onset fat mass gain | Knock-out | Exil, VJ. 2003. Circ Res |
| 2 | ADAR2 | Obesity under HFD* | Transgenic | Singh, M. 2007. J Biol Chem |
| 3 | ADRA1B | Accelerated weight gain on HFD | Knock-out | Burcelin, R. 2004. J Biol Chem |
| 4 | ADRA2A | Obesity in homozygous mutation | Transgenic | Valet, P. 2000. J Biol Chem |
| 5 | ADRB1 | Obesity | Knock-out | Bachman, ES. 2002. Science |
| 6 | ADRB2 | Obesity | Knock-out | Soloveva, V. 1997. Mol Endocrinol |
| 7 | ADRB3 | Obesity on HFD | Knock-out | Susulic, VS. 1995. J Biol Chem |
| 8 | AEBP1 | Obesity in females | Transgenic | Zhang, L. 2005. Mol Med |
| 9 | AGRP | Elevated weight gain & obesity | Transgenic | Ollman, MM. 1997. Science |
| 10 | ALMS1 | Obesity | Knock-out | Collin, GB. 2005. Hum Mol Genet |
| 11 | ALP1 | Accelerated weight gain on HFD | Knock-out | Narisawa, S. 2003. Mol Cell Biol |
| 12 | ANGPTL6 | Obesity and insulin resistance | Knock-out | Oike, Y. 2005. Nat Med |
| 13 | ANKRD26 | Obesity in homozygotes | Transgenic | Bera, TK. 2008. Acad Sci USA |
| 14 | APOB | Increased BW* | Knock-out | Siri, P. 2009. J Biol Chem |
| 15 | APOC3 | Obesity on HFD | Transgenic | Jong, MC. 2001. J Lipid Res |
| 16 | APOE | Obesity | Knock-out | Zhang, T. 2013. Reproduction |
| 17 | AQP7 | Adult-onset obesity | Knock-out | Hibuse, T. 2005. Proc Natl Acad Sci USA |
| 18 | AR | Obesity, decreased energy expenditure | Cre/LoxP | Fan, W. 2005. Diabetes |
| 19 | ASIP | Increased BW & Fat mass – Obesity | Transgenic | Mynatt, RL. 1997. Natl Acad Sci USA |
| 20 | AT2R | Increase in BW in females only | Knock-out | Samuel, P. 2013. PLoS One |
| 21 | ATX | Increase in adiposity in fat-specific knockout under HFD | Cre/LoxP | Dusaulcy, R. 2011. J Lipid Res |
| 22 | ATXN2 | Obesity under HFD | Knock-out | Kiehl, T. 2006. Biochem Biophys Res Commun |
| 23 | BBS1 | Adult-onset obesity in 10% of mutants | Knock-out | Kulaga, HM. 2004. Nat Genet |
| 24 | BBS2 | Adult-onset fat mass gain | Knock-out | Nishimura, DY. 2004. Proc Natl Acad Sci USA |
| 25 | BBS4 | Adult-onset obesity | Knock-out | Mykytyn, K. 2004. Proc Natl Acad Sci USA |
| 26 | BBS7 | Obesity | Knock-out | Zhang, Q. 2013. J Cell Sci |
| 27 | BDNF | Adult-onset obesity in heterozygotes | Knock-out | Coppola, V. 2004. Neuroreport |
| 28 | BRD2 | Obesity | Knock-out | Wang, F. 2009. Biochem J |
| 29 | BRS3 | Obesity | Knock-out | Ohki-Hamazaki, H. 1997. Nature |
| 30 | CAPN10 | Increase in body weight | Knock-out | Cheverud, JM. 2010. J Lipid Res |
| 31 | CART | Adult-onset obesity | Knock-out | Wierup, N. 2005. Regul Pept |
| 32 | CAV3 | Increased adiposity | Knock-out | Capozza, F. 2005. Am J Physiol Cell Physiol |
| 33 | CB2R | Increase in body weight and hyperphagia | Knock-out | Agudo, J. 2010. Diabetologia |
| 34 | CCKBR | Obesity | Knock-out | Lavine, J. 2010. Endocrinol |
| 35 | CDH2 | Increased adiposity | Transgenic | Castro, CH. 2004. J Cell Sci |
| 36 | CDKN1A (B) | Increased adiposity | Knock-out | Naaz, A. 2004. FASEB J |
| 37 | CEP19 | Obesity | Knock-out | Shalata, A. 2013. Am J Hum Genet |
| 38 | CHEMR23 | Adult-onset obesity | Knock-out | Rouger, L. 2013. J Endocrinol |
| 39 | CHGA | Increased adiposity | Knock-out | Bandyopadhyay, G. 2012. J Biol Chem |
| 40 | CHOP | Obesity under HFD | Knock-out | Grant, RW. 2014. J Biol Chem |
| 41 | CLOCK | Obesity | Knock-out | Turek, F. 2005. Science |
| 42 | CORIN | Increased bodyweight | Knock-out | Chan, JC. 2005. Proc Natl Acad Sci USA |
| 43 | CPE | Obesity | Knock-out | Cawley, NX. 2004. Endocrinology |
| 44 | CPT1 | Obesity under HFD | Knock-out | Gao, FX. 2009. Diabetologia |
| 45 | CRH | Excess fat accumulation & muscle atrophy | Transgenic | Stenzel-Poore, MP. 1992. Endocrinology |
| 46 | CRY (1/2) | Obesity under HFD | Knock-out | Barclay, JL. 2013. Am J Physiol Endorinol Metab |
| 47 | CSF2 | Adult-onset obesity | Knock-out | Reed, JA. 2005. J Clin Invest |
| 48 | CTRP9 | Increased bodyweight & adiposity | Knock-out | Wei, Z. 2014. Am J Physiol Endocrinol Metab |
| 49 | CYP19A1 | Elevated gonadal fat pad weight | Knock-out | Misso, ML. 2005. Horm Metab Res |
| 50 | D2 | Increased BW & adiposity | Knock-out | Marsili, A. 2011. PLoS One |
| 51 | DGAT1 | Increased gonadal but not subcutaneous fat | over-expression | Yamazaki, T. 2005. J Biol Chem |
| 52 | DPT | Increased subcutaneous fat | Knock-out | Takeda, U. 2002. J Invest Dermatol |
| 53 | DRD3 | Increased adiposity and obesity | Knock-out | McQuade, JA. 2004. Behav Brain Res |
| 54 | dup(17) | Obesity | Transgenic | Walz, K. 2003. Mol Cell Biol |
| 55 | ECSCR | Obesity under HFD | Transgenic | Akakabe, Y. 2013. Nat Commun |
| 56 | ESR1 | Obesity | Knock-out | Heine, PA. 2000. Proc Natl Acad Sci USA |
| 57 | FABP4 | Obesity in homozygotes under HFD | Knock-out | Hotamisligil, GS. 1996. Science |
| 58 | FATP4 | Obesity in homozygotes under HFD | Knock-out | Lenz, LS. 2011. J Biol Chem |
| 59 | FKBP51 | Increase in body weight under HFD | Transgenic | Yang, L. 2012. Am J Physiol Endocrinol Metab |
| 60 | FOXA2 | Heterozygotes develop obesity under HFD | Knock-out | Wolfrum, C. 2003. J Clin Invest |
| 61 | FOXO1 | Obesity | Transgenic | Kamei, Y. 2004. J Biol Chem |
| 62 | FOXO3A | Obesity | Knock-out | Fang, C. 2008. Am J Physiol |
| 63 | FSHR | Obesity | Knock-out | Danilovich, N. 2000. Endocrinology |
| 64 | FTO | Obesity | Over-expression | Church, C. 2010. Nat Genet |
| 65 | GAL-3 | Late-onset obesity | Knock-out | Pang, J. 2013. PLoS One |
| 66 | GAST | Obesity | Knock-out | Cowey, SL. 2005. Cancer |
| 67 | GCK | Increased BW under HFD | Transgenic | Ferre, T. 2003. Diabetologia |
| 68 | GDF3 | Increased BW under HFD | Over-expression | Wang, W. 2004. Biochem Biophys Res Commun |
| 69 | GFPT1 | Increased adiposity | Transgenic | McClain, DA. 2005. Am J Physiol Endocrinol Metab |
| 70 | GH | Obesity | Transgenic | Pomp, D. 1996. Transgenic Res |
| 71 | GHR | Increased adiposity in males | Knock-in | Rowland, JE. 2005. Mol Cell Bio |
| 72 | GHRH | Increased adiposity | Transgenic | Cai, A. 1999. Endocrinology |
| 73 | GIRK4 | Increased BW & adiposity | Knock-out | Perry, CA. 2008. Proc Natl Acad Sci USA |
| 74 | GNAS | Maternal inheritance of mutant allele leads to obesity | Knock-out | Germain-Lee, EL. 2005. Endocrinology |
| 75 | GNB3 | Increased BW and adiposity | Transgenic | Goldlust, S. 2013. Proc Natl Acad Sci USA |
| 76 | GPD2 | Increased BW & adiposity in females | Knock-out | Alfadda, A. 2004. Am J Physiol Regul Integr Comp Physiol |
| 77 | GPR10 | Adult-onset obesity | Knock-out | Ishii, M. 2003. Proc Natl Acad Sci USA |
| 78 | GPR120 | Obesity under HFD | Knock-out | Hirasawa, A. 2005. Nat Med |
| 79 | GPR26 | Obesity | Knock-out | Chen, D. 2012. PLoS One |
| 80 | GPR39 | Obesity | Knock-out | Moechars, D. 2006. Gastroenterology |
| 81 | GPR7 | Adult-onset obesity | Knock-out | Gu, W. 2004. J Mol Neurosci |
| 82 | GPX1 | Increased BW & adiposity | Transgenic | McClung, JP. 2004. Proc Natl Acad Sci USA |
| 83 | GRM8 | Increased adiposity | Knock-out | Duvoisin, RM. 2005. Eur J Neurosci |
| 84 | GRP | Resistant to diet-induced obesity | Knock-out | Ye, R. 2010. Diabetes |
| 85 | GRPR | Reduced food intake | Knock-out | Hampton, LL. 1998. Proc Natl Acad Sci USA |
| 86 | GSK3B | Increased BW & adiposity in males | Transgenic | Pearce, NJ. 2004. Metabolism |
| 87 | HDC | Increased BW & adiposity | Knock-out | Hara, J. 2001. Neuron |
| 88 | HIF1α | Obesity | Transgenic | Zhang, X. 2010. J Biol Chem |
| 89 | HRH1 | Late onset obesity | Knock-out | Masaki, T. 2004. Diabetes |
| 90 | HRH3 | Increased BW & adiposity | Knock-out | Takahashi, K. 2002. J Clin Invest |
| 91 | HSD1-11β | Obesity | Transgenic | Zhang, L. 2012. Transgenic Res |
| 92 | HSD11β2 | Increased adiposity | Transgenic | Masuzaki, H. 2001. Science |
| 93 | HTR2C | Late onset obesity | Knock-out | Nonogaki, K. 2003. Diabetes |
| 94 | ICAM1 | Late onset obesity/accelerated under HFD | Knock-out | Gregiore, FM. 2002. AM J Physiol Endocrinol Metab |
| 95 | IDH1 | Obesity | Transgenic | Koh, HJ. 2004. J Biol Chem |
| 96 | IFRD1 | Increased adiposity | Transgenic | Wang, Y. 2005. J Biol Chem |
| 97 | IL18 | Increased BW | Knock-out | Netea, M. 2006. Nature Medicine |
| 98 | IL18R | Increased BW | Transgenic | Netea, M. 2006. Nature Medicine |
| 99 | IL-1RI | Adult-onset obesity | Knock-out | McGillicuddy, FC. 2013. Am J Physiol Endocrinol Metab |
| 100 | IL6 | Increased BW & adiposity | Knock-out | Wallenius, V. 2002. Nat Med |
| 101 | INSR | Increased adiposity & obesity | Cre/LoxP | Cariou, B. 2004. Endocrinol |
| 102 | IRS1 | Increase weight gain | Knock-out | Shirakami, A. 2002. J Endocrinol |
| 103 | IRS2 | Increased adiposity | Cre/LoxP | Lin, X. 2004. J Clin Invest |
| 104 | JAK2 (Adipose) | Increased adiposity | Cre/LoxP | Sy, S. 2014. Diabetalogia |
| 105 | KCNJ11 | Increased BW & adiposity | Knock-out | Kanezaki, Y. 2004. Endocr J |
| 106 | KDM3A | Obesity | Knock-out | Okada, Y. 2010. J Androl |
| 107 | KRAS | Obesity under HFD | Transgenic | Dawson, DW. 2013. Cancer Prev Res |
| 108 | KSR2 | Obesity | Knock-out | Revelli, JP. 2011. Obesity |
| 109 | LEP | Obesity | Knock-out | D’Souza, AM. 2014. Endocrinol |
| 110 | LEPR | Obesity | Knock-in | Bates, SH. 2003. Nature |
| 111 | LH (B) | Obesity in females | Transgenic | Kero, JT. 2003. Am J Physiol Endocrinol Metab |
| 112 | LIPC | Increased adiposity | Knock-out | Farahani, P. 2004. Obes Res |
| 113 | LPIN1 | Obesity due to increased fat storage | Transgenic | Phan, J. 2005. Cell Metab |
| 114 | LRH-1 | Mild obesity | Knock-out | Hattori, T. 2014. Endocr J |
| 115 | LSR | Obesity in heterozygotes | Transgenic | Yen, FT. 2008. J Biol Chem |
| 116 | MAGEL2 | Increased BW & adiposity | Knock-out | Bischof, JM. 2007. Hum Mol Genet |
| 117 | MAGP-1 | Increased BW & adiposity | Knock-out | Weinbaum, JS. 2008. J Biol Chem |
| 118 | MAS | Increased adiposity | Knock-out | Santos, SH. 2008. Diabetes |
| 119 | MC3R | Obesity | Knock-out | Butler, AA. 2000. Endocrinolopgy |
| 120 | MC4R | Obesity | Knock-out | Huszar, D. 1997. Cell |
| 121 | MED13 | Obesity | Cre/LoxP | Grueter, C. 2012. Cell |
| 122 | MEST | Increased adiposity | Transgenic | Takahashi, M. 2005. Am J Physiol Endocrinol Metab |
| 123 | MKKS | Obesity | Knock-out | Fath, MA. 2005. Hum Mol Genet |
| 124 | MMP11 | Obesity | Knock-out | Andarawewa, KL. 2005. Cancer Res |
| 125 | MMP19 | Accelerated weight gain on HFD | Knock-out | Pendas, AM. 2004. Mol Cell Biol |
| 126 | MPO | Increased BW | Transgenic | Castellani, LW. 2006. J Lipid Res |
| 127 | MRAP2 | Obesity | Knock-out | Asai, M. 2013. Science |
| 128 | MT1A (B) | Adult-onset obesity | Knock-out | Beattie, JH. 1998. Proc Natl Acad Sci USA |
| 129 | MT-HGH | Obesity | Transgenic | Wolf, E. 1991. Growth Dev Aging |
| 130 | NBEA | Increased BW & adiposity in heterozygotes | Knock-out | Olszewski, P. 2012. PLoS Genet |
| 131 | NEIL1 | Obesity | Knock-out | Sampath, H. 2011. Am J Physiol Endocrinol Metab |
| 132 | NEP | Adult-onset obesity | Knock-out | Becker, M. 2010. PLoS One |
| 133 | NGN3 | Obesity | Knock-out | Anthwal, N. 2013. Dis Model Mech |
| 134 | NHLH2 | Adult-onset obesity | Knock-out | Jing, E. 2004. Endocrinology |
| 135 | NMU | Increased BW & adiposity | Knock-out | Handa, R. 2004. Nat Med |
| 136 | NPB | Mild obesity | Knock-out | Kelly, MA. 2005. Proc Natl Acad Sci USA |
| 137 | NPC1 | Dose-dependent weight gain under HFD | Knock-out | Jelinek, D. 2010. Obesity |
| 138 | NPY | Obesity under high-sucrose diet | Transgenic | Kaga, T. 2001. Diabetes |
| 139 | NPY1R | Obesity | Knock-out | Kushi, A. 1998. Proc Natl Acad Sci USA |
| 140 | NPY2R | Obesity | Knock-out | Lin, D. 2006. Endocrinol |
| 141 | NPY5R | Increased adiposity | Knock-out | Marsh, DJ. 1998. Nat Med |
| 142 | NR5A1 | Adult-onset obesity | Knock-out | Majdic, G. 2002. Endocrinol |
| 143 | NTSR1 | Adult-onset obesity | Knock-out | Remaury, A. 2002. Brain Res |
| 144 | OGG1 | Increased adiposity in HFD | Knock-out | Sampath, H. 2012. PLoS One |
| 145 | OMA1 | Obesity | Knock-out | Quiros, PM. 2012. EMBO |
| 146 | OSMRβ | Increase in BW and hyperphagia | Knock-out | Gotardo, EM. 2013. J Nutr Sci Vitaminol |
| 147 | OXT | Obesity | Knock-out | Nishimori, K. 2008. Prog Brain Res |
| 148 | P62 | Adult-onset obesity and hyperphagia | Knock-out | Harada, H. 2013. J Neurosci |
| 149 | PARP1 | Adult-onset obesity | Knock-out | Devalaraja-Narashimha, K. 2010. J Endocrinol |
| 150 | PC1/3 | Increased adiposity in heterozygotes | Knock-out | Zhu, X. 2002. Proc Natl Acad Sci USA |
| 151 | PCK1 | Obesity | Transgenic | Franckhauser, S. 2002. Diabetes |
| 152 | PCSKIN | Adult-onset obesity | Transgenic | Wei, S. 2004. J Endocrinol |
| 153 | PCYT2 | Obesity | Knock-out | Fullerton, MD. 2009. J Biol Chem |
| 154 | PEG3 | Obesity | Knock-out | Curley, JP. 2005. FASEB J |
| 155 | PGC-1α | Obesity | Knock-out | Leone, TC. 2005. PLoS Biol |
| 156 | PGDS | Obesity | Knock-out | Tanaka, R. 2009. Biochem Biophys Res Commun |
| 157 | PGP | Increased BW & adiposity | Knock-out | Foucaud-Vignault, M. 2011. PLoS One |
| 158 | PHB | Obesity | Transgenic | Ande, SR. 2014. Diabetes |
| 159 | PI3K (p110α) | Increased adiposity, hyperphagia | Knock-in | Foukas, L. 2006. Nature |
| 160 | PLAC 8 | Increase in adiposity | Knock-out | Jimenez-Preitner, M. 2011. Cell Metab |
| 161 | PLSCR1 | Increased adiposity | Knock-out | Zhou, Q. 2002. Blood |
| 162 | PLSCR3 | Increased BW & adiposity | gene-trap | Wiedmer, T. 2004. Proc Natl Acad Sci USA |
| 163 | POMC | Obesity under HFD | Knock-out | Challis, BG. 2004. Proc Natl Acad Sci USA |
| 164 | PPARA | Increase in adiposity | Knock-out | Miyazaki, M. 2004. J Biol Chem |
| 165 | PPARG2 | Obesity under HFD | Knock-in | Heikkinen, S. 2009. Cell Metab |
| 166 | PPARGC1A | Increased adiposity in young females & old males | Knock-out | Leone, TC. 2005. PLoS Biol |
| 167 | PPARδ | Obesity under HFD | Knock-out | Kocalis, H. 2012. PLoS One |
| 168 | PPIF | Late-onset obesity | Knock-out | Luvisetto, S. 2008. Neurosci |
| 169 | PPIR3A | Increased BW & adiposity | Knock-out | Delibegovic, M. 2003. Diabetes |
| 170 | PPKAA2 | Increased adiposity | Knock-out | Villena, JA. 2004. Diabetes |
| 171 | PREF1 | Obesity | Knock-out | Moon, YS. 2002. Mol Cell Biol |
| 172 | PRKCQ | Obesity | Transgenic | Serra, C. 2003. J Cell Physiol |
| 173 | PRL | Increased BW | Knock-out | Perez-Villamil, B. 1992. J Endocrinol |
| 174 | PROX1 | Obesity in heterozygotes | Knock-out | Harvey, NL. 2005. Nat Genet |
| 175 | PRRP | Increased BW | Knock-out | Lawrence, C. 2002. Endocrinol |
| 176 | PTPN11 | Obesity | Knock-out | Zhang, EE. 2004. Proc Natl Acad Sci USA |
| 177 | PYY | Obesity | Knock-out | Batterham, R. 2002. Nature |
| 178 | RAGE | Increased BW | Knock-out | Leuner, B. 2012. Z Gerentol Geriatr |
| 179 | RAI1 | Obesity in heterozygotes | Knock-out | Bi, W. 2005. Hum Mol Genet |
| 180 | REN | Adult-onset obesity | Transgenic | Uehara, S. 2003. Int J Mol Med |
| 181 | RETN | Increased adiposity | Transgenic | Kim, KH. 2004. Proc Natl Acad Sci USA |
| 182 | RPGRIP1L | Obesity | Knock-out | Vadnais, C. 2013. BMC Genomics |
| 183 | RSC1A1 | Obesity | Knock-out | Osswald, C. 2005. Mol Cell Biol |
| 184 | RSL1 | Females prone to diet-induced obesity | Transgenic | Krebs, CJ. 2014. Mol Cell Biol |
| 185 | SAR1B | Obesity under HFD | Transgenic | Levy, E. 2014. J Nutr Biochem |
| 186 | SDC1 | Adult-onset obesity | Transgenic | Reizes, O. 2001. Cell |
| 187 | SELM | Increased BW & adiposity | Transgenic | Pitts, MW. 2013. J Biol Chem |
| 188 | SFRP1 | Increase in BW and adiposity under HFD | Knock-out | Gauger, KJ. 2013. PLoS One |
| 189 | SH2B | Obesity | Knock-out | Ren, D. 2005. Cell Metab |
| 190 | SHP | Obesity and increased adiposity | Transgenic | Tabbi-Anneni, I. 2010. Am J Physiol Endocrinol Metab |
| 191 | SIM1 | Obesity in heterozygotes | Knock-out | Michaud, JL. 2001. Hum Mol Genet |
| 192 | SIRT6 | Adult-onset obesity | Transgenic | Schwer, B. 2010. PNAS |
| 193 | SLC2A4 | Increased adiposity | Transgenic | Carvalho, E. 2005. Am J Physiol Endocrinol Metab |
| 194 | SLC6A1 | Obesity | Transgenic | Ma, YH. 2000. Cell Res |
| 195 | SOCS1 | Liver degeneration, obesity | Knock-out | Starr, R. 1998. Proc Natl Acad Sci USA |
| 196 | SOCS3 | Obesity under HFD | Knock-out | Sachithanandan, N. 2010. Hepatology |
| 197 | SPARC | Increased adiposity | Knock-out | Bradshaw, AD. 2003. Proc Natl Acad Sci USA |
| 198 | SPONDIN 2 | Obesity | Knock-out | Zhu, LH. 2014. J Hepatol |
| 199 | SRC-1 | Obesity | Knock-out | Picard, F. 2002. Cell |
| 200 | STAT3 | Obesity | Cre/LoxP | Cui, Y. 2004. Mol Cell Biol |
| 201 | STAT5B | Increased adiposity | Knock-out | Gao, Q. 2004. Proc Natl Acad Sci USA |
| 202 | TAp63 | Obesity | Knock-out | Su, X. 2012. Cell Metab |
| 203 | T-BET | Obesity | Knock-out | Kim, K. 2013. J Nutr Biochem |
| 204 | THRA | Increased BW & adiposity | Knock-out | Udy, GB. 1997. Proc Natl Acad Sci USA |
| 205 | TIMP-2 | Obesity and hyperphagia | Knock-out | Stradecki, HM. 2011. J Neuroendocrinol |
| 206 | TIS7 | Increased BW & adiposity | Transgenic | Wang, Y. 2005. J Biol Chem |
| 207 | TNF | Increased BW & adiposity | Transgenic | Liu, YY. 2003. J Biol Chem |
| 208 | TNF-α | Increased BW & adiposity | Knock-out | Salles, J. 2012. J Nutr Biochem |
| 209 | TRKβ | Increased BW & adiposity | Knock-in | Byerly, MS. 2013. PLoS One |
| 210 | TRPV4 | Increased BW & adiposity | Knock-out | O’Conor, J. 2013. Ann Rheum Dis |
| 211 | TUB | Adult-onset obesity | Knock-out | Voros, G. 2004. J Thromb Haemost |
| 212 | TW | Obesity in heterozygotes | Knock-out | Kurima, K. 2011. PLoS Genet |
| 213 | TXNIP | Increased fat to muscle ratio | Knock-out | Stubdal, H. 2000. Mol Cell Biol |
| 214 | UCP1 | Late-onset obesity with HFD | Knock-out | Kontani, Y. 2005. Aging Cell |
| 215 | VDR | Obesity | Transgenic | Wong, KE. 2011. J Biol Chem |
| 216 | WDTC1 | Obesity in heterozygotes | Knock-out | Hader, T. 2003. EMBO |
| 217 | XOR | Increased BW & adiposity | Knock-out | Murakami, N. 2014. Arterioscler Thromb Vasc Biol |
| 218 | ZEB1 | Obesity | Knock-out | Saykally, JN. 2009. PLoS One |
| 219 | ZFP90 | Obesity | Transgenic | Schadt, EE. 2005. Nat Gen |
| 220 | ZNT7 | Obesity in males only | Knock-out | Huang, L. 2012. J Biol Chem |
| 221 | ZNT8 | Obesity under HFD | Knock-out | Lemaire. K, 2009. Proc Natl Acad Sci USA |
Notes:
Leptin (LEP) and Leptin Receptor (LEPR)
The obese (ob) mutation was first described in 1949 by a team from Jackson Laboratory (Coleman & Hummel, 1973; Kanasaki & Koya, 2011). The ob mutation originated in non-inbred heterogeneous stock, but was subsequently transferred onto various inbred strains for further analysis (Clee & Attie, 2007; Coleman & Hummel, 1973; Coleman, 1982). This model exhibits morbid obesity associated with hyperphagia and hyperglycemia along with other neuroendocrine abnormalities (Coleman & Hummel, 1973; Coleman, 1982). Elegant parabiosis studies demonstrated that the obese gene encodes a circulating factor, while the diabetes gene encodes its receptor (Coleman, 1973). Through ground-breaking positional cloning studies, the ob mutation was characterized as a single-base deletion which results in a premature stop codon in the previously unknown leptin gene (Zhang et al., 1994). This landmark study was the first to identify this hormone and largely initiated research efforts on adipokines.
The diabetes (db) mutation was identified in 1966 in the C57BL/KsJ inbred mouse strain (Coleman & Hummel, 1967; Hummel, Dickie & Coleman, 1966). This mouse model exhibits persistent hyperphagia and obesity, resulting in hyperleptinemia, insulin resistance and increased leptin levels (Coleman & Hummel, 1967). Positional cloning and related studies identified the diabetes (db) mutation in the leptin receptor gene (Chen et al., 1996; Tartaglia et al., 1995).
After the discovery of leptin, a mutation in the leptin gene (LEP) was discovered in two severely obese cousins within a highly consanguineous family of Pakistani origin (Montague et al., 1997). The mutation was characterized as a frameshift mutation resulting in truncated transcription of leptin (Montague et al., 1997). Other reports have confirmed this initial discovery in additional homozygous patients of Pakistani, Turkish and Egyptian origin (Gibson et al., 2004; Mazen et al., 2009). In a study in Pakistan, where consanguineous marriages are preferred, 16.1% of the probands from 62 unrelated children with early onset obesity exhibited mutations in LEP. Of these probands, 9 carried a homozygous frameshift mutation. Given the high prevalence of monogenic obesity in this consanguineous population, early detection of this mutation for counselling and management of obesity could be beneficial (Saeed et al., 2012).
Similarly, shortly after its identification in mice, congenital leptin receptor (LEPR) deficiencies were found in severe obese siblings in 1998 (Clément et al., 1998). In a more recent study, 8 other patients with severe early onset obesity with homozygous or compound heterozygous mutations in LEPR were identified (Farooqi et al., 2007a; Farooqi et al., 2007b; Farooqi et al., 2007c). These patients exhibited high serum levels of leptin and loss of sensitivity of the receptor (Farooqi et al., 2007a; Farooqi et al., 2007b; Farooqi et al., 2007c).
Patients with mutations in LEP or LEPR experience rapid weight gain within the first year of life (Farooqi et al., 2002). Patients all experience hyperphagia and display aggression when food is denied (Farooqi et al., 2002). Onset of puberty is often delayed for these patients, due to hypogonadotrophic hypogonadism (Farooqi et al., 2007a; Farooqi et al., 2007b; Farooqi et al., 2007c). Leptin deficient children exhibit defective T-cell mediated immunity, explaining the high rates of infection and mortality in developing countries (Farooqi et al., 2007a; Farooqi et al., 2007b; Farooqi et al., 2007c).
The role of leptin in energy homeostasis has also been demonstrated in studies employing novel tools for genetic studies, such as whole exome sequencing. For example, whole exome sequencing was conducted in extreme obese individuals from four consanguineous families to determine the role of rare coding variants in pathogenesis of obesity (Gill et al., 2014). The study found two novel frameshift mutations (p.C186AfsX27 and p.H160LfsX9) that truncate the LEPR protein, resulting in protein products that lack the necessary binding domain for leptin signaling (Gill et al., 2014).
Considering the symptoms associated with leptin deficiency, the impact of leptin deficiency in the body is reversible via leptin treatment. A 9-year-old girl with leptin deficiency experienced reduction in weight mainly due to loss of fat, reduced energy intake, and increase in gonadotropin concentrations after treatment with recombinant human leptin for 12 months (Farooqi et al., 1999). In a different study, leptin-deficient patients in a fed state gave higher ratings to food images, but these ratings were reduced after leptin treatment (Farooqi et al., 2007a). As a result of these findings, leptin treatment has been deemed a promising therapeutic option for leptin deficient patients. It should be noted however that normal leptin levels do not preclude the presence of a deleterious mutation. A recent study described a 2-year-old boy with a deleterious leptin mutation with normal leptin levels (Wabitsch et al., 2015). This mutation had an impact on the protein function rather than expression, which questions the reliability of leptin levels as a prescreening tool for detecting leptin mutation.
TUB
Tubby bipartite transcription factor (TUB) is a member of the tubby-like proteins, which present a highly conserved C-terminus domain (Carroll, Gomez & Shapiro, 2004). TUB is a substrate for insulin receptor tyrosine kinase (IRTK) and leptin receptor Janus kinase 2 (LEPR JAK2) in the hypothalamus. TUB is translocated to the nucleus after binding to LEPR via JAK2. Inhibition of TUB expression in the hypothalamus results in increased food intake, fasting glucose levels, hepatic glucose output, decreased oxygen consumption, and reduced sensitivity of POMC to leptin (Prada et al., 2013). A mutation in the tubby gene occurred spontaneously at the Jackson Laboratory in a C57BL/6J mouse (Coleman & Eicher, 1990). These mice developed milder obesity compared to the other mutant models, hyperinsulinemia and mild hypoglycemia (Coleman & Eicher, 1990). Positional cloning of the mutated tubby gene identified a single-base change in the splice donor site that results in the incorrect retention of a single intron in the mature tub mRNA transcript (Kleyn et al., 1996).
Mutations in TUB were observed in an eleven-year-old boy from a consanguineous Caucasian family. His symptoms included deteriorating vision, obesity, and normal glucose/cholesterol/triglycerides levels but other clinical features were not observed to classify the patient as Bardet-Biedl or Alström syndrome (Borman et al., 2014). The mutation was identified as a homozygous frameshift mutation in TUB (c.1194_1195delAG, p.Arg398Serfs*9), which results in a truncated form of TUB. Homozygous loss of function of TUB is extremely rare in humans (Borman et al., 2014).
MC4R
The melanocortin-4 receptor (Mc4r) model was identified in 1997 through targeted gene disruption (Huszar et al., 1997). MC4R is a G protein couple receptor mainly expressed in the brain that is involved in both energy intake and expenditure (Gantz et al., 1993; Huszar et al., 1997). Mc4r−/− mice exhibit obesity, hyperphagia, hyperinsulinemia, hyperglycemia, and increased linear growth (Huszar et al., 1997). Comparatively, Mc4r+/− mice display milder forms of obesity, with increased weight gain in response to high-fat diet, suggesting a gene-dosage effect (Srisai et al., 2011).
The first heterozygous mutation in MC4R discovered in humans was in 1998 (Vaisse et al., 1998; Yeo et al., 1998). MC4R mutations represent the most common form of human monogenic obesity, impacting 0.2–5.6% of individuals with severe early onset obesity (Rouskas et al., 2012). Majority of these mutations are heterozygous, with homozygous mutants having a fully penetrant early-onset severe form of obesity. Not all heterozygote mutants are obese however, which is indicative of the dosage effect described previously in the mouse models (Farooqi et al., 2003; Stutzmann et al., 2008). In addition to obesity, MC4R deficient children display hyperinsulinemia and increased linear growth (Farooqi et al., 2000). Also patients experience an increase in adiposity, as well as an increase in lean mass, which is a phenotype that is not observed in other forms of monogenic obesity (Farooqi et al., 2003). Interestingly, the degree of hyperphagia in patients depends on level of receptor dysfunction, which is generally lower than that of leptin deficient patients (Farooqi et al., 2003).
MC3R
Both melanocortin receptor 3 (MC3R) and MC4R are expressed in the hypothalamus and are involved in energy homeostasis (Roselli-Rehfuss et al., 1993). Mc3r deficient mice exhibit 50–60% more adipose mass and 50% reduction in energy expenditure (Butler et al., 2000). Mc3r deficient mice are also hyperleptinaemic and male Mc3r−/− mice develop mild hyperinsulinemia (Chen et al., 2000). Mice lacking both Mc3r and Mc4r become significantly heavier than either mutation alone, suggesting that Mc3r and Mc4r have non-redundant roles in energy homeostasis (Chen et al., 2000).
While the role of MC4R in monogenic obesity is well-defined, the role of MC3R mutations in human monogenic obesity is debated (Zegers, Beckers & Hendrickx, 2013). Although mutations in the MC3R gene may not be involved in autosomal dominant form of monogenic obesity, these mutations could predispose humans to increased risk of obesity. MC3R mutations that result in defective receptors have been associated with obesity in French and Italian populations (Mencarelli et al., 2011). A non-significant two-fold enrichment in MC3R loss-of-function mutations was observed in a severe obese population from United States (Calton et al., 2009).
POMC
The pro-opiomelanocortin (Pomc) derived peptides have a variety of biological functions, such as pigmentation, adrenocortical function, and energy stores (Smith & Funder, 1988). Figure 2 is a depiction of POMC-derived peptides, including α and β-MSH. Deleting the coding region of Pomc in mouse models resulted in obesity, defective adrenal development and altered pigmentation (Yaswen et al., 1999).
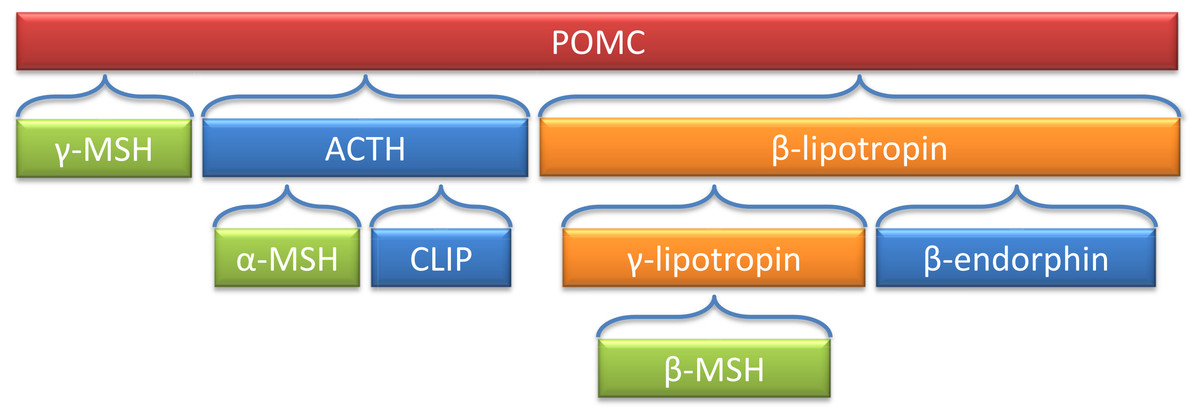
Figure 2: Processing of the POMC precursor protein.
Adrenocorticotropic hormone (ACTH) and β-lipotropin are products generated in the corticotrophic cells of the anterior pituitary under the control of corticotropin releasing hormone (CRH). Alpha-melanocyte stimulating hormone (α-MSH), corticotropin-like intermediate lobe peptide (CLIP), γ-lipotropin and β-endorphin are products generated in the intermediate lobe of the pituitary under the control of dopamine. α-, β- and γ-MSH are collectively referred to as melanotropin or intermedin.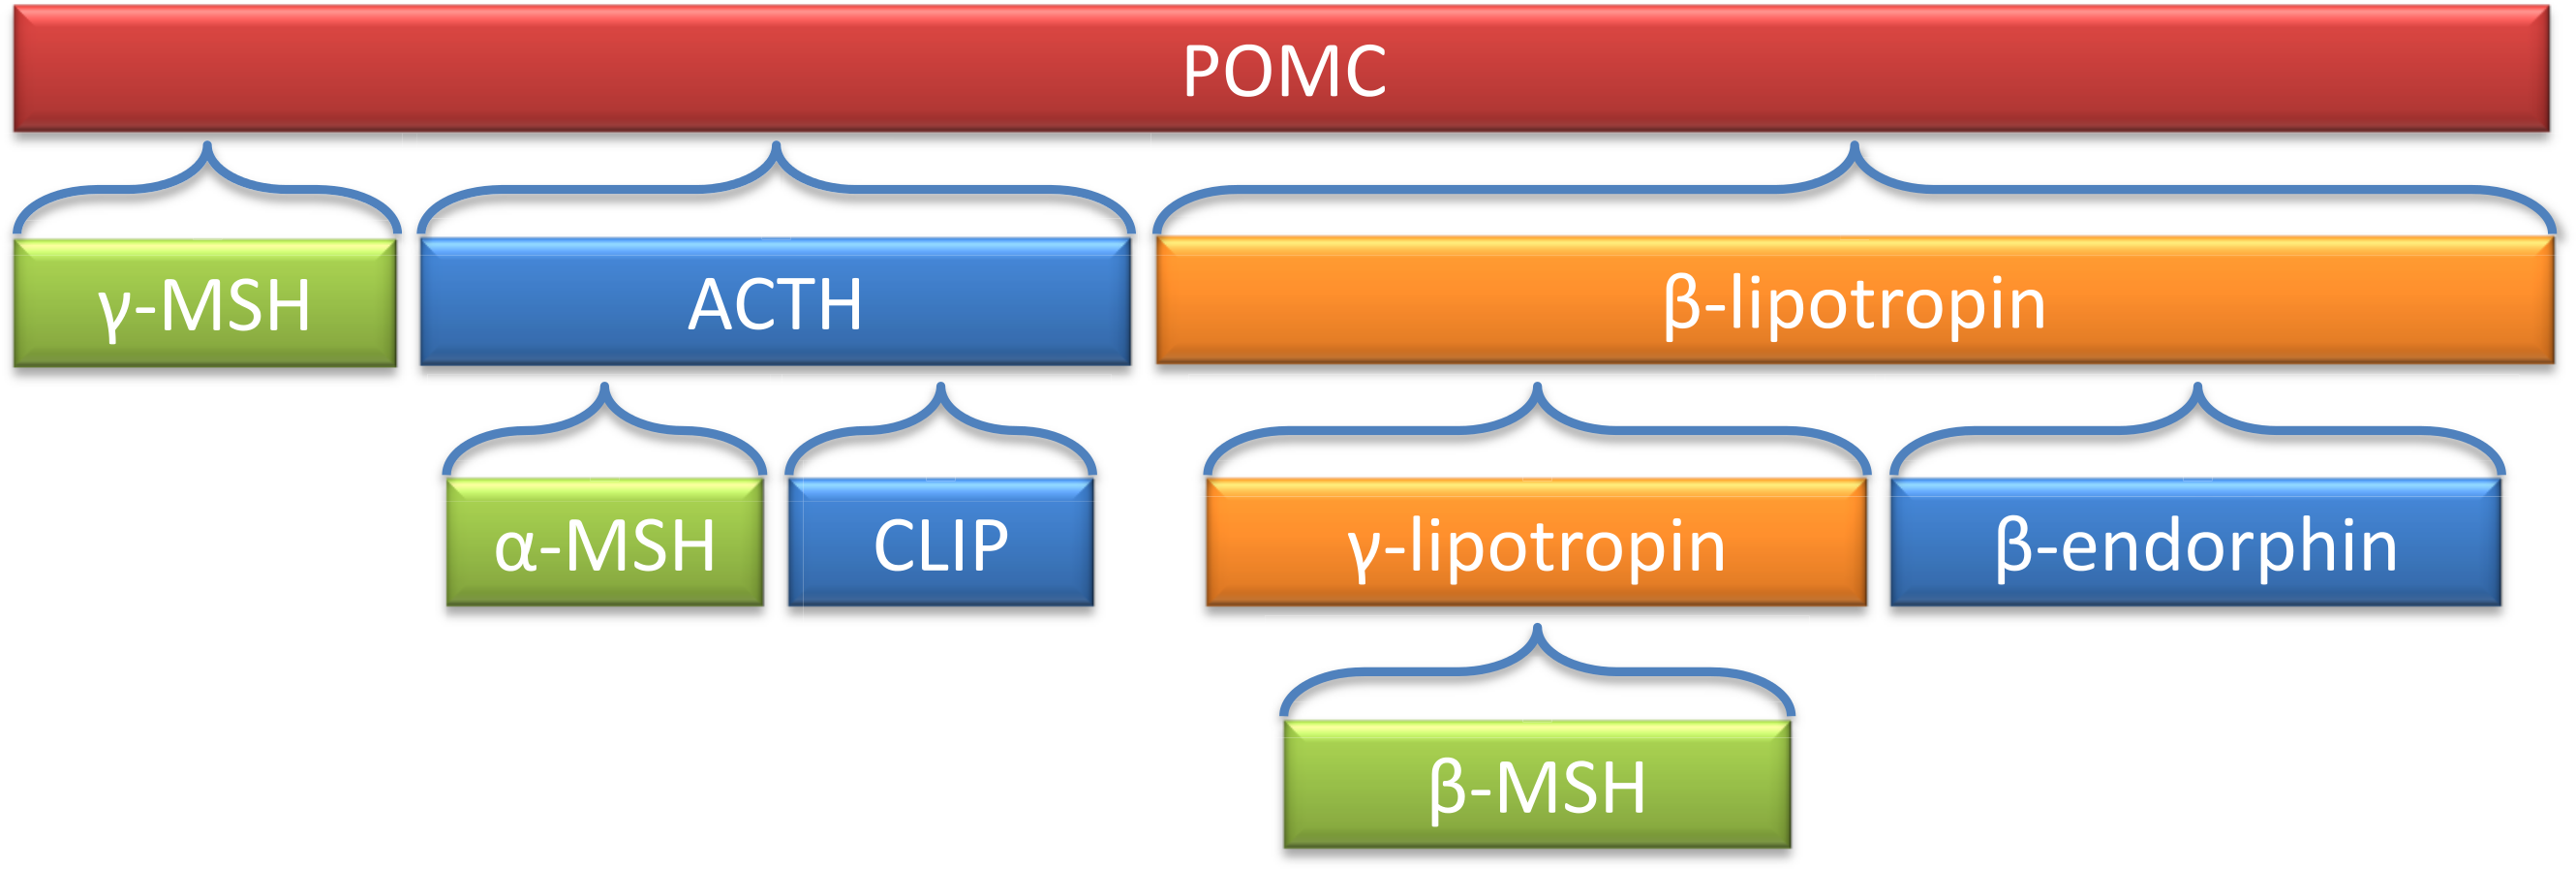
Interest in the melanocortin pathway stemmed from the studies of agouti mice. Mouse coat color was a trait studied by the mouse model experts whose stocks founded many of the commonly studied strains (Clee & Attie, 2007). The dominant lethal “yellow” mutation (Ay) was identified in 1905 (Dickies, 1962). A non-lethal, viable, allele (Avy) occurred as a spontaneous mutation in 1960 in the C3H/HeJ strain at the Jackson Laboratory (Dickies, 1962). In addition to their yellow coat color, mutant mice exhibit adult-onset obesity, type 2 diabetes associated with insulin resistance, hyperleptinemia, higher benign tumor susceptibility and infertility (Klebig et al., 1995). The mutations in the agouti gene in carriers of the yellow alleles leads to dysregulation of its expression in multiple tissues (Bultman, Michaud & Woychik, 1992; Duhl et al., 1994; Miller et al., 1993). The agouti model displays a defect in proopiomelanocortin (POMC) signaling pathway and is desensitized to leptin signaling (Boston et al., 1997).
The first recessive mutation in POMC was discovered in 1998 (Krude et al., 1998). In addition to obesity, patients with POMC mutations displayed hypocortisolism, hair and skin hypopigmentation, neonatal hypoglycemia, seizures, cholestasis and voracious appetite (Farooqi et al., 2006; Krude et al., 1998; Krude et al., 2003).The hypopigmentation of the hair and skin is not always observed in non-European populations, and POMC mutations should still be considered in individuals with severe early onset obesity even if typical pigmentary phenotype is missing (Cirillo et al., 2012; Clément et al., 2008; Mendiratta et al., 2011). In general, POMC deficiencies are extremely rare in human population (Beales, 2010) and the position of the mutation is important, as missense mutations have been reported to directly impact the melanocortin peptide-encoding regions, whereas other missense mutations have been reported to impact the peptide-receptor binding affinity (Challis et al., 2002).
A novel mutation in the alpha-melanocyte stimulating hormone (α-MSH) gene was found in a 12-year-old girl with early onset obesity (transmitted through the father) (Dubern et al., 2008). The mutation was characterized by dramatic impairment of α-MSH (Dubern et al., 2008). The patient’s obese father had less pronounced form of obesity in comparison to the daughter, which may be due to a gene-environment interaction. This means the younger generation is more exposed to obesogenic environment, thus more likely to develop obesity (Dubern et al., 2008). Most research has been focused on α-MSH since rodent models lack beta-melanocyte stimulating hormone (β-MSH) (Bennett, 1986) but a loss of function missense mutation in β-MSH has been associated with childhood obesity. The lack of function of β-MSH reduces the amount of MSH peptide in the POMC/MC4R pathway, resulting in obesity (Biebermann et al., 2006). β-MSH mutations may result in a non fully penetrant form of monogenic obesity, as some patients with this mutation are not obese (Lee et al., 2006).
PCSK1
A mutation was discovered in 1973 in the HRS/J inbred mouse strain which homozygous mice exhibit a slower increase in body weight compared to ob/ob and db/db mice but ultimately develop severe obesity, with hyperinsulinemia and transient hyperglycemia in males (Coleman & Eicher, 1990). Coding non-synonymous mutation in the carboxypeptidase E (Cpe) gene was found to induce the fat mouse phenotype (Naggert et al., 1995). Cpe gene is involved in processing of prohormone convertase 1 (PC1) as illustrated in Fig. 1, which led scientists to study the association of this gene to obesity as well (Li et al., 2014).
PC1/3 functions as a processing enzyme of precursor proteins in the regulated secretory pathways (Creemers, Jackson & Hutton, 1998). Pc1/3 knock-out mice do not exhibit obesity, but instead show growth retardation and multiple neuroendocrine disorders (Zhu et al., 2002). An ENU mutagenesis experiment resulted in development of a mouse model with mutation on the Pc1/3 (N222D allele) that exhibits obesity (Lloyd, Bohan & Gekakis, 2006). Pc1N222D/N222D mice have lower α-MSH and display defects in POMC processing, affecting the melanocortin signaling (Lloyd, Bohan & Gekakis, 2006). Pc1N222D/N222D mice exhibit abnormal proinsulin processing, multiple endocrinological defects, hyperphagia and obesity, while heterozygous mice exhibit an intermediate phenotype for weight gain and fasting insulin processing (Lloyd, Bohan & Gekakis, 2006).
In human studies, three patients with recessive monogenic form of obesity were deficient in the pro-protein convertase subtilisin/kexin type 1 (PCSK1) gene (Farooqi et al., 2007b; Jackson et al., 2003; Jackson et al., 1997). Complete prohormone convertase 1 deficiency results in early on-set severe obesity, hyperphagia, hypoglycemia, and endocrine dysfunction (Farooqi et al., 2007a; Farooqi et al., 2007b; Farooqi et al., 2007c; Jackson et al., 2003; Jackson et al., 1997). Null mutations causing prohormone convertase 1 congenital deficiency also lead to generalized malabsorptive diarrhea and diabetes insipidus in some instances (Farooqi et al., 2007a; Farooqi et al., 2007b; Farooqi et al., 2007c; Frank et al., 2013; Jackson et al., 1997; Martín et al., 2013; Yourshaw et al., 2013). Partial loss of function heterozygous mutations in PCSK1 present a non-fully penetrant intermediate obesity phenotype (Creemers et al., 2012) However, heterozygous carriers of a null mutation show a dominantly inherited form of Mendelian obesity (Philippe et al., 2014).
SH2B1
The SH2B adaptor protein 1 (SH2B1) activates the JAK2 cytoplasmic tyrosine kinase to mediate cell signaling (Ren et al., 2005). SH2-B is a key regulator of leptin sensitivity. Sh2b1−/− mice exhibit hyperphagia, hyperlipidemia, hyperglycemia, hyperleptinemia, hyperinsulinemia and hepatic steatosis (Ren et al., 2005).
In humans, loss of function mutations in SH2B1 patients resulted in severe early onset obesity (Doche et al., 2012; Pearce et al., 2014). These patients exhibit hyperphagia, childhood onset obesity, insulin resistance, and reduced height (Doche et al., 2012). Behavioral abnormalities were also noted in patients, such as social isolation and aggression (Doche et al., 2012). The severity of the phenotype may depend on the impact of mutations on the disruption of different isoforms of SH2B1 (Pearce et al., 2014). Genomic imbalances and recurrent deletions of the SH2B1 containing region on the short arm of chromosome 16 have been associated with behavioral disorders and obesity (Bachmann-Gagescu et al., 2010). It is interesting to note that while deletion of a region on chromosome 16 that contains SH2B1 increases the risk of obesity significantly (Bochukova et al., 2010; Walters et al., 2010), reciprocal duplication of this region results in an increase in gene dosage which influences BMI in the reverse manner (leanness) (Jacquemont et al., 2011). The relevance of SH2B1 locus in human energy balance is strengthened by the identification via GWAS of common variants near SH2B1 associated with BMI variation or obesity risk (Berndt et al., 2013; Willer et al., 2009).
BDNF/NTRK2
The brain derived neurotrophic factor (BDNF) model demonstrates the numerous roles of BDNF in neural development through activation of TrkB and p75 receptors and involvement in anorexigenic activity (Noble et al., 2011). In the mature central nervous system, BDNF is expressed in various hypothalamic nuclei associated with eating behavior and obesity (Kernie, Liebl & Parada, 2000). To circumvent the problem of early mortality associated with total knock-out of the BDNF gene, conditional BDNF knockout mice were developed. Conditional knockout of BDNF in the brain via cre-loxP recombinase system resulted in mice exhibiting hyperphagia, hyperactivity and aggression as well as elevated levels of POMC (Rios et al., 2001). Since BDNF is only absent in the brain, the resulting obesity can be attributed to the lack of BDNF function therein (Rios et al., 2001). In another conditional knockout study, selective knockout of BDNF in brains of adult mice resulted in impaired hippocampal function, whereas selective knockout of BDNF in earlier stages of development resulted in more drastic phenotypes, such as hyperactivity and severe impairments in hippocampal-dependent learning (Monteggia et al., 2004).
Neurotrophin receptor (TrkB) is a member of the neurotrophin family and is known to be involved in development, maintenance and function of peripheral and central neurons and is hypothesized to play a role in mediating neuronal plasticity in the hypothalamus (Gray et al., 2006a). TrkB and its ligand BDNF are also known to be involved in the regulation of food intake and body weight (Gray et al., 2006a; Xu et al., 2003). Homozygous mutations in the gene encoding TrkB (Ntrk2) are lethal in mice, but heterozygous mutations resulting in 25% of TrkB expression display hyperphagia, increased linear growth and obesity as well as complex neurobehavioral phenotypes (Xu et al., 2003).
The neurotrophic tyrosine kinase receptor type 2 (NTRK2) gene was screened in a boy with early onset obesity, hyperphagia developmental delay, impairments in short-term memory and impaired nociception, revealing a missense mutation in NTRK2 (Yeo et al., 2004). Further analysis showed an impairment in BDNF-stimulated protein kinase phosphorylation (Yeo et al., 2004). The developmental and neurological impairments in this case is consistent with the wide spread of TrkB (encoded via NTRK2) throughout the central nervous system, where it assumes the responsibility for neuronal survival and differentiation and regulation of synaptic function (Indo et al., 1996). In another case, a girl with loss of one functional copy of BDNF presented with hyperphagia, severe obesity, cognitive impairment and hyperactivity (Gray et al., 2006b). Moreover, hyperphagia and obesity observed in a subgroup of patients with WAGR syndrome has been attributed to deletions on chromosome 11 that induce haploinsufficiency of BDNF (Han et al., 2008).
SIM1
Single-minded homolog 1 (SIM1) is a member of the helix-hoop-helix PAS family of nuclear transcription factors (Crews, 1998). Homozygous Sim1 mice die perinatally (Michaud et al., 1998), but heterozygous mutants exhibit hyperphagic obesity, increased body fat percentage (Holder et al., 2004; Michaud et al., 2001), as well as higher levels of POMC expression and resistance to α-MSH (Kublaoui et al., 2006). They are also more prone to diet-induced obesity (Holder et al., 2004) and are associated with defects in the MC4R signaling pathway (Kublaoui et al., 2006). To illustrate these signaling defects, Sim1 heterozygous mouse injected with a melanocortin agonist showed a blunted suppression of food intake, while wild-type mice exhibited a robust reduction in food intake (Kublaoui et al., 2006).
Severe early-onset obesity was observed in a girl with haploinsufficiency of SIM1, possibly acting upstream or downstream of MC4R (Holder, Butte & Zinn, 2000). Further support for the involvement of SIM1 in obesity came from studies in which patients displayed Prader-Willie like phenotypes due to heterozygous mutations in SIM1 (Bonnefond et al., 2013). In another study, heterozygous mutations in SIM1 were associated with severe obesity accompanied by a neurobehavioral phenotype for a majority of them (Ramachandrappa et al., 2013). Deletions on chromosome 6q16, including SIM1 region, has been similarly associated with obesity and Prader-Willi like phenotype (Bonaglia et al., 2008). SIM1 is expressed in kidneys and central nervous system and plays an essential role in formation of PVN of the hypothalamus (Michaud et al., 2000). This could be a mechanism in which SIM1 plays a role in energy homeostasis, as PVN neurons express MC4R which inhibits food intake (Harris et al., 2001).
Polygenic obesity mouse models and candidate gene studies in human
Given the success in identifying mutations causing severe monogenic obesity from mouse models, in parallel with the development of methods for linkage analysis, other mouse models have been developed for genetic studies of polygenic obesity. For example, the New Zealand Obese Mouse (NZO) characterizes a combination of hyperphagia, reduced energy expenditure and insufficient physical activity (Herberg & Coleman, 1977). The Kuo Kondo Mouse displays hyperphagia, hyperinsulinemia, insulin resistance (Igel et al., 1998) which precedes onset of obesity (Ikeda, 1994). Later modifications of this model led to development of KKAy from transferring the Ay gene, which is now used for obesity and diabetes research and testing of experimental therapies (Okazaki et al., 2002). The Tsumura Suzuki Obese Diabetes Mouse (TSOD) models polygenic obesity with diabetes (hyperglycemia and hyperinsulinemia) (Suzuki et al., 1999). The M16 mouse was developed to characterize the phenotypic consequences of long-term selective breeding for rapid weight gain (Allan, Eisen & Pomp, 2004). The M16 is an outbred model of early onset polygenic obesity and is characterized by hyperphagia, hyperinsulinemia, and hyperleptinemia (Allan, Eisen & Pomp, 2004). Lastly, the BSB mouse models are a backcross progeny obtained by crossing C57BL/6J x Mus spretus F1 females with C57BL/6J males to model polygenic obesity (Fisler et al., 1993; Warden et al., 1993). BSB mice range from 1% to 50% body fat with an increase in both intra-abdominal and subcutaneous fat (Fisler et al., 1993). Obesity in BSB model is associated with hyperinsulinemia, hyperglycemia, and hyperlipidemia (Fisler et al., 1993).
Studies of polygenic mouse models have involved the analysis of numerous inbred strains using multiple experimental designs, and dozens of loci have been mapped across all mouse chromosomes (Pomp, 2007; Rankinen et al., 2006). These QTLs affect body weight, body fat, high fat diet-induced weight gain, the severity of obesity, and more specific traits such as food intake, energy expenditure and exercise habits (Fawcett et al., 2008). Only a few studies revealed QTLs in regions that had been previously identified in monogenic studies. For example, a study using QTL mapping in the BSB mouse model identified a locus that is very proximal to the LEP gene, which had been previously identified via positional cloning (Warden et al., 1995; Warden et al., 1993; Zhang et al., 1994). To identify the causative variation, each locus identified in a chromosomal region is isolated in a congenic strain, essentially converting it a monogenic study where interactions with other loci are held constant. This facilitates the analysis of the locus under study.
However, positional cloning of genes underlying obesity QTLs has proven to be a difficult task with a limited success rate (Wuschke et al., 2007). Several factors have contributed to this, including the time and cost required to generate and phenotype sufficient congenic and sub-congenic strains to localize the QTL to a region where a single candidate can be identified. Another challenge has been that many of the QTLs that were originally mapped appear to have resulted from the combined effects of multiple nearby QTLs (Buchner et al., 2012; Laplante et al., 2012; Mollah & Ishikawa, 2011; Prevorsek et al., 2010; Shao et al., 2008; Yazbek et al., 2011). Thus, when isolating the loci in progressively smaller congenic strains, the individual effect sizes (i.e., the phenotypic difference between congenic genotypes) can diminish and could even seemingly disappear if they are within a strain that also harbors a locus acting in the opposite direction. Similar to the case in human polygenic obesity, adiposity in mice seems largely controlled by multiple loci having modest effects. Finally, between any pair of strains, there are haplotype blocks where the strains have numerous genetic differences, both coding and non-coding, that could contribute to a QTL.
Despite the relatively low success rate of positional cloning in identifying polygenic obesity genes, few success stories of employing this approach in mouse models are described below.
Cntnap2 and Tag1
Pioneering the use of chromosome substitution strains for positional cloning in mice, the Nadeau laboratory has recently identified two genes associated with diet-induced obesity (Buchner et al., 2012). A mutation in the Cntnap2 gene which is required for proper potassium channel localization at neuronal nodes of Ranvier was identified through congenic analysis. Depending on the genetic background of the mouse model under investigation, this mutation either protected or predisposed mice to diet-induced obesity (Buchner et al., 2012). Using a candidate gene approach based on this finding, the group also assessed its known interacting protein, Tag1, in knockout mice and found that this gene also affects obesity by protecting mice against diet-induced obesity (Buchner et al., 2012). These studies have provided further evidence linking neuronal function with the regulation of body weight. Copy number variation in Cntnap2 has recently been identified in a child with syndromic obesity (Vuillaume et al., 2014).
Deptor
The Fob3a locus was identified in studies of the Fat and Lean strains generated by long-term selection for these traits (Stylianou et al., 2004). Recently, through congenic analysis, genetic variation in Deptor has been identified as a strong obesity candidate gene at the Fob3a locus (Laplante et al., 2012). This gene was previously known for its roles in mammalian target of rapamycin (mTor) signaling, but its role in obesity development was unknown. Through the subsequent generation of transgenic mice, Deptor overexpression was associated with increased adipogenesis (Laplante et al., 2012).
Other obesity candidate genes identified through congenic analysis
Studies of the Nob3 QTL have led to the identification of a microdeletion that eliminates expression of Ifi202b (Vogel et al., 2012). The authors showed that this altered the expression of several genes including 11 β-Hsd1. 11 β-Hsd1 encodes the cortisone reductase and is a relevant candidate gene for energy balance. Another gene recently identified from mouse positional cloning studies is Bhlhe40, which affects muscle fatty acid oxidation (Takeshita et al., 2012).
Mouse models have also been helpful in elucidating genes that play a role in polygenic obesity risk/protection in humans. For example, candidate gene studies of MC4R common genetic variants revealed that the gain-of-function mutation of the variants lower the risk of obesity (Geller et al., 2004; Stutzmann et al., 2007). Additionally, the study of BDNF as a candidate gene led to the association of a coding non-synonymous variant (Val66Met) with BMI variation in healthy adults (Gunstad et al., 2006), an association confirmed later on by hypothesis-free GWAS for BMI (Thorleifsson et al., 2009; Willer et al., 2009). Similarly, two non-synonymous variants on PCSK1 were consistently associated with childhood and adult severe obesity in a study of 13,659 participants of European ancestry, making PCSK1 a candidate gene for polygenic obesity (Benzinou et al., 2008).
From Human Obesity to Mouse Models: The Back and Forth
Mouse models have been invaluable in dissecting the genetic origin of human monogenic and polygenic obesity. The reverse approach also holds true as gene discoveries in humans have pioneered new mouse models for obesity. This section will review how genuine genetic discoveries in humans using high throughput, agnostic approaches such as positional cloning, GWAS or WES have inspired new experiments in mice to investigate the function of the genes.
Positional cloning
BBS
Bardet-Biedl Syndrome (BBS) is a rare recessive developmental disorder, and people with heterozygous mutations in BBS gene are more prone to obesity (Croft et al., 1995; Sheffield, 2010). Positional cloning, homozygosity mapping, candidate gene and whole exome sequencing approaches have led to the discovery of 18 genes that are linked to BBS so far (Scheidecker et al., 2014). Follow-up studies in animal models revealed the association of BBS genes with cilia function, and in intracellular and intraflagellar trafficking (Sheffield, 2010). More specifically, mice homozygous for a single BBS mutation lack spermatozoa flagella (Sheffield, 2010). Further analysis of BBS resulted in development of BBS knockout mice (Bbs2, Bbs4 and Bbs6) that developed hyperphagia, reduced energy expenditure and increased circulating leptin levels, which suggests that leptin deficiency is not the mechanism of obesity in BBS (Rahmouni et al., 2008). This was further confirmed by administration of leptin, which failed to change body weight or food intake, indicative of leptin resistance in BBS mice (Rahmouni et al., 2008). On the other hand, expression of Pomc in BBS knock-out mice were significantly lower than that of controls, while Agrp and Npy levels were comparable to controls, pointing to the idea that Pomc is the main player in obesity in BBS mice (Rahmouni et al., 2008). This phenomenon is compatible with the role of BBS in cilia function, as abrogating cilia in POMC neurons increases food intake and causes obesity in mice (Davenport et al., 2007).
TBC1D1
A major predisposing locus for obesity was identified at 4p.15-14, affecting more females than males (Arya et al., 2004; Meyre et al., 2008; Stone et al., 2002). Positional cloning of this 4p15-14 linkage peak led to the identification of a coding non-synonymous variant (R125W) in the TBC1 domain family member 1 (TBC1D1) gene associated with female familial obesity in populations from Utah and France (Meyre et al., 2008; Stone et al., 2006). TBC1D1 is a Rab-GTPase activating protein and is closely related to insulin signaling protein AS160. It is predominantly expressed in skeletal muscle, as it is involved in regulation of lipid utilization in skeletal muscles (An et al., 2010; Chadt et al., 2008; Sano et al., 2003). These discoveries in humans were followed-up by animal work. Studies of the Nob1 QTL identified a mutation in the Tbc1d1 gene that protects against obesity (Chadt et al., 2008). Tbc1d1 knockout mice were shown to exhibit reduction in body weight, impaired glucose utilization, and increased lipid oxidation in skeletal muscles (Dokas et al., 2013). Further analysis of the deleterious effects of the human R125W mutation has been confirmed by in vivo overexpression of wild-type and mutant TBC1D1 proteins in mouse tibialis anterior muscles (An et al., 2010). In this study, the R125W mutation impaired insulin-stimulated glucose transport, but did not impair contraction-stimulated glucose transport. Experiments conducted on phosphorylation sites of other TBC1D1 mutations had opposing effects, as these mutations impaired contraction-stimulated glucose transport but did not impact insulin-stimulated glucose transport (An et al., 2010). Overall, impairment of muscle glucose transport could lead to increased fat accumulation in adipose tissue and result in subsequent obesity (An et al., 2010).
ENPP1
A positional cloning experiment led to identification of ectonucleotide pyrophosphatase/phosphodiesterase 1 (ENPP1) as a possible contributor to obesity and type 2 diabetes in humans. A significant linkage for childhood obesity was detected on chromosome 6q22.23 in French pedigrees (Meyre et al., 2004). By using overlapping published linkage studies on obesity (Atwood et al., 2002), insulin secretion (Abney, Ober & McPeek, 2002; Duggirala et al., 2001) and type 2 diabetes (Demenais et al., 2003; Ehm et al., 2000; Ghosh et al., 2000; Xiang et al., 2004), the ENPP1 gene was picked for further analysis. ENPP1 directly inhibits insulin-induced conformational changes of the insulin receptor, and affects its activation and signaling (Maddux & Goldfin, 2000; Maddux et al., 1995). A risk haplotype of ENPP1 was associated with childhood obesity, glucose intolerance and type 2 diabetes (Meyre et al., 2005). Subsequent development of Enpp1 knockout mice highlighted a phenotype of more efficient adipocyte maturation in mesenchymal embryonal cells compared to wild-type (Liang et al., 2007). Transgenic mice overexpressing human ENPP1 in muscle and liver tissue exhibited elevation in glucose and insulin levels compared to wild-type, conveying that ENPP1 plays a role in insulin resistance and hyperglycemia (Dong et al., 2005; Maddux et al., 2006).
Genome-wide association studies
GWAS in obesity field have identified 119 independent loci associated with BMI and obesity status (Choquet & Meyre, 2011; Locke et al., 2015). Table 2 provides a summary of these identified genes and associated SNPs. Interestingly, GWAS showed that almost all genes involved in Mendelian forms of obesity in mice and humans (LEPR, POMC, MC4R, BDNF, PCSK1, TUB, NTRK2, SH2B1) display common variants associated with BMI and polygenic obesity as well (Dickson et al., 2010). Genetic animal models were developed prior to GWAS discoveries for these genes whose functions were well-established. However, most of the genes located in or near GWAS signals were of unknown function. This prompted the scientific community to develop new genetic mouse models for some of these genes that we describe below.
| Gene | SNPs | Chrom. | Phenotype | Reference |
|---|---|---|---|---|
| ADCY9 | rs2531995 | 16 | Obesity | Berndt, SI. 2013. Nat Genet |
| AGBL4 | rs657452 | 1 | BMI | Locke, AE. 2015. Nature |
| ASB4 | rs6465468 | 7 | BMI | Locke, AE. 2015. Nature |
| BDNF | rs6265, rs4923461,rs10767664, rs2030323, rs988712 | 11 | BMI, Obesity, Overweight | Thorleifsson, G. 2009. Nat Genet, Speliotes, EK. 2010. Nat Genet, Jiao, H. 2011. BMC Med Genomics, Okada, Y. 2012. Nat Genet, Wen, W. 2012. Nat Genet 2012 |
| BRE | rs116612809 | 2 | BMI | Gong, J. 2013. Am J Hum Genet |
| C9orf93 | rs4740619 | 9 | BMI | Locke, AE. 2015. Nature |
| CADM1 | rs12286929 | 11 | BMI | Locke, AE. 2015. Nature |
| CADM2 | rs13078807 | 3 | BMI, Overweight | Speliotes, EK. 2010. Nat Genet, Berndt, SI. 2013. Nat Genet |
| CALCR | rs9641123 | 7 | BMI | Locke, AE. 2015. Nature |
| CBLN1 | rs2080454 | 16 | BMI | Locke, AE. 2015. Nature |
| CDKAL1 | rs2206734, rs9356744 | 6 | BMI | Okada, Y. 2012. Nat Genet, Wen, W. 2012. Nat Genet 2012 |
| CLIP1 | rs11057405 | 12 | BMI | Locke, AE. 2015. Nature |
| CREB1, KLF7 | rs17203016 | 2 | BMI | Locke, AE. 2015. Nature |
| EHBP1 | rs11688816 | 2 | BMI | Locke, AE. 2015. Nature |
| ELAVL4 | rs11583200 | 1 | BMI | Locke, AE. 2015. Nature |
| EPB41L4B, C9orf4 | rs6477694 | 9 | BMI | Locke, AE. 2015. Nature |
| ERBB4 | rs7599312 | 2 | BMI | Locke, AE. 2015. Nature |
| ETS2 | rs2836754 | 21 | BMI | Locke, AE. 2015. Nature |
| ETV5 | rs7647305, rs9816226 | 3 | BMI, Obesity, Overweight | Thorleifsson, G. 2009. Nat Genet, Speliotes, EK. 2010. Nat Genet, Berndt, SI. 2013. Nat Genet |
| FAIM2 | rs7138803, rs7132908 | 12 | BMI, Obesity, Overweight | Thorleifsson, G. 2009. Nat Genet, Speliotes, EK. 2010. Nat Genet, Paternoster, L. 2011. PLoS One, Bradfield, JP. 2012. Nat Genet, Berndt, SI. 2013. Nat Genet |
| FANCL | rs887912 | 2 | BMI, Obesity, Overweight | Speliotes, EK. 2010. Nat Genet, Berndt, SI. 2013. Nat Genet |
| FANCL, FLJ30838 | rs12617233 | 2 | BMI | Guo, Y. 2012. Hum Mol Genet |
| FHIT | rs2365389 | 3 | BMI | Locke, AE. 2015. Nature |
| FIGN | rs1460676 | 2 | BMI | Locke, AE. 2015. Nature |
| FLJ35779 | rs2112347 | 5 | BMI, Obesity, Overweight | Speliotes, EK. 2010. Nat Genet, Berndt, SI. 2013. Nat Genet |
| FOXO3, HSS00296402 | rs9400239 | 6 | BMI | Locke, AE. 2015. Nature |
| FTO | rs9939609, rs9930506, rs1121980, rs1421085, rs8050136, rs1558902, rs17817449, rs12149832, rs9940128, rs62033400, rs1421085, rs1121980, rs9936385, rs9941349, rs3751812, rs1558902, rs17817449 | 16 | BMI, Obesity, Childhood Obesity | Dina, C. 2007. Nat Genet, Hinney, A. PLoS One. 2007, Frayling, TM. 2007. Science, Scuteri, A. 2007. PLoS Genet, Loos, RJ. 2008. Nat Genet, Meyre, D. 2009. Nat Genet, Thorleifsson, G. 2009. Nat Genet, Willer, CJ. 2009. Nat Genet, Cho, YS. 2009. Nat Genet, Speliotes, EK. 2010. Nat Genet, Scherag, A. 2010. PLoS Genet, Paternoster, L. 2011. PLoS One, Wang, K. 2011. PLoS One, Bradfield, JP. 2012. Nat Genet, Wen, W. 2012. Nat Genet, Okada, Y. 2012. Nat Genet, Guo, Y. 2012. Hum Mol Genet, Graff, M. 2013. Hum Mol Genet, Pei, YF. 2013. Hum Mol Genet, Berndt, SI. 2013. Nat Genet, Wheeler, E. 2013. Nat Genet |
| GBE1 | rs3849570 | 3 | BMI | Locke, AE. 2015. Nature |
| GDF15, PGPEP1 | rs17724992 | 19 | BMI | Locke, AE. 2015. Nature |
| GIPR | rs2287019, rs11671664 | 19 | BMI | Speliotes, EK. 2010. Nat Genet, Wen, W. 2012. Nat Genet, Okada, Y. 2012. Nat Genet |
| GNAT2 | rs17024258 | 1 | Obesity | Berndt, SI. 2013. Nat Genet |
| GNPDA2 | rs10938397, rs13130484, rs348495 | 4 | BMI, Obesity, Overweight | Willer, CJ. 2009. Nat Genet, Speliotes, EK. 2010. Nat Genet, Graff, M. 2013. Hum Mol Genet, Berndt, SI. 2013. Nat Genet |
| GP2 | rs12597579 | 16 | BMI | Wen, W. 2012. Nat Genet 2012 |
| GPRC5BB | rs12444979 | 16 | BMI, Obesity, Overweight | Speliotes, EK. 2010. Nat Genet, Berndt, SI. 2013. Nat Genet |
| GRID1 | rs7899106 | 10 | BMI | Locke, AE. 2015. Nature |
| GRP | rs7243357 | 18 | BMI | Locke, AE. 2015. Nature |
| GRP120 | rs116454156 | 10 | Obesity | Ichimura, A. 2012. Nature |
| HHIP | rs11727676 | 4 | BMI | Locke, AE. 2015. Nature |
| HIF1AN | rs17094222 | 10 | BMI | Locke, AE. 2015. Nature |
| HIP1, PMS2L3, PMS2P5, WBSCR16 | rs1167827 | 7 | BMI | Locke, AE. 2015. Nature |
| HMGA1 | rs206936 | 6 | BMI | Speliotes, EK. 2010. Nat Genet |
| HNF4G | rs4735692 | 8 | Obesity | Berndt, SI. 2013. Nat Genet |
| HOXB5 | rs9299 | 17 | Childhood Obesity | Bradfield, JP. 2012. Nat Genet |
| HS6ST3 | rs7989336 | 13 | Obesity | Berndt, SI. 2013. Nat Genet |
| HSD17B12 | rs2176598 | 11 | BMI | Locke, AE. 2015. Nature |
| IFNGR1, OLIG3 | rs13201877 | 6 | BMI | Locke, AE. 2015. Nature |
| KAT8, ZNF646, VKORC1, ZNF668, STX1B, FBXL19 | rs9925964 | 16 | BMI | Locke, AE. 2015. Nature |
| KCNK3 | rs11126666 | 2 | BMI | Locke, AE. 2015. Nature |
| KCNMA1 | rs2116830 | 101 | Obesity | Jiao, H. 2011. BMC Med Genomics |
| KCTD15 | rs11084753, rs29941 | 19 | BMI | Willer, CJ. 2009. Nat Genet, Thorleifsson, G. 2009. Nat Genet, Speliotes, EK. 2010. Nat Genet |
| KLF9 | rs11142387 | 9 | BMI | Okada, Y. 2012. Nat Genet |
| LEPR | rs11208659 | 1 | Childhood Obesity | Wheeler, E. 2013. Nat Genet |
| LMX1B | rs10733682 | 9 | BMI | Locke, AE. 2015. Nature |
| LOC100287559, BBS4 | rs7164727 | 15 | BMI | Locke, AE. 2015. Nature |
| LOC284260, RIT2 | rs7239883 | 18 | BMI | Locke, AE. 2015. Nature |
| LOC285762 | rs9374842 | 6 | BMI | Locke, AE. 2015. Nature |
| LPIN2 | rs643507 | 18 | Obesity (Asthmatic patients) | Melen, E. 2013. Clin Exp Allergy |
| LRP1B | rs2890652 | 2 | BMI | Speliotes, EK. 2010. Nat Genet |
| LRRN6C | rs10968576 | 9 | BMI, Obesity | Speliotes, EK. 2010. Nat Genet, Berndt, SI. 2013. Nat Genet |
| MAF | rs1424233 | 16 | Obesity | Meyre, D. 2009. Nat Genet |
| MAP2K5 | rs2241423, rs4776970, rs997295 | 15 | BMI, Obesity, Overweight | Speliotes, EK. 2010. Nat Genet, Wen, W. 2012. Nat Genet 2012, Guo, Y. 2012. Hum Mol Genet, Berndt, SI. 2013. Nat Genet |
| MAPK3, KCTD13, INO80E, TAOK2, YPEL3, DOC2A, FAM57B | rs4787491 | 16 | BMI | Locke, AE. 2015. Nature |
| MC4R | rs17782313, rs571312, rs12970134, rs2331841, rs6567160, rs8089364, rs7234864, rs723486, rs7227255, rs2229616, rs17782313, rs17700144,rs663129, rs571312, rs476828 | 18 | BMI, Obesity, Overweight | Loos, RJ. 2008. Nat Genet, Thorleifsson, G. 2009. Nat Genet, Meyre, D. 2009. Nat Genet, Speliotes, EK. 2010. Nat Genet, Scherag, A. 2010. PLoS Gene, Paternoster, L. 2011. PLoS One, Guo, Y. 2012. Hum Mol Genet, Okada, Y. 2012. Nat Genet, Wen, W. 2012. Nat Genet, Bradfield, JP. 2012. Nat Genet, Berndt, SI. 2013. Nat Genet, Wheeler, E. 2013. Nat Genet, Graff, M. Hum Mol Genet. 2013, Pei, YF. Hum Mol Genet. 2013 |
| MIR548A2 | rs1441264 | 13 | BMI | Locke, AE. 2015. Nature |
| MIR548X2, PCDH9 | rs9540493 | 13 | BMI | Locke, AE. 2015. Nature |
| MRPS33P4 | rs13041126 | 20 | Obesity | Berndt, SI. 2013. Nat Genet |
| MTCH2 | rs10838738, rs3817334 | 11 | BMI, Obesity, Overweight | Willer, CJ. 2009. Nat Genet, Speliotes, EK. 2010. Nat Genet, Berndt, SI. 2013. Nat Genet |
| MTIF3 | rs4771122 | 13 | Speliotes, EK. 2010. Nat Genet | |
| NAV1 | rs2820292 | 1 | BMI | Locke, AE. 2015. Nature |
| NEGR1 | rs2815752, rs2568958, rs1993709 | 1 | BMI, Obesity, Overweight | Willer, CJ. 2009. Nat Genet, Thorleifsson, G. 2009. Nat Genet, Speliotes, EK. 2010. Nat Genet, Berndt, SI. 2013. Nat Genet, Wheeler, E. 2013. Nat Genet |
| NLRC3 | rs758747 | 16 | BMI | Locke, AE. 2015. Nature |
| NPC1 | rs1805081 | 18 | Obesity | Meyre, D. 2009. Nat Genet |
| NRXN3 | rs10150332 | 14 | BMI, Obesity | Speliotes, EK. 2010. Nat Genet, Berndt, SI. 2013. Nat Genet |
| NT5C2, CYP17A1, SFXN2 | rs11191560 | 10 | BMI | Locke, AE. 2015. Nature |
| NTRK2 | rs1211166 | 9 | BMI | Guo, Y. 2012. Hum Mol Genet |
| NUP54, SCARB2 | rs17001654 | 4 | BMI | Locke, AE. 2015. Nature |
| OLFM4 | rs9568856, rs9568867 | 13 | Obesity | Bradfield, JP. 2012. Nat Genet, Berndt, SI. 2013. Nat Genet |
| PACS1 | rs564343 | 11 | Childhood Obesity | Wheeler, E. 2013. Nat Genet |
| PARK2 | rs13191362 | 6 | BMI | Locke, AE. 2015. Nature |
| PCSK1 | rs261967, rs6232, rs6234, rs6235 | 5 | BMI, Obesity | Benzinou, M. 2008. Nat Genet, Wen, W. 2012. Nat Genet |
| PLCD4, CYP27A1, USP37, TTLL4, STK36, ZNF142,RQCD1 | rs492400 | 2 | BMI | Locke, AE. 2015. Nature |
| PMS2L11 | rs2245368 | 7 | BMI | Locke, AE. 2015. Nature |
| POMC | rs713586, rs6545814, rs1561288, rs6752378, rs10182181 | 2 | BMI, Obesity, Overweight | Speliotes, EK. 2010. Nat Genet, Wen, W. 2012. Nat Genet 2012, Bradfield, JP. 2012. Nat Genet, Berndt, SI. 2013. Nat Genet, Graff, M. 2013. Hum Mol Genet |
| PRKCH | rs1957894 | 14 | Childhood Obesity | Wheeler, E. 2013. Nat Genet |
| PRKD1 | rs11847697, rs12885454 | 14 | BMI | Speliotes, EK. 2010. Nat Genet, Locke, AE. 2015. Nature |
| PTBP2 | rs1555543 | 1 | BMI | Speliotes, EK. 2010. Nat Genet |
| QPCTL | rs2287019 | 19 | Obesity, Overweight | Berndt, SI. 2013. Nat Genet |
| RABEP1 | rs1000940 | 17 | BMI | Locke, AE. 2015. Nature |
| RALYL | rs2033732 | 8 | BMI | Locke, AE. 2015. Nature |
| RARB | rs6804842 | 3 | BMI | Locke, AE. 2015. Nature |
| RASA2 | rs16851483 | 3 | BMI | Locke, AE. 2015. Nature |
| RMST | rs11109072 | 12 | Childhood Obesity | Wheeler, E. 2013. Nat Genet |
| RPL27A | rs11042023 | 11 | Obesity | Berndt, SI. 2013. Nat Genet |
| RPTOR | rs7503807 | 17 | Overweight | Berndt, SI. 2013. Nat Genet |
| SBK1, APOBR | rs2650492 | 16 | BMI | Locke, AE. 2015. Nature |
| SCG3, DMXL2 | rs3736485 | 15 | BMI | Locke, AE. 2015. Nature |
| SDCCAG8 | rs12145833 | 1 | Childhood Obesity | Scherag, A. 2010. PLoS Gene |
| SEC16B | rs10913469, rs543874, rs574367, rs516636, rs591120 | 1 | BMI, Obesity, Overweight | Thorleifsson, G. 2009. Nat Genet, Speliotes, EK. 2010. Nat Genet, Bradfield, JP. 2012. Nat Genet, Berndt, SI. 2013. Nat Genet, Graff, M. 2013. Hum Mol Genet, Wen, W. 2012. Nat Genet, Okada,Y. 2012. Nat Genet |
| SH2B1 | rs7498665, rs4788102, rs7359397, rs4788099 | 16 | BMI, Obesity, Overweight | Willer, CJ. 2009. Nat Genet, Thorleifsson, G. 2009. Nat Genet, Speliotes, EK. 2010. Nat Genet, Guo, Y. 2012. Hum Mol Genet, Berndt, SI. 2013. Nat Genet |
| SLC39A8 | rs13107325 | 4 | BMI | Speliotes, EK. 2010. Nat Genet |
| SMG6, N29617 | rs9914578 | 17 | BMI | Locke, AE. 2015. Nature |
| STXBP6 | rs10132280 | 14 | BMI | Locke, AE. 2015. Nature |
| TAL1 | rs977747 | 1 | BMI | Locke, AE. 2015. Nature |
| TCF7L2 | rs7903146 | 10 | BMI | Locke, AE. 2015. Nature |
| TDRG1, LRFN2 | rs2033529 | 6 | BMI | Locke, AE. 2015. Nature |
| TFAP2B | rs987237, rs734597, rs2272903 | 6 | BMI, Obesity, Overweight | Speliotes, EK. 2010. Nat Genet, Paternoster, L. 2011. PLoS One, Guo, Y. 2012. Hum Mol Genet, Berndt, SI. 2013. Nat Genet |
| TLR4 | rs1928295 | 9 | BMI | Locke, AE. 2015. Nature |
| TMEM160 | rs3810291, rs3810291 | 19 | BMI, Obesity | Speliotes, EK. 2010. Nat Genet, Berndt, SI. 2013. Nat Genet |
| TMEM18 | rs6548238, rs7561317, rs2867125, rs12463617, rs4854344 | 2 | BMI, Obesity, Overweight | Willer, CJ. 2009. Nat Genet, Thorleifsson, G. 2009. Nat Genet, Speliotes, EK. 2010. Nat Genet, Guo, Y. 2012. Hum Mol Genet, Bradfield, JP. 2012. Nat Genet, Berndt, SI. 2013. Nat Genet, Wheeler, E. 2013. Nat Genet, Graff, M. 2013. Hum Mol Genet |
| TNKS | rs17150703 | 8 | Childhood Obesity | Scherag, A. 2010. PLoS Gene |
| TNNI3K | rs1514175, rs12142020, rs1040070, rs1514174 | 1 | BMI, Obesity | Speliotes, EK. 2010. Nat Genet, Bradfield, JP. 2012. Nat Genet, Graff, M. 2013. Hum Mol Genet, Berndt, SI. 2013. Nat Genet |
| TOMM40, APOE, APOC1 | rs2075650 | 19 | BMI | Guo, Y. 2012. Hum Mol Genet |
| TUB | rs4929949 | 11 | BMI | Speliotes, EK. 2010. Nat Genet |
| UBE2E3 | rs1528435 | 2 | BMI | Locke, AE. 2015. Nature |
| ZBTB10 | rs16907751 | 8 | BMI | Locke, AE. 2015. Nature |
| ZNF608 | rs48361333 | 5 | BMI | Speliotes, EK. 2010. Nat Genet |
| ZZZ3 | rs17381664 | 1 | Obesity | Berndt, SI. 2013. Nat Genet |
FTO
The fat mass and obesity associated gene (FTO) is the first gene that has been convincingly associated with obesity using GWAS. The role of FTO as an important contributor to polygenic obesity was confirmed in GWAS for type 2 diabetes, BMI, early onset obesity, and incidentally in a population stratification approach (Dina et al., 2007; Frayling et al., 2007; Hinney et al., 2007; Scuteri et al., 2007). Initial GWAS on FTO identified FTO as an unknown gene in an unknown pathway (Frayling et al., 2007). The exact molecular mechanism of how FTO might contribute to obesity is still under investigation, but high level of expression of FTO in the hypothalamus is suggestive of its role in food intake (Fredriksson et al., 2008). This required further studies of FTO in knockout and overexpression animal models to understand the mechanism in which FTO influences obesity (Choquet & Meyre, 2011).
Fto knockout mice exhibit high perinatal lethality, significant reduction in body length, fat mass and lean mass, indicative of the role of Fto in energy homeostasis (Church et al., 2009; Fischer et al., 2009; McMurray et al., 2013). Deletion of Fto in the hypothalamus via adeno-associated viral vectors encoding Cre recombinase resulted in small reduction in food intake and decreased weight gain with no effect on energy expenditure (McMurray et al., 2013). Overexpression of Fto in mice results in increased food intake, increase in body and fat mass (Church et al., 2010).
Despite the metabolic phenotypes found in FTO overexpression/inactivation rodent models and the location of SNPs associated with human obesity in the intron 1 region of FTO, the implication of other neighboring genes in obesity is not excluded. As an illustration, the obesity-associated FTO sequence directly interacts with the promoters of IRX3 as well as FTO in the human, mouse and zebrafish genomes (Smemo et al., 2014). Expression QTL studies in human brains revealed that obesity associated SNPs in FTO are associated with expression of IRX3, but not FTO itself (Smemo et al., 2014). Irx3 knockout mice show reduction in body weight and increase in basal metabolic rate, indicative of a direct link between Irx3 and body composition (Smemo et al., 2014). The rs8050136 SNP located in the first intron of FTO modulates the binding for CUX1 P110 and P200 isoforms which in turn regulate the expression of FTO and of the nearby ciliary gene RPGRIPL1 (Stratigopoulos et al., 2014; Stratigopoulos et al., 2011). Homozygous mutants of Rpgripl1 are lethal, but Rpgrip1l +/− mice are leptin resistant, hyperphagic and obese (Stratigopoulos et al., 2014). Overall, these animal experiments suggest that the genes IRX3 and RPGRIPL1 may mediate at least in part the association of SNPs in FTO with obesity.
NPC1
Besides FTO, genome wide association studies revealed that two non-synonymous variants in high linkage disequilibrium (H215R/I858V) in the Niemann-Pick C1 (NPC1) gene were associated with extreme obesity in European adults (Meyre et al., 2009). Subsequent mouse models of partial inactivation of Npc1 evidenced significant weight gain in mice fed a high-fat diet, indicating a possible gene-diet interaction (Jelinek et al., 2010). More recently, SNPs at the Npc1 locus have been associated with differences of body fat (%) in response to high-fat high-sucrose diet in a GWAS performed in mice (Parks et al., 2013).
ETV5
Ets variant 5 (ETV5) is a transcription factor that can act either as an activator or repressor of transcription of genes involved in cell proliferation, differentiation, apoptosis and cell–cell or cell–matrix interaction (Sementchenko & Watson, 2000; Sharrocks, 2001). Two GWAS in populations of European ancestry identified SNPs near ETV5 as associated with BMI and obesity (Berndt et al., 2013; Speliotes et al., 2010; Thorleifsson et al., 2009). This association triggered further research on ETV5 in animal models. Etv5 knockout mice exhibit lean bodies, resistance to diet-induced obesity and severe glucose intolerance due to impaired insulin exocytosis and hypoinsulinaemia (Gutierrez-Aguilar et al., 2014).
NEGR1
GWAS identified SNPs near the neuronal growth regulator 1 (NEGR1) gene associated with BMI variation and obesity (Berndt et al., 2013; Thorleifsson et al., 2009; Wheeler et al., 2013; Willer et al., 2009). NEGR1 is expressed in the brain and participates in the neurite outgrowth in the developing brain (Marg et al., 1999). With the use of ENU mutagenesis, mice carrying a loss of function of Negr1 displayed reduced food intake and physical activity, unchanged energy expenditure and reduction in overall body mass (Lee et al., 2012).
Next generation sequencing (NGS)
SDCCAG8
Nephronophthisis-related ciliopathies (NPHP-RCs) are developmental problems that impact kidneys and are associated with renal degeneration, intellectual disability and obesity. Exome sequencing identified 12 truncating mutations on serologically defined colon cancer antigen 8 (SDCCAG8) gene, showing that a loss of function of SDCCAG8 is causal for human retinal-renal ciliopathy (Otto et al., 2010). The candidacy of SDCCAG8 gene was strengthened by the identification of common variants associated with childhood obesity through a GWAS in German and French populations (Scherag et al., 2010). To better understand the function of SDCCAG8, a gene-trap mouse line (Sdccag8gt/gt) was subsequently developed (Airik et al., 2014). The Sdccag8gt/gt mice exhibited the human phenotype of NPHP-RCs and revealed that retinal degeneration associated with the disorder exhibits early and leads to progressive loss of vision, whereas the renal degeneration occur later due to DNA damage from signaling activity (Airik et al., 2014).
The Waltz Between Mouse and Human Genetic Studies
Recent attempts in understanding genetics of obesity utilizing both human and animal genetic approaches are discussed below.
Linkage study
Arrestin domain-containing 3 protein (ARRDC3) is a regulator of cell receptor signaling, and also plays a role in metabolism (Luan et al., 2009). Genome wide linkage for human obesity identified a linkage peak on chromosome 5, and positional cloning identified ARRDC3 associated with higher BMI in males but not in females (Patwari et al., 2011). Higher ARRDC3 expression is associated with visceral adipose tissue and obesity in males. Animal models such as the Arrdc3 deficient mice have validated the role of ARRDC3 in metabolism by being resistant to obesity in a dosage dependent manner (both genders, but with greater impact on males than females) (Patwari et al., 2011).
Candidate gene approach
G-protein coupled receptor 120 (GPR120) is a receptor for unsaturated long chain fatty acids, and plays a role in adipogenesis, regulation of appetite and food preference (Hirasawa et al., 2005). Gpr120 deficient mice fed a high fat diet exhibit obesity, glucose intolerance, fatty liver, decreased adipocyte differentiation and lipogenesis (Ichimura et al., 2012), but no difference in body weight between Gpr120 deficient and wild type mice was observed when both groups were fed a normal diet (Ichimura et al., 2012). When assessed in humans, GPR120 was expressed in adipose tissue, with obese individuals having a higher expression in both subcutaneous and omental adipose tissue (1.8 fold increase) (Ichimura et al., 2012). In order to study the contribution of GPR120 to human obesity, the four GPR120 exons were sequenced in 312 non-consanguineous extremely obese French children and adults. Exon sequencing revealed a deleterious non-synonymous variant (p.R270H) of minor allele frequency (MAF) of 3% that inhibits GPR120 signaling activity and increases the risk of obesity by 62% in 6,942 obese individuals and 7,654 control subjects from Europe (Ichimura et al., 2012). Thus, GPR120 plays a role in sensing dietary fat, and is important in energy balance.
Melanocortin 2 receptor accessory protein 2 (MRAP2) is a homologue of MRAP, expressed in the brain and adrenal gland (Chan et al., 2009). MRAP2 can interact with all melanocortin receptors, which results in MC2R surface expression and signaling. MRAP2 can also reduce the responsiveness of MC1R, MC3R, MC4R and MC5R to α-MSH (Chan et al., 2009). Mouse models deficient in Mrap2 exhibit obesity (Asai et al., 2013). Selective knockout of Mrap2 in neurons expressing Sim1 also exhibit obesity, similar to global knockout of Mrap2, consistent with the idea that Sim1 expressing neurons are key regulators of energy balance (Asai et al., 2013). Four rare heterozygous mutations of MRAP2 have been identified in obese humans (Asai et al., 2013).
Whole exome sequencing
Kinase suppressor of Ras 2 (KSR2) is a scaffolding protein involved in multiple signaling pathways through kinase cascades (Dougherty et al., 2010; Pearce et al., 2013) that are linked to regulation of food intake, body fat content and glucose homeostasis (Revelli et al., 2011). By using a whole-exome sequencing strategy, KSR2 loss-of-function mutations were identified in humans and were associated with hyperphagia, early-onset obesity, low heart rate, reduced basal metabolic rate and severe insulin resistance (Pearce et al., 2013). Ksr 2−/− mice display obesity, high insulin levels, and impaired glucose tolerance (Pearce et al., 2013). Obesity persisted in Ksr 2−/− mice despite being fed the same amount of diet as Ksr2+/+ littermates (Pearce et al., 2013).
Perspectives
To conclude this review, we provide helpful suggestions to accelerate the identification of obesity predisposing genes as well as their functional interrogation in mouse and human.
The use of approaches integrating multiple types of data (system biology/functional genomics) could boost the identification of genes predisposing to obesity (Yang, Jiang & He, 2009). Such studies could benefit from the use of mice to access tissues that are not readily available in humans or to perform deep phenotyping that is too expensive in humans. The co-mapping of gene expression levels (eQTLs), protein levels (pQTLs) and even metabolites (mQTLs) to a location in the genome associated with a disease may generate novel hypotheses for direct testing in humans and mice (Davis et al., 2012; Mackay, Stone & Ayroles, 2009; Yang et al., 2009). As an illustration, a study combining positional cloning and high-throughput transcriptome approaches identified two novel candidate genes driving adiposity in mice (Akr1b8 and Rgs2) that deserve further investigation in humans (Derry et al., 2010).
Stringent P-value thresholds are classically used in GWAS (P < 5 × 10⁻⁸) to adjust the experiment for the many hypotheses tested (Dudbridge & Gusnanto, 2008). As a result, many true associations that do not reach stringent P-value thresholds are missed by conventional GWAS (Stahl et al., 2012). Similar issues are now experienced in next generation sequencing (NGS) studies (Do, Kathiresan & Abecasis, 2012). Identifying these true positive associations is challenging and so far has been addressed by the ever expanding meta-analyses (Stahl et al., 2012). Another way to ‘separate the wheat from the chaff’ could include the utilization of hypothesis-driven GWAS and next generation sequencing (NGS) approaches as opposed to hypothesis-free strategies (Li & Meyre, 2013). This method is beneficial in its decreased number of statistical tests and less stringent significance thresholds for the hypotheses being tested (Li & Meyre, 2013). Narrowing down the hypothesis to a specific linkage region or molecular pathway for example, could lead to identification of association signals previously missed by conventional GWAS (Li & Meyre, 2013). These high-throughput hypothesis-driven experiments would greatly benefit from the inclusion of data collected in mouse models of obesity (Li & Meyre, 2013).
It is also important to emphasize on the value of expression studies in future experiments. Expression studies in mice can add valuable knowledge of the expression and regulation of genes under diverse environmental exposures (Yoganathan, Karunakaran & Clee, 2012) especially when studying the expression of a gene in a certain tissue is difficult to obtain in human studies. In a recent study, the expression of a subset of GWAS obesity candidate genes was observed to be different in the hypothalamus and/or adipose tissue of fed vs. fasted animals (Yoganathan, Karunakaran & Clee, 2012). These experiments are helpful in moving from GWAS association signals to relevant candidate genes for obesity (Yoganathan, Karunakaran & Clee, 2012).
Improving on methodology and techniques used in animal studies could also provide better insight in upcoming genetics studies. Employing more recent tools in genome editing such as CRISPR/Cas9 could allow for more precise targeted mutagenesis (Zhang, Wen & Guo, 2014). This method depends on small RNA for sequence-specific cleavage (Jinek et al., 2012) for DNA targeting which is relatively cheap and easy to produce (Zhang, Wen & Guo, 2014). It involves a non-specific Cas9 nuclease and a set of programmable sequence-specific CRIPS RNA (crRNA) which can guide Cas9 to cleave the DNA and generate double-strand breaks at target sites (Zhang, Wen & Guo, 2014). CRISP/Cas9 is able to simultaneously allow for genomic modifications at multiple independent sites (Cong et al., 2013), but it can also induce non desired insertion deletions (Lin et al., 2014).
In light of improvement in animal models, utilizing tissue or time specific knockouts, knock-in or transgenic mice could help in better understanding the function of genes that were previously associated with obesity. For example, mice with global PPAR γ inactivation showed reduced adipose tissue and mild glucose intolerance (Koutnikova et al., 2003). In comparison, fat-specific PPAR γ knockout animals showed complete lipoatrophy, impaired adipokine secretion, profound insulin resistance and hyperglycemia, abnormal bone, mammary gland and skin metabolism (Wang et al., 2013). Although not frequently used in the obesity genetics field, time-specific knockouts are helpful in understanding gene expression at different developmental stages (Loebel et al., 2014). For instance, complete post-natal inactivation of BDNF in mice was associated with hyperphagic obesity, whereas pre-natal inactivation of the same gene was lethal (Rios et al., 2001).
Understanding the importance of gene-gene interactions in development of obesity is another key area of investigation. Studying gene-gene interactions in humans are experimentally demanding because they require large sample sizes to detect significant interactions, and are statistically challenging due to multiple testing issues (Hu, Wang & Wang, 2014). Therefore model organisms are an important tool for studying gene-gene interactions (MacKay, 2014). Genetic studies in mice may also facilitate the discovery of gene-gene interactions or loci whose effects are only evident in the context of specific alleles at other loci. This approach is based on the hypothesis that a QTL for a trait in mouse that maps to a homologous location for the same trait in humans, is most likely caused by the same gene (Leduc et al., 2011). The BSB mouse model is an example of mouse model used to study epistatic effects on obesity QTLs (Yi et al., 2004). Mapping and identification of gene × gene interactions in mice could be examined in humans, again, since the homologous regions of mouse and human chromosome regions are well-defined (Chiu et al., 2006). Double-knockout mouse models, where two genes are inactivated, can reveal valuable information about gene-gene interactions (Chiu et al., 2006). Double-knockout mice have not been commonly studied in obesity field, so we present an example from the diabetes field. Irs1−/− have mild glucose intolerance and Irs3−/− have no detectable phenotype, but Irs1−/−/Irs3−/− are hyperglycemic and display severe lipoatrophy (Terauchi et al., 2003), indicative of their interaction in developing the type 2 diabetes phenotype. Complex mouse models showing evidence of epistasis can be tested in human genetic epidemiology studies. Although the number of known gene-gene interactions in human obesity is relatively small, we hope that increased sample size in epidemiological studies could help elucidate more of these interactions. Double knock out or transgenic mouse models are an attractive model to confirm the interactions identified in humans.
Aside from the importance of gene-gene interactions, recognizing the importance of gene-environment interactions in developing obesity is crucial (Andreasen & Andersen, 2009). For instance, physical activity could offset the aggregated genetic risk of multiple obesity loci (Ahmad et al., 2013; Li et al., 2010). Gene-environment studies can help in targeting populations that may respond well or poorly to a specific lifestyle or therapeutic interventions (Ahmad et al., 2013). Establishing large case-control studies in population-based cohorts, precise phenotyping of quantitative trait studies with precise measurements of lifestyle exposure, and target testing of interaction in existing lifestyle trials will provide the best understanding of gene-environment interactions (Franks et al., 2007).
To effectively demonstrate how genetic variations at a specific locus modify the effect of an environmental stimuli on a metabolic trait requires a combination of environmental modifications on animal models and human etiological trials (Franks & Roth, 2008). Different environmental modifications can be tested in homozygous or heterozygous knock out or knock in models and they can eventually be studied in inbred strains with naturally occurring allelic variations. Testing the gene-environment interactions in genes with prior evidence of their role in interacting with an environmental stimuli in mouse models can improve the probability that an observed effect is true (Franks & Roth, 2008), which may help to better control for the high likelihood of false positives in gene-environment interactions in human studies. Studying gene-environment interactions in knock-out animal models may be used as a first step to prioritize genes for gene environment interaction studies in human populations. For instance, Gipr knockout mice are protected against obesity and disturbance to their glucose homeostasis under a high-fat diet (Sonestedt et al., 2012). Human studies of GIPR common gene variants found a significant interaction between the rs10423928 SNP and a high-fat/low carbohydrate diet on risk of type 2 diabetes (Sonestedt et al., 2012).
Lastly, genes involved in diet and immune response have been preferential targets in positive selection during mammalian evolution, highlighting the importance of nutrient availability and pathogens as powerful driving forces of evolution (Kosiol & Vinar, 2008). Evolutionary assessment of mutations associated with highly penetrant from of obesity through mammal evolution (including rodents) may be complementary to in vitro and in vivo characterization studies in evaluating their functional relevance (Stäubert et al., 2007). This approach may be less relevant to common variants of obesity with modest effect. For instance, more than 90% of 70 missense mutations in MC4R identified in obese patients were located at amino acid positions that are highly conserved during 450 million years of MC4R evolution in vertebrates (Stäubert et al., 2007).
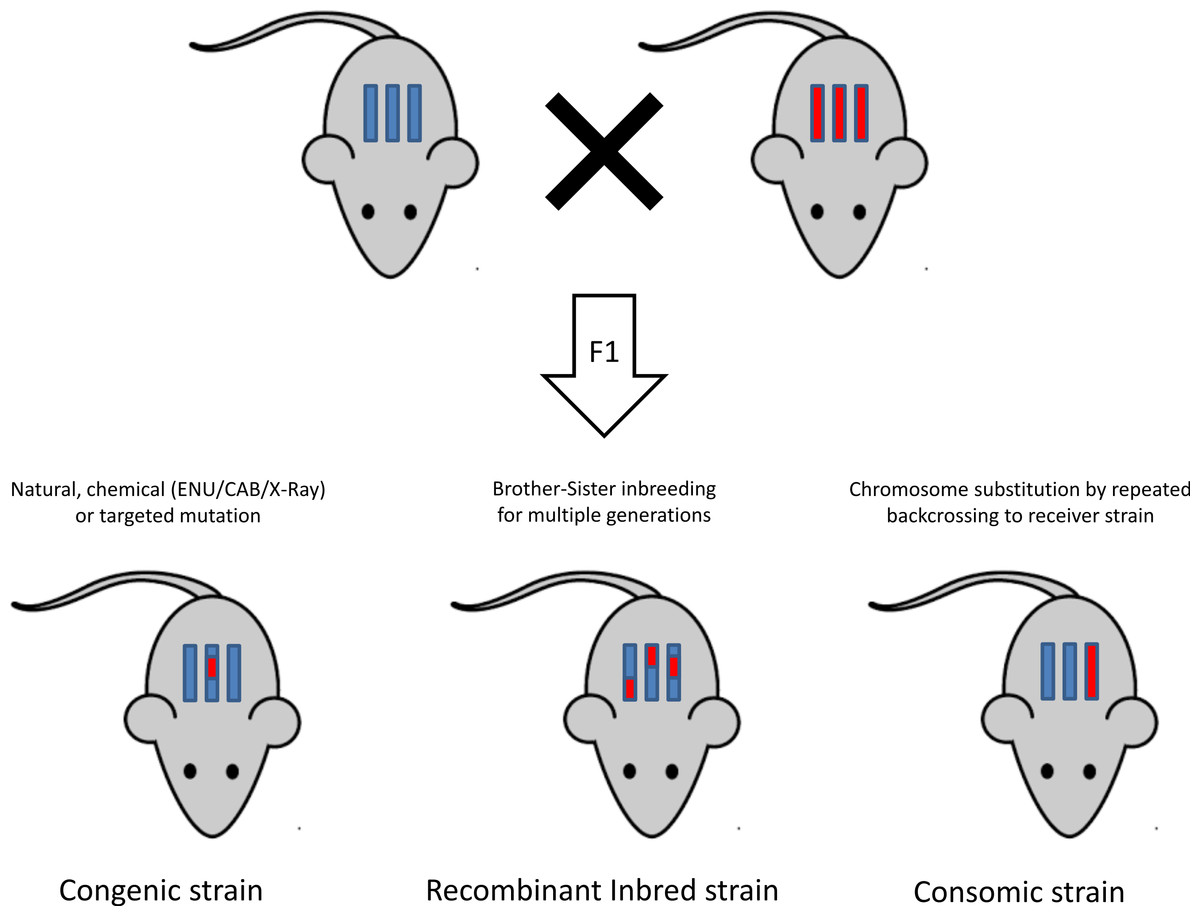
Figure 3: General overview of mutagenesis and inbreeding in mice.
Congenic, recombinant inbred and consomic mice are obtained when part of the genome of one mouse strain is transferred to another strain by backcrossing the donor mouse to the receiver strain. In congenic mouse, the offspring resembles the parent strain except for the mutated chromosomal segment, whereas in consomic strain, the offspring carries an entire chromosome from the donor strain. Recombinant inbred strains are obtained by cross breeding of inbred mice to increase their genotypic diversity and carrying a series of brother-sister mating for multiple generations.
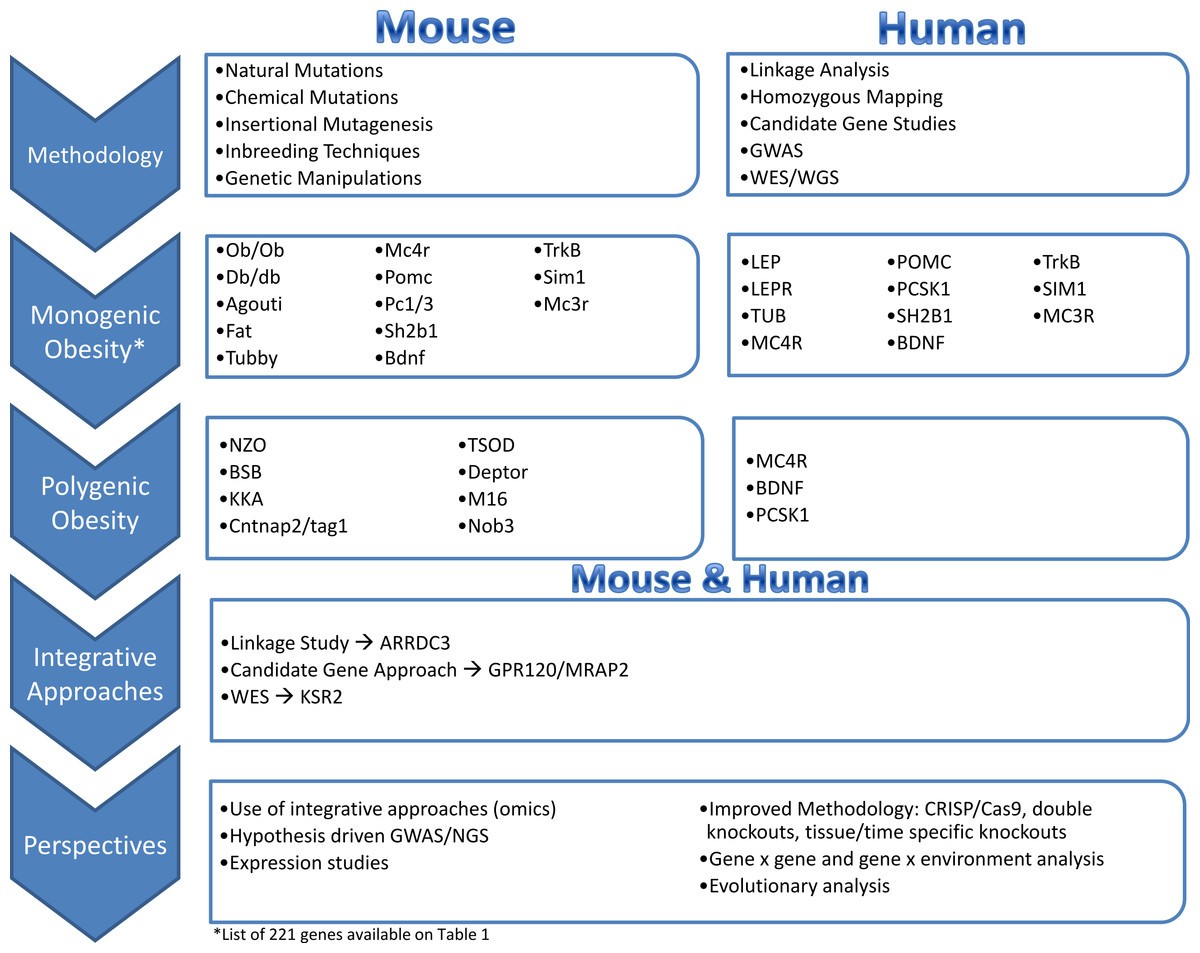
Figure 4: Graphical representation of the main concepts of the review.
Summary of the major concepts in methodology of mouse include natural, chemical and insertional mutagenesis, as well as inbreeding and genetic manipulation techniques. In humans, linkage analysis, homozygous mapping, candidate gene studies, genome-wide association studies (GWAS) and whole exome/genome studies (WES/WGS) are discussed. These methodologies have led to genetic studies in monogenic and polygenic obesity, where mouse models paved the way for genetic discoveries in humans. The reverse concept also holds true, as genetic discoveries in humans led to development of new mouse models. In recent attempts of genetic discovery, an integrative approach of animal and human studies have promoted new gene discoveries as well as functional analysis. Current studies are utilizing innovative approaches such as use of omics, hypothesis driven GWAS, expression studies, improved genetic manipulation techniques, gene × gene or gene x environment analysis as well as evolutionary analysis to improve our understanding of the genetic architecture of obesity.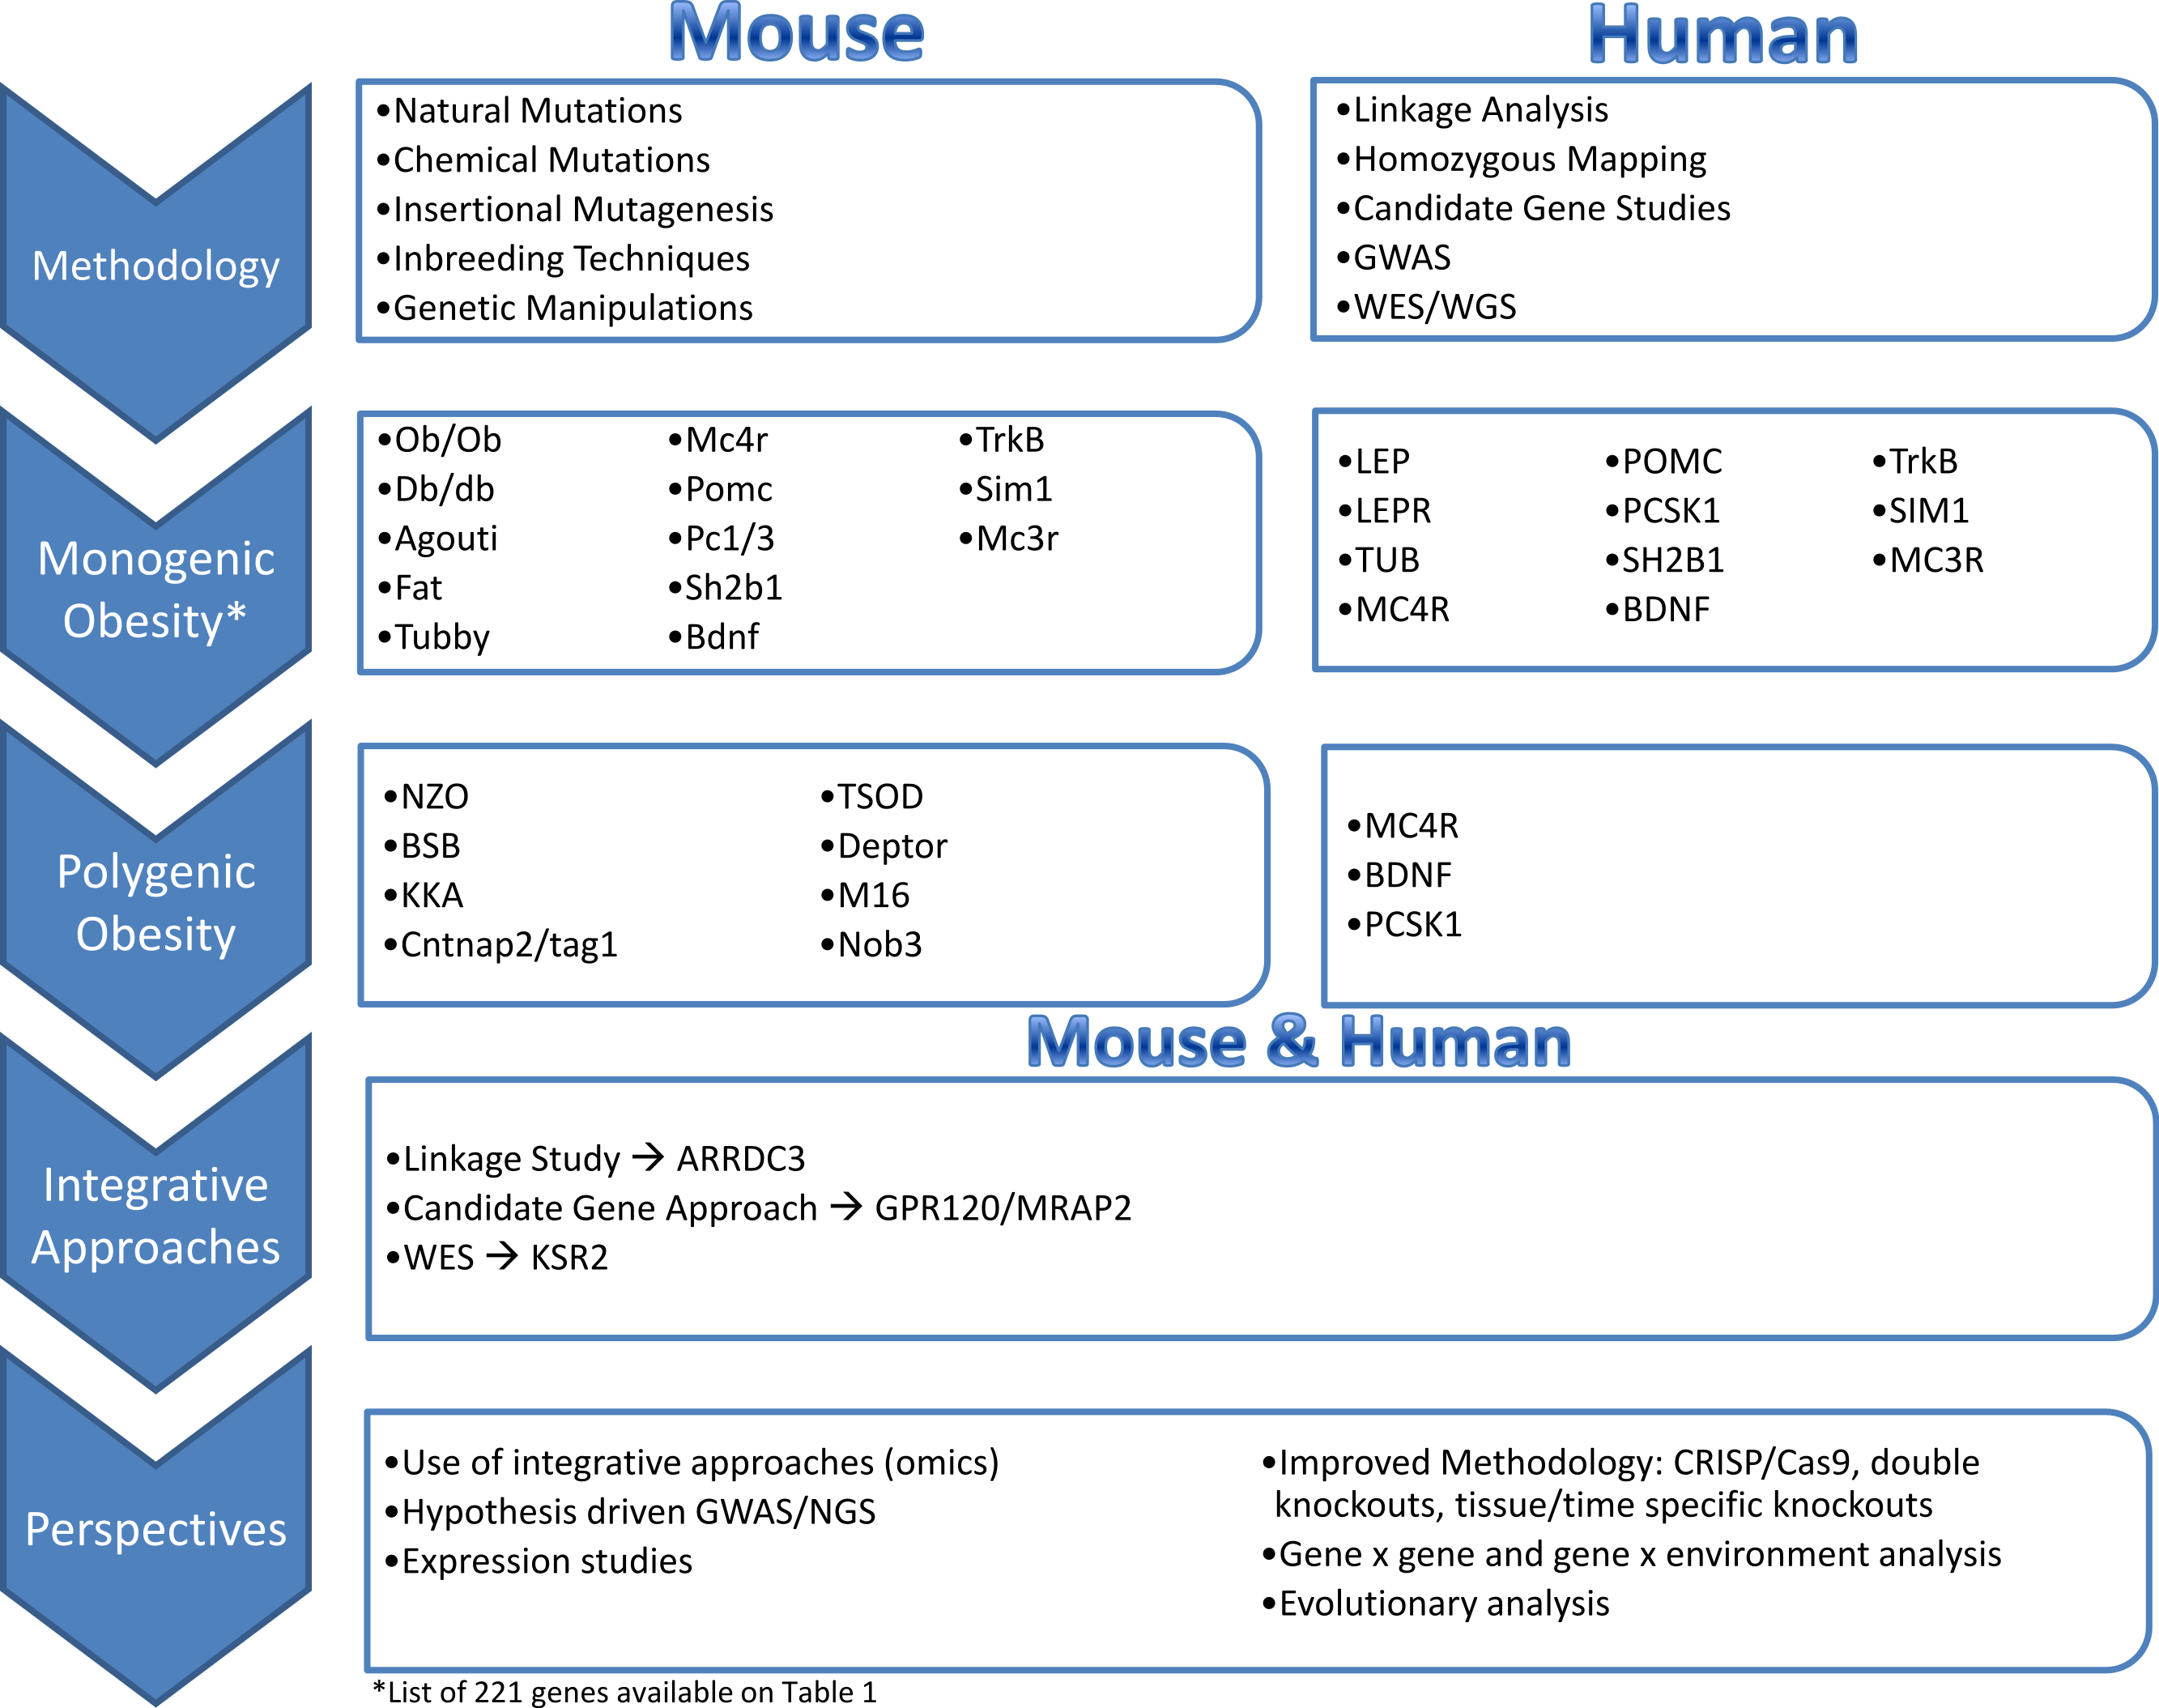
Conclusions
We have reviewed the synthesis between mouse and human genetics in the field of obesity. We describe the approaches and techniques that are available for mouse and human geneticists, and provide a striking illustration of the synergy between these approaches that led to successful obesity causing gene identifications these last decades. We list innovative approaches to not only ensure a higher yield of novel obesity genes, but also a deeper understanding of their function. Figure 4 is an illustration that summarizes the discussions in this review paper. Integrative mouse human strategies have the potential to lead to the identification of more genes responsible for common Mendelian forms of obesity, as well as gene × gene and gene × environment interactions. This may help to unravel the missing heritability of obesity. We believe that an exhaustive understanding of obesity genetics will help to identify novel drug targets and to design more efficient and personalized obesity prevention and management programs that, with the support of populations and stakeholders, will ultimately curb the obesity epidemic (Agurs-Collins et al., 2008).