
Genetic diversity and population structure of Meretrix petechialis in China revealed by sequence-related amplified polymorphism markers
- Published
- Accepted
- Received
- Academic Editor
- María Ángeles Esteban
- Subject Areas
- Aquaculture, Fisheries and Fish Science, Biotechnology, Genetics, Marine Biology
- Keywords
- Meretrix petechial, Genetic diversity, Polymorphism, SRAP, Genetic structure
- Copyright
- © 2020 Xu et al.
- Licence
- This is an open access article distributed under the terms of the Creative Commons Attribution License, which permits unrestricted use, distribution, reproduction and adaptation in any medium and for any purpose provided that it is properly attributed. For attribution, the original author(s), title, publication source (PeerJ) and either DOI or URL of the article must be cited.
- Cite this article
- 2020. Genetic diversity and population structure of Meretrix petechialis in China revealed by sequence-related amplified polymorphism markers. PeerJ 8:e8723 https://doi.org/10.7717/peerj.8723
Abstract
Genetic variation in nine stocks of Meretrix petechialis collected from China was analyzed using sequence-related amplified polymorphism (SRAP) markers. Eight primer pairs produced 132 polymorphic loci with an average of 16.5 loci per primer pair. A population from Jiangsu had the highest percentage of polymorphic loci at 27.27%, suggesting that these resources had a rich genetic diversity. The Nei’s gene diversity of the nine populations ranged from 0.0647 to 0.0793; a population from Shandong was the lowest and a population from North Korea the highest. The Shannon’s information index was between 0.1023 and 0.1202, with the lowest in the Shandong population and the highest in the Jiangsu population. The Nei’s unbiased genetic distance between the nine populations was 0.0243–0.0570 and the genetic similarity was 0.9446–0.9760; the genetic distance between Guangxi and Shandong populations was the furthest (0.0570) and the genetic distance between Shandong and Jiangsu populations was the closest (0.0243). Nei’s gene diversity analysis indicated that the genetic variance was mainly found within individual geographical populations, and the analysis of molecular variance revealed low but significant genetic differentiation among local and regional populations. The limited gene flow (Nm = 0.555) was inferred as a major reason for the extent of genetic differentiation in M. petechialis. The results obtained here indicated that M. petechialis have high degree of genetic diversity and the potential of further breeding with excellent germplasm resources. This study provides a scientific basis for the protection of germplasm resources and the breeding of M. petechialis.
Introduction
Meretrix petechialis is a marine shellfish species of economic and medicinal value that is mainly distributed and cultured in coastal China. In recent years, the scale of breeding in M. petechialis has resulted in an increasing demand for seedlings and the artificial seeds transplantation (Shen et al., 2003; Chen et al., 2004), which has affected the protection and development of M. petechialis germplasm resources. Therefore, the genetic diversity of M. petechialis germplasm resources can be determined to compare the genetic differences of different geographical populations, which can provide useful information for the protection of M. petechialis germplasm resources and breeding.
SRAP is a PCR-based molecular marker proposed by Li & Quiros (2001), which can be used for differential analysis of genomic DNA and cDNA (Li & Quiros, 2001). SRAP loci are derived from a single forward primer and numerous reverse primers, providing an efficient protocol for the discovery of polymorphisms. Upstream primers can specifically bind to the exon or promoter regions of genes, downstream primers can be specific to intron pairing. A SRAP marker is used to amplify an ORF in the genome and produces polymorphic amplification products due to the different lengths of introns, promoters and spacers in different individuals (Zhang et al., 2010).
Over the past few decades, the SRAP marker has been widely used in plant research, such as genetic map construction, genetic diversity analysis and comparative genomics (Tang et al., 2003). Meanwhile, SRAP was widely used to study germplasm resources and genetic diversity of species because of their special primer design in addition to their simplicity, stability and repeatability. In aquatic animals, Ding, Cao & Cao (2008) obtained Ctenopharyngodon idellus germplasm molecular markers by SRAP markers, as similarly reported in Macrobrachium nipponense (Qiao et al., 2012). In bivalves, the SRAP technique has been used to analyze differential gene expression in mantle with different external shell color in Hyriopsis cumingii (Wen et al., 2014) and M. petechialis (Zheng, Nie & Yan, 2019). In addition, Jin et al. (2013) established a SRAP–PCR system and analyzed the genetic diversity in Manila clam Ruditapes philippinarum with white, black and orange shell colors. However, there are very few studies on the genetic diversity of M. petechialis using sequence-related amplified polymorphism (SRAP) markers (Zhang et al., 2010). In this study, SRAP markers was used to analyze the genetic diversity and population structure of nine geographic populations of M. petechialis to reveal their levels of genetic differentiation, which is of great significance for the conservation and scientific management of genetic resources. Meanwhile, this work provided data about genetic polymorphisms and potential genetic improvements, which are critical information for selective breeding.
Materials and Methods
Collection of samples and extraction of DNA
In this study, samples were collected from different tidal flats. A total of 270 samples were obtained from nine locations. We collected the clam M. petechialis at Fujian (FJ), Guangxi (GX), Panjin (PJ), Shandong (SD), Dandong (DD), Hainan (HN), Dalian (DL), North Korea (NK) and Jiangsu (JS) (Fig. 1). The adductor muscles were dissected from the samples and stored in 100% ethanol. DNA was extracted from the adductor muscles using a TIANamp Marine Animals DNA Extraction Kit (Tiangen, Beijing, China). After successful extraction, concentration was determined with 1% agarose gel electrophoresis and the quality of the extracted DNA was determined. The extracted DNA was stored in TE buffer and PCR was performed after the quality was confirmed. The diluted concentration was 100 ng/μL.
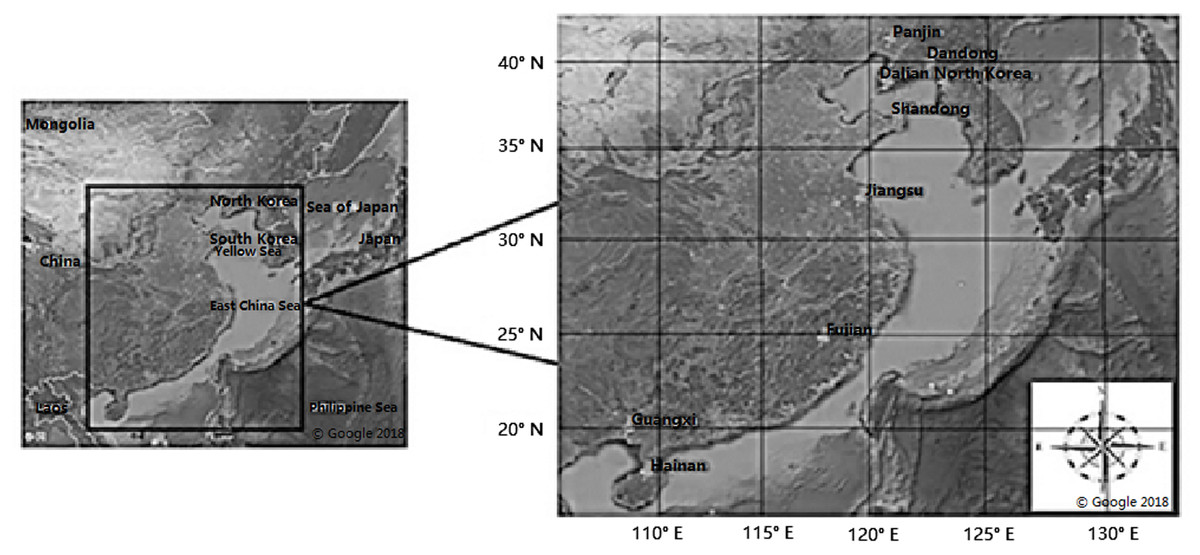
Figure 1: Maps showing locations of the nine populations of Meretrix petechialis sampled (FJ, GX, PJ, SD, DD, HN, DL, NK and JS).
Maps showing locations of the nine populations of Meretrix petechialis sampled Fujian (FJ), Guangxi (GX), Panjin (PJ), Shandong (SD), Dandong (DD), Hainan (HN), Dalian (DL), North Korea (NK) and Jiangsu (JS). This map is attributed to Google map and the relevant data provider in Google Earth Pro on desktop Map data: Google, Maxar Technologies.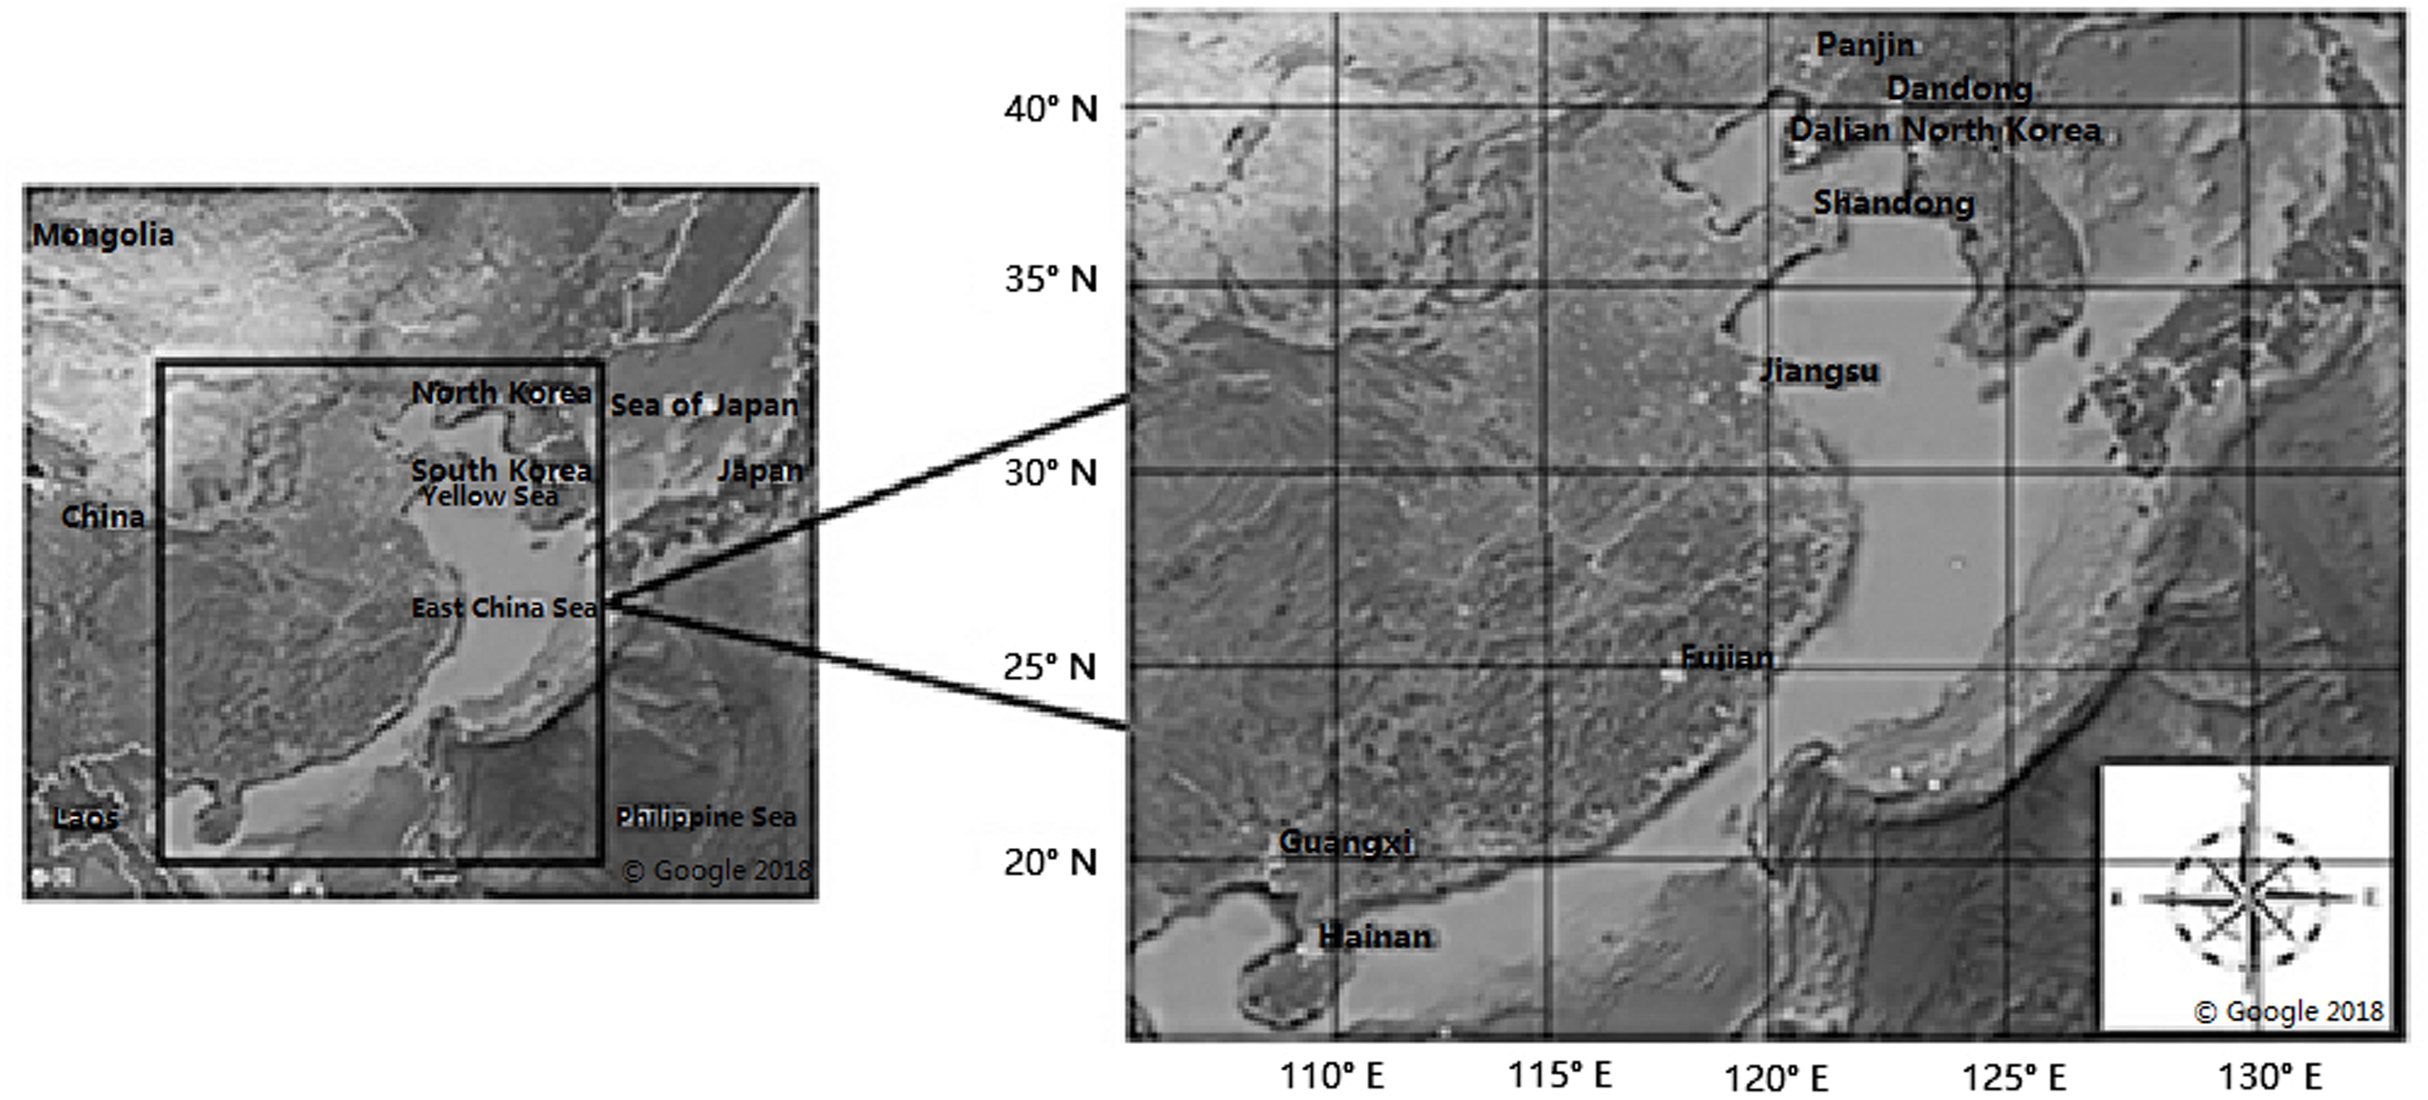
Optimization of SRAP–PCR amplification system and detection of products
Primers for Me7 and Em15 were based on published SRAP sequence (Table 1), and 105 pairs of primers were obtained by crossing the upstream and downstream. The parameters of the PCR were as follows: 2.5 μL of 10× PCR buffer; two μL dNTP mixture; 0.25 μL Taq DNA polymerase produced by Takara, Japan; one μL upstream and downstream primers (10 μmol/L), and one μL template DNA, ddH2O to make up the volume of the PCR reaction to 25 μL. The reaction conditions were: 5 min at 94 °C, 5 cycles, 1 min at 94 °C, an annealing temperature of 35 °C for 1 min, an extension temperature of 72 °C, and an extension time of 1 min, 1 min at 94 °C, an annealing temperature of 50 °C for 1 min, extension at 72 °C for 1 min, a total of 35 cycles; extension at 72 °C for 10 min and stored at 4 °C. After the PCR was completed, it was detected by 6% denatured polyacrylamide gel electrophoresis. To ensure the accuracy of denatured polyacrylamide gel electrophoresis, a control was used for each test.
| Marker | R-primer | Marker | F-primer |
|---|---|---|---|
| Em1 | GACTGCGTACGAATTAAT | Me1 | TGAGTCCAAACCGGATA |
| Em2 | GACTGCGTACGAATTTGC | Me2 | TGAGTCCAAACCGGAGC |
| Em3 | GACTGCGTACGAATTGAC | Me3 | TGAGTCCAAACCGGAAT |
| Em4 | GACTGCGTACGAATTTGA | Me4 | TGAGTCCAAACCGGACC |
| Em5 | GACTGCGTACGAATTAAC | Me5 | TGAGTCCAAACCGGAAG |
| Em6 | GACTGCGTACGAATTGCA | Me6 | TGAGTCCAAACCGGTAA |
| Em7 | GACTGCGTACGAATTCAA | Me7 | TGAGTCCAAACCGGTAG |
| Em8 | GACTGCGTACGAATTCTG | ||
| Em9 | GACTGCGTACGAATTCGA | ||
| Em10 | GACTGCGTACGAATTCAG | ||
| Em11 | GACTGCGTACGAATTCCA | ||
| Em12 | GACTGCGTACGAATTATG | ||
| Em13 | GACTGCGTACGAATTGTC | ||
| Em14 | GACTGCGTACGAATTACG | ||
| Em15 | GACTGCGTACGAATTAAG |
SRAP band statistical analysis and calculation of genetic indicators
According to the SRAP amplification electrophoresis procedure, each of the bands is considered to be a locus, with reference to 10 bp DNA markers. The SRAP of each sample amplification band is counted, with a clearly visible band recorded as 1 and no band recorded as 0, and converted into 1 and 0 matrices. The polymorphism information content (PIC) value of the primer is calculated using PIC software. POPGENE32 (Yeh, Yang & Boylet, 1999) was used to observe the number of alleles (NA), the effective number of alleles (Ne), the Shannon’s information index (I), the Nei’s gene diversity (H), the number of polymorphic loci (N), and the percentage of polymorphic loci (P), the Nei’s unbiased genetic distance (D) and genetic similarity (S) were calculated and the neighbor-joining (NJ) tree of nine M. petechialis groups was constructed according to the genetic distance with MEGA 7.0 (Kumar, Stecher & Tamura, 2016). The total genetic variation among the samples was calculated using the phi-statistic through the analysis of molecular variance (AMOVA). This analysis was performed using the computer program GENALEX ver.6.5 (Peakall & Smouse, 2006). The total genetic variation is partitioned at three levels—within populations (Phi-PT), among populations within regions (Phi-PR) and among regional populations (Phi-RT) (Xu et al., 2008).
The patterns of the population structure were further investigated using the model-based Bayesian clustering procedure in STRUCTURE version 2.3.4 (Pritchard, Stephens & Donnelly, 2000), the data was converted into the appropriate format and imported into the software and relevant parameters were set. We assigned individuals to K populations based on their multilocus genotype. The estimated K value was set to 1–9 then STRUCTURE was used with 10,000 iterations and a burn-in period of 10,000. All runs were repeated 10 times at each K, the most appropriate value of K was identified with calculated ΔK by using Structure Harvester ver.0.6.92 (http://taylor0.biology.ucla.edu/structureHarvester/) (Earl & Vonholdt, 2012). Then, the optimal K value was independent run by the CLUMPP 1.1.2 (Jakobsson & Rosenberg, 2007), and the output was used as input into DISTRUCT 1.1 (Rosenberg, 2004) for cluster visualization. Furthermore, Principal Component Analysis (PCA) was employed to assess the degree of genetic relatedness among groups using Origin Pro.
Results
SRAP amplification band type
Using the genomic DNA of nine populations of M. petechialis, 105 pairs of SRAP primer combinations were screened, and 30 pairs of primer combinations with clear, stable and few bands were selected, of which eight pairs of primer combinations (Me2/Em15, Me3/Em4, Me4/Em3, Me4/Em5, Me4/Em11, Me5/Em5, Me5/Em14, Me6/Em5) can obtain stable, reproducible and polymorphic amplification maps. The polymorphic loci amplified by different primer combinations are different. The number of polymorphic loci detected by each pair of primers is 12–23, and the average number of loci per pair of primers is 16.5. The fragment size range of 116–250 bp has a high polymorphism, which indicates that SRAP can be applied to study genetic diversity in M. petechialis.
Population genetic diversity
A total of 132 polymorphic loci were detected in eight pairs of primer combinations. The total stripe number was 308, of which the Me5/Em14 polymorphic stripe number was the highest (23). The Me3/Em4 primer’s polymorphic frequency was the highest for 53.85% and the Me6/Em5 was the lowest at 29.27% (mean = 42.86%). The PIC value of the Me5/Em14 primer was the highest (0.90), the PIC value of the Me4/Em5 primer was the lowest (0.78) and the average PIC value of eight pairs of primers was 0.86 (Table 2). The highest number of polymorphism bits and percentages of polymorphism sites in the JS population were 36% and 27.27% and the lowest in DL and NK populations were 32% and 24.24%, respectively. The Nei’s gene diversity of the nine M. petechialis populations ranged from 0.0647 (SD) to 0.0793 (NK) and the Shannon’s information index was between 0.1023 and 0.1202, with the SD population being the lowest and the JS population being the highest (Table 3).
| Primer combination | No. total bands | No. polymorphic band | Percentage of polymorphic band (%) | PIC |
|---|---|---|---|---|
| Me2/Em15 | 36.00 | 17.00 | 47.22 | 0.80 |
| Me3/Em4 | 39.00 | 21.00 | 53.85 | 0.89 |
| Me4/Em3 | 35.00 | 16.00 | 45.71 | 0.85 |
| Me4/Em5 | 34.00 | 12.00 | 35.29 | 0.78 |
| Me4/Em11 | 42.00 | 14.00 | 33.33 | 0.89 |
| Me5/Em5 | 37.00 | 17.00 | 45.95 | 0.84 |
| Me5/Em14 | 44.00 | 23.00 | 52.27 | 0.90 |
| Me6/Em5 | 41.00 | 12.00 | 29.27 | 0.89 |
| Total | 308 | 132 | – | – |
| Mean | – | – | 42.86 | 0.86 |
| Pop | Sample size | Na | Ne | H | I | N | P (%) |
|---|---|---|---|---|---|---|---|
| FJ | 30 | 1.2652 | 1.1171 | 0.0732 | 0.1147 | 35 | 26.52 |
| GX | 30 | 1.2652 | 1.1193 | 0.0732 | 0.1144 | 35 | 26.52 |
| PJ | 30 | 1.2652 | 1.1242 | 0.0749 | 0.1156 | 35 | 26.52 |
| SD | 30 | 1.2652 | 1.1038 | 0.0647 | 0.1023 | 35 | 26.52 |
| DD | 30 | 1.2576 | 1.1242 | 0.0766 | 0.1183 | 34 | 25.76 |
| HN | 30 | 1.2576 | 1.1334 | 0.0785 | 0.1188 | 34 | 25.76 |
| DL | 30 | 1.2424 | 1.1275 | 0.0756 | 0.1149 | 32 | 24.24 |
| NK | 30 | 1.2424 | 1.1357 | 0.0793 | 0.1196 | 32 | 24.24 |
| JS | 30 | 1.2727 | 1.129 | 0.0779 | 0.1202 | 36 | 27.27 |
Note:
Na, Observed number of alleles; Ne, Effective number of alleles; H, Nei’s gene diversity; I, Shannon’s Information index; N, The number of polymorphic loci; P, The percentage of polymorphic loci.
Population genetic differentiation
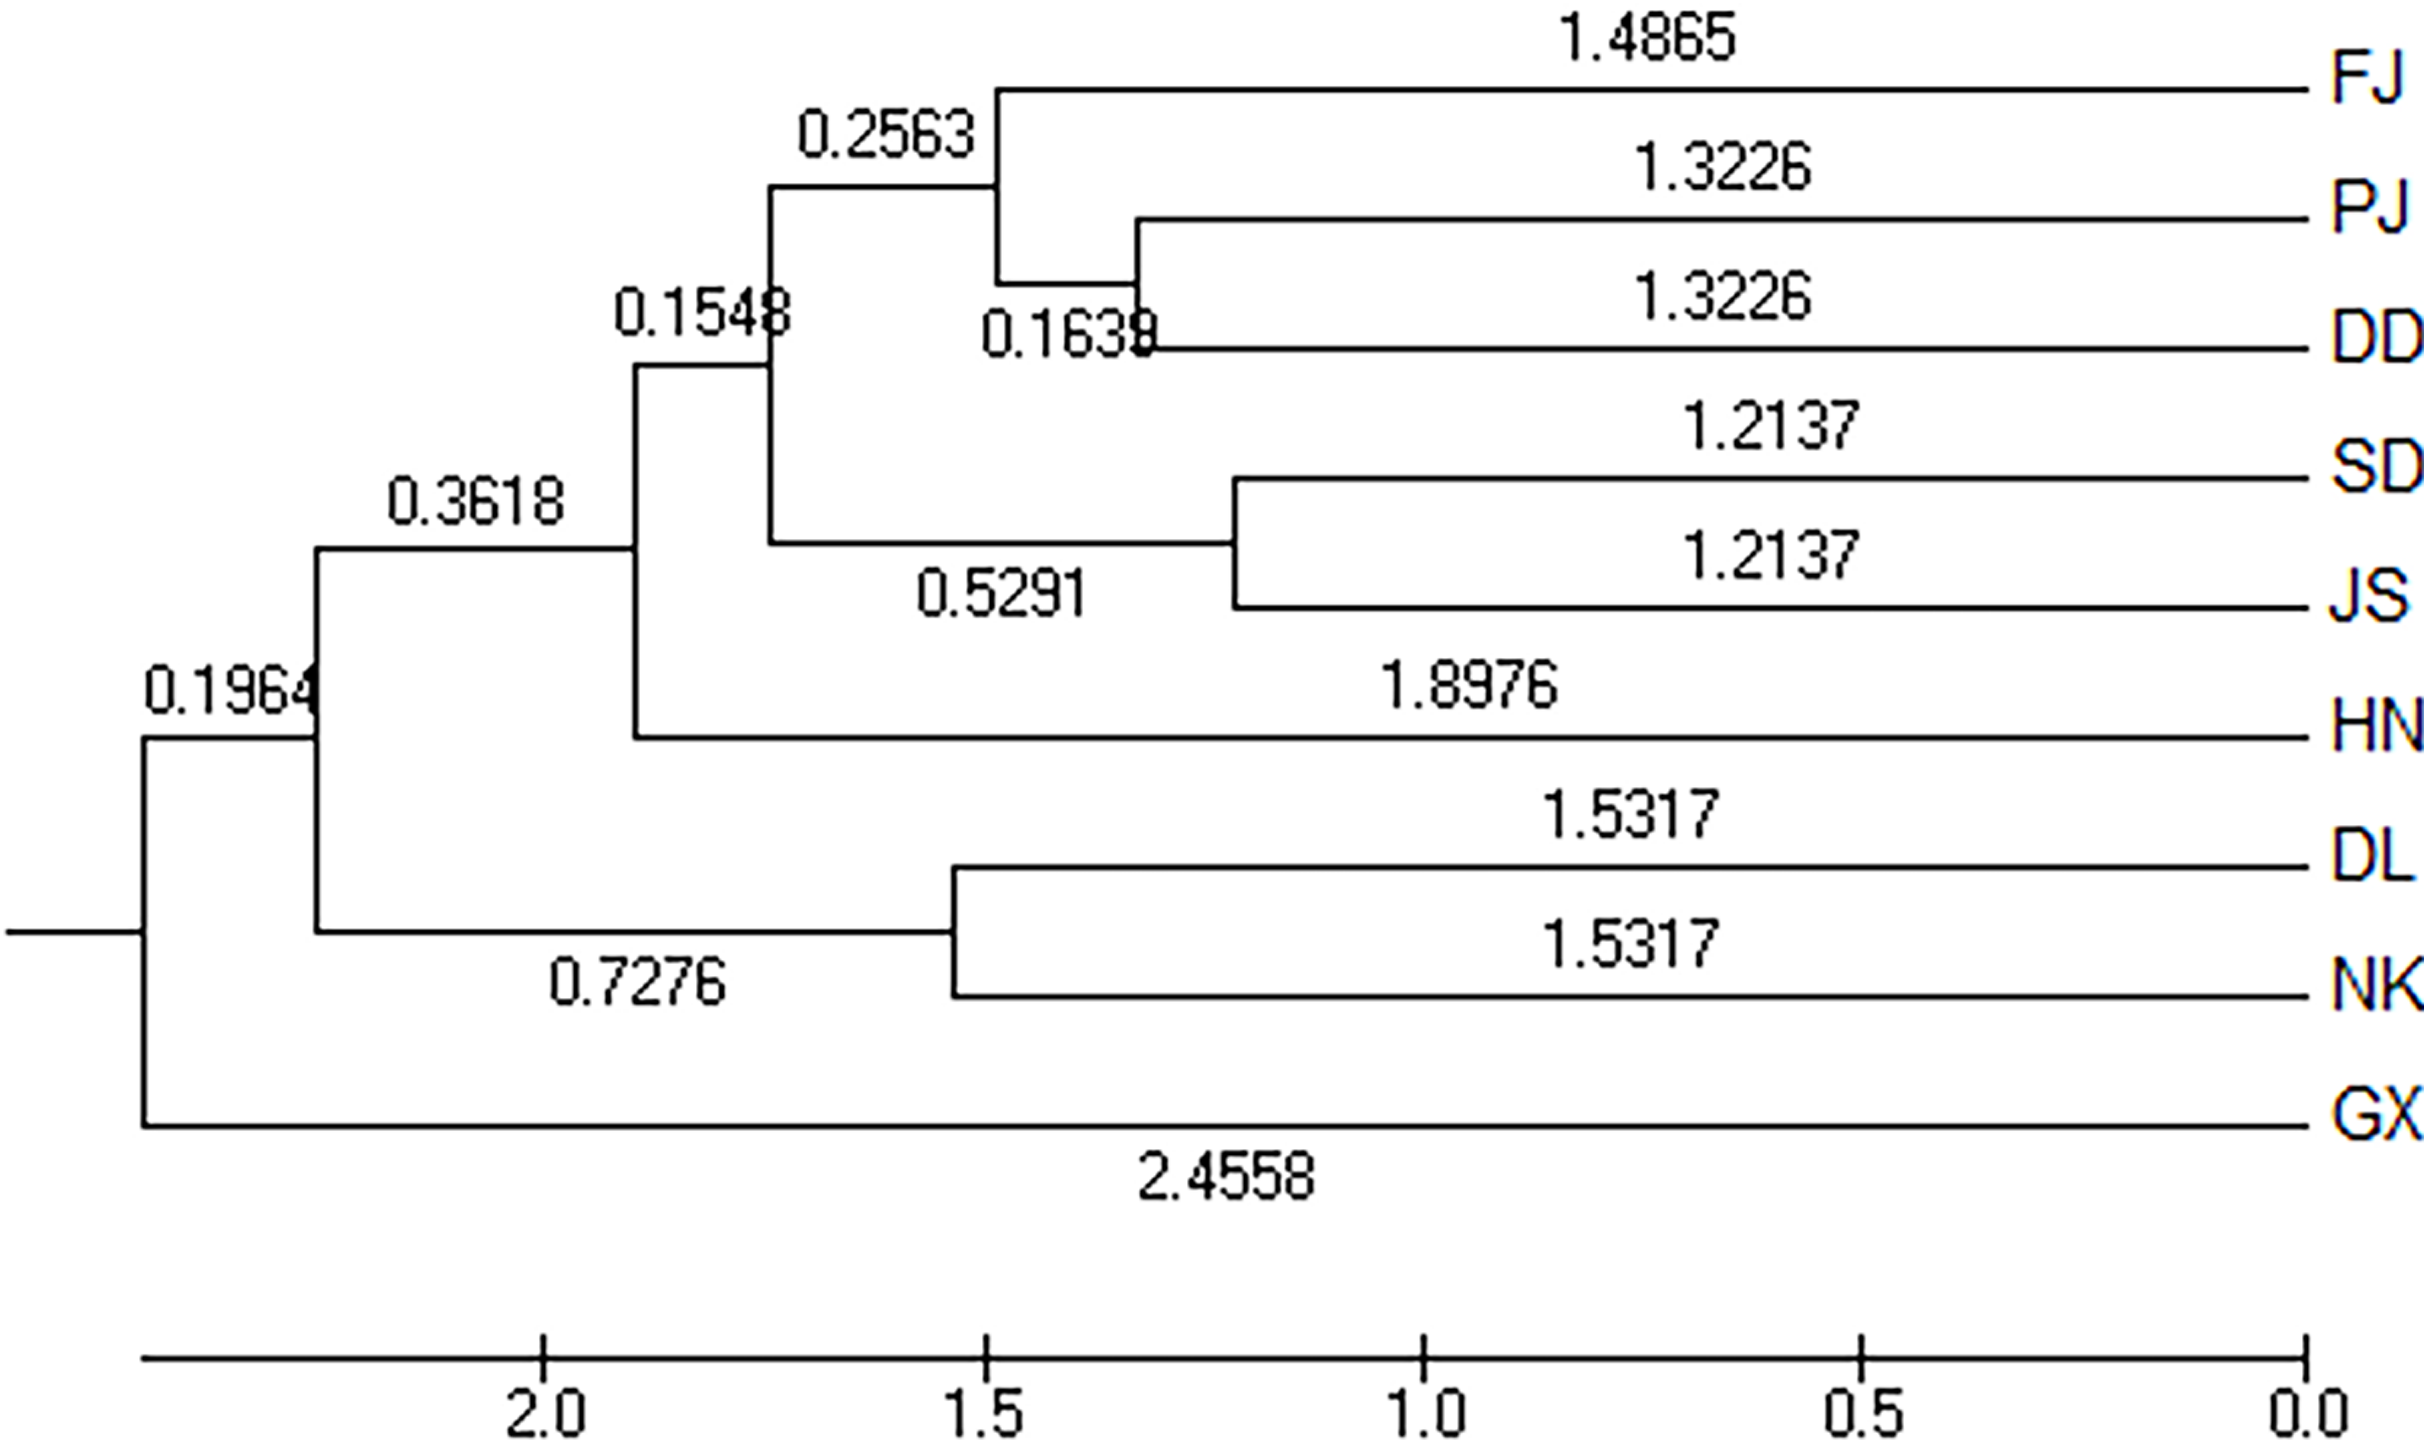
The Nei’s unbiased measures genetic identity and genetic distance of nine geographical groups of M. petechialis were calculated according to the allele frequency of each locus and the results were shown in Table 4. The genetic distance between the GX and SD groups was the largest (0.0570) and the genetic similarity was the smallest (0.9446); The genetic distance between the SD and JS groups were the closest (0.0243) and the genetic similarity was the largest (0.9760). The cluster analysis of neighbor-joining trees showed that the GX forms a single population (Fig. 2), indicating that the genetic distance of the GX population was the furthest and there was a certain genetic differentiation.
| pop | FJ | GX | PJ | SD | DD | HN | DL | NK | JS |
|---|---|---|---|---|---|---|---|---|---|
| FJ | **** | 0.9585 | 0.9725 | 0.9724 | 0.9689 | 0.9638 | 0.9675 | 0.9632 | 0.9629 |
| GX | 0.0424 | **** | 0.9575 | 0.9446 | 0.959 | 0.9446 | 0.946 | 0.9508 | 0.9558 |
| PJ | 0.0279 | 0.0434 | **** | 0.9606 | 0.9739 | 0.9606 | 0.9546 | 0.9559 | 0.9625 |
| SD | 0.0280 | 0.0570 | 0.0402 | **** | 0.9631 | 0.9667 | 0.9554 | 0.9614 | 0.976 |
| DD | 0.0316 | 0.0418 | 0.0265 | 0.0376 | **** | 0.9585 | 0.9463 | 0.9579 | 0.973 |
| HN | 0.0369 | 0.0570 | 0.0402 | 0.0339 | 0.0424 | **** | 0.945 | 0.9548 | 0.9642 |
| DL | 0.0331 | 0.0556 | 0.0465 | 0.0457 | 0.0552 | 0.0566 | **** | 0.9698 | 0.9449 |
| NK | 0.0375 | 0.0505 | 0.0451 | 0.0393 | 0.043 | 0.0463 | 0.0306 | **** | 0.9582 |
| JS | 0.0379 | 0.0452 | 0.0382 | 0.0243 | 0.0273 | 0.0365 | 0.0514 | 0.0427 | **** |
Notes:
Nei’s genetic identity (above diagonal) and genetic distance (below diagonal).
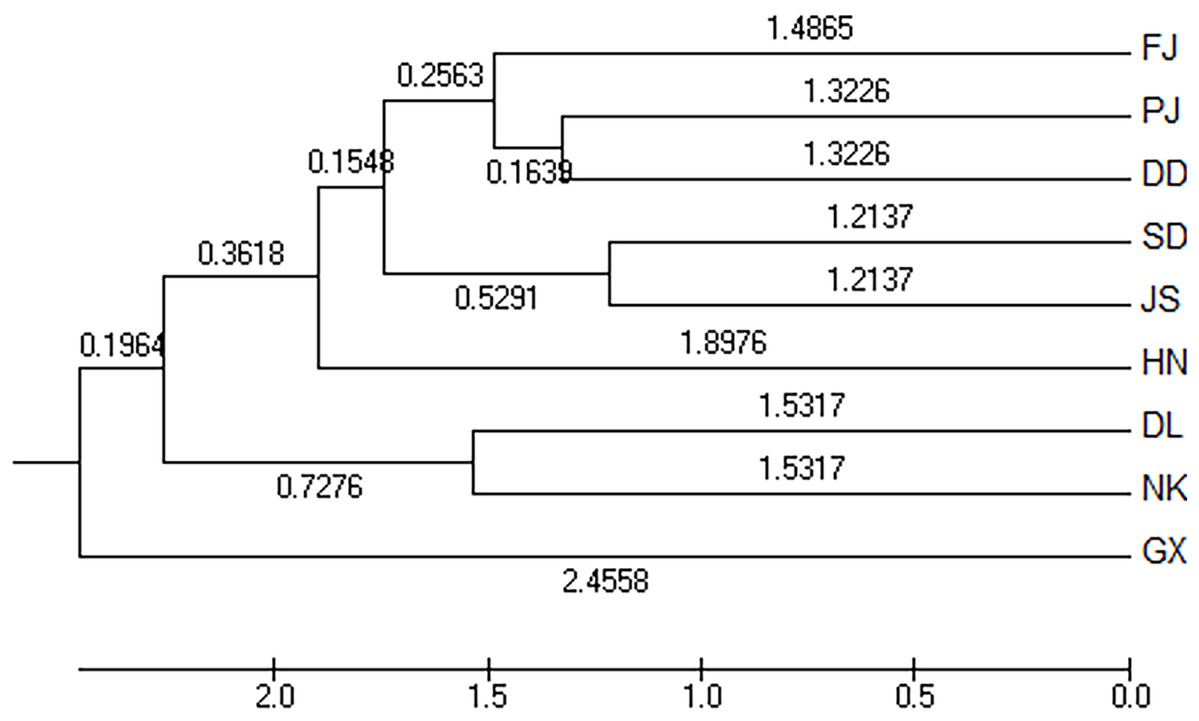
Figure 2: The unweighted pair group method with anarithmetic mean (neighbor-joining) dendrogram based on DC distance among the nine populations of Meretrix petechialis.
Population clusters and structure analysis
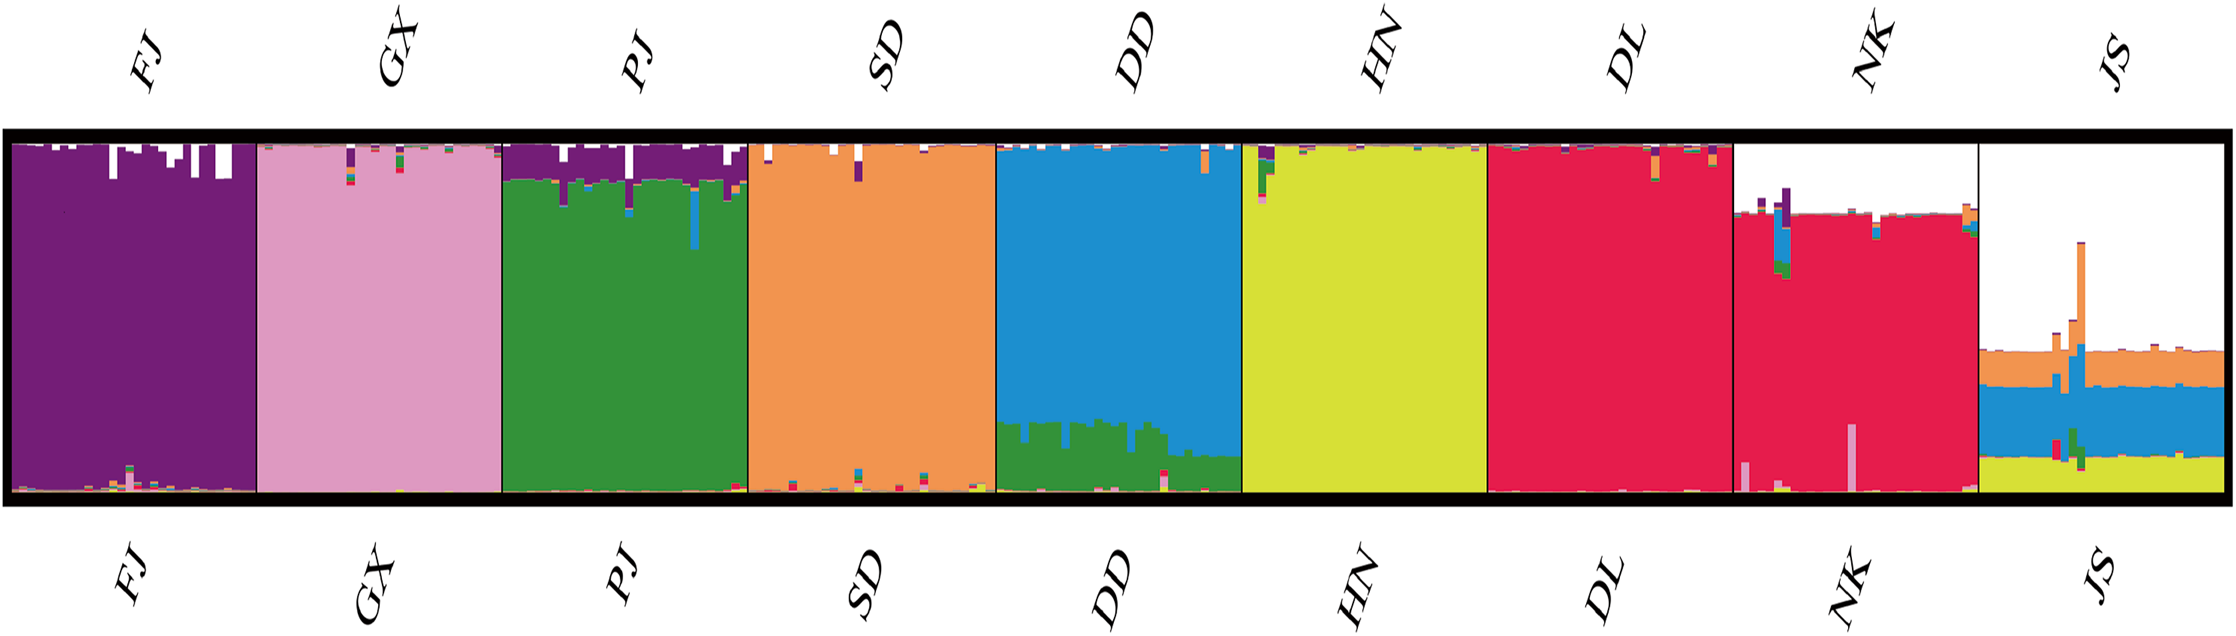
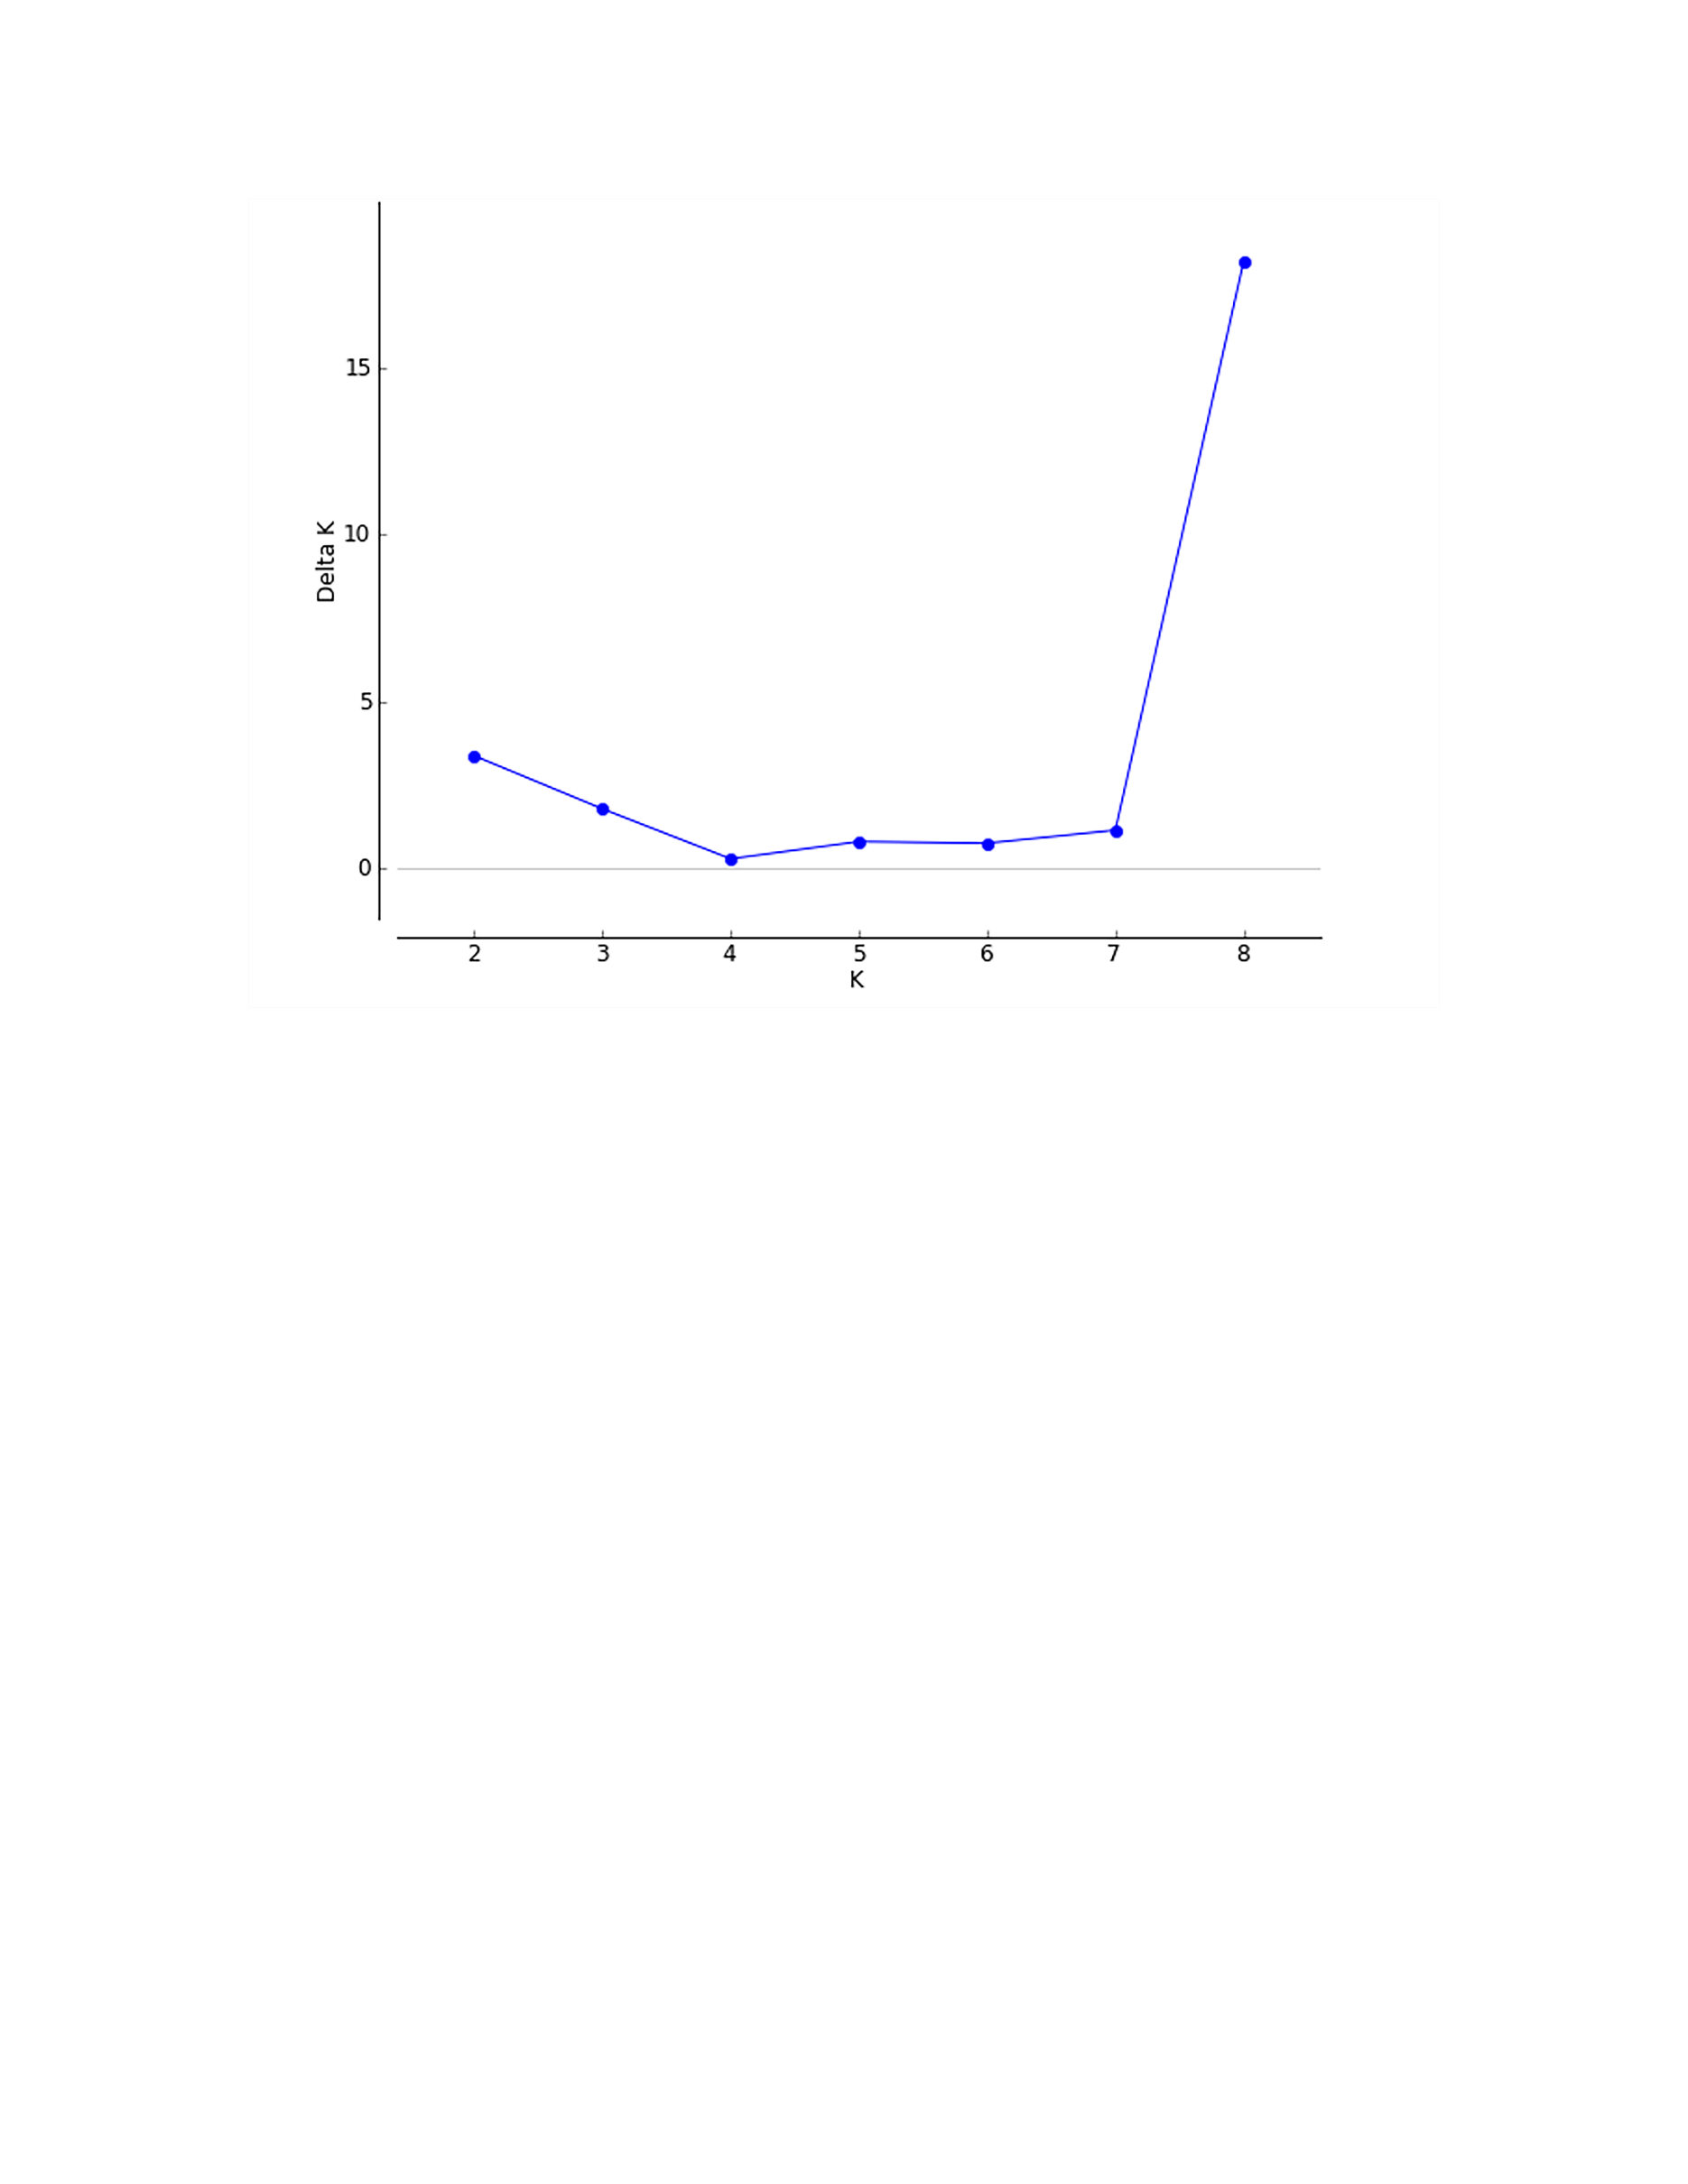
According to the method of Earl & Vonholdt (2012), we used structure harvester website to analysis the K, the program provides a fast way to assess and visualize likelihood values across multiple values of K and thousands of iterations for easier detection of the number of genetic groups that best data. In the structure analysis, the highest ΔK = 8 (Fig. S1), which suggested that the nine populations of M. petechial were split into eight clusters (Fig. 3) and from the overall distribution of colors in it, we saw that most of the background colors of the DL and NK populations are the same, suggesting they were formed the same cluster, we suspected that it might be due to the close distance and similar genetic backgrounds. In contrast, the pink color which represented the GX group was hardly appeared in any other group, indicating that GX population has single genetic background, distant relationship and almost no gene flow with others populations. Additionally, the color composition of the remaining groups showed admixture with other populations color, it suggested that have a complex background and there is a certain degree of gene flow between the populations. The result was similar using the neighbor-joining dendrogram (Fig. 2). This also revealed that the northern and southern populations were not very integrated and their distribution pattern was could be based on geographical distance. To further elucidate the gene differentiation between populations, we performed (PCA) using Origin Pro. PCA was a supplement to cluster analysis, which analyzed the structural similarity of germplasm resources at marker locus. The PCA of 270 samples was calculated, in 132 principal components, the cumulative contribution rate of the first two principal components was 12.1%, contribution rates of the first and second principal components were 6.5% and 5.6%, respectively (Fig. 4). Nine populations were distributed into four different clusters, the PCA diagram revealed one cluster was GX population, two cluster included FJ, PJ, DD and three clusters included SD, HN, JS and four included DL, NK. In general, the classification results of each cluster have high correspondence with the NJ tree and structure. And there are many overlapping phenomena among samples in different geographical areas, but no obvious regional difference. However, because the cumulative contribution rate of the first two principal components is very low, which can reflect less genetic information and cannot accurately explain the genetic diversity information among populations. In this study, the AMOVA results were obtained from nine populations of M. petechial (Table 5). It revealed that populations within regions contributed to 10% of the total genetic variance (Phi-PR). The genetic variance within populations (Phi-PT) was 37% and 53% of the total genetic variance (PhiRT) was calculated between populations from different regions. This indicated that there was significant genetic differentiation within populations. The results obtained from the Nei’s genetic diversity analysis were consistent. The gene flow estimate obtained by PhiPT among populations (Nm (Haploid) = [(1/PhiPT)−1]/2) was 0.555, the Nm value was less than 1.0 and the number of gene exchanges between each generation was 0.555.
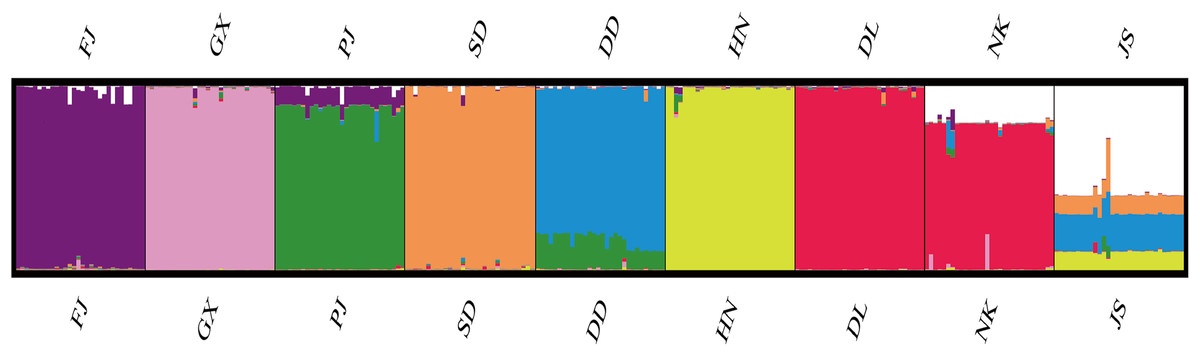
Figure 3: Genetic structure of 270 samples based on a mixed mode (cluster 1 purple is mainly FJ, cluster 2 pink is mainly GX, cluster 3 green is mainly PJ, cluster 4 orange is mainly SD, cluster 5 blue is mainly DD, cluster 6 yellow is mainly HN, cluster 7 red is mainly DL and NK, cluster 8 white is mainly JS).

Figure 4: PCA results of the first two statistically significant components.
The nine populations of Meretrix petechialis were split into 4 clusters (The first black circle includes GX; the second red circle includes FJ, PJ, DD; the third green includes SD, HN, JS; the last blue includes DL, NK).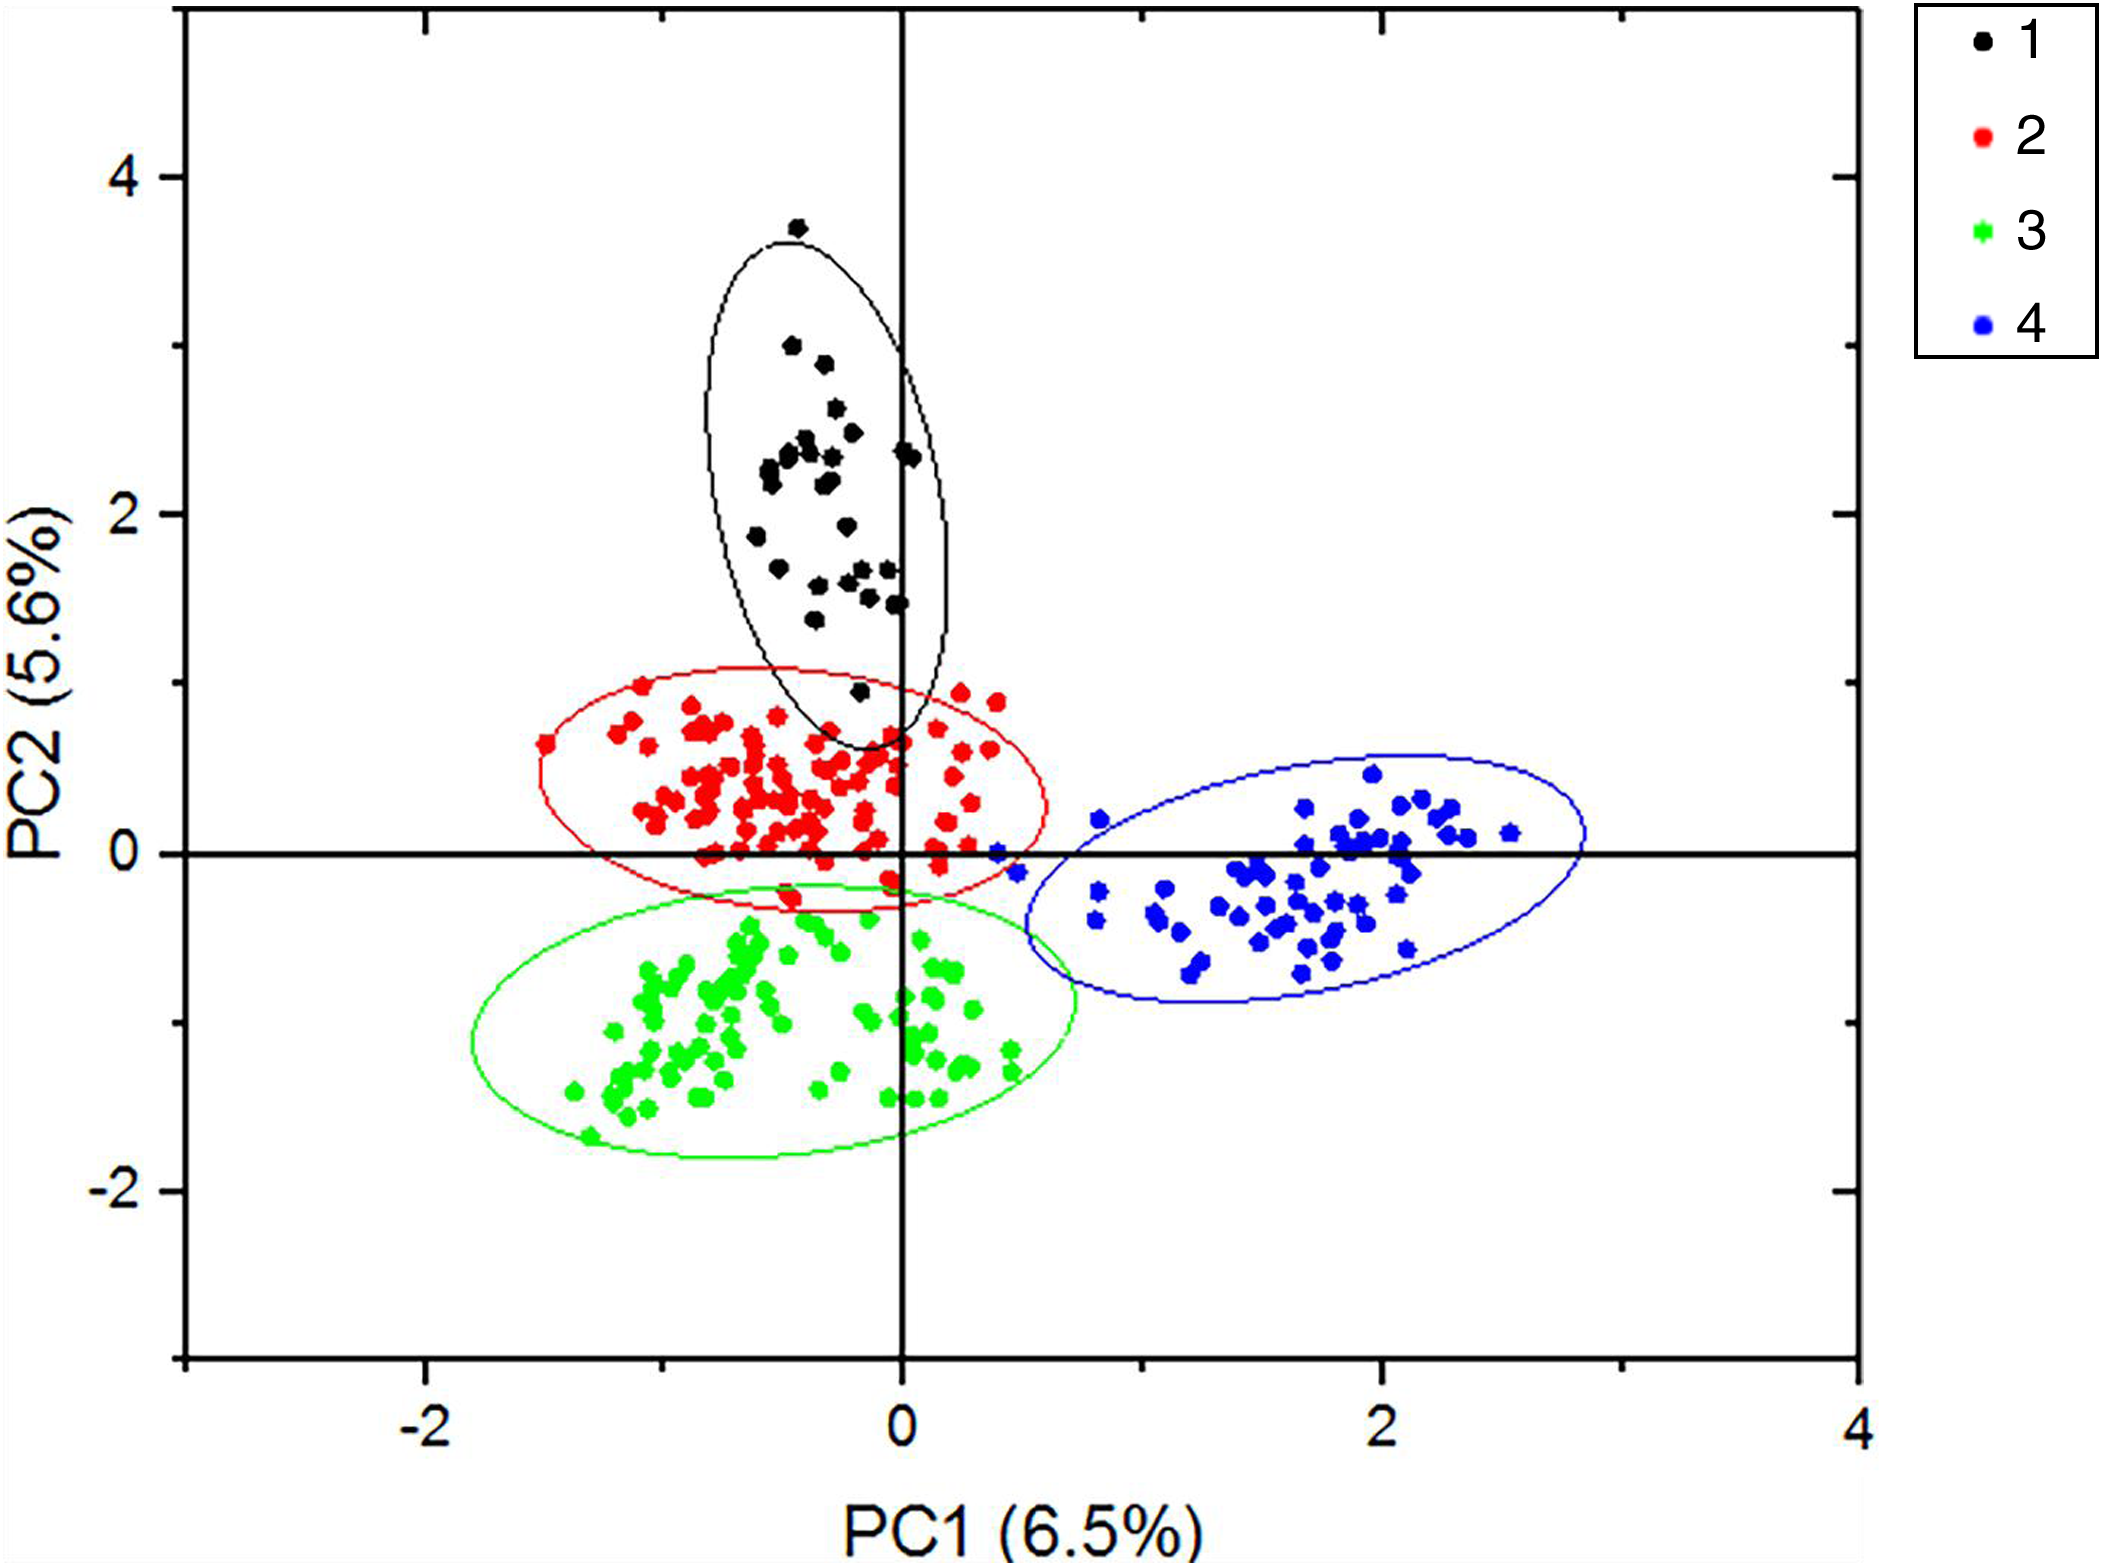
| Source | df | SS | MS | Est. var. | Percentage (%) | Phi statistic | Value | P (rand ≥ data) |
|---|---|---|---|---|---|---|---|---|
| Among regions | 7 | 1,182.239 | 168.891 | 1.113 | 10 | PhiRT | 0.099 | 0.001 |
| Among pops | 1 | 131.783 | 131.783 | 4.196 | 37 | PhiPR | 0.416 | 0.001 |
| Within pops | 261 | 1,538.133 | 5.893 | 5.893 | 53 | PhiPT | 0.474 | 0.001 |
| Total | 269 | 2,852.156 | 11.203 | 100 |
Note:
df, degree of freedom; SS, sum of squared observations; MS, mean of squared observations; PhiRT, proportion of the total genetic variance that is, due to the variance between regions; PhiPR, proportion of the total genetic variance that is, due to the variance among populations within a region; PhiPT, proportion of the total genetic variance that is due to the variance among individuals within a variant.
Discussion
At present, research on M. petechialis germplasm resources in China mainly adopts random amplified polymorphic DNA (RAPD) (Shen et al., 2003; Du et al., 2004), inter-simple sequence repeat (Chen et al., 2004), amplified fragment length polymorphism (AFLP) (Lin et al., 2008; Zhu et al., 2011). In addition, cytochrome oxidase I and internal transcribed spacer are widely used to reflect the genetic variation of genomic DNA from ribosomes to mitochondria (Li et al., 2006, 2016). To rapidly obtain M. petechialis genetic information, PCR-based SRAP marker technique was herein employed. Relative to other molecular markers, SRAP is simple, inexpensive, highly variable and less technically demanding to obtain or use and effective for producing genome-wide fragments with high reproducibility and versatility. Notably, SRAP markers target coding regions of the genome (Li & Quiros, 2001) and possess the capacity to elucidate markers with inherent biological significance (e.g., QTL identification), therefore have potential beyond more commonly applied multilocus markers. In present work, we collected samples from more regions, aiming to apply SRAP markers to grasp more diversity information of M. petechialis in recent years, so as to lay the foundation for genetic breeding.
Ecological and systematic studies often depend on the use of molecular tools to address questions regarding genetic relatedness among individuals, population structure and phylogenetic relationships. In the present study, SRAP markers were applied to assess the level and pattern of genetic diversity in nine populations of M. petechialis. The results show that 132 polymorphic bands were detected by eight pairs of SRAP primers and the number of polymorphic alleles with an average amplification of each pair of primers was 16.5. Compared with the results of the study that analyzed the germplasm resources in three geographical groups of M. petechialis from Guangxi Beihai (GX), Jiangsu Nantong (JS) and Liaoning Dalian (LN) by SRAP markers (Zhang et al., 2010), although the average polymorphism of each primer detected was low, the average number of bands detected by each primer was relatively high, indicating that even if there were various differences in the test, the diversity of the samples detected by the SRAP marker was stable and reliable.
Genetic diversity is an important indicator of population genetic variation, mainly reflecting changes in genetic differences between different genetic loci. Among them, Nei’s gene diversity and Shannon’s information index are common indicators reflecting genetic diversity among populations. According to the polymorphism of SRAP amplified loci and genetic diversity parameter for nine population of M. petechialis, the JS population has a abundant genetic diversity, which was similar to previous studies reported by Shen et al. (2003), Chen et al. (2004) and Li et al. (2016).
In this study, we applied Structure, PCA and NJ tree to further analyze and illustrate the genetic diversity of nine geographical M. petechialis populations. Combining the results of three different analysis, GX forms a single population indicated that the genetic distance of the GX population with other populations was the largest and the germplasm resources of GX are relatively pure and there was no cross-contamination with other groups but a certain genetic differentiation, which is consistent with previous study using AFLP markers (Lin et al., 2008) and SRAP markers (Zhang et al., 2010). The local germplasm resources in FJ, GX, SD, HN, DL populations were better protected with the population invasion from other areas is relatively mild (Fig. 3). In addition, due to different place transplantation, proliferation and release, the genetic background of PJ, DD, NK, JS populations were polluted by other populations to varying degrees. The genetic similarities of the nine geographical M. petechialis populations were all less than 1, but they could be clustered together, indicating that the populations have similar genetic backgrounds, but there are certain genetic differences.
The results of this study elucidated that the genetic diversity and population polymorphism is relatively high in GX population, therefore, the potential for the genetic improvement of the breed is in GX population. Nei’s gene diversity analysis indicated that the genetic variance was mainly found within individual geographical populations and the AMOVA revealed low but significant genetic differentiation among local and regional populations. The limited gene flow (Nm = 0.555) was inferred as a major reason for the extent of genetic differentiation in M. petechialis. Wright (1931) suggested that when the Nm value was less than 1.0, the limited gene flow is mainly the reason for the genetic differentiation of the populations and the gene differentiation caused by genetic drift cannot be effectively suppressed (Qu et al., 2004).
In recent years, due to the continuous reduction of M. petechialis germplasm resources, its genetic background has become unstable. The choice of breeding is the main method to improve the beneficial traits of M. petechialis. At the same time, genetic structure analysis of M. petechialis can be carried out by developing and applying molecular techniques to provide a scientific basis for the genetic breeding of M. petechialis. The results obtained here indicated that M. petechialis have high degree of genetic diversity and the potential of further breeding with excellent germplasm resources. The GX population might be more suitable as the base population for selective breeding because its genetic improvement potential is the highest.
Conclusions
In the present study, different geographical populations of M. petechialis were analyzed by SRAP molecular marker to estimate the genetic differentiation and population structure. Nei’s gene diversity analysis indicated that the genetic variance was mainly found within individual geographical populations and the AMOVA revealed low but significant genetic differentiation among local and regional populations. The limited gene flow was inferred as a major reason for the extent of genetic differentiation in M. petechialis. The GX population might be more suitable as the base population for selective breeding because its genetic improvement potential is the highest.