
Plastid transit peptides—where do they come from and where do they all belong? Multi-genome and pan-genomic assessment of chloroplast transit peptide evolution
- Published
- Accepted
- Received
- Academic Editor
- Vladimir Uversky
- Subject Areas
- Bioinformatics, Evolutionary Studies, Genomics, Plant Science
- Keywords
- Plastid, Transit peptide, Protein targeting, Pangenome, Multi-genome, Chloroplast, Signal peptide
- Copyright
- © 2020 Christian et al.
- Licence
- This is an open access article distributed under the terms of the Creative Commons Attribution License, which permits using, remixing, and building upon the work non-commercially, as long as it is properly attributed. For attribution, the original author(s), title, publication source (PeerJ) and either DOI or URL of the article must be cited.
- Cite this article
- 2020. Plastid transit peptides—where do they come from and where do they all belong? Multi-genome and pan-genomic assessment of chloroplast transit peptide evolution. PeerJ 8:e9772 https://doi.org/10.7717/peerj.9772
Abstract
Subcellular relocalization of proteins determines an organism’s metabolic repertoire and thereby its survival in unique evolutionary niches. In plants, the plastid and its various morphotypes import a large and varied number of nuclear-encoded proteins to orchestrate vital biochemical reactions in a spatiotemporal context. Recent comparative genomics analysis and high-throughput shotgun proteomics data indicate that there are a large number of plastid-targeted proteins that are either semi-conserved or non-conserved across different lineages. This implies that homologs are differentially targeted across different species, which is feasible only if proteins have gained or lost plastid targeting peptides during evolution. In this study, a broad, multi-genome analysis of 15 phylogenetically diverse genera and in-depth analyses of pangenomes from Arabidopsis and Brachypodium were performed to address the question of how proteins acquire or lose plastid targeting peptides. The analysis revealed that random insertions or deletions were the dominant mechanism by which novel transit peptides are gained by proteins. While gene duplication was not a strict requirement for the acquisition of novel subcellular targeting, 40% of novel plastid-targeted genes were found to be most closely related to a sequence within the same genome, and of these, 30.5% resulted from alternative transcription or translation initiation sites. Interestingly, analysis of the distribution of amino acids in the transit peptides of known and predicted chloroplast-targeted proteins revealed monocot and eudicot-specific preferences in residue distribution.
Introduction
The endosymbiosis of ancestral cyanobacteria and α-proteobacteria by a eukaryote gave rise to the plastids and the mitochondria in a plant cell (Cavalier-Smith, 1987; Bhattacharya et al., 2007). The host genome acquired the majority of the prokaryotic genes, products of which are imported from the cytosol into the organelle to support a myriad of biochemical processes (McFadden, 1999; McFadden & Van Dooren, 2004). Underlying this intracellular protein import between the nucleic acid harboring organelles was the evolution of the targeting (TP) or signal peptide (SP) (Bruce, 2000).
In plants, the plastid accounts for roughly 10% of all proteins, 95% of which must be imported via specialized chloroplast transit peptides (cTPs) (The Arabidopsis Genome Initiative, 2000; Martin et al., 2002; Richly & Leister, 2004; Ajjawi et al., 2010; Lu et al., 2011; Schaeffer et al., 2014). Evolutionarily speaking, plastids are the most recent organelles; however, their import apparatus is possibly the most complex and dynamic of any organelle. It consists of at least a dozen proteins in the outer and inner chloroplast envelopes as well as soluble cytosolic and stromal chaperones (Bölter & Soll, 2016). Chloroplasts also have several import complexes in the thylakoid membrane network, requiring further customization of transit peptides (Celedon & Cline, 2013).
Despite the complexity, cTPs, are inherently unstructured and have poor sequence conservation and are therefore more likely to evolve de novo compared with functional domains of catalytic proteins (Tonkin et al., 2008). Alterations to SP and TP sequences can cause “subcellular relocalization”, which alters the functional environment of the mature protein leading to novel effects without any changes to the mature protein sequence (Byun-McKay & Geeta, 2007; McKay et al., 2009). Plants and other photosynthetic eukaryotes (algae and protists) may be more affected by changes to subcellular localization due to the presence of chloroplasts, cell wall, and phragmoplasts as distinct subcellular organelles (Pujol, Maréchal-Drouard & Duchêne, 2007).
In silico prediction methods have reported that gain or loss of transit peptides in gene homologs is widespread (Richly & Leister, 2004; Schaeffer et al., 2014), and high-throughput proteomics experiments have reported high variability in the proteomes of plastids both between different plastid morphotypes and across species (Wang et al., 2013; Suzuki et al., 2015). While plastid biology studies have traditionally focused on a few model organisms, including Arabidopsis and tomato, it is becoming clear that they are not sufficient to describe plastid diversity fully.
To illustrate the preceding notion, a related study analyzed plastid diversity in fruit peel of apple (Malus × domestica). It was shown that epidermal plastids and collenchymal plastids adopt distinct morphologies during development, pointing to differences in the diversity or regulation of plastid proteomes (Solymosi & Keresztes, 2013; Schaeffer et al., 2017). Various distinctive plastid morphotypes have been described in fruit or other specialized tissues of different species (Solymosi & Keresztes, 2013; Wang et al., 2013). New plastid morphotypes which play essential and specialized roles in plant growth and development continue to be discovered, such as the recently-described phenyloplast, which accumulates phenylglucosides in vanilla orchid (Brillouet et al., 2014) and the tannoplast, which synthesizes and exports tannin precursors (Brillouet et al., 2013).
A preceding comparative genomics study analyzed 15 plant genomes and two pangenomes to predict the diversity of the plastid proteome (Christian et al., 2020). The primary conclusion was that non-conserved, species- or taxa-specific proteins are more abundant than conserved plastid-targeted proteins in the overall plastid proteome. Conserved proteins accounted for less than 15% of the total number of plastid-targeted pan-proteome. Within individual species, they were outnumbered by semi- to non-conserved proteins by a factor of at least 2-to-1 (Christian et al., 2020). These observations raise a fundamental biological question: How do proteins in different plant species acquire plastid-targeting peptides?
There is evidence of various mechanisms that either individually or in some combination may have contributed to the acquisition of a targeting peptide in proteins marked for import into the plastid. Plastid-targeted genes originated from the ancestral prokaryote and were subsequently re-targeted to the plastid, likely following gene duplication (Richly & Leister, 2004; Byun-McKay & Geeta, 2007). This mechanism could be a significant contributor to the evolution of novel plastid-targeted proteins, especially when the original gene is of critical importance in its native subcellular location. Also, plastid transit peptides are acquired from heterologous loci via exon shuffling either through unequal recombination or movement of retrotransposons (Vibranovski, Sakabe & De Souza, 2006). Furthermore, many plastid transit peptides are encoded by distinct exons (Bruce, 2000). Alternative transcriptional or translational start sites could either skip or unmask a buried transit peptide, resulting in dual localization of the two isoforms; such dual localization occurs in at least 47 proteins and is predicted to occur in up to 400 in Arabidopsis (Carrie, Giraud & Whelan, 2009; Mitschke et al., 2009). The use of alternative start sites in “twinned presequences” is widespread among proteins which are dual-targeted to the chloroplast and mitochondria (Small et al., 1998; Peeters & Small, 2001; Mackenzie, 2005).
The emergence of single nucleotide polymorphisms (SNPs), insertions or deletions (indels), or splice site alterations might underlie the evolution of SPs and TPs as well (Davis et al., 2006; Byun-McKay & Geeta, 2007; McKay et al., 2009). Minor changes to the N-terminal targeting region of a protein can change its affinity for the chloroplast translocons and alter targeting efficiency. An interesting hypothesis states that such minor changes causing “minor mistargeting” could initiate subcellular relocalization events to plastids and other organelles that occur over greater evolutionary periods (Martin, 2010). It has been suggested that the difference in the charge generated due to mutations on the SP could favor targeting either to the plastid or the mitochondria. Phosphorylation of the residues adds a negative charge favoring translocation to the plastid compared to an overall positive charge, which favors targeting to the mitochondrion (Garg & Gould, 2016). It has also been proposed that plastids and mitochondria were derived from microbes that had developed a resistance strategy against antimicrobial proteins by internalizing and proteolytically destroying them using specific peptidases (Wollman, 2016).
By examining experimentally validated and predicted plastid transit peptides from multiple plant species, the hypothesis that transit peptides evolve via simple substitutions, insertions, and deletions, or alternative start sites was tested. The term “Nascent” was used to designate evolutionarily newly emergent TP sequences in the genes analyzed in this study. Nascent Plastid-targeted Proteins (NPTPs) were identified in a diverse range of angiosperms, and potential evolutionary mechanisms were evaluated to determine which, if any, are most common. Further, the above-mentioned hypothesis was also tested at the intraspecies level using the pan-genomes of Arabidopsis thaliana and Brachypodium distachyon.
Methods
Clustering gene families and subcellular prediction
For the multi-genome dataset, predicted proteomes from Amborella trichopoda, A. thaliana, B. distachyon, Fragaria vesca, Glycine max, Malus × domestica, Oryza sativa, Panicum virgatum, Populus trichoarpa, Prunus persica, Setaria italica, Solanum lycopersicum, and Sorghum bicolor were downloaded from phytozome (https://phytozome.jgi.doe.gov). Transcriptome-based gene models were utilized for Anthurium amnicola and Vitis vinifera (Vitulo et al., 2014; Suzuki et al., 2017). For Malus × domestica, a supplementary transcriptomics-based predicted proteome was created using the SRA datasets from (Krost, Petersen & Schmidt, 2012; Gusberti, Gessler & Broggini, 2013; Krost et al., 2013; Bai, Dougherty & Xu, 2014; Petersen et al., 2015) and assembled using CLC Genomics Workbench v.8 (Qiagen Bioinformatics, Hilden, Germany). For the Arabidopsis1001 dataset, protein sequence files from 246 accessions cataloged in the Arabidopsis1001 proteomes project (Joshi et al., 2012) were downloaded from the Arabidopsis1001 Proteomes Portal (“1001 Proteomes”). Sequences were sorted into single gene files using the reference Columbia-0 gene ID. In the BrachyPan dataset, protein sequences files were downloaded from the BrachyPan website (“BrachyPan”) and grouped into orthologous protein clusters using resources by Gordon et al. (2017). For all species, poorly annotated sequences were removed if no BLAST hits above 40% identity and 40% coverage were found for other sequences within the same dataset. Clustering of homologous proteins was performed using two parallel methods. First, reciprocal-best-BLAST hits (RBH) were generated by performing ALL-v-ALL BLASTP comparisons of the predicted proteome of each species against those of every other species. Sequences for each genome pair which were the mutual best hits above 40% identity and 40% coverage were kept as initial cluster connections. Initial clusters were expanded using reciprocal better-BLAST hits within each genome, performed using ALL-v-ALL BLASTP comparisons of the predicted proteome of each species against itself. Sequences which had mutual hits above 90% identity and 90% coverage were kept. All cluster edges were collapsed to form clusters. In the second method, the UCLUST algorithm (Edgar, 2010) was executed on a concatenated, length-sorted sequence file of the predicted proteomes of all 15 species using a 40% identity and 40% coverage threshold. From these initial clusters, random sequences from within each cluster, sorting these sequences by length, concatenating them to the beginning of the length-sorted initial sequence file, and re-running using a 90% identity threshold, minimum of 40% coverage, and maximum target length of 2.5× the query length. This randomized seed method was iterated 100 times, and all clusters from the initial run and subsequent iterations were condensed if they shared at least one sequence. From both RBH and UCLUST methods, clusters were selected which contained at least three species and only a single species with a predicted plastid-targeted sequence (Christian et al., 2020).
Unique sequences from each dataset were analyzed with TargetP v.1.1 (Emanuelsson et al., 2000, 2007) and Localizer v.1.0.2 (Sperschneider et al., 2017) using default program parameters. All sequences predicted by both methods to have chloroplast localization were determined to be plastid-localized, and sequences predicted by one or neither method were determined to be non-plastid-targeted. Custom scripts are available in Supplemental File 6.
Transit peptide analysis
Experimentally-validated proteomics data were retrieved from PPDB (Sun et al., 2009), AT_CHLORO (Ferro et al., 2010), SUBA4 (Hooper et al., 2017), CropPAL, and CropPAL2 (Hooper et al., 2015). Non-redundant sequences validated by mass spectrometry and with unambiguous localization were extracted and residue composition and positional frequency within the 60 residues comprising the transit peptide and all downstream residues comprising the mature protein were analyzed. For the analysis of in silico prediction methods, all sequences with a predicted plastid transit peptide from each species used in the multi-genome dataset were similarly analyzed for residue composition and positional frequency.
Phylogenetics
All clusters derived for the multi-genome, Arabidopsis1001 and BrachyPan datasets were trimmed of poorly-aligned sequences before phylogenetic analysis using a BLAST filter to remove any sequences with less than 40% identity and 40% coverage to any of the predicted plastid-targeted sequences. Maximum likelihood phylogenetic trees were constructed for each cluster using MAFFT v. 7.407 (Katoh et al., 2002; Katoh & Standley, 2013), and trimmed with Phyutility v2.2.6 (Smith & Dunn, 2008). Pasta v.1.0 (Mirarab et al., 2015) and FastTree 2.1.10 (Price, Dehal & Arkin, 2010) were used for alignments of trimmed files, and phylogenetic trees were constructed using RAxML v. 8.2.31 (Stamatakis, 2006, 2014). The point of divergence between plastid-targeted and non-plastid-targeted sequences for each gene cluster was performed using a custom Perl script (Supplemental File 6) and determined by examination of branch lengths in Newick-formatted maximum likelihood trees. Clusters in which predicted plastid-targeted sequences arose more than once were discarded as probable examples of the polyphyletic origin or ambiguous targeting sequence. Additionally, clusters in which a transit peptide was gained and then lost or in which a plastid-targeted sequence rooted the tree were discarded. Second sequence alignment was performed on the divergent pairs of sequences using MUSCLE v.3.8.31. Mutations within the transit peptide region were defined as the part of the alignment corresponding to the first 60 residues of the plastid-predicted sequence, and the mature region was considered to be the remainder of the alignment. Frequency of substitutions and residue classes was collected for all sequences. Alignments which started with a gap but in which the first aligned residue was a methionine in both sequences were classified as alternative start sites. Alignments with insertion of at least 10 residues followed by a deletion of at least 10 residues, or vice versa, were categorized as alternative first exons. Finally, alignments in which more substitutions occurred than gaps were classified as substitution-dominant, while alignments fulfilling the reverse criteria were classified as insertion or deletion-dominant.
Gene ontology
Annotations for NPTPs were retrieved from Phytozome (https://phytozome.jgi.doe.gov) for each of the species used in the analysis except A. amnicola and V. vinifera, which were retrieved from Suzuki et al. (2017) and Vitulo et al. (2014), respectively. Annotations for BrachyPan were retrieved from the Supplemental Materials (Gordon et al., 2017). Non-redundant predicted proteins produced by the de novo transcriptome assembly of Malus × domestica as described previously (Christian et al., 2020) were annotated using BLASTP against the NR Protein database at NCBI with BLAST2GO default parameters (Conesa et al., 2005; Conesa & Götz, 2008) (BioBam Bioinformatics, Valencia, Spain). GOslim annotations were retrieved using BLAST2GO. Over- and under-represented GO terms for each dataset was performed using BLAST2GO. Fisher’s Exact Test was used to calculate significance, and all terms below a false discovery rate (FDR) significance threshold of 0.05 or P-value threshold of 0.05 were extracted.
Results and Discussion
Residue analysis of experimentally-validated and predicted transit peptides
Although cTPs lack significant homology or functional motifs, they are well-documented to be enriched in certain amino acids and biochemical classes and deficient in others. A comprehensive analysis was conducted using the amino acid content and sequence of a set of 10,868 non-redundant sequences validated by mass spectrometry available in the PPDB (Sun et al., 2009), AT_CHLORO (Ferro et al., 2010), SUBA4 (Hooper et al., 2017), and CROPPAL2 (Hooper et al., 2015) databases. These sequences were primarily derived from Arabidopsis, but also contained significant numbers of proteins from rice and maize and a smaller percentage of proteins from other plant species. The transit peptide was defined as the first 60 amino acids of each experimentally-validated or predicted plastid-targeted protein. Most cleaved transit peptides are 41–70 residues long with an average of 51–60 residues (Kleffmann et al., 2007; Huang et al., 2009; Bienvenut et al., 2012; Teixeira & Glaser, 2013), but measuring the length of a transit peptide based on its cleavage site is not necessarily a good determinant of its functionality. For instance, the mature protein can exhibit constraints on an otherwise functional transit peptide, causing it to lose translocation functionality or efficiency (Rolland, Badger & Price, 2016). Additionally, the transit peptide residues upstream of the signal peptide peptidase cleavage site in many cases is insufficient to target GFP efficiently to the chloroplast, but the addition of some downstream sequence restores plastid translocation (Comai et al., 1988; Van’t Hof et al., 1991; Pilon et al., 1995; Rensink, Pilon & Weisbeek, 1998; Lee et al., 2008; Shen et al., 2017). A transit peptide of 60 residues in length enables high-efficiency import in most plastid-targeted proteins, so that was used as the standard length of transit peptides for this analysis.
The average residue composition of experimentally-validated transit peptides was compared to the TAIR10 Arabidopsis proteome, revealing multiple residues with altered abundance (Table 1; Fig. 1; Supplemental File 1). Transit peptides were enriched in alanine (+64.1%), proline (+52.4%), arginine (+41.6%), serine (+35.5%), and threonine (+11.1%), a composition well established in the literature (Bruce, 2001; Zybailov et al., 2008). Also, as described in the literature, depletion of the negatively-charged glutamic acid (−46.3%) and aspartic acid (−43.4%) and the aromatic amino acids tryptophan (−36.8%), and tyrosine (−38.6%) was observed. However, depletion of isoleucine (−24.3%), asparagine (−28.6%), lysine (−22.4%), and glutamine (−16.1%) were seen relative to the average TAIR residue composition, none of which have been documented before in plastid transit peptides. Additionally, while tyrosine and tryptophan were depleted in transit peptides, phenylalanine was relatively neutral (−7.9). Phenylalanine is a distinguishing feature of Rhodophyta and Glaucophyta transit peptides and is present in the “FGLK” motif described for preferredoxin and preSSU (Pilon et al., 1995; Wienk et al., 2000; Mcwilliams, 2007; Patron & Waller, 2007). While Mcwilliams (2007) describes either tryptophan or phenylalanine as required for preSSU high-efficiency import, but it may be that phenylalanine is preferred as a relic of ancestral import mechanisms. The observed decrease in average lysine content is unusual, as early reports suggested that the C-terminal or distal end of transit peptides is enriched in positively-charged residues, including both arginine and lysine (Bruce, 2000; Zhang & Glaser, 2002). Additionally, glycine and valine—although abundant in transit peptides at about 6% of residues each—were underrepresented in comparison to average proteome sequence, indicating that they are detrimental or relatively neutral to the function of plastid transit peptides. Overall, these data suggest that bulky R groups are generally not favored in transit peptides unless they serve a special purpose, such as the highly-enriched arginine, which is proposed to interact with TOC33 and TOC159 during translocation (Vetter & Wittinghofer, 2001; Jelic, Soll & Schleiff, 2003).
| Experiment: | Prediction bias | Transit peptide bias | Taxa bias | ||||
|---|---|---|---|---|---|---|---|
| Subject: | Predicted cTP | MS-validated cTP | Monocot whole proteome | Monocot cTP | Monocot cTP | Eudicot cTP | |
| Residue | Query: | MS-validated CcTP | TAIR10 proteins | Eudicot whole proteome | Eudicot cTP | Amborella cTP | Amborella cTP |
| Ala | 3.4 | 43.4 | 20.1 | 111.6 | 112.1 | 0.2 | |
| Cys | 25.1 | 13.5 | 2.0 | 4.1 | −4.7 | −8.5 | |
| Asp | −45.8 | −68.9 | 1.1 | −2.2 | 5.6 | 8.0 | |
| Glu | −48.1 | −70.3 | −4.5 | −10.6 | −25.2 | −16.3 | |
| Phe | −3.5 | −4.0 | −7.0 | −47.7 | −45.4 | 4.5 | |
| Gly | −20.3 | −30.1 | 6.6 | 55.7 | 37.5 | −11.7 | |
| His | 27.1 | 10.2 | 1.8 | −7.4 | −12.9 | −5.9 | |
| Ile | −22.6 | −37.1 | −7.7 | −51.3 | −51.8 | −1.1 | |
| Lys | −22.1 | −32.4 | −11.4 | −54.8 | −52.0 | 6.3 | |
| Leu | 1.5 | −1.3 | −1.2 | −4.8 | −11.1 | −6.6 | |
| Met | −6.8 | 14.7 | 0.6 | −1.4 | −5.5 | −4.2 | |
| Asn | −3.2 | −26.3 | −11.7 | −62.9 | −61.9 | 2.8 | |
| Pro | 42.2 | 100.8 | 7.2 | 44.6 | 30.8 | −9.5 | |
| Gln | −6.9 | −24.3 | −3.8 | −26.3 | −25.2 | 1.5 | |
| Arg | 13.2 | 51.6 | 11.1 | 55.6 | 57.4 | 1.2 | |
| Ser | 25.9 | 76.3 | −4.8 | −23.1 | −17.9 | 6.8 | |
| Thr | 7.8 | 25.4 | −2.5 | −25.5 | −16.2 | 12.4 | |
| Val | −22.4 | −27.9 | 1.2 | 4.5 | 17.1 | 12.1 | |
| Trp | −13.4 | −47.2 | 0.6 | 22.1 | −6.1 | −23.2 | |
| Tyr | −43.4 | −63.5 | −2.8 | −37.7 | −41.9 | −6.7 | |
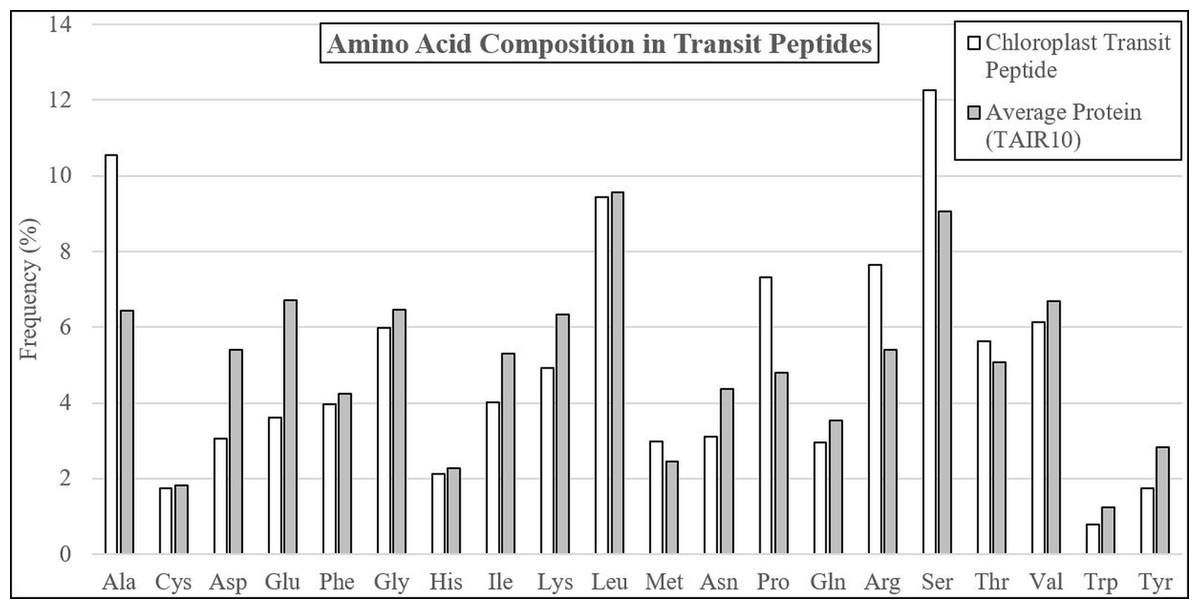
Figure 1: Amino acid compositional changes in transit peptides.
The first 60 residues of Arabidopsis proteins validated by mass spectrometry were analyzed for residue composition and compared with the average residue composition of all Arabidopsis proteins. Extreme enrichment was observed for alanine, proline, arginine, and serine, while significant depletion was found for aspartic acid, glutamine, isoleucine, lysine, asparagine, and tyrosine. Although glycine, leucine, threonine, and valine were abundant, they did not differ significantly from the average residue content in Arabidopsis proteins.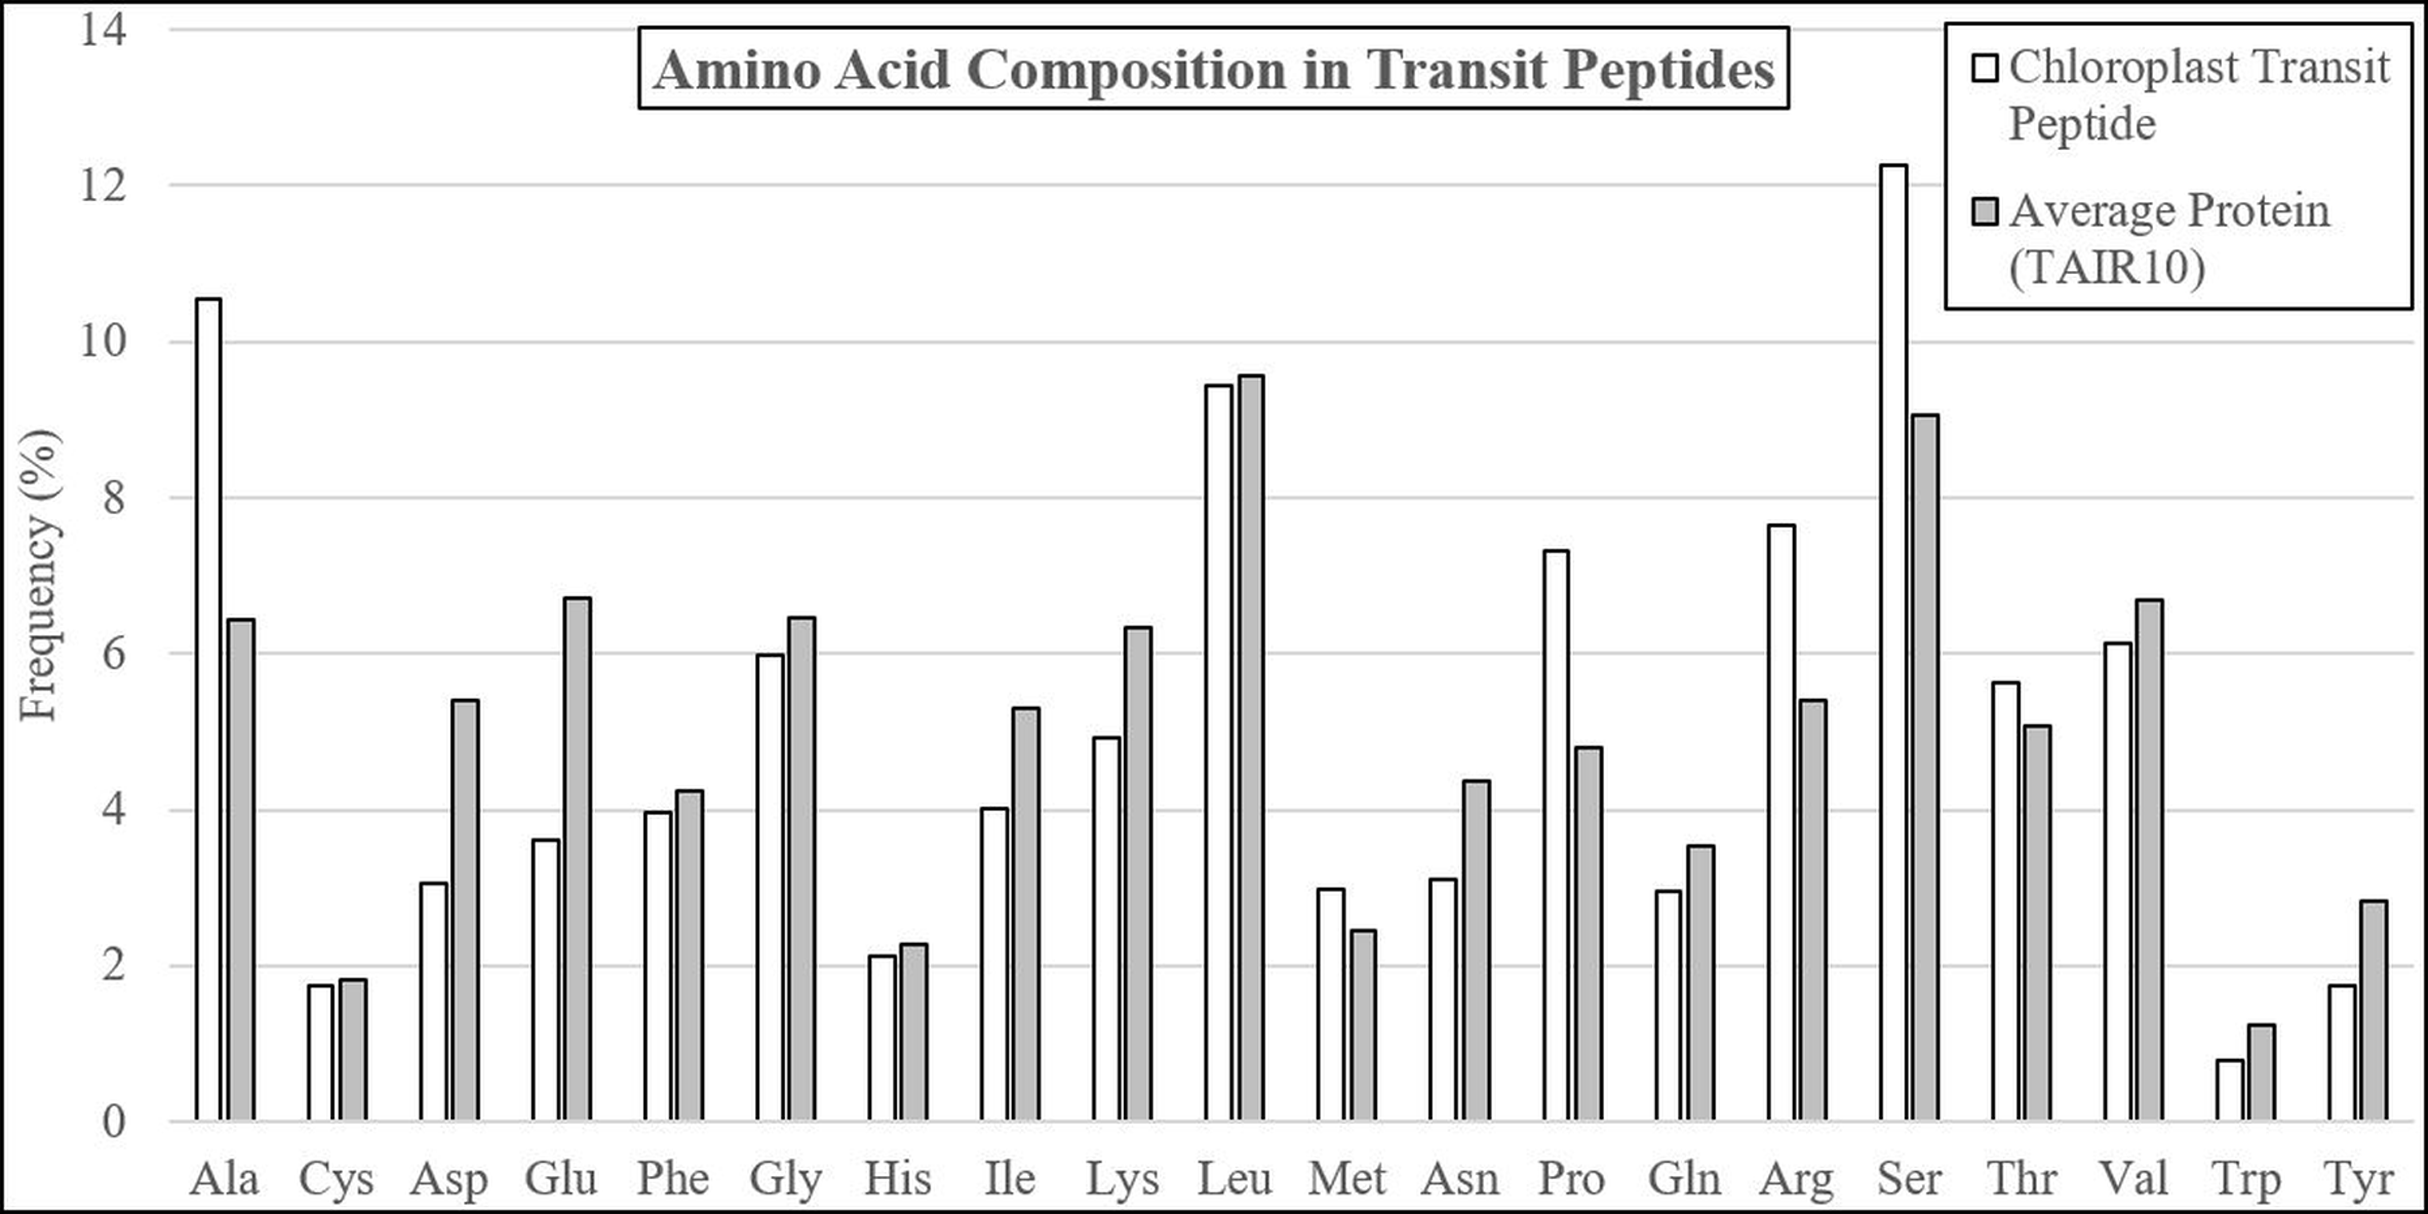
Plastid transit peptide composition is not homogenous but is instead organized in three major domains, as described by several models of transit peptide structure (Karlin-Neumann & Tobin, 1986; Quigley, Martin & Cerff, 1988; Bruce, 2000, 2001; Li & Teng, 2013). These three domains include an uncharged N-terminal proximal region, a central domain rich in hydroxylated residues and lacking acidic residues, and a C-terminal distal region enriched in arginine (Bruce, 2001), corresponding roughly to regions of the transit peptide which interact primarily with the TIC translocase and HSP motor complex, the TOC75 POTRA domains, and the TOC33/159 GTPases, respectively (Richardson et al., 2018). The positional bias of each amino acid was therefore observed for both experimentally validated transit peptides confirmed using mass spectrometry, as well as in putative transit peptides predicted by a combination of TargetP 1.1 and Localizer (Table 1; Fig. 2) (Christian et al., 2020).
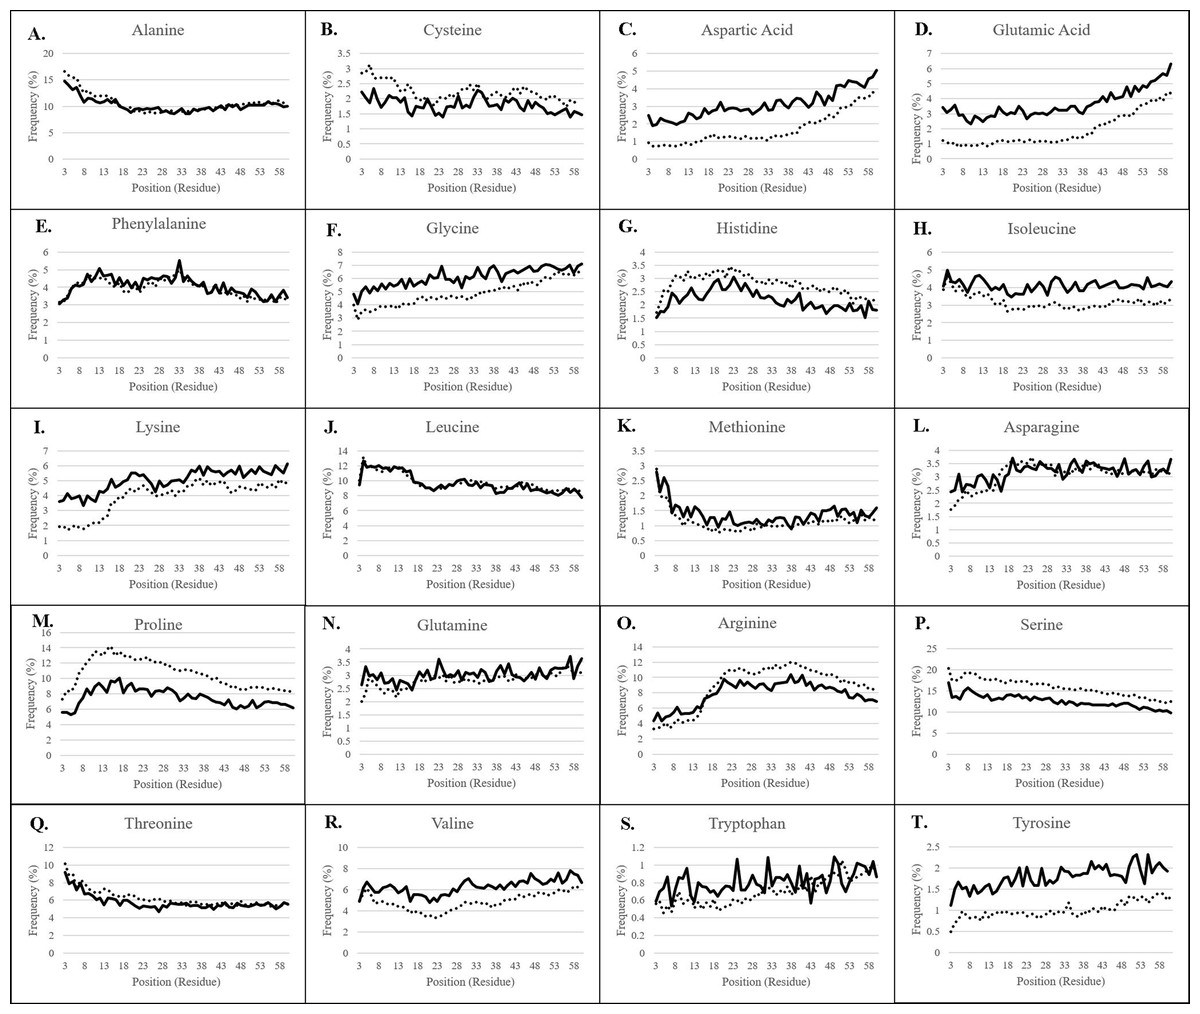
Figure 2: Residue frequency in predicted and experimentally-validated transit peptides.
(A) Alanine; (B) Cysteine; (C) Aspartic acid; (D) Glutamic acid; (E) Phenylalanine; (F) Glycine; (G) Histidine; (H) Isoleucine; (I) Lysine; (J) Leucine; (K) Methionine; (L) Asparagine; (M) Proline; (N) Glutamine; (O) Arginine; (P) Serine; (Q) Threonine; (R) Valine; (S) Tryptophan; (T) Tyrosine. The first 60 residues of sequences validated to be plastid-targeted by mass spectrometry methods (solid lines) and of predicted plastid-targeted proteins in 15 plant genomes (dotted lines) were collected, and residue composition was assessed for each position. Positions 1 and 2 are omitted from each graph due to skew by methionine and alanine, respectively. Frequency patterns match almost exactly between experimentally-validated and predicted plastid-targeted proteins, but there are differences in the absolute frequency for many amino acids, in particular, highly-enriched and highly-depleted residues.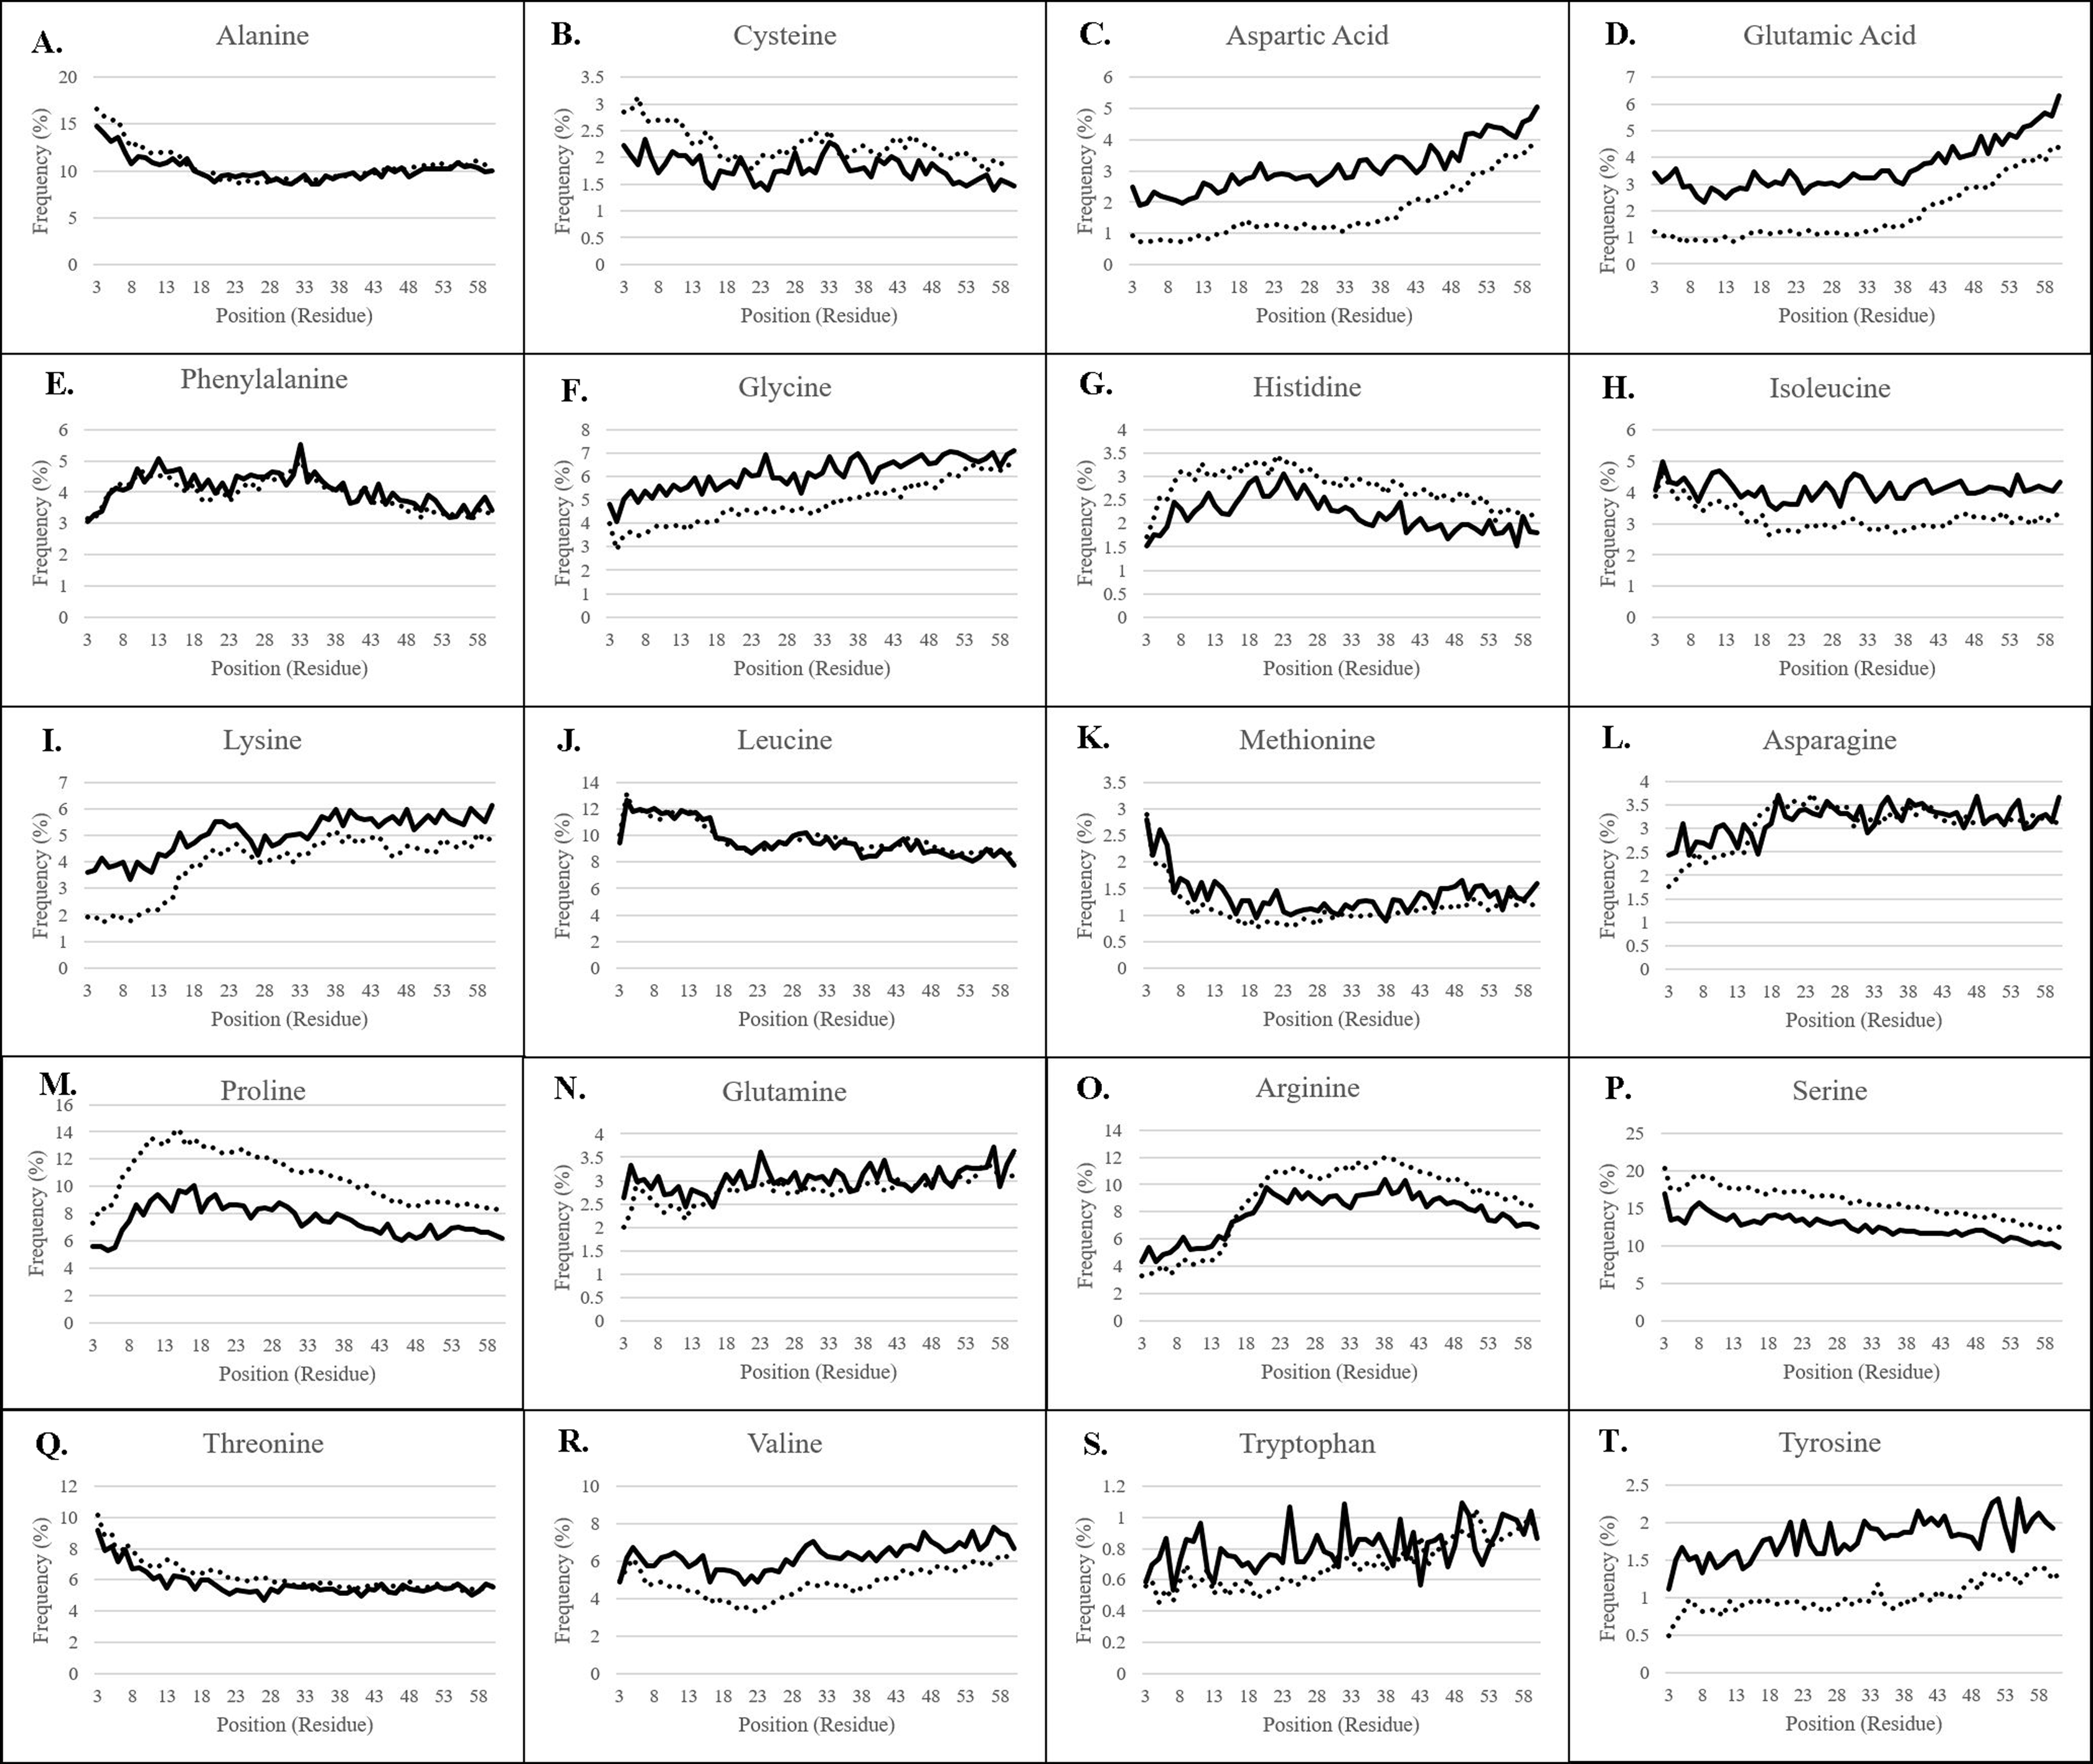
TargetP 2.0 (Juan et al., 2019) was released soon after the conclusion of this analysis. To evaluate the performance of TargetP 2.0 dataset representing experimentally-validated proteins totaling 650 plastid-targeted proteins and 3,072 non-plastidial proteins was used. Three key observations were made regarding the performance of TargetP 2.0: (1) Stand-alone TargetP 2.0 performed better than TargetP 1.1 in terms of specificity, which increased by 30.7%. The MCC and accuracy increased by 0.121 and 5.1%, respectively. There was a decrease in sensitivity by 11% compared to the previous version (Supplemental File 2; Table 1). However, it was not better than the combined approaches. (2) The best workflow of TargetP 1.1 plus Localizer used in this study, and TargetP 2.0 plus Localizer had the same MCC and accuracy values. With TargetP 2.0, the sensitivity actually decreased by 8.2%, and the specificity increased by 9.4%. The overall performance, therefore, was not significantly different. (3) The best workflow with TargetP 2.0 was a 2 of 3 approach in combination with Localizer and MultiLoc, however it was equivalent in performance with TargetP 1.1 plus Localizer. There was a marginal increase of 5.5% in specificity. In our experience, the replacement of TargetP 1.1 with TargetP 2.0 produced runtime error during the processing of the larger datasets, that were initially processed with ease using TargetP 1.1. With the improvements in TargetP 2.0 performance and potential inclusion of machine learning approaches there may be an opportunity to obtain high-quality predictions using any combination of the workflows reported in this work. Therefore, for TP residue analysis, the plastid-targeted proteins predicted using the TargetP 1.1 plus Localizer workflow were used (Christian et al., 2020).
For all residues, nearly identical distribution patterns were observed between experimental (solid lines) and predicted plastid transit peptides (dotted lines) (Fig. 2), thus confirming that the prediction methods selected in this study corresponded well with experimentally validated residues. However, the actual frequency was often somewhat different, as predicted transit peptides had a higher frequency of the more abundant amino acids compared to experimentally-validated proteins, especially serine, arginine, and proline. Serine was nearly 5% more frequent (absolute frequency) in predicted transit peptides despite the higher proportion of Monocot sequences that should dilute its frequency. Proline was also overestimated by 2–4% depending on the position, and arginine was overrepresented by about 2% after position 15. Conversely, predicted transit peptides were underrepresented in rare/neutral or distally-enriched amino acids such as aspartic acid, glutamic acid, glycine, valine, and tyrosine. These observations point to a possible systemic bias in the software, which may focus only on the most essential components. However, the patterns and generally close abundances indicate that prediction tools achieve results that are similar to the experimental methods.
Several amino acids, including alanine, leucine, serine, threonine, and methionine were more abundant at the proximal end of transit peptides. They declined significantly in frequency over the length of the transit peptide (Fig. 2). Of these, all except methionine were found at initial frequencies greater than 5%. Serine alone is initially present at about 17% frequency, while the small nonpolar amino acids alanine and leucine together comprise 25% of residues in the proximal third of the transit peptide. The second category of centrally-enriched amino acids, including proline, arginine, phenylalanine, and histidine, are initially low in abundance, rise to a peak value between positions 10 and 30, then decrease in frequency across the remaining length. Arginine reaches a peak value somewhat later than the other three, peaking instead between positions 20 and 40. Histidine was rare among this group, present at only 1.5% at the proximal end and increasing to a high of only 3% at position 20, though its trend matched that of other centrally-enriched residues. The third group of residues which were initially rare but increased in frequency across the length of the transit peptide and reached a peak in the distal end included lysine, aspartic acid, glycine, and glutamic acid. Both glutamic and aspartic acids followed a small but consistent trend, starting at about 3.5% each for every position at the beginning of the cTP and increasing gradually to a high of 5% for aspartic acid and 6% for glutamic acid. To the best of our knowledge, such a trend has not been reported before, but a 2-fold increase of these residues between the proximal and distal ends of the transit peptide is evident in both experimentally-validated and predicted sequences. From what is known of the TOC GTPases, the primary means of selectivity is due to the hypervariable acidic A-domain of the TOC159 family (Smith et al., 2004; Richardson, Jelokhani-Niaraki & Smith, 2009; Inoue, Rounds & Schnell, 2010). It is possible that the pattern that was observed for negatively-charged amino acids in the distal GTPase-interacting domains of transit peptides is further evidence of these exclusion motifs that alter import efficiency, perhaps by charge repulsion against the acidic TOC GTPase A-domain (Smith et al., 2004). A final group of residues were either very rare (<2%) or exhibited more moderate fluctuations in frequency across the length of the transit peptide, and included valine, glutamine, cysteine, asparagine, isoleucine, tyrosine, and tryptophan.
Transit peptides of different plant taxa may have inherent differences due to genetic drift, to the binding affinity of the TOC and TIC translocon receptors, or to expansion or contraction of gene families for translocon and chaperone subunits. For instance, transit peptides of monocots and eudicots have previously been reported to be enriched in alanine and serine, respectively (Zybailov et al., 2008). Therefore, the amino acid content of sequences from predicted plastid transit peptides of six monocots (A. amnicola, B. distachyon, O. sativa, P. virgatum, S. italica, and S. bicolor), eight eudicots (A. thaliana, F. vesca, G. max, Malus × domestica, Populus trichocarpa, P. persica, S. lycopersicum, and V. vinifera), and the extant angiosperm species A. trichopoda was compared to determine if these trends held true, or if other amino acid biases occurred in certain taxa (Table 1; Fig. 3A). In all genotypes, serine was found to be overrepresented by between 50% and 100% compared with the whole proteome, but in eudicots, serine was more abundant with 30% more serine on average compared with monocot transit peptides. In contrast, alanine was marginally enriched in the transit peptides over whole proteome sequence in eudicots but was extremely enriched in monocots, with a minimum of +50.7% enrichment in A. amnicola up to a high of +81.1% in O. sativa compared to the respective whole proteome. In eudicots, a maximum of only +16.7% alanine enrichment was found in Malus × domestica transit peptides (+16.7%), whereas those of Populus trichocarpa were underrepresented (−1.0%). Alanine was the most abundant amino acid of monocot transit peptides for all genotypes except A. amnicola, and overall, was enriched by 111.6% compared with eudicot transit peptides, whereas serine was the most abundant amino acid in all eudicot genotypes. Alanine is somewhat enriched in the whole proteome of monocot species, but this trend is insufficient to explain these results (Fig. 3B). Alanine enrichment in monocot transit peptides was counterbalanced by depletion of phenylalanine (−91.3%), isoleucine (−105.4%), leucine (−121.5%), asparagine (−169.8%), glutamine (−35.6%), and threonine (−34.2%) compared with eudicots. Tyrosine was also significantly underrepresented (−60.1%) in monocots, although its frequency is extremely low in both clades. Eudicots had somewhat lower glycine, proline, and arginine. Overall, transit peptides of monocots contain more small, nonpolar amino acids, including glycine, valine, and proline, in comparison with eudicots, which have a more flexible amino acid composition. Furthermore, arginine, which is essential in binding and interaction with the TOC GTPases, was relatively higher in monocot sequences (Pilon et al., 1995; Rensink, Schnell & Weisbeek, 2000). One possibility that explains these differences is that changes to monocot translocons select for more conserved transit peptides. Monocots lack all but one isoform of the core TIC subunit TIC20, and also lack the suspected TIC component Ycf1 compared with eudicots (De Vries et al., 2015; Nakai, 2015; Bölter & Soll, 2017). If these missing components impact import efficiency or selectivity, their loss in monocots may favor small, uncharged amino acids in the transit peptides to minimize steric hindrance, and necessitate a higher arginine content to ensure high import efficiency. As research progresses on the non-essential components of TIC such as TIC100, TIC56, and Ycf1, it will be interesting to see if they have a role in increasing import efficiency for transit peptides with unfavorable amino acids.
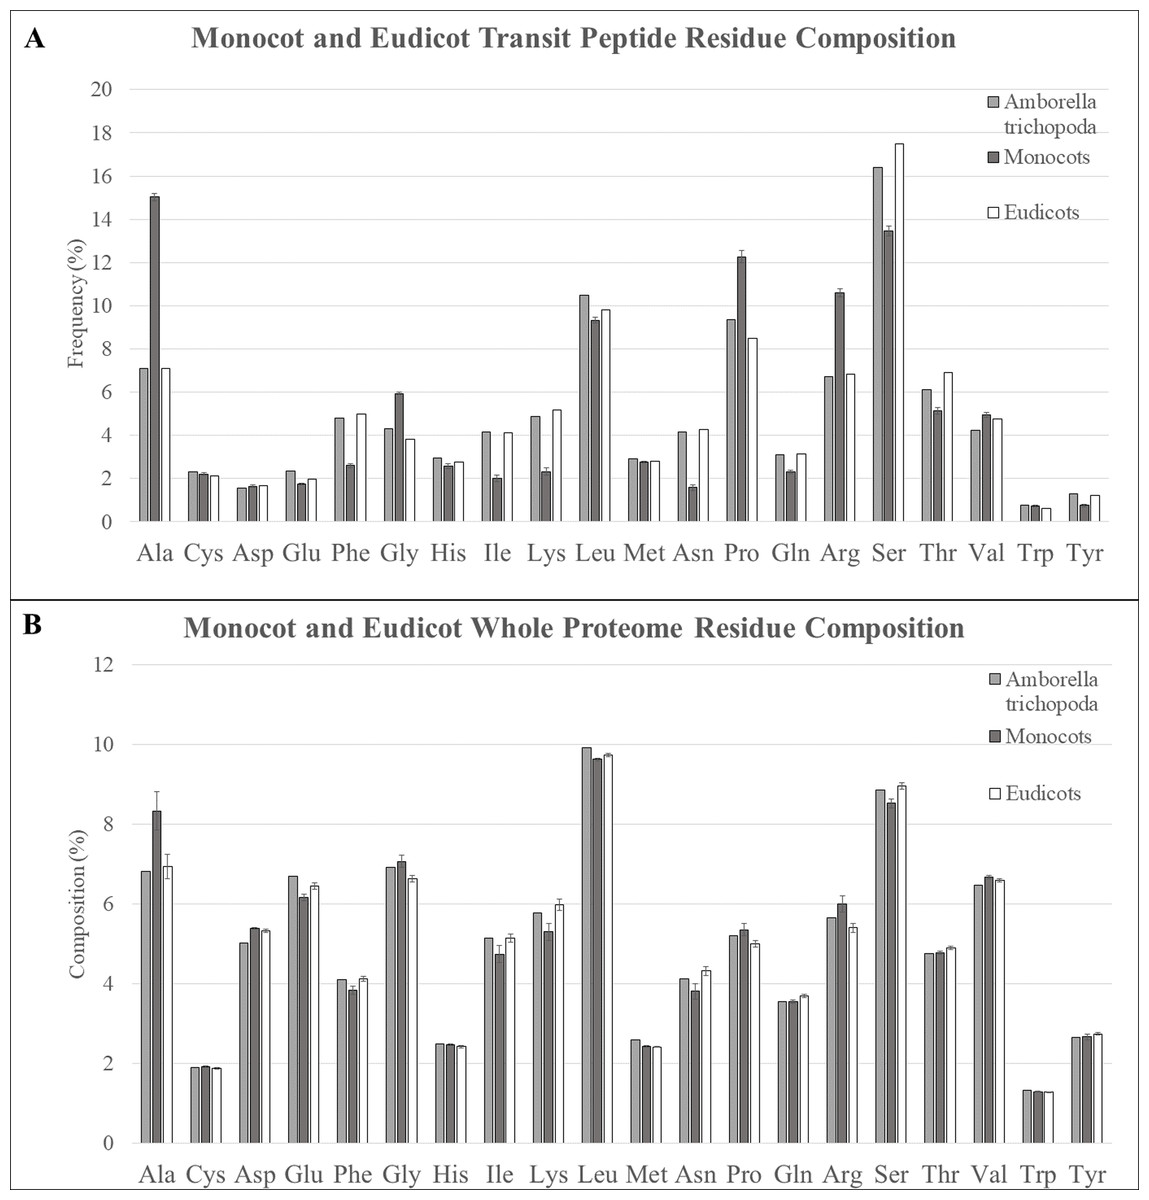
Figure 3: Residue composition of predicted transit peptides and whole proteome sequence.
(A) Residue composition of predicted transit peptides shows significant enrichment in alanine, leucine, proline, arginine, and serine in all assessed organisms, but monocot homologs were highly overrepresented in alanine, proline, and arginine. Corresponding decreases in serine and many of the minor amino acids including phenylalanine, isoleucine, lysine, and asparagine were also found in monocot sequences. A. trichopoda sequences closely matched eudicot sequences. (B) Alanine was about 2% higher within the whole proteomes of monocot species, but this does not explain the extreme differences found for predicted transit peptides.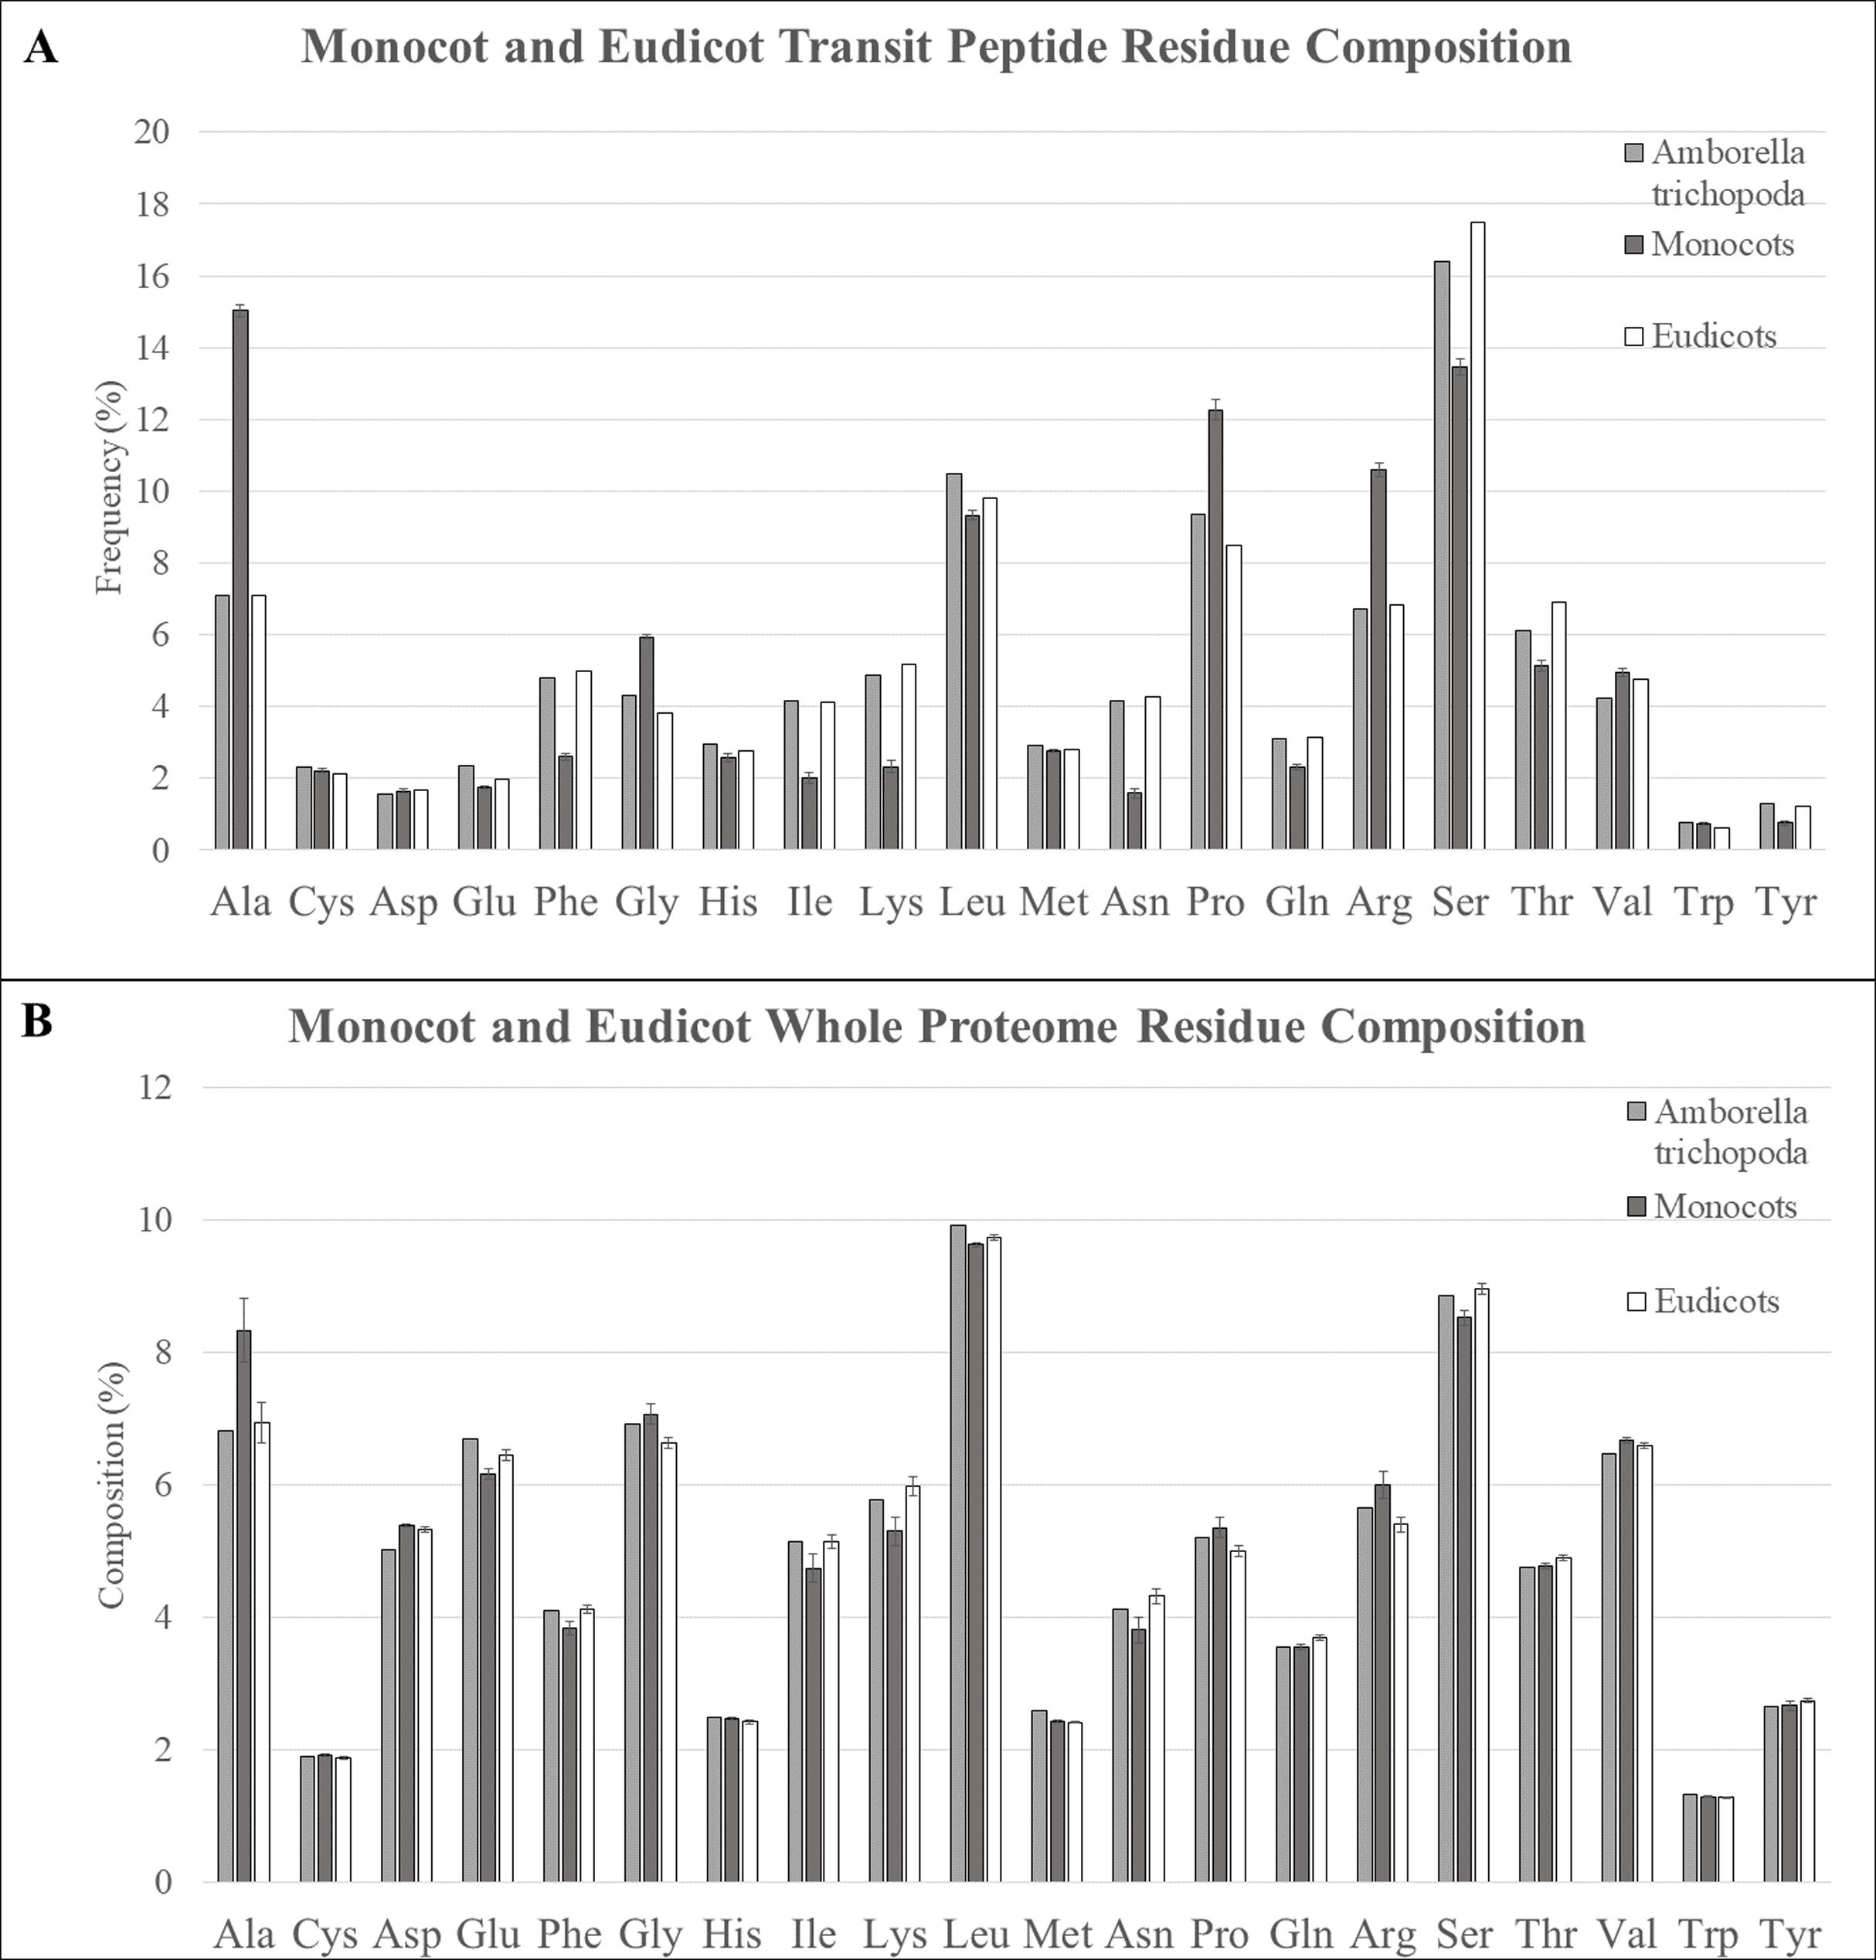
In A. trichopoda, it was expected that the transit peptides would have intermediate residue composition between monocots and eudicots because it is the sister lineage to the combined monocot/eudicot lineage (Soltis et al., 2009; Albert et al., 2013). Surprisingly, however, predicted transit peptides in A. trichopoda were nearly identical to eudicots for almost all residues. Slightly intermediate values were observed for some residues (e.g., lysine, asparagine, proline, glutamine, and serine), but even in these cases, these sequences more closely resembled eudicot rather than monocot sequences. The only residues with a significantly different trend were valine, which was somewhat decreased compared to both monocots and eudicots, and glutamic acid, which was slightly elevated in both. This result seems to indicate that monocots have experienced changes to an ancestral protein translocation machinery, and this change has selected for different amino acid content in transit peptides.
Evolution of nascent plastid transit peptides in diverse angiosperm genera
To test the hypothesis that transit peptides evolve in predictable patterns, NPTPs were first examined among comparative homologous protein clusters detected using either RBH or UCLUST. Plastid targeting prediction was performed using a consensus approach of TargetP 1.1 and Localizer, which has been shown recently to be highly efficient at predicting plastid targeting (Christian et al., 2020). Both prediction methods were mined for clusters containing at least three species and in which only one species had predicted plastid-targeted proteins were identified. If the reciprocal method found that this sequence was not uniquely plastid-targeted, it was determined to have moderate support by only a single method. In total, 1,328 clusters were supported by both methods, 618 clusters were detected using RBH only, and 1,443 clusters in UCLUST only. Phylogenetic trees were constructed for each cluster using MAFFT, Phyutility, and RAxML, and the resulting alignments were examined for evolutionary patterns in the transit peptides. All clusters containing multiple unlinked branches of cTPs, losses of transit peptides within a branch, or predicted chloroplast-targeted sequences at the root of the phylogenetic tree were removed in order to focus on single, recent transit peptide acquisitions in single genes (Fig. 4; Table 2). Data were examined for the causal mechanisms of transit peptide evolution, including substitutions, insertions/deletions, and alternative start sites (Fig. 5). Results from the three detection methods were pooled, and the responsible mutations for transit peptide evolution were summarized (Table 3; Fig. 6; Supplemental File 3).
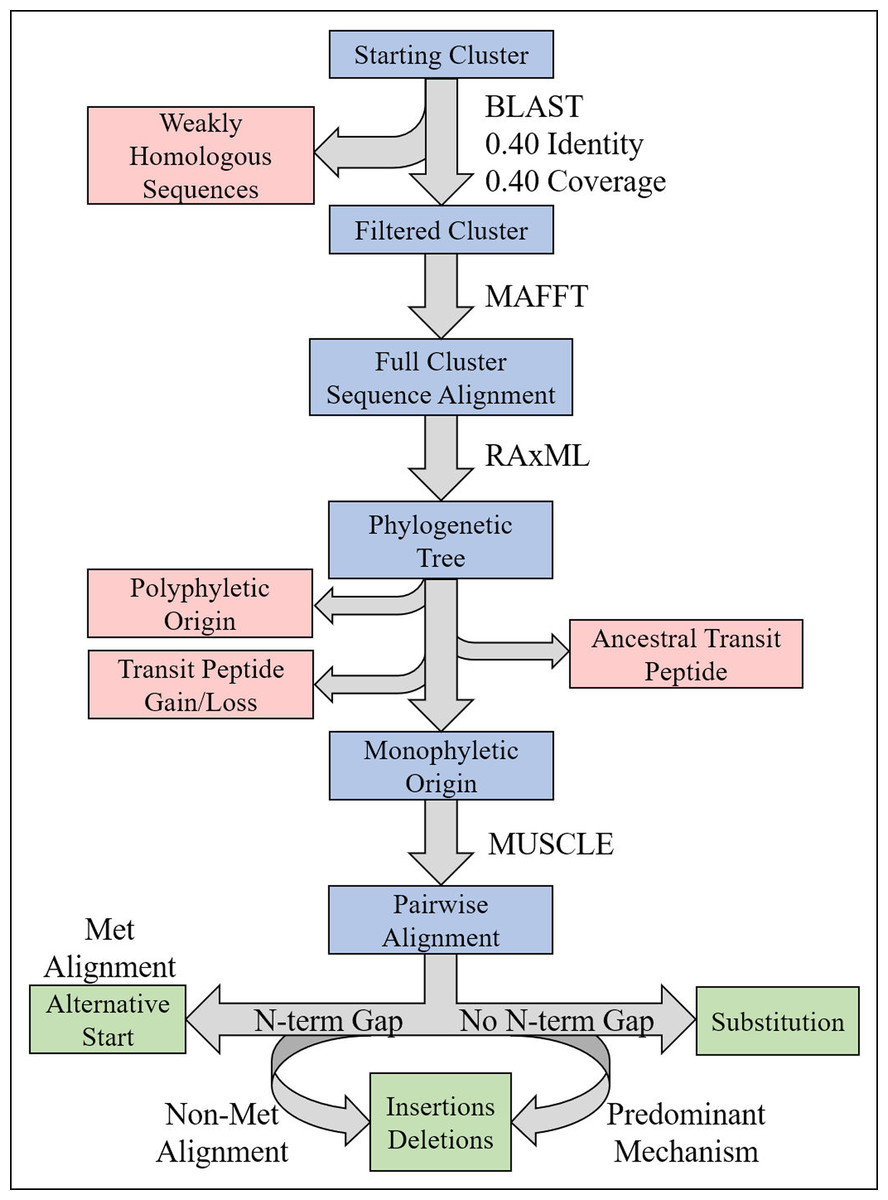
Figure 4: Illustration of phylogenetics workflow.
For each candidate cluster representing a potential NPTP, the steps for filtering, alignment, tree prediction, and mutation analysis are depicted. Blue boxes indicate the path of candidate clusters, red boxes indicate sequences or clusters that are filtered out, green boxes indicate the potential mutational categories, and programs or conditions used in the workflow are indicated to the right of arrows.
| Dataset | Candidate clusters | Polyphyletic clusters | Rooted/basal clusters | Gain/loss clusters | Monophyletic clusters |
|---|---|---|---|---|---|
| Arabidopsis1001 | 928 | 99 | 527 | 6 | 180 |
| BrachyPan | 7,551 | 1,616 | 4,616 | 116 | 2,272 |
| Multi-genome-RBH only | 618 | 15 | 108 | 2 | 430 |
| Multi-genome-UCLUST only | 1,443 | 38 | 293 | 11 | 1,061 |
| Multi-genome-consensus | 1,328 | 44 | 180 | 13 | 1,101 |

Figure 5: Models of transit peptide evolution.
(A) Substitution; (B) Alternative initiation exon; (C) Alternative slice variant; (D) Alternative start site. In each panel, exons are indicated with shaded boxes and introns with black lines. The ancestral RNA molecule is indicated in black, and variants are indicated in light green. Substitution variants are the only mechanism requiring a change to the DNA sequence, although sequence variants may also promote or hinder the other mechanisms. Adapted from Davis et al. (2006).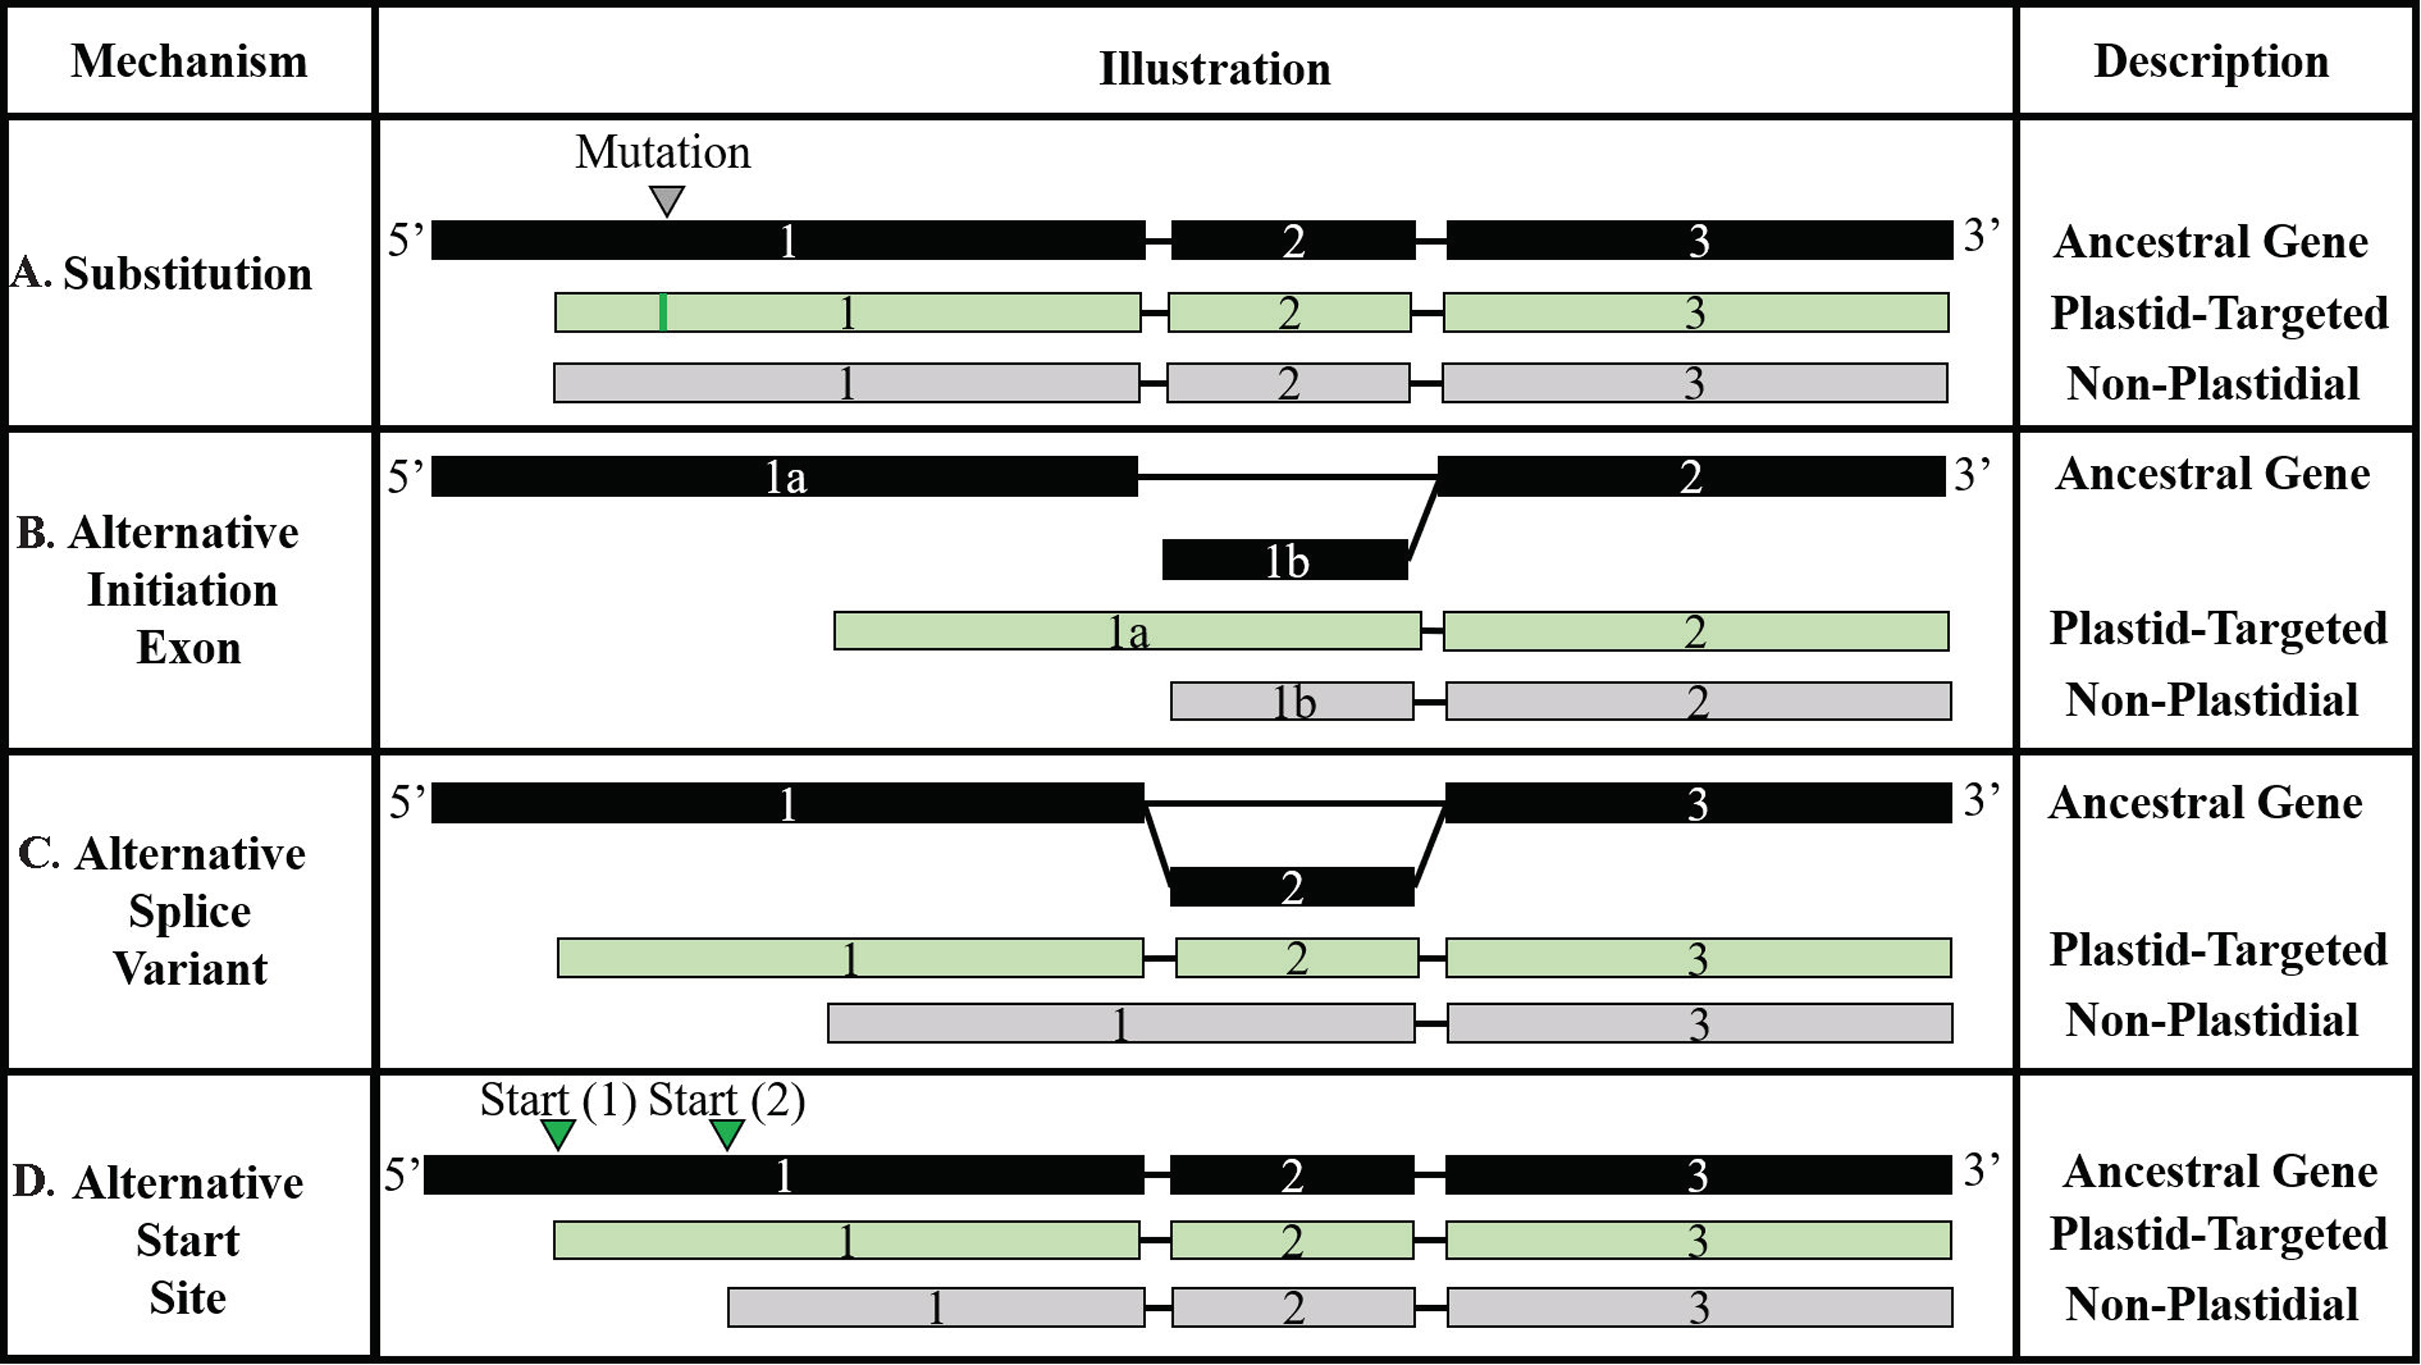
| Dataset | NPTPs | Substitution | Alternative start site (Insertion) | Alternative start site (Deletion) | Independent insertion | Independent deletion |
|---|---|---|---|---|---|---|
| Arabidopsis1001 | 181 | 179 (98.9%) | 0 (0.0%) | 0 (0.0%) | 0 (0.0%) | 2 (1.1%) |
| BrachyPan | 2,272 | 643 (28.3%) | 457 (20.1%) | 259 (11.4%) | 446 (19.6%) | 468 (20.6%) |
| Multi-genome-merged | 2,592 | 832 (31.4%) | 780 (29.4%) | 230 (8.7%) | 539 (20.3%) | 269 (10.2%) |
| Multi-genome-RBH only | 430 | 158 (36.2%) | 103 (23.6%) | 27 (6.2%) | 100 (22.9%) | 49 (11.2%) |
| Multi-genome-UCLUST only | 1,061 | 361 (33.4%) | 277 (25.6%) | 109 (10.1%) | 209 (19.3%) | 126 (11.6%) |
| Multi-genome-consensus | 1,101 | 313 (27.7%) | 400 (35.4%) | 94 (8.3%) | 230 (20.3%) | 94 (8.3%) |
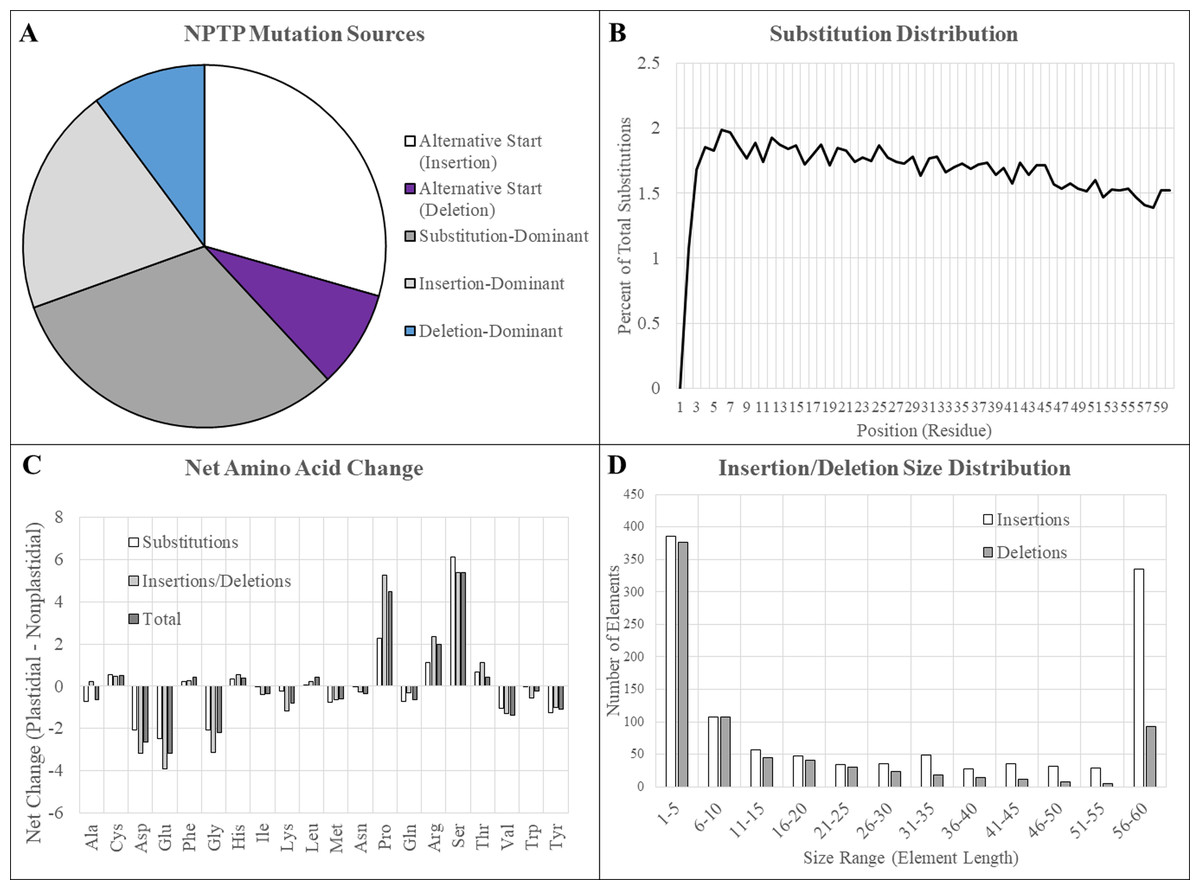
Figure 6: Mutation sources in multi-genome NPTPs.
Merged results for RBH, UCLUST, and consensus datasets are presented here. (A) Clusters in which an upstream alternative start site caused the acquisition of a transit peptide were most abundant, followed by substitutions and insertions. Deletions were comparatively rare. (B) A slight but significant linear decrease in the amino acid substitution frequency at each position was observed, indicating that positions at the proximal end of the N-terminus have a greater effect on transit peptide prediction strength. (C) Arginine, proline, and serine experienced significant net increases, while aspartic acid, glutamic acid, and glycine all experienced more than 2% net decrease when nascent transit peptides were compared to the closes non-targeted neighbor sequence. Net change of amino acids was generally similar between substitutions and insertions/deletions, but proline and arginine were far less likely to be acquired due to substitutions. (D) Most insertions and deletions were between one to five amino acids in length and generally decreased in frequency as the size increased. However, elements that covered the entirely 60-residue length of the transit peptide region were extremely abundant, especially those caused by insertions.
Residue substitutions were the primary evolutionary factor for 31.4% of NPTPs, with an average of 12.3 substitutions per divergent pair (Fig. 6A). Substitutions were somewhat concentrated at the proximal N-terminal third of the transit peptides (Fig. 6B). Just 34.8% of residue substitutions conserved the same biochemical properties (overall charge, size, and polarity). Of the remainder, nonpolar to polar substitutions and polar to nonpolar substitutions were most common, at 23.7% and 16.2% of the total, respectively. De novo evolution of transit peptides by single or multiple residue substitutions has been suggested as a primary mechanism of transit peptide evolution (Byun-McKay & Geeta, 2007). SP evolve two times faster than mature proteins on average, and up to 5–6 times faster than random sequence (Williams et al., 2000). Among the sequence pairs in the multi-genome dataset, the transit peptide region shared just 37.9% identity compared with 65.6% identity in the downstream mature protein. The first 10 residues of transit peptides are known to strongly influence import efficiency (Chotewutmontri et al., 2012; Chotewutmontri & Bruce, 2015), so simple substitutions in this region could impart novel plastid targeting of the cargo protein more easily. Similar trends in amino acid enrichment and depletion were observed for both substitutions and insertions/deletions (Fig. 6C). Surprisingly, the absolute abundance and distribution of small insertions and deletions was relatively similar, but insertions became much more prevalent after the 20-residue range (Fig. 6D). For indel mutations affecting the entire 60-residue window of the putative transit peptide, insertions were over three times more common than deletions. On average, 25.6 positions were inserted, and 12.2 positions were deleted for each NPTP sequence alignment 49.8% of all NPTPs. Alternative start sites upstream of the ancestral sequence were responsible for 29.4% of NPTP’s while those at a downstream positions accounted for only 8.7%. Both alternative start sites (Davis et al., 2006) and exon shuffling (Long et al., 1996; Vibranovski, Sakabe & De Souza, 2006) have been suggested as primary drivers of subcellular relocalization, and evidence supporting both mechanisms was found in this analysis. Most insertions and deletion mutations occurred at the beginning and aligned on an initial methionine in the shorter sequence, suggesting that they are alternative start sites (Table 3); however, alterative start sites did not account for all insertions or deletions occurring at the 5′ end, suggesting that exon shuffling may also play a significant role. The potential impact of alternative first exons was also examined, but no candidates were detected. However, as the analysis focused on the first 60 amino acids, it is possible that instances in which the first exon was longer were missed. Additionally, only exons of at least 10 residues in length were examined for possible alternative exons, which may have excluded microexons (Guo & Liu, 2015).
In 48.6% of clusters, the most closely related predicted non-plastid-targeted sequence was from within the same genome, strongly implying that either gene duplication or alternative splicing caused the evolution of a novel transit peptide in these cases. Overwhelmingly, novel plastid-targeted sequences were derived from gene duplication events: only 27.9% of NPTP’s evolving from a protein from the same species, or 13.6% of the NPTP total, were due to alternative gene products or alleles of the same locus. Because relocalization of the protein from its native environment into the chloroplast would create a de facto knockout phenotype by removing its natural localization, gene duplication or alternative isoforms may be necessary to maintain the evolutionary function of the original gene or transcript while giving flexibility for the duplicated copy to evolve a new function. However, as the majority of clusters were not duplicated, either the current proteomes are not fully annotated, or duplication is not strictly required for subcellular relocalization.
To firstly confirm that terms associated with plastids are underrepresented or neutral, and secondly, to uncover any overrepresented terms to discover functions that are broadly selected for in novel plastid-targeted genes, GO enrichment of NPTPs was conducted. A custom dataset consisting of the full proteomes from each of the included species was used as a reference dataset. As expected for non-conserved plastid-targeted proteins, terms associated with plastid (GO:0009536), thylakoid (GO:0009579), localization (GO:0051179, GO:0051234), and transport (GO:0006810), were significantly underrepresented, as shown in Table 4. A total of 49 terms were overrepresented in this dataset, almost all of which were associated with metabolism and biosynthesis, regulation of gene expression, and protein binding or regulation. Most biosynthetic terms were associated with primary metabolism, but several terms involved in heterocyclic and aromatic compounds were also identified. The enrichment of these terms confirms the assumption that novel chloroplast-targeted proteins likely contribute to species-specific biochemistry. However, the high enrichment of terms associated with transcriptional processes and protein binding suggests that an equally important function of novel plastid-targeted genes may be in the regulation of plastid gene expression and protein function.
| Tags | GO ID | GO Name | GO Category | FDR | P-value |
|---|---|---|---|---|---|
| UNDER | GO:0051179 | localization | BIOLOGICAL_PROCESS | 5.06E−03 | 1.77E−05 |
| UNDER | GO:0051234 | establishment of localization | BIOLOGICAL_PROCESS | 5.67E−03 | 2.04E−05 |
| UNDER | GO:0006810 | transport | BIOLOGICAL_PROCESS | 6.37E−03 | 2.35E−05 |
| UNDER | GO:0009607 | response to biotic stimulus | BIOLOGICAL_PROCESS | 2.28E−02 | 9.61E−05 |
| UNDER | GO:0016020 | membrane | CELLULAR_COMPONENT | 2.12E−06 | 2.47E−09 |
| UNDER | GO:0009579 | thylakoid | CELLULAR_COMPONENT | 1.29E−02 | 5.22E−05 |
| UNDER | GO:0009536 | plastid | CELLULAR_COMPONENT | 3.36E−02 | 1.51E−04 |
| OVER | GO:0031323 | regulation of cellular metabolic process | BIOLOGICAL_PROCESS | 1.46E−06 | 1.35E−09 |
| OVER | GO:0032774 | RNA biosynthetic process | BIOLOGICAL_PROCESS | 1.46E−06 | 1.05E−09 |
| OVER | GO:0097659 | nucleic acid-templated transcription | BIOLOGICAL_PROCESS | 1.46E−06 | 9.99E−10 |
| OVER | GO:0051171 | regulation of nitrogen compound metabolic process | BIOLOGICAL_PROCESS | 1.46E−06 | 1.16E−09 |
| OVER | GO:0034654 | nucleobase-containing compound biosynthetic process | BIOLOGICAL_PROCESS | 1.46E−06 | 8.66E−10 |
| OVER | GO:0006351 | transcription, DNA-templated | BIOLOGICAL_PROCESS | 1.46E−06 | 9.99E−10 |
| OVER | GO:0019219 | regulation of nucleobase-containing compound metabolic process | BIOLOGICAL_PROCESS | 1.46E−06 | 1.58E−09 |
| OVER | GO:0080090 | regulation of primary metabolic process | BIOLOGICAL_PROCESS | 1.46E−06 | 1.55E−09 |
| OVER | GO:2000112 | regulation of cellular macromolecule biosynthetic process | BIOLOGICAL_PROCESS | 2.43E−06 | 3.22E−09 |
| OVER | GO:0031326 | regulation of cellular biosynthetic process | BIOLOGICAL_PROCESS | 2.43E−06 | 4.25E−09 |
| OVER | GO:1903506 | regulation of nucleic acid-templated transcription | BIOLOGICAL_PROCESS | 2.43E−06 | 4.56E−09 |
| OVER | GO:2001141 | regulation of RNA biosynthetic process | BIOLOGICAL_PROCESS | 2.43E−06 | 4.61E−09 |
| OVER | GO:0009889 | regulation of biosynthetic process | BIOLOGICAL_PROCESS | 2.43E−06 | 4.80E−09 |
| OVER | GO:0010556 | regulation of macromolecule biosynthetic process | BIOLOGICAL_PROCESS | 2.43E−06 | 3.29E−09 |
| OVER | GO:0018130 | heterocycle biosynthetic process | BIOLOGICAL_PROCESS | 2.43E−06 | 4.77E−09 |
| OVER | GO:0006355 | regulation of transcription, DNA-templated | BIOLOGICAL_PROCESS | 2.43E−06 | 4.56E−09 |
| OVER | GO:1901362 | organic cyclic compound biosynthetic process | BIOLOGICAL_PROCESS | 3.00E−06 | 6.23E−09 |
| OVER | GO:0019438 | aromatic compound biosynthetic process | BIOLOGICAL_PROCESS | 3.00E−06 | 6.47E−09 |
| OVER | GO:0051252 | regulation of RNA metabolic process | BIOLOGICAL_PROCESS | 3.64E−06 | 8.17E−09 |
| OVER | GO:0090304 | nucleic acid metabolic process | BIOLOGICAL_PROCESS | 3.35E−05 | 7.82E−08 |
| OVER | GO:0016070 | RNA metabolic process | BIOLOGICAL_PROCESS | 1.49E−04 | 4.02E−07 |
| OVER | GO:0060255 | regulation of macromolecule metabolic process | BIOLOGICAL_PROCESS | 0.005061 | 1.77E−05 |
| OVER | GO:0019222 | regulation of metabolic process | BIOLOGICAL_PROCESS | 0.009434 | 3.65E−05 |
| OVER | GO:0006357 | regulation of transcription by RNA polymerase II | BIOLOGICAL_PROCESS | 0.010222 | 4.04E−05 |
| OVER | GO:0034641 | cellular nitrogen compound metabolic process | BIOLOGICAL_PROCESS | 0.02888 | 1.27E−04 |
| OVER | GO:0010468 | regulation of gene expression | BIOLOGICAL_PROCESS | 0.036366 | 1.67E−04 |
| OVER | GO:0090083 | regulation of inclusion body assembly | BIOLOGICAL_PROCESS | 0.036923 | 1.86E−04 |
| OVER | GO:0090084 | negative regulation of inclusion body assembly | BIOLOGICAL_PROCESS | 0.036923 | 1.86E−04 |
| OVER | GO:0070841 | inclusion body assembly | BIOLOGICAL_PROCESS | 0.036923 | 1.86E−04 |
| OVER | GO:0005667 | transcription factor complex | CELLULAR_COMPONENT | 2.49E−08 | 2.23E−12 |
| OVER | GO:0032777 | Piccolo NuA4 histone acetyltransferase complex | CELLULAR_COMPONENT | 1.28E−06 | 2.31E−10 |
| OVER | GO:0035267 | NuA4 histone acetyltransferase complex | CELLULAR_COMPONENT | 1.46E−06 | 1.53E−09 |
| OVER | GO:0043189 | H4/H2A histone acetyltransferase complex | CELLULAR_COMPONENT | 1.46E−06 | 1.53E−09 |
| OVER | GO:1902562 | H4 histone acetyltransferase complex | CELLULAR_COMPONENT | 2.43E−06 | 3.73E−09 |
| OVER | GO:0000123 | histone acetyltransferase complex | CELLULAR_COMPONENT | 1.42E−04 | 3.44E−07 |
| OVER | GO:1902493 | acetyltransferase complex | CELLULAR_COMPONENT | 1.49E−04 | 3.89E−07 |
| OVER | GO:0031248 | protein acetyltransferase complex | CELLULAR_COMPONENT | 1.49E−04 | 3.89E−07 |
| OVER | GO:0044451 | nucleoplasm part | CELLULAR_COMPONENT | 5.93E−04 | 1.65E−06 |
| OVER | GO:0090575 | RNA polymerase II transcription factor complex | CELLULAR_COMPONENT | 0.001407 | 4.05E−06 |
| OVER | GO:0044798 | nuclear transcription factor complex | CELLULAR_COMPONENT | 0.00427 | 1.34E−05 |
| OVER | GO:0005669 | transcription factor TFIID complex | CELLULAR_COMPONENT | 0.004629 | 1.54E−05 |
| OVER | GO:1990234 | transferase complex | CELLULAR_COMPONENT | 0.00769 | 2.90E−05 |
| OVER | GO:0016864 | intramolecular oxidoreductase activity, transposing S-S bonds | MOLECULAR_FUNCTION | 0.001435 | 4.38E−06 |
| OVER | GO:0003756 | protein disulfide isomerase activity | MOLECULAR_FUNCTION | 0.001435 | 4.38E−06 |
| OVER | GO:0005515 | protein binding | MOLECULAR_FUNCTION | 0.004535 | 1.47E−05 |
| OVER | GO:0016901 | oxidoreductase activity, acting on the CH-OH group of donors, quinone or similar compound as acceptor | MOLECULAR_FUNCTION | 0.022345 | 9.24E−05 |
| OVER | GO:0016671 | oxidoreductase activity, acting on a sulfur group of donors, disulfide as acceptor | MOLECULAR_FUNCTION | 0.02337 | 1.01E−04 |
| OVER | GO:0047405 | pyrimidine-5′-nucleotide nucleosidase activity | MOLECULAR_FUNCTION | 0.036923 | 1.86E−04 |
| OVER | GO:0044183 | protein folding chaperone | MOLECULAR_FUNCTION | 0.036923 | 1.86E−04 |
Intraspecific mechanism of NPTP evolution
Mechanisms of NPTP evolution in the Arabidopsis pangenome
The analysis workflow was applied to Arabidopsis pan-genome to test whether the NPTP evolutionary trends observed across the multi-genome dataset hold true at smaller evolutionary scales. The Arabidopsis1001 Project (Cao et al., 2011; Joshi et al., 2012; Alonso-Blanco et al., 2016) has described protein allelic variants for 35,176 genes of 256 diverse A. thaliana accessions. Of these initial gene groups, 928 contained isoforms with subcellular prediction to both plastid and non-plastid targets. A monophyletic plastid transit peptide origin was found in 180 of these. Surprisingly, only a single deletion event was found in AT3G06180.1, and no insertion events were detected. A second gene, AT3G13820.1, had a C-terminal 4-residue deletion that altered the predicted targeting of the protein, but this was due to a nonsense mutation in the predicted NPTP which would disrupt the downstream domains of the original protein. All remaining mutations were caused by residue substitutions (Fig. 7A). While these results are significantly different from what was observed in the multi-genome dataset, it should be stressed that the Arabidopsis1001 data contains only allelic variants and ignores gene duplication events. Only 1.34 substitutions occurred on average between each pair of sequences observed in the current experiment, and single substitutions were responsible for 71% of the predicted NPTPs. This is in line with the average of 439,000 SNPs, or roughly 1 SNP per 1 kb, detected between any two Arabidopsis accession genomes (Alonso-Blanco et al., 2016). Substitutions were heavily concentrated in the proximal third of the putative transit peptide: 126 substitutions occurred in the first 20 positions, followed by 90 in positions 21–40, and only 37 in positions 41–60 (Fig. 7B). Nearly 75% of the substitutions were nonconservative, with nonpolar to polar transitions accounting for over 21% of such substitutions. Basic to polar substitutions occurred 15.3% of the time, followed by acidic to nonpolar (9.5%), aromatic to polar (8.5%), and nonpolar to basic (7.9%) (Fig. 7C). Overall, this pattern follows what had been observed for transit peptide composition (Figs. 1 and 2), with enrichment in serine, proline, alanine, and arginine, and depletion of acidic, aromatic, and long polar amino acids.
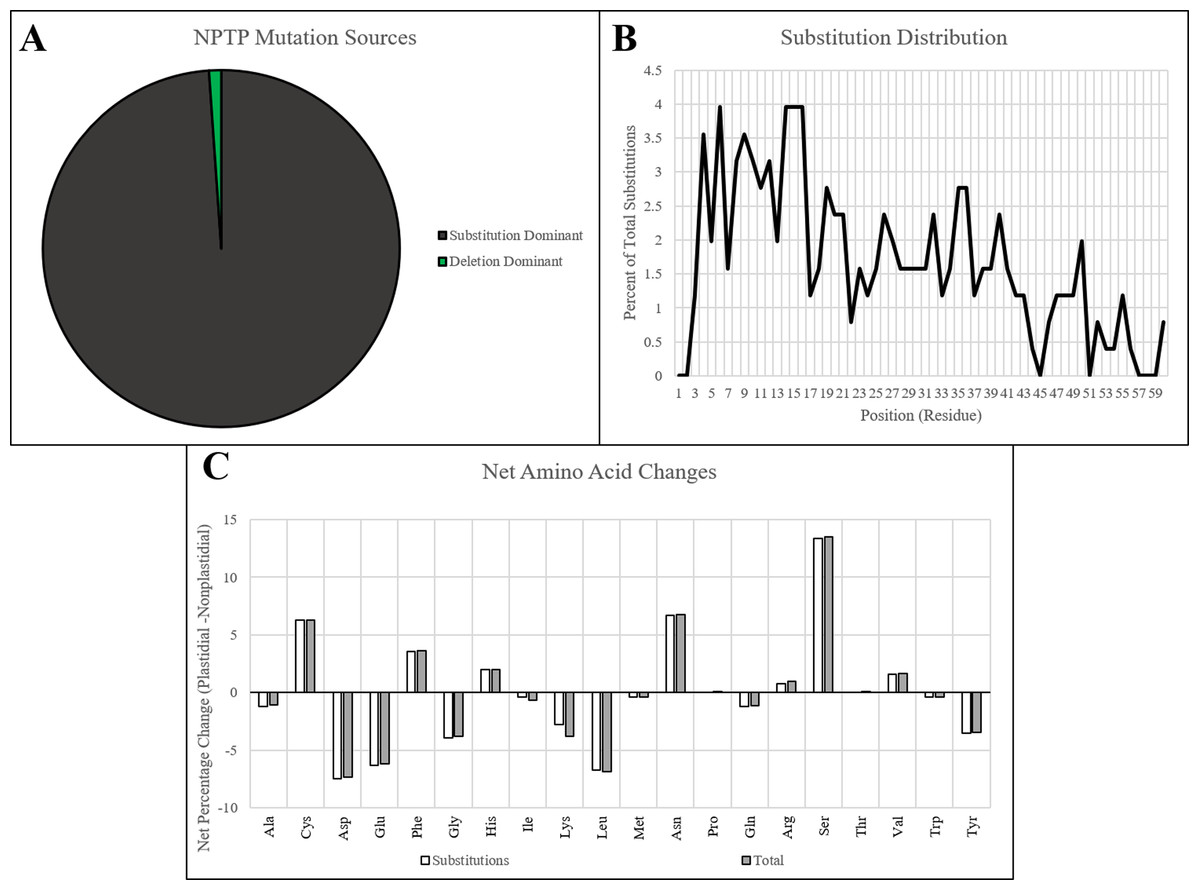
Figure 7: NPTP mutation sources and characteristics in Arabidopsis1001.
(A) The proportion NPTP mechanisms in Arabidopsis1001 showed only one instance of an internal deletion and one instance of a C-terminal deletion causing a difference in targeting prediction, while the remaining instances were caused by substitutions. (B) A significant negative trend in substitution frequency was observed for Arabidopsis1001 sequences, with up to 4% of substitutions occurring at positions in the proximal end, and 0–1% of substitutions occurring at positions in the distal end. (C) Significant increases in cysteine, asparagine, and serine were observed in the substitutions, while aspartic acid, glutamic acid, and leucine had significant decreases.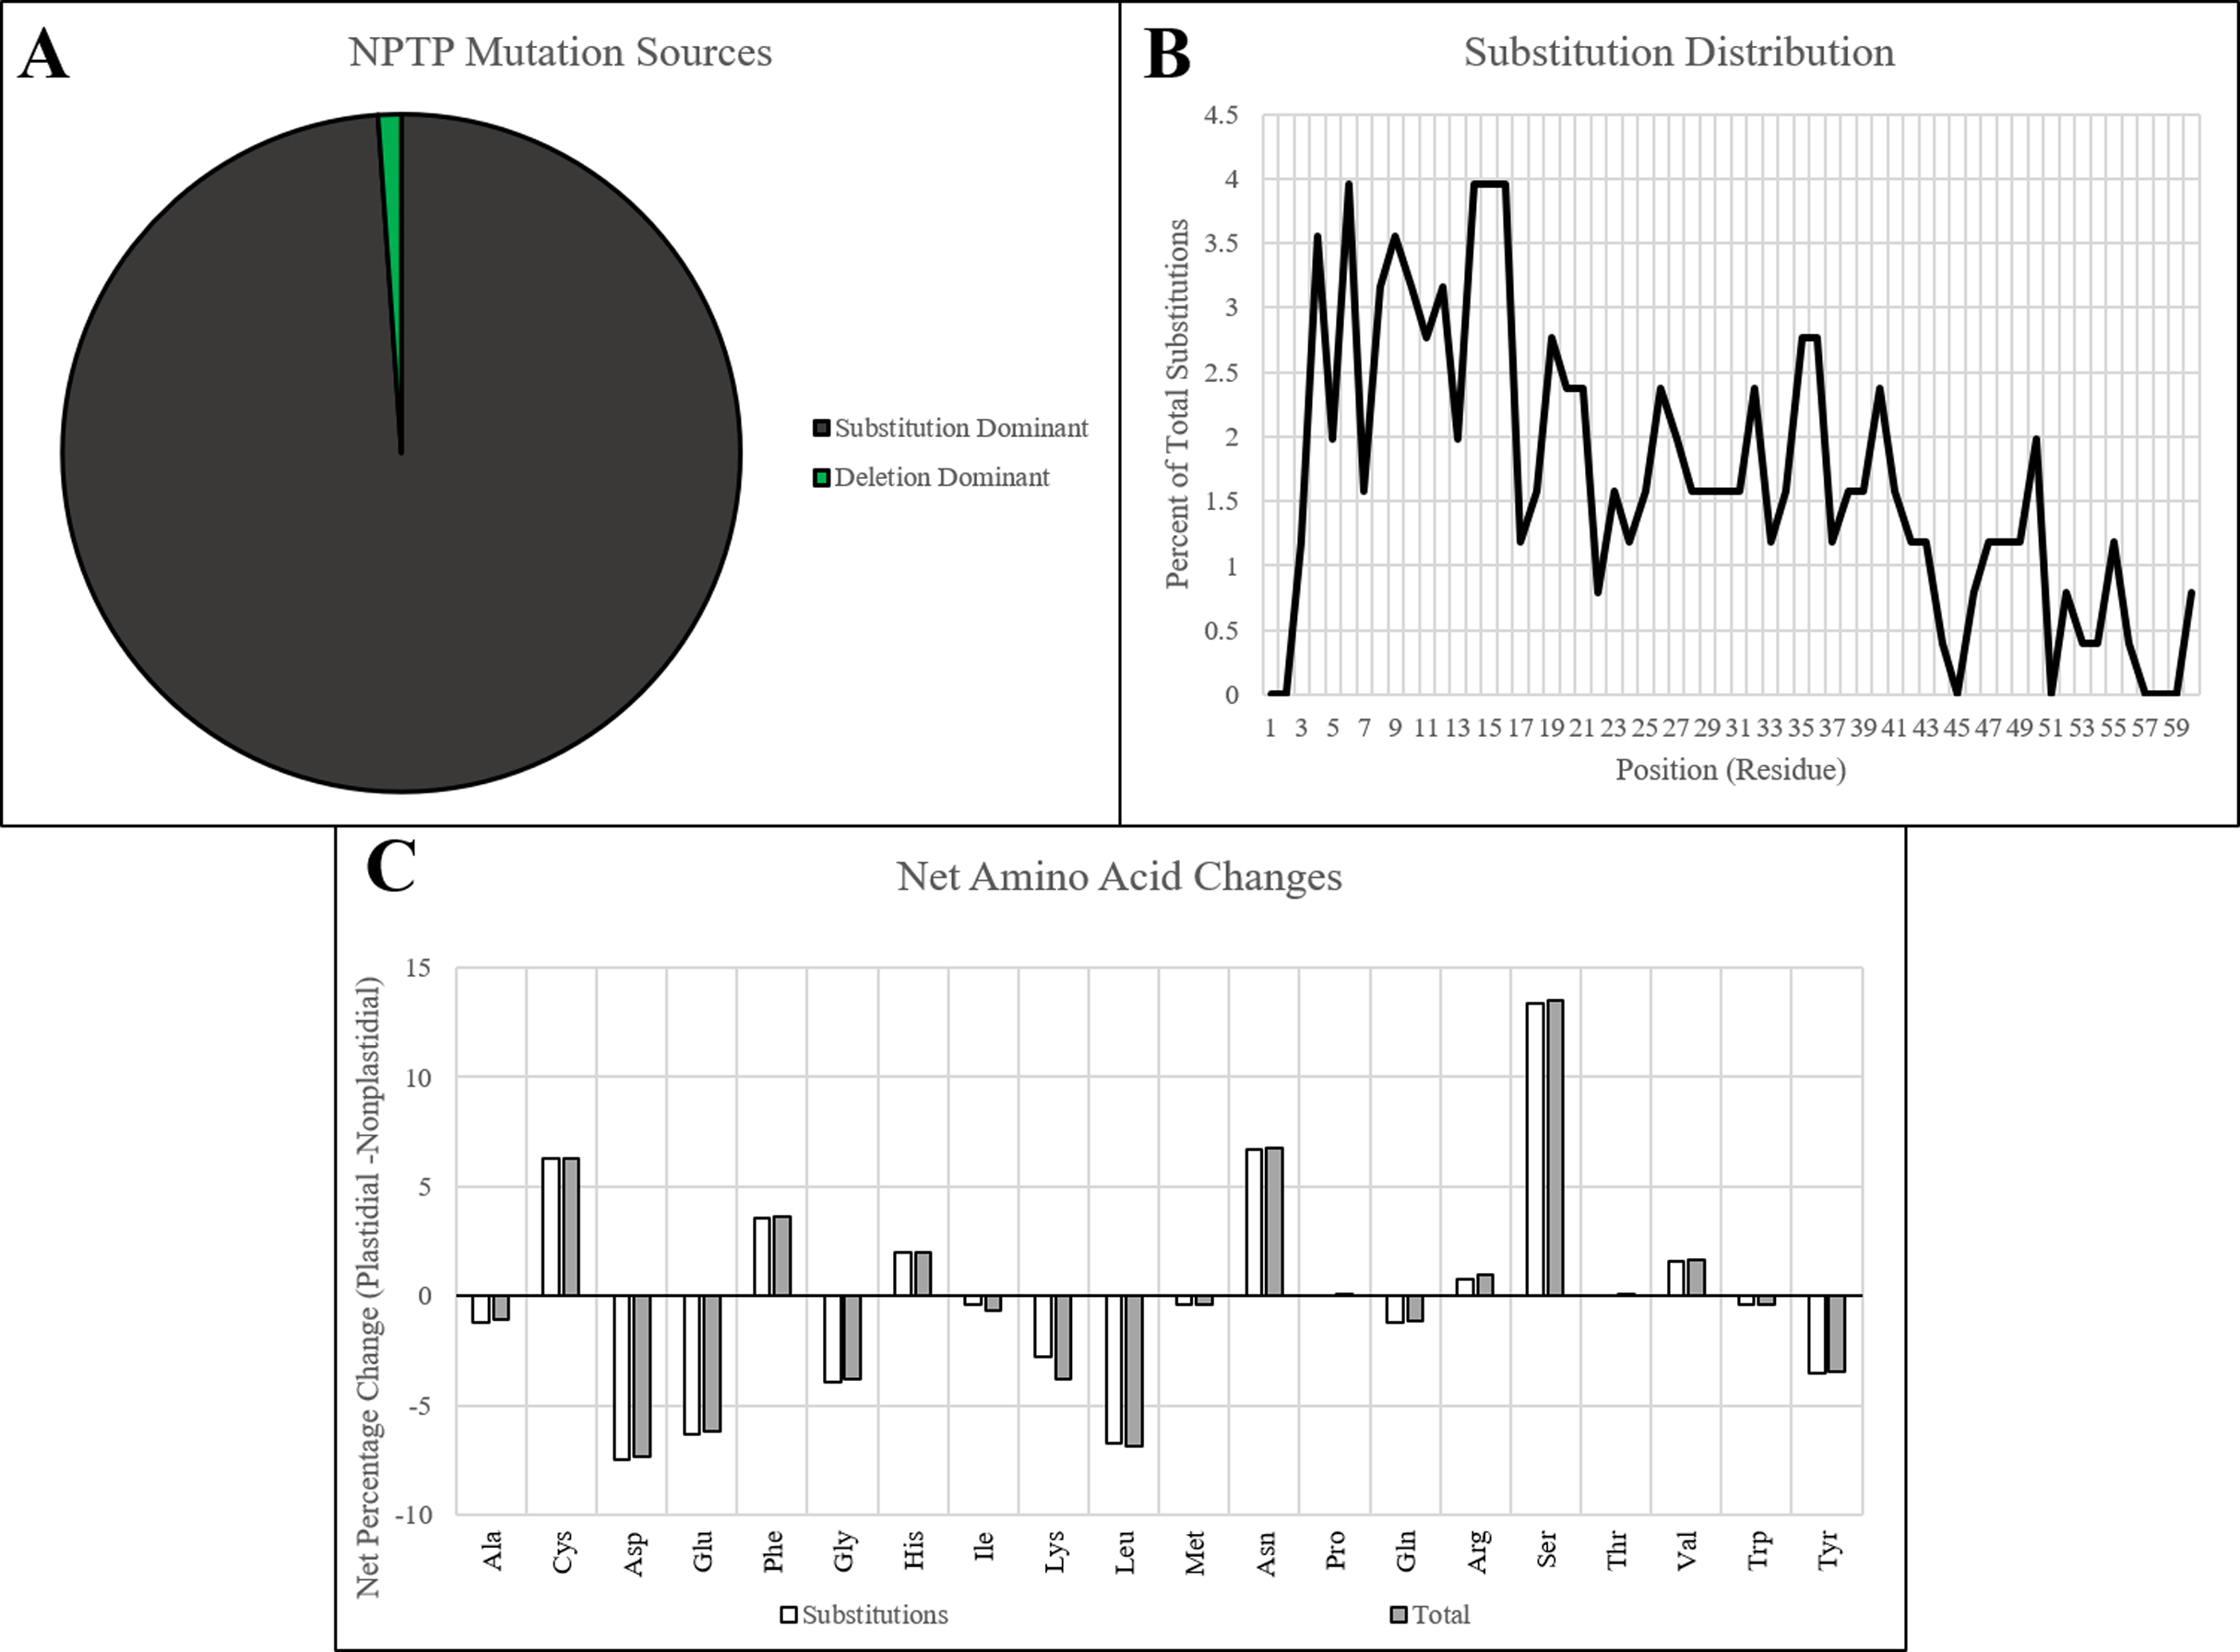
Distribution of NPTPs was examined across different taxonomic sub-groups of Arabidopsis representing various geographical regions and environments. This was performed to test the hypothesis that there will be a variation in the occurrence of NPTPs in different environments. The admixed, central European, German, and Italian/Balkan/Caucasian groups were found to have the greatest number of NPTPs, which follows with these groups representing a greater fraction of accessions (Fig. 8A). The admixed group, which contains intermediate characteristics between two or more distinct taxonomic groups, had the largest representation of NPTPs overall. In keeping with admixed populations sharing genetics with more distinct taxonomic groups, many NPTPs were shared between a mixture of accessions. Most NPTP clusters contained only a single accession with a predicted novel plastid-targeted protein, but a small number of clusters skewed this trend, with one cluster containing 38 accessions sharing the same NPTP. Thus, many NPTPs in the admixed accessions likely originate from a neighboring population from which the plastid-targeted allele has propagated into adjacent geographic regions.

Figure 8: Geographic distribution of NPTPs in Arabidopsis1001 accessions.
Taxonomic groups were referenced according to the Arabidopsis1001 proteomes project, and the number of NPTP’s for each accession were added to the respective taxonomic group. The admixed group, of which Columbia-0 is a part of, accounted for the most NPTP’s (A) but was overall one of the least diverse taxonomic groups. Relict, Italian/Balkan/Caucasus, and Spanish accessions contained the most NPTPs per genotype, while Asian, Swedish, Germanic, and Central European accessions contained the fewest (B). Geographic distribution is indicated in (C), where shaded circular areas are indicative of magnitude. Taxonomic groups are color-coded according to Joshi et al. (2012). The map used in this figure was obtained from https://www.freeworldmaps.net/about.html (© https://www.freeworldmaps.net/).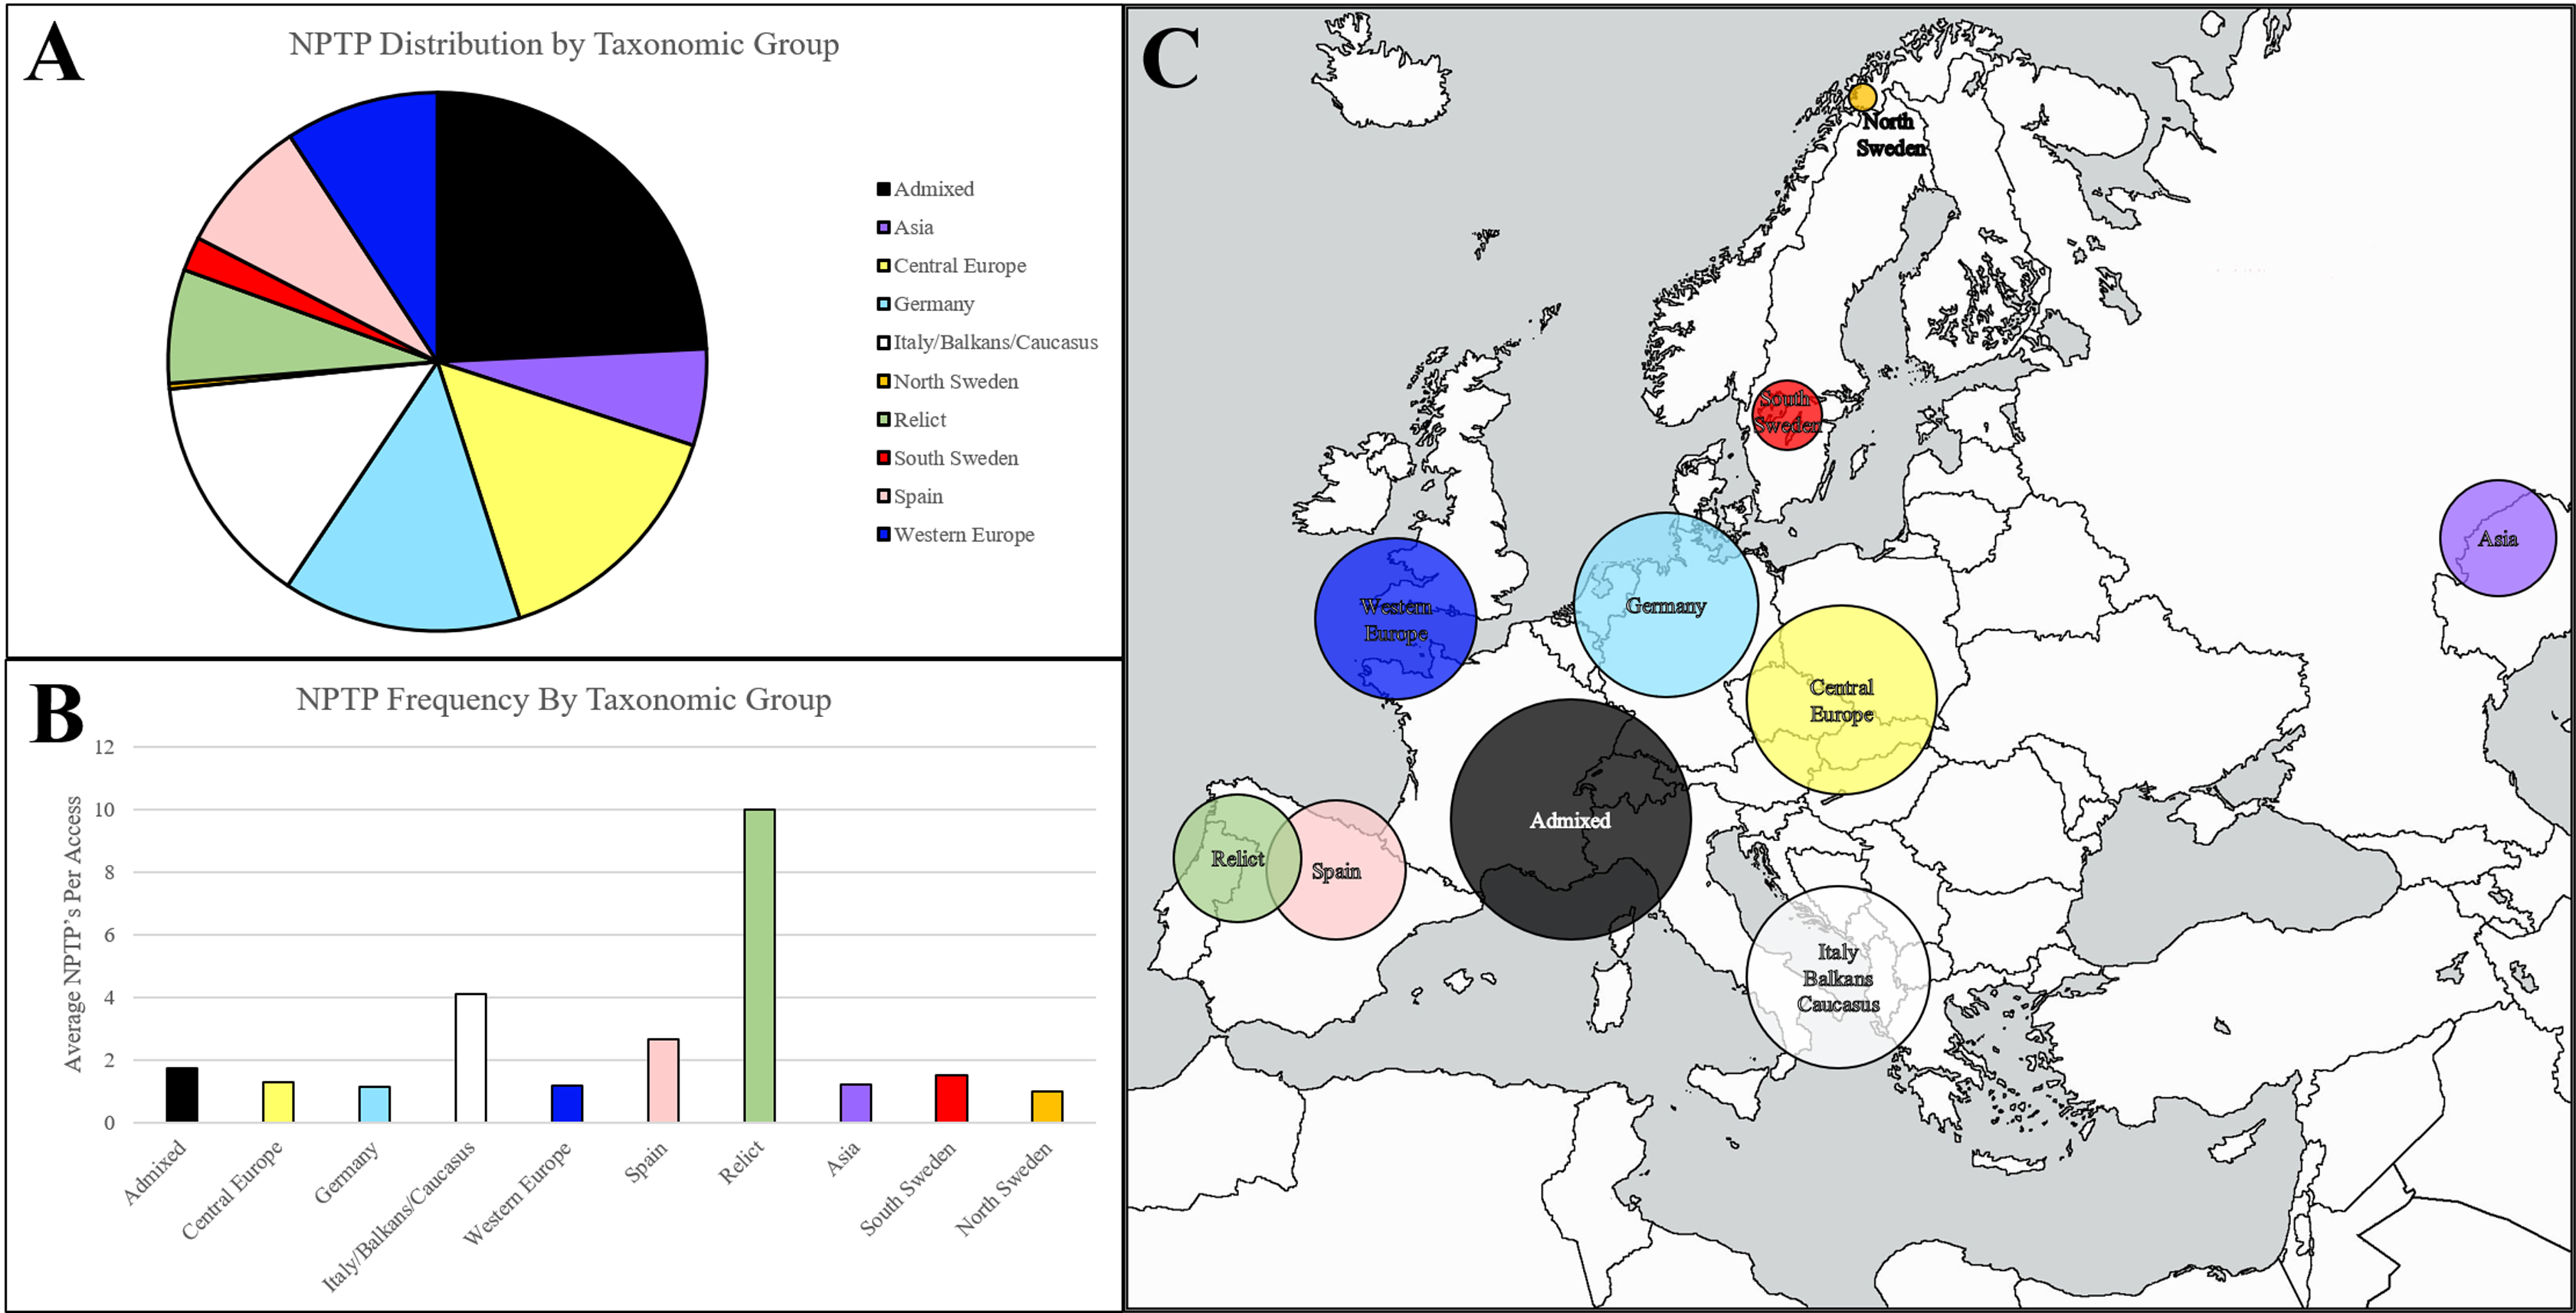
Upon normalizing diversity per accession, relict accessions native to the Iberian Peninsula were found to be the most diverse, at an average of 10 NPTPs for each line (Fig. 8B). Non-relict Spanish accessions and accessions from the Italian/Balkan/Caucasus group were also diverse, but in terms of average diversity, they were closer to other groups than to the relict group. Pangenome analysis suggested that these taxonomic groups are more variable because they survived the last glaciation period, while the other taxonomic groups developed after the species propagated outward from glacial refuges (see Fig. 8C for geographic representation) (Alonso-Blanco et al., 2016). Upon normalizing diversity per accession, they were found to be the most diverse NPTPs (Fig. 8B). Non-relict Spanish accessions and accessions from the Italian/Balkan/Caucasus group were also diverse, but in terms of average diversity, they were closer to other groups than to the relict group that spread out (see Fig. 8C for geographic representation). In contrast, the Asian accessions at the easternmost edge of the Arabidopsis native range are the least diverse, with the fewest NPTPs per accession. Please refer to Supplemental File 4 for the analysis output.
GO enrichment of NPTPs in the Arabidopsis1001 dataset demonstrated a significant underrepresentation (P < 0.05) of membrane-bound organelle (GO:0043227; GO:0043231), organic substance metabolic process (GO:0071704), and primary metabolic process (GO:0044238), which is expected for genes with variable plastid targeting (Table 5). In contrast, the majority of overrepresented terms were involved in secondary metabolic and redox processes, such as flavin-containing compound metabolism and biosynthesis (GO:0042726; GO:0042727), adenylyltransferase activity (GO:0003919; GO:0070566) glycosyl or hexosyl transferase activity (GO:0016757; GO:0016758), and glycerol ether metabolism (GO:0006662). Additionally, processes involved in G-coupled receptor signaling (GO:0007205; GO:0007186) were overrepresented.
| Tags | GO ID | GO Name | GO Category | FDR | P-value |
|---|---|---|---|---|---|
| UNDER | GO:0043227 | membrane-bounded organelle | CELLULAR_COMPONENT | 1 | 0.014882 |
| UNDER | GO:0043231 | intracellular membrane-bounded organelle | CELLULAR_COMPONENT | 1 | 0.014882 |
| UNDER | GO:0071704 | organic substance metabolic process | BIOLOGICAL_PROCESS | 1 | 0.033193 |
| UNDER | GO:0044238 | primary metabolic process | BIOLOGICAL_PROCESS | 1 | 0.010442 |
| OVER | GO:0042726 | flavin-containing compound metabolic process | BIOLOGICAL_PROCESS | 1 | 2.15E−02 |
| OVER | GO:0042727 | flavin-containing compound biosynthetic process | BIOLOGICAL_PROCESS | 1 | 2.15E−02 |
| OVER | GO:0006662 | glycerol ether metabolic process | BIOLOGICAL_PROCESS | 1 | 3.21E−02 |
| OVER | GO:0009231 | riboflavin biosynthetic process | BIOLOGICAL_PROCESS | 1 | 2.15E−02 |
| OVER | GO:0003919 | FMN adenylyltransferase activity | MOLECULAR_FUNCTION | 1 | 1.62E−02 |
| OVER | GO:0006766 | vitamin metabolic process | BIOLOGICAL_PROCESS | 1 | 4.78E−02 |
| OVER | GO:0006771 | riboflavin metabolic process | BIOLOGICAL_PROCESS | 1 | 2.15E−02 |
| OVER | GO:0006767 | water-soluble vitamin metabolic process | BIOLOGICAL_PROCESS | 1 | 4.78E−02 |
| OVER | GO:0004143 | diacylglycerol kinase activity | MOLECULAR_FUNCTION | 1 | 1.62E−02 |
| OVER | GO:0007205 | protein kinase C-activating G protein-coupled receptor signaling pathway | BIOLOGICAL_PROCESS | 1 | 1.62E−02 |
| OVER | GO:0007186 | G protein-coupled receptor signaling pathway | BIOLOGICAL_PROCESS | 1 | 2.68E−02 |
| OVER | GO:0042364 | water-soluble vitamin biosynthetic process | BIOLOGICAL_PROCESS | 1 | 4.78E−02 |
| OVER | GO:0070566 | adenylyltransferase activity | MOLECULAR_FUNCTION | 1 | 2.68E−02 |
| OVER | GO:0016757 | transferase activity, transferring glycosyl groups | MOLECULAR_FUNCTION | 1 | 2.80E−02 |
| OVER | GO:0016758 | transferase activity, transferring hexosyl groups | MOLECULAR_FUNCTION | 1 | 1.99E−02 |
| OVER | GO:0009110 | vitamin biosynthetic process | BIOLOGICAL_PROCESS | 1 | 4.78E−02 |
| OVER | GO:0018904 | ether metabolic process | BIOLOGICAL_PROCESS | 1 | 0.03212 |
Mechanisms of NPTP evolution in the brachypodium pan genome
Pan-genome sequencing in many species has revealed significant variation in duplicated and expendable genes: in some cases, the core genes represent a minority of the total genes for a given species. The BrachyPan project for B. distachyon conducted deep re-sequencing of 54 accessions of B. distachyon to characterize presence/absence variants and copy number variants in addition to allelic and isoform variants (Gordon et al., 2017). Predicted proteomes of 56 different B. distachyon ecotypes including two internal Bd21-3 controls were accessed from BrachyPan (https://brachypan.jgi.doe.gov/) and sequences were arranged into clusters according to a reference matrix file provided by J. Vogel (2018, personal communication).
A total of 8,990 orthologous pan-gene clusters that had at least one predicted plastid-targeted gene and one alternatively targeted gene were detected using the same methods as for Arabidopsis1001. RaxML was performed on 7,551 of the candidate gene clusters. The most recent common ancestor was likely plastid-targeted in 4,616 of these clusters, indicated by a plastid transit peptide at the root of the phylogenetic tree. A total of 2,272 clusters were found to have a monophyletic transit peptide origin, and were investigated for mechanisms of transit peptide acquisition.
As with Arabidopsis1001, transit peptide loss was more prevalent than transit peptide gain. This pattern has been observed previously, where the loss of SP prevailed over gains by a factor of almost 4-fold (Hönigschmid et al., 2018). This ratio held true for both Arabidopsis1001 and BrachyPan. For clusters representing transit peptide acquisitions, gene variants were much more divergent than the Arabidopsis1001 clusters and more closely mirrored the multi-genome dataset (Fig. 9). An average of 12.7 substitutions were found in each divergent pair of sequences, 69.4% of which were non-conservative. Length variants were also common, with an average of 0.80 insertions and 1.08 deletions occurring in each alignment. Despite a large number of substitutions per aligned pair, substitutions were the dominant means of transit peptide acquisition in only 28.3% of clusters, while insertions and deletions were responsible for the remaining 71.7%. Alternative start sites resulting in an insertion for the plastid-targeted protein were found in 20.1% of cases, while alternative start sites resulting in a deletion were found in 11.4% of cases (Fig. 9A).
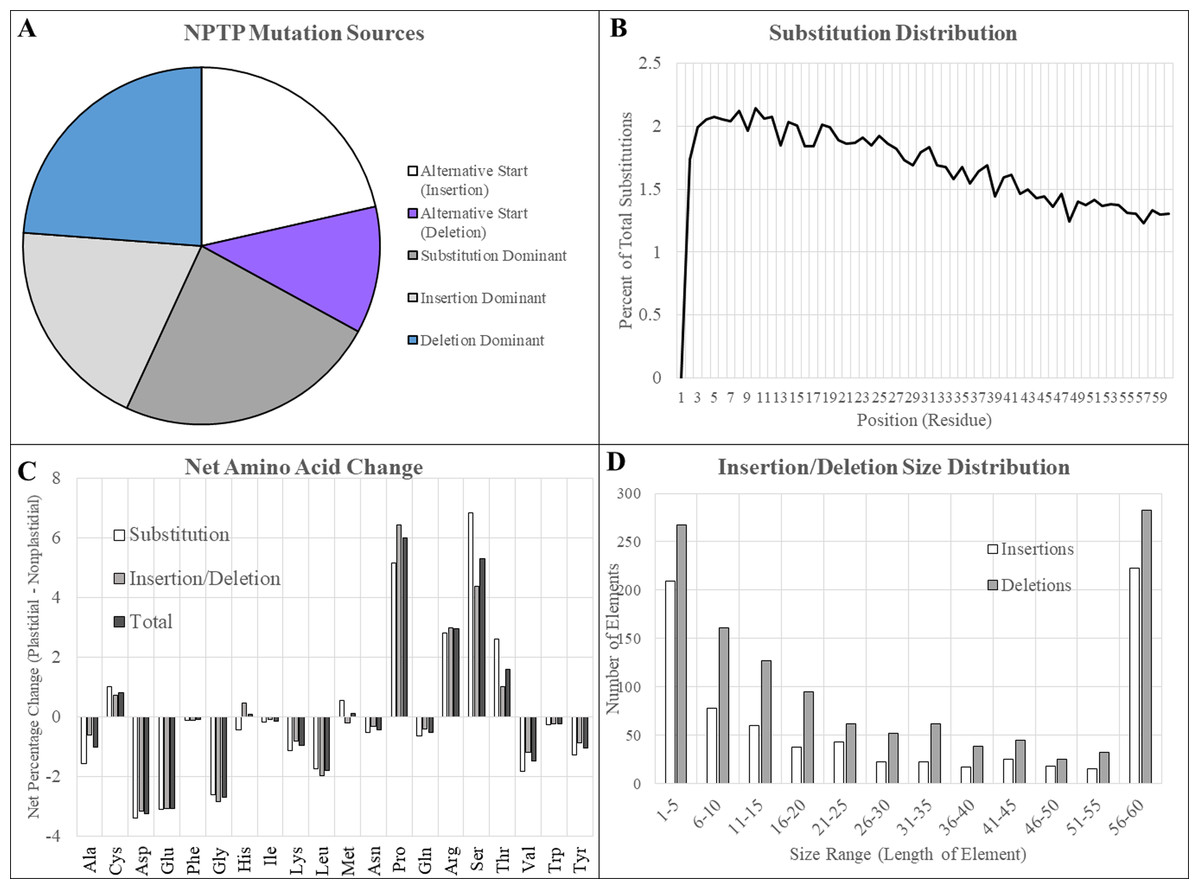
Figure 9: Type and characteristics of mutations in BrachyPan NPTPs.
(A) Substitutions were most dominant at 28.3%, followed by independent deletions, upstream alternative start sites, and independent deletions. (B) Substitution frequency was greatest at the proximal end and decreased linearly to the distal end. (C) The net change in residue composition favored increases in proline, arginine, serine, and threonine in transit peptides, while aspartic and glutamic acids, glycine, and leucine had 2% or greater decreases. (D) Insertions or deletions which covered the entirety of the transit peptide region were most abundant, indicating possible exon swapping. Of the remaining elements, smaller elements were most abundant and decreased in frequency with increasing size.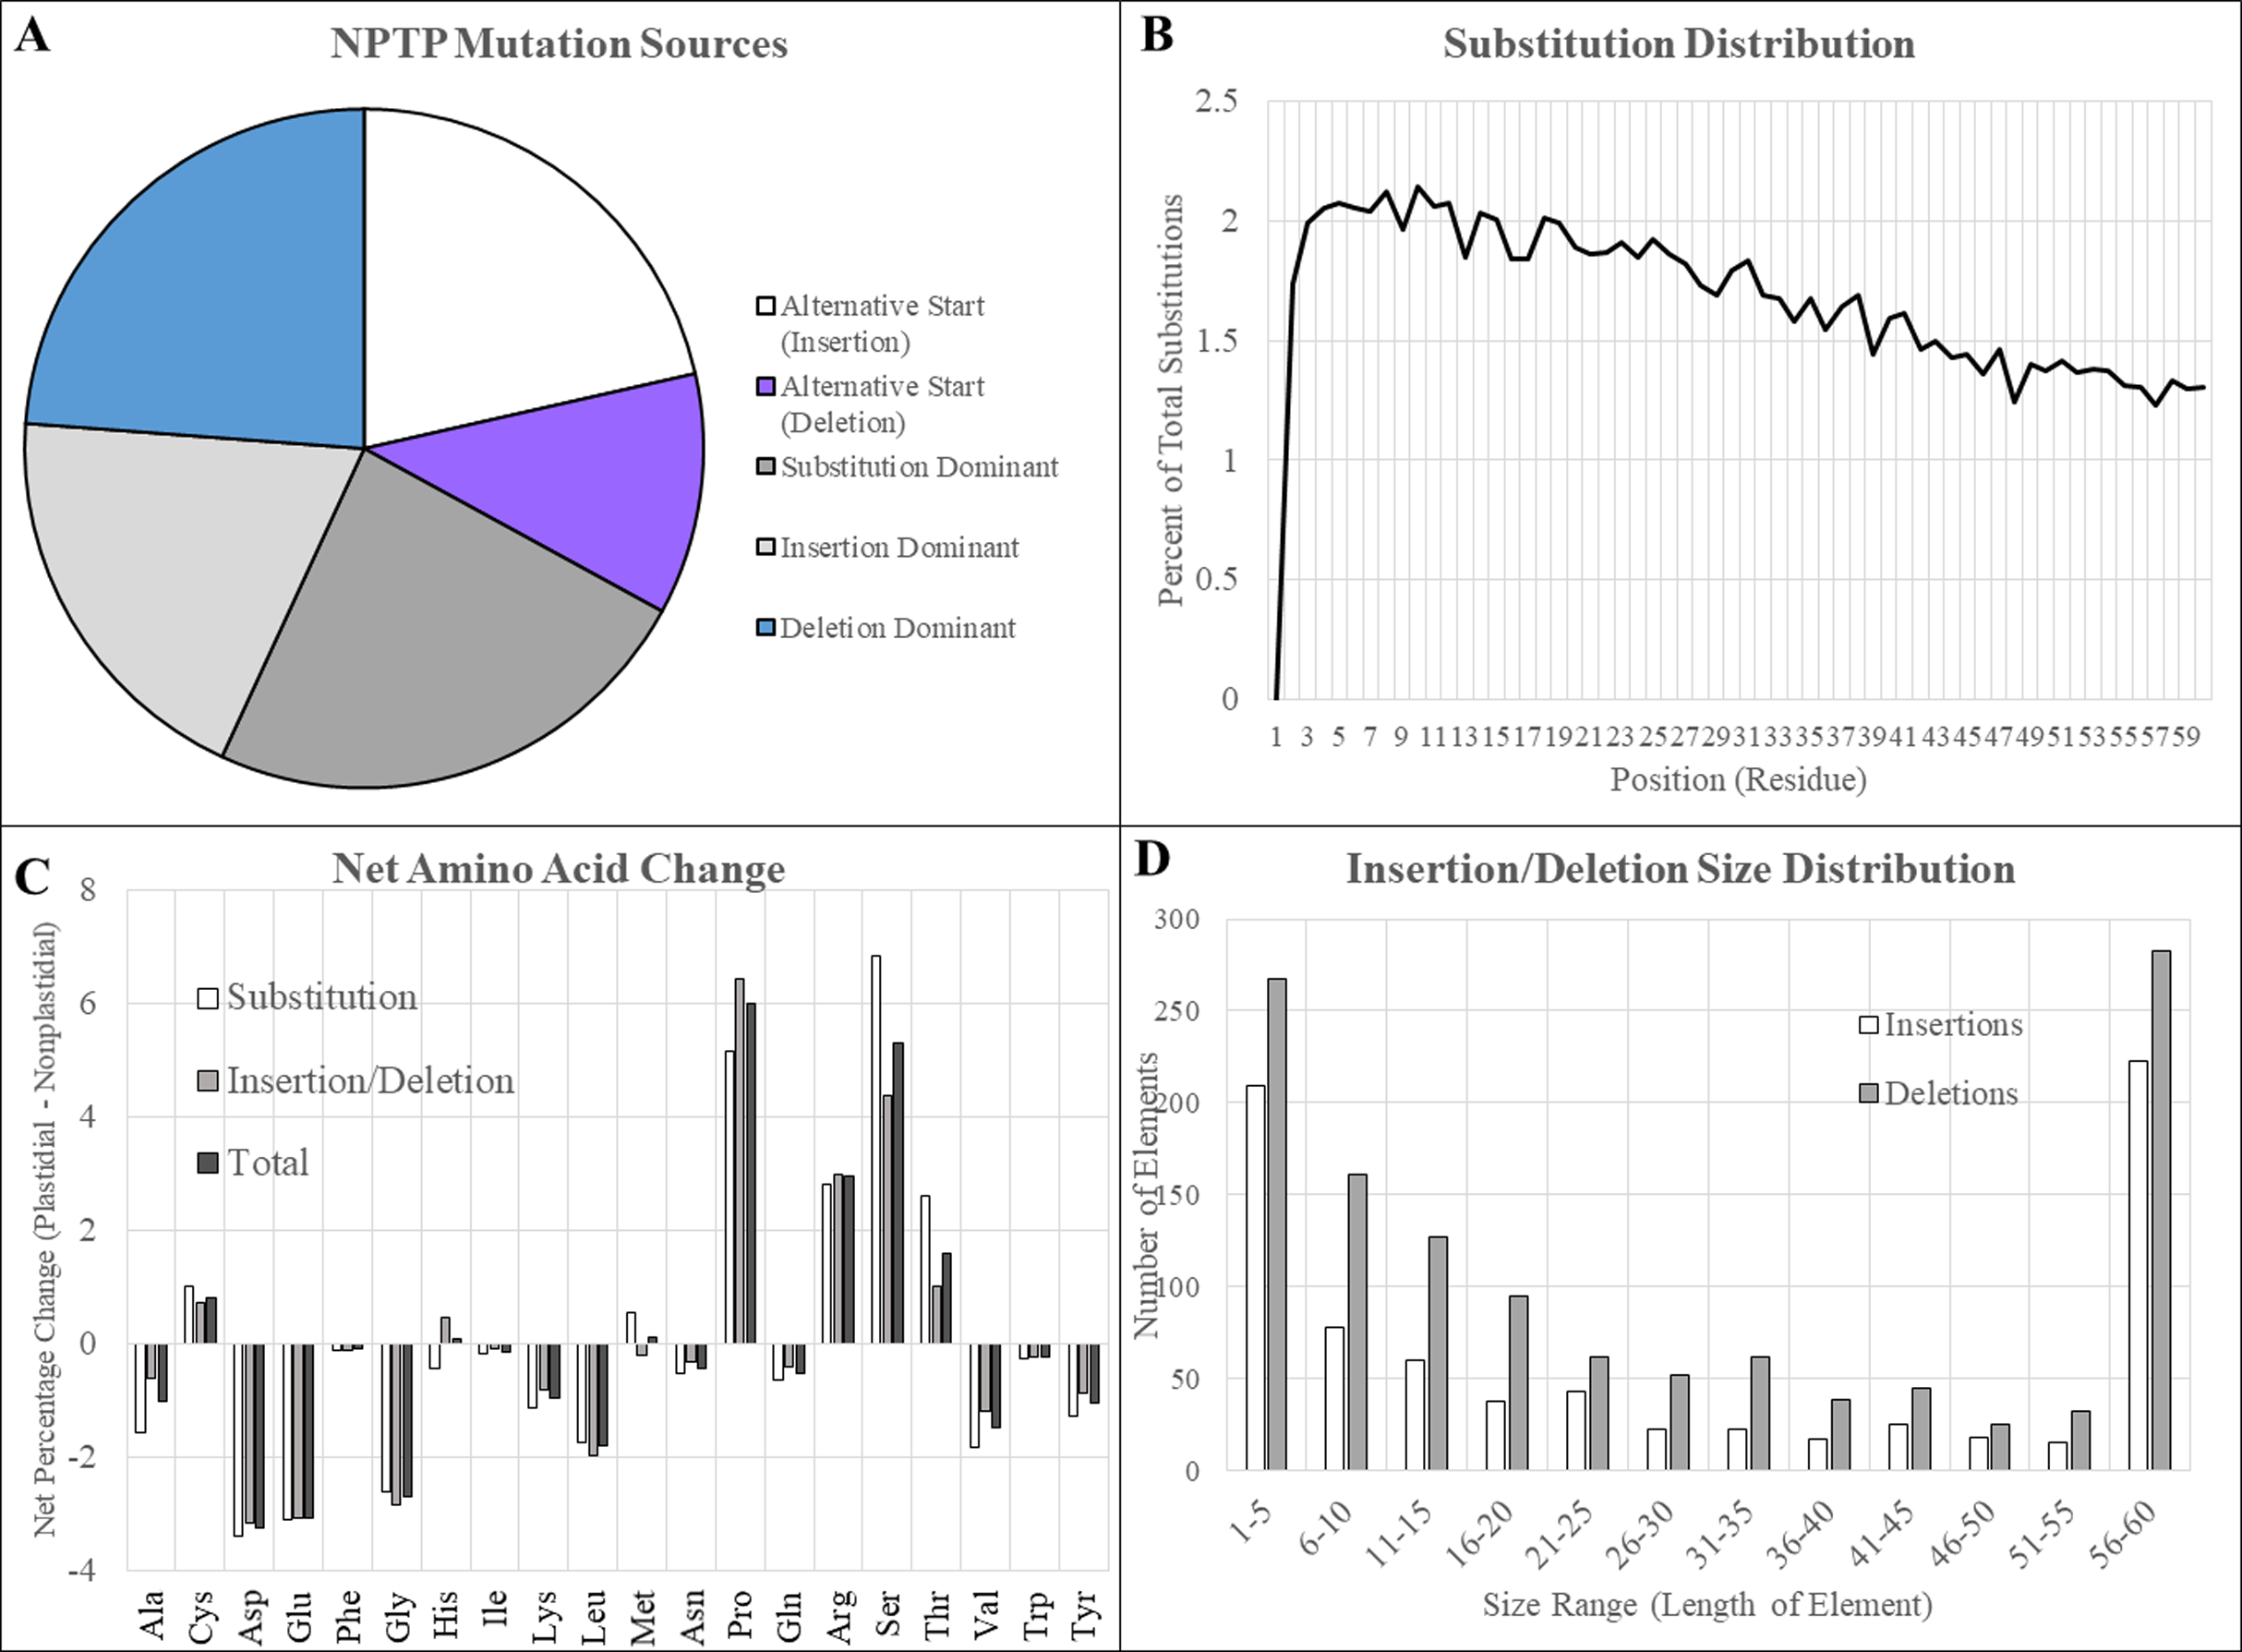
Insertions and deletions that did not align with an in-frame methionine and therefore did not represent alternative start sites accounted for 19.6% and 20.6% of cases, respectively. The most frequent size of both insertions and deletions were those that covered the full 60 amino acids of the putative transit peptide. Of the remainder, the most abundant size range in both cases was between 1 and 5 residues, and frequency declined as gap size increased. More substitutions were found at the beginning of the aligned sequence, although the difference was not nearly as pronounced as observed in Arabidopsis: 38.2% of substitutions were found in the first 20 positions, 34.2% between positions 21 and 40, and 27.6% between positions 41 and 60 (Fig. 9B).
Large increases in proline, arginine, serine, and threonine were observed along with decreases in aspartic acid, glutamic acid, glycine, leucine, valine, and tyrosine, although the magnitude of these changes was not nearly as drastic as observed for Arabidopsis1001 sequences (Fig. 9C). Most residues were not substantially different between substitutions and indels, although it is interesting to note that both serine and threonine were somewhat more likely to be caused by substitutions: the net change of serine was +4.4% for (insertions/deletions) and +6.5% for substitutions, while the net changes in threonine were +1.0% and +2.2%, respectively (Fig. 9D). Introductions of proline were conversely more likely to occur due to insertions or deletions (+6.4%) compared to residue substitutions (+5.1%). All other amino acids differed by a less significant margin between mutational modes.
Among all BrachyPan clusters, less than 5% of variant sequence pairs were from the same accession, indicating that variants caused by either isoforms or gene duplications within a single accession are rare. The frequency of NPTPs correlates with the population size of each taxonomic group reported previously (Gordon et al., 2017) (Fig. 10A). When normalized per accession, the extremely-delayed flowering (EDF+) accessions had nearly twice the NPTP diversity as the Turkish (T+) and Spanish (S+) accessions (Fig. 10B). The geographic distribution of accession diversity clearly shows that the most diverse accessions are generally found in or near Turkey (Fig. 10C). Even the reference Bd21-3 genome, which was collected in Iraq, has a greater number of NPTPs than many of the Spanish accessions. These results indicate that NPTP evolution followed a similar pattern to the Arabidopsis1001 dataset, and further implies that novel plastid-targeted proteins evolve in response to environmental pressures followed by natural selection. Please refer to Supplemental File 5 for the analysis output.
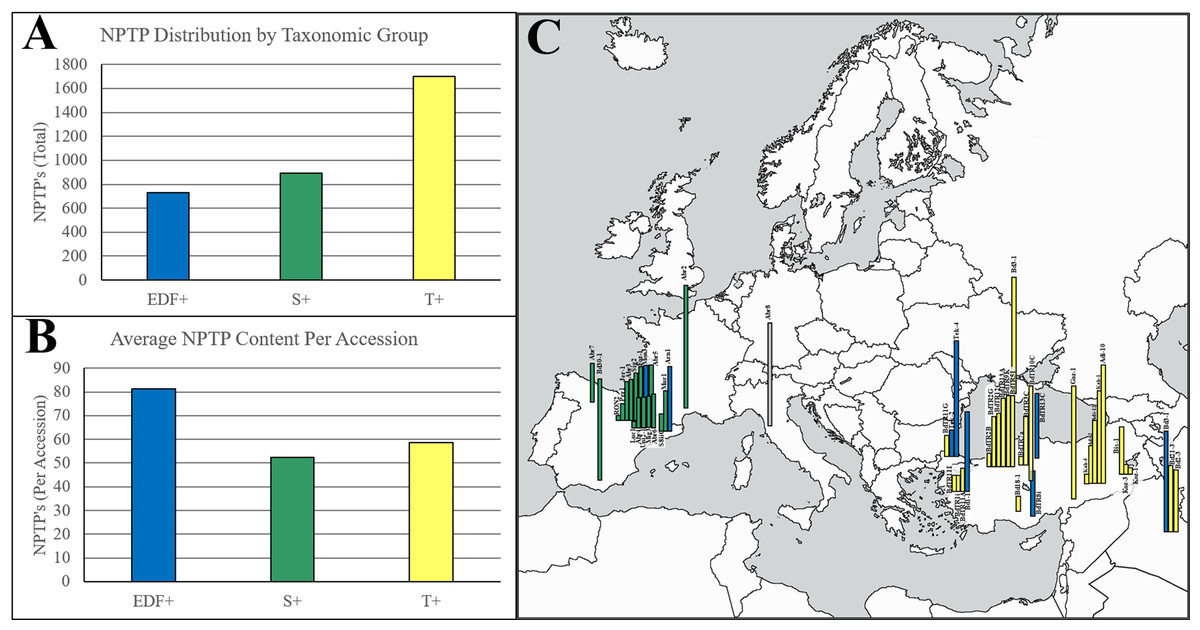
Figure 10: Geographic distribution of NPTPs in BrachyPan accessions.
The Turkish (T+) taxonomic group had the most NPTPs in absolute numbers (A), but when measured per accession, the extremely-delayed flowering taxonomic group (EDF+) was nearly twice as divergent (B). Geographic distribution of these lines is indicated in (C), where the length of each bar corresponds the number of NPTPs for each labeled accession. Taxonomic groups are color-coded according to Gordon et al. (2017). The map used in this figure was obtained from https://www.freeworldmaps.net/about.html (© https://www.freeworldmaps.net/).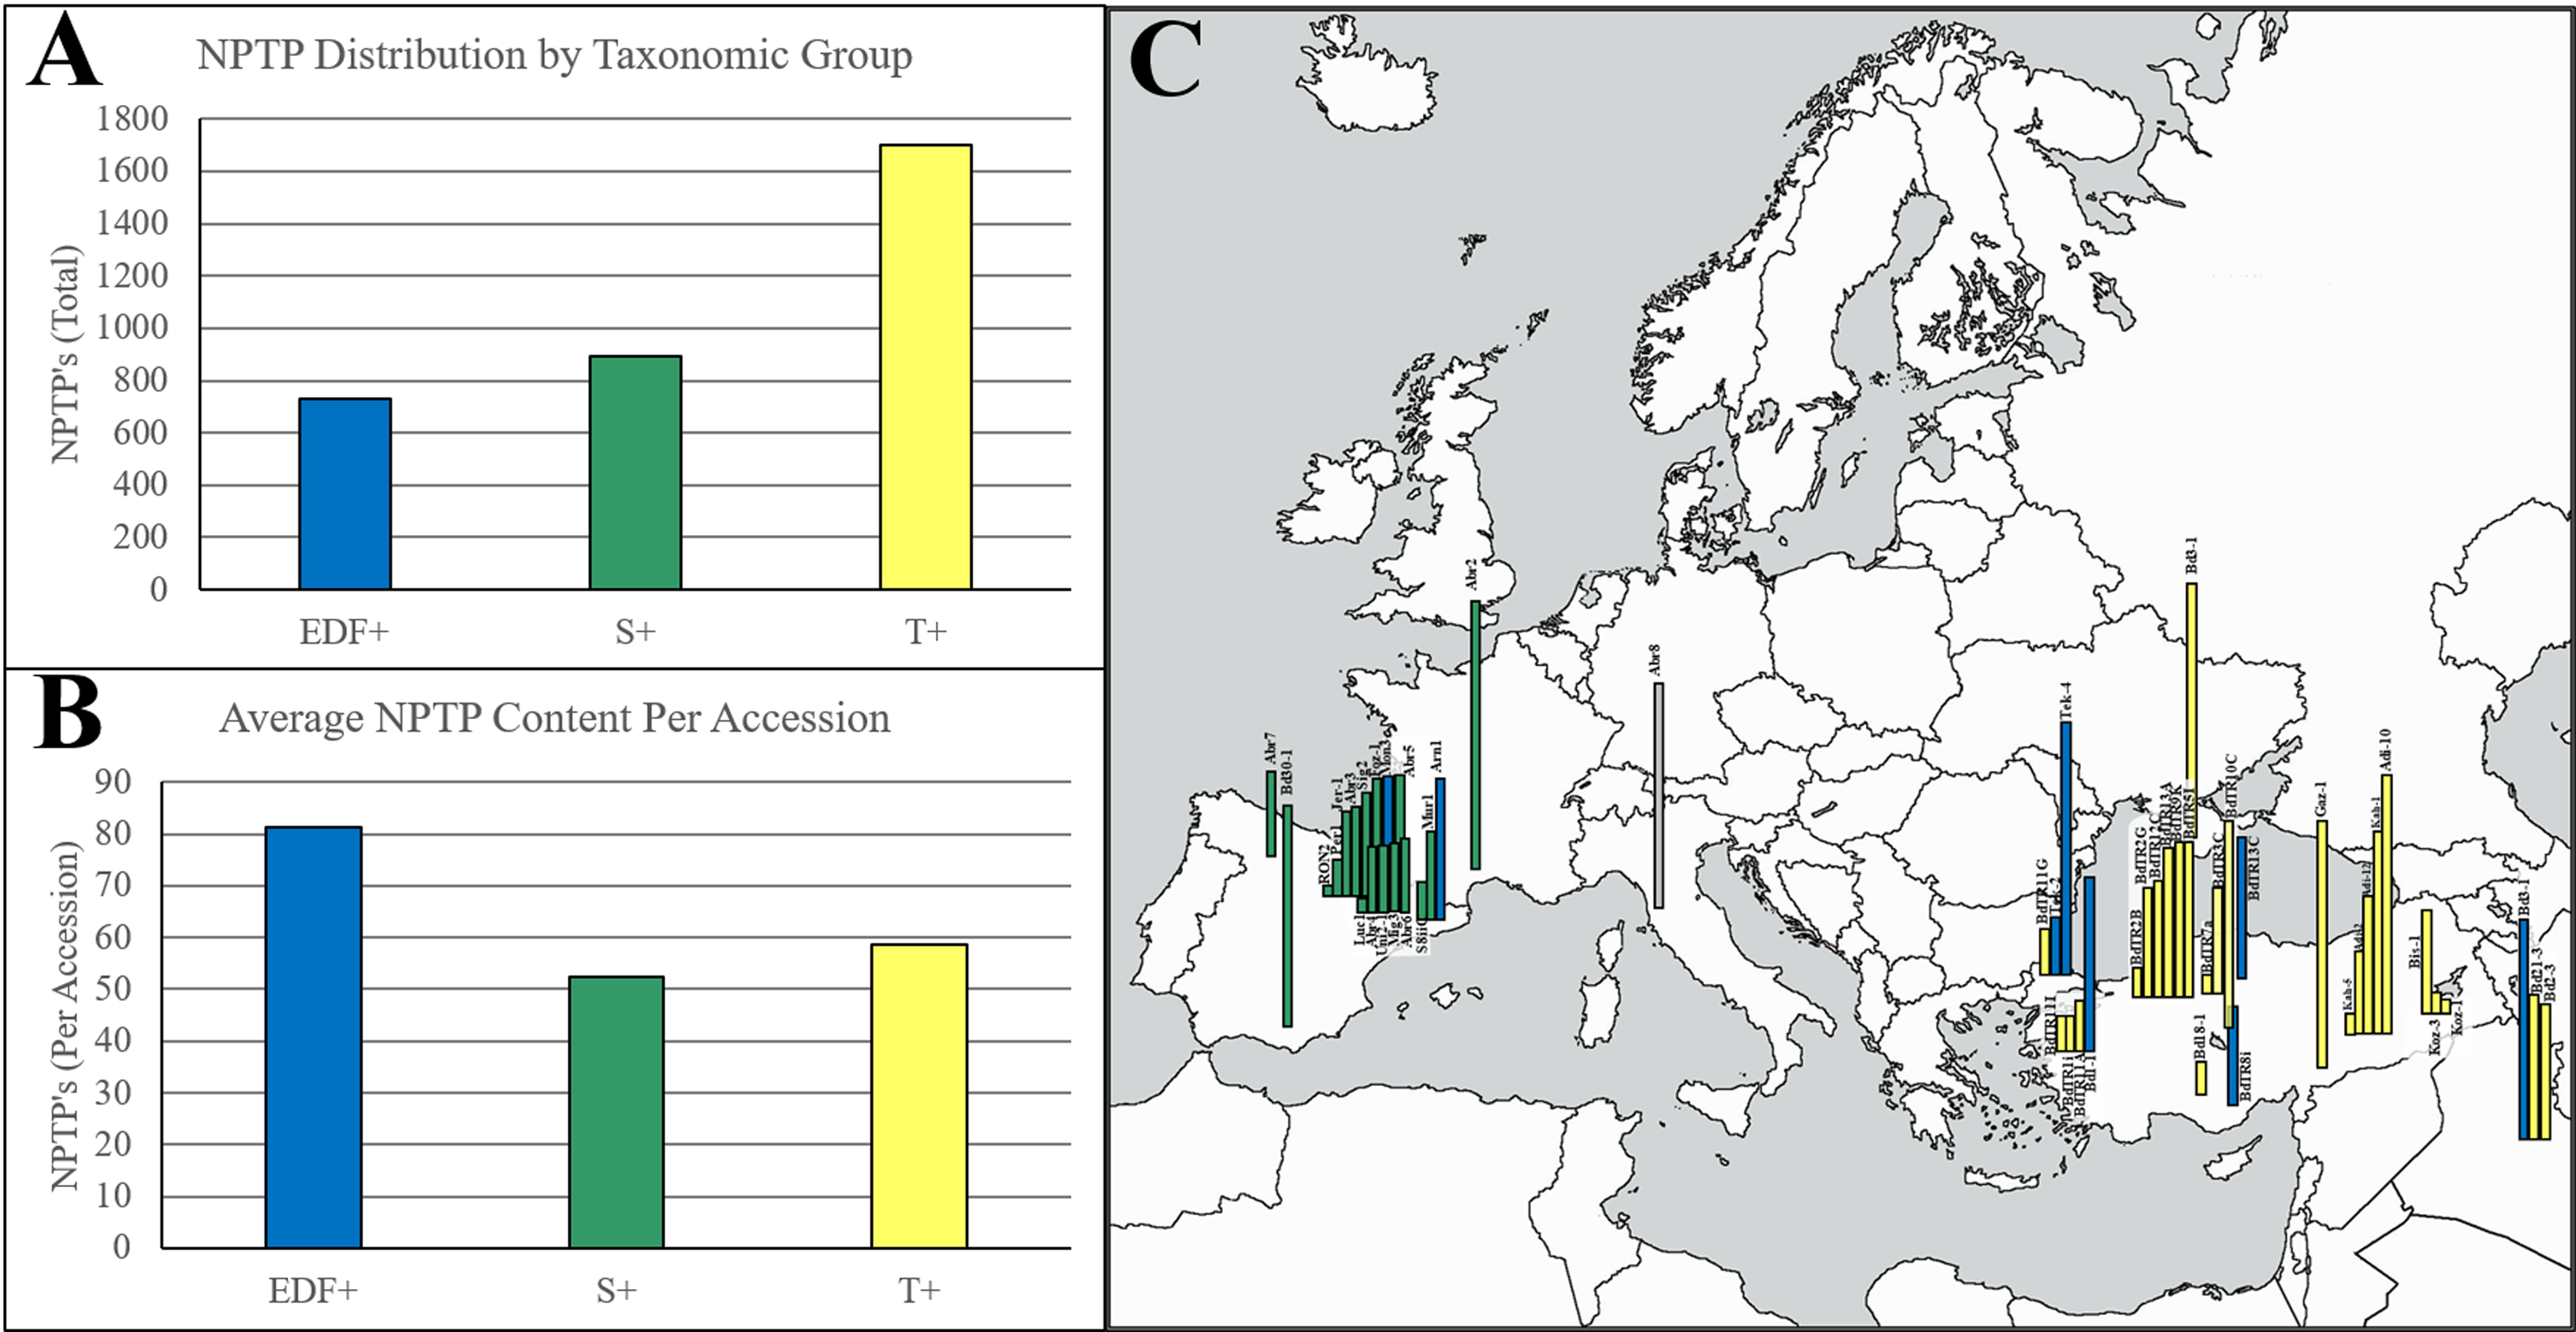
Within the Brachypodium pan-genome, clusters are categorized into “core” (56 genomes; 100%), “softcore” (53–55 genomes; 95–98%), “shell” (3–52 lines; 5–94%), and “cloud” (1–2 genomes; 2–5%) categories (Gordon et al., 2017). Over half (56.6%) of NPTPs occurred in core clusters, 25.2% occurred in softcore clusters, 17.9% occurred in shell clusters, and cloud clusters accounted for only two NPTPs, or 0.2% of the total (Fig. 11).

Figure 11: Gene conservation of NPTPs in BrachyPan.
(A) “Core” genes are those shared by all 56 accessions, “Softcore” genes are shared by 53–55 accessions, “Shell” genes are shared by 3–52 accessions, “Cloud” genes are found in 1–2 accessions. (B) While most gene clusters reported by Gordon et al. (2017) are in the “Shell” category, the “Core” and “Softcore” categories accounted for the most NPTPs. Categories are color-coded according to Gordon et al. (2017).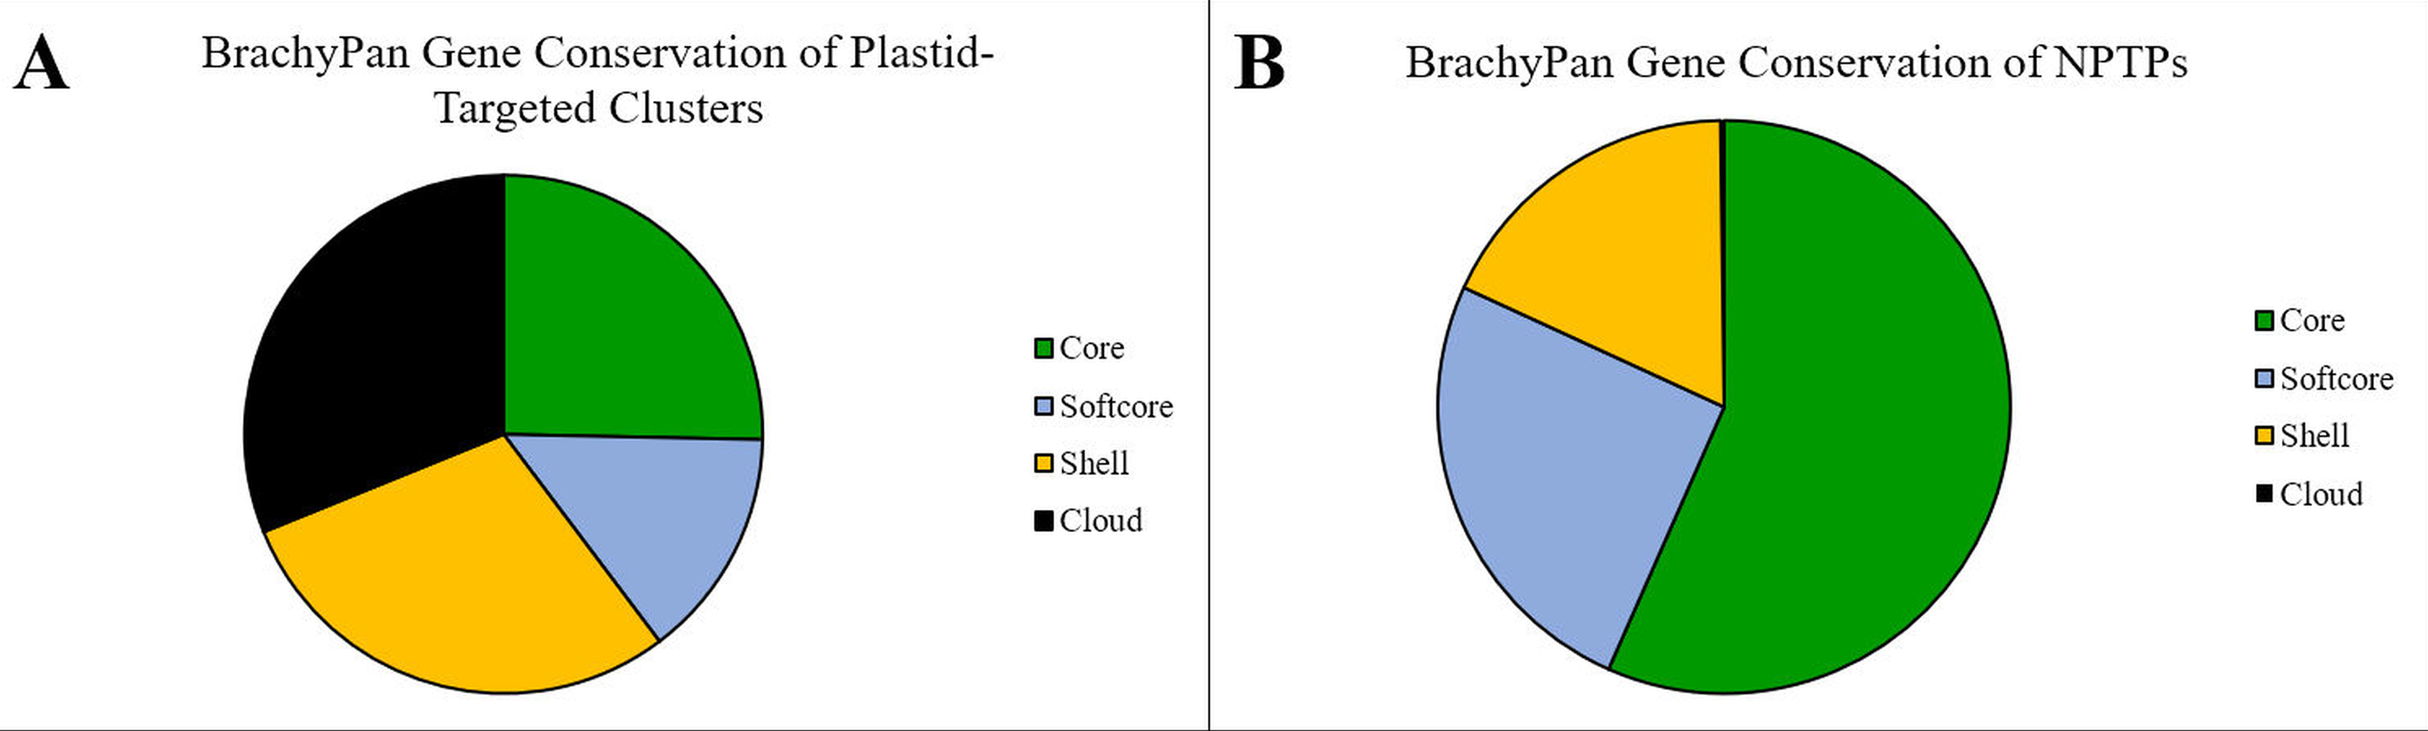
Previously published GO annotation information (Gordon et al., 2017) was converted into GO slim categories in BLAST2GO and compared to the Bd21-3 reference genome to find under- and over-represented terms (Table 6). Using P-value < 0.05 as a significance threshold, significant underrepresentation of cytoplasmic and ribosomal terms was found for cellular component ontologies, while structural molecule activity, ribosomal components, and cyclic compound binding terms were underrepresented for molecular function ontologies. Overrepresented terms involved in biological processes included nitrogen metabolism, cell wall organization, and lipid metabolism, suggesting that secondary metabolic processes are significantly more likely to have differential targeting. Terms of the molecular function ontology included ion binding, kinase activity, transferase activity, and catalytic activity. Overrepresented cellular component ontology terms were somewhat scattered, reflecting the selection of differentially-targeted genes.
| Tags | GO ID | GO Name | GO Category | FDR | P-value |
|---|---|---|---|---|---|
| UNDER | GO:0005737 | cytoplasm | CELLULAR_COMPONENT | 0.026818 | 2.10E−04 |
| UNDER | GO:0044444 | cytoplasmic part | CELLULAR_COMPONENT | 0.045423 | 5.32E−04 |
| UNDER | GO:0005198 | structural molecule activity | MOLECULAR_FUNCTION | 0.106841 | 0.002523 |
| UNDER | GO:0003735 | structural constituent of ribosome | MOLECULAR_FUNCTION | 0.155505 | 0.005467 |
| UNDER | GO:1990904 | ribonucleoprotein complex | CELLULAR_COMPONENT | 0.178068 | 0.007651 |
| UNDER | GO:0005840 | ribosome | CELLULAR_COMPONENT | 0.178068 | 0.007651 |
| UNDER | GO:1901363 | heterocyclic compound binding | MOLECULAR_FUNCTION | 0.37075 | 0.036206 |
| UNDER | GO:0003676 | nucleic acid binding | MOLECULAR_FUNCTION | 0.37075 | 0.036206 |
| UNDER | GO:0097159 | organic cyclic compound binding | MOLECULAR_FUNCTION | 0.37075 | 0.036206 |
| OVER | GO:0043167 | ion binding | MOLECULAR_FUNCTION | 8.38E−05 | 3.27E−07 |
| OVER | GO:0005488 | binding | MOLECULAR_FUNCTION | 0.064876 | 1.01E−03 |
| OVER | GO:0071941 | nitrogen cycle metabolic process | BIOLOGICAL_PROCESS | 0.106841 | 2.38E−03 |
| OVER | GO:0071554 | cell wall organization or biogenesis | BIOLOGICAL_PROCESS | 0.106841 | 0.002921 |
| OVER | GO:0051276 | chromosome organization | BIOLOGICAL_PROCESS | 0.117522 | 0.003673 |
| OVER | GO:0043233 | organelle lumen | CELLULAR_COMPONENT | 0.269756 | 0.015806 |
| OVER | GO:0070013 | intracellular organelle lumen | CELLULAR_COMPONENT | 0.269756 | 0.015806 |
| OVER | GO:0031981 | nuclear lumen | CELLULAR_COMPONENT | 0.269756 | 0.015806 |
| OVER | GO:0031974 | membrane-enclosed lumen | CELLULAR_COMPONENT | 0.269756 | 0.015806 |
| OVER | GO:0006629 | lipid metabolic process | BIOLOGICAL_PROCESS | 0.279342 | 0.017459 |
| OVER | GO:0005654 | nucleoplasm | CELLULAR_COMPONENT | 0.348322 | 0.028573 |
| OVER | GO:0016301 | kinase activity | MOLECULAR_FUNCTION | 0.348322 | 0.023589 |
| OVER | GO:0120025 | plasma membrane bounded cell projection | CELLULAR_COMPONENT | 0.348322 | 0.028467 |
| OVER | GO:0042995 | cell projection | CELLULAR_COMPONENT | 0.348322 | 0.028467 |
| OVER | GO:0005929 | cilium | CELLULAR_COMPONENT | 0.348322 | 0.028467 |
| OVER | GO:0016772 | transferase activity, transferring phosphorus-containing groups | MOLECULAR_FUNCTION | 0.37075 | 0.034041 |
| OVER | GO:0065007 | biological regulation | BIOLOGICAL_PROCESS | 0.375382 | 0.038125 |
| OVER | GO:0003824 | catalytic activity | MOLECULAR_FUNCTION | 0.401607 | 0.042357 |
| OVER | GO:0044428 | nuclear part | CELLULAR_COMPONENT | 0.424632 | 0.046444 |
Interestingly, several terms associated with inclusion bodies (GO:0090083, GO:0090084, GO:0070841) were overrepresented. Inclusion bodies are associated with viruses, so the enrichment of these terms suggests that not all NPTPs may be endogenous proteins. Sequences from pathogens and endosymbionts are common contaminants of high-throughput sequencing data, and eukaryotic genomes often have dormant retroviral elements scattered throughout their genomes(Sabot & Schulman, 2006). Although these sequences may at first glance appear to be false positives, effector proteins from multiple pathogenic species have been observed to translocate to the chloroplast (Dodds & Rathjen, 2010; Win et al., 2012). For instance, bioinformatic analysis of Pseudomonas syringae effector proteins predicts many to be chloroplast-targeted (Guttman et al., 2002), and at least four have been confirmed in vivo (Jelenska et al., 2007; Rodríguez-Herva et al., 2012; Li et al., 2014). Plastid-targeted effectors also appear to be highly abundant in rust fungi (reviewed in Lorrain, Petre & Duplessis (2018)). Effector proteins from both bacteria and fungi suppress hypersensitive responses by targeting protein folding, salicylic and jasmonic acid production, photosystem II, and ROS signaling pathways. Furthermore, coat proteins of cucumber necrosis virus and Lolium lentivirus have also been described to have plastid localization, which may promote virus coat disassembly as well as target host immune pathways (Hui, Xiang & Rochon, 2010; Vaira et al., 2018).
Transposon-based origin of NPTPs
Transposable element sequences for all Viridiplantae species were downloaded from REPBASE release 23.03 (“RepBase”). All possible open reading frames of at least 300 bp were mined from this dataset, translated to protein sequences, and analyzed with TargetP and Localizer. A total of 19,848 sequences with a consensus plastid targeting prediction were extracted and collected into a BLAST database for analysis against potential evolutionarily emergent plastid transit peptides. Each pair of diverged sequences was compared to this database of transposon sequences to see if the same transposon sequence was a match in both or unique to one sequence.
Using an e-value cutoff of e*10−5, transposons were not found to be a significant source of transit peptide acquisition. No examples were found in the Arabidopsis1001 dataset, although this is unsurprising given that almost all pairs differed by only 1–2 substitutions. In BrachyPan, 33 potential candidates were identified, while in the multi-genome dataset, a total of 12 candidates were found. However, only a small fraction of these candidates consisted of high-scoring matches covering a majority of the transit peptide, so many initial hits were the result of random sequence alignment. Although transposons may donate functional transit peptides in a minority of cases, the evidence suggests that they are insignificant in the evolution of the plastid proteome.
Gaps in orthologous protein prediction
It is likely that the total number of NPTPs has been underestimated in all datasets because relatively stringent criteria were implemented in this study. In the Arabidopsis1001 dataset, sequences seldom differ by more than a few residues throughout the whole gene sequence, and as a result, the phylogenetic trees have extremely short branch lengths. Many poorly-resolved trees were likely discarded due to this problem alone.
In contrast, the BrachyPan and multi-genome gene clusters represent broader orthologous or homologous gene families and are far more likely to have relatively divergent branches with nascent plastid transit peptides. Yet, the inclusion of broader sequence variants also introduces the potential for error. In BrachyPan, many in-paralogs had poor sequence alignment and are likely to be unrelated, while in the multi-genome analysis, most of the smaller clusters were orthologous, but larger clusters often included paralogs. However, these trees were resolved with maximum likelihood methods, poorly aligned or nonhomologous sequences are unlikely to affect the analysis of these clusters.
Even so, many larger clusters in which plastid targeting arose independently in multiple paralogs were rejected. In these cases, independently evolving transit peptides would require more stringent clustering methods to resolve individual groups. Finally, the prediction approach using TargetP 1.1 and Localizer achieves excellent correlation with experimentally validated results, but has a significant sensitivity gap which may underrepresent NPTPs or incorrectly predict the exact point of subcellular targeting divergence.
In addition to the above-mentioned limitations, there are some generic caveats that apply to any such predictive genome-scale analyses. These include variability in the sequencing, assembly and annotation of the genome, prediction of gene models particularly related to the targeting region of the gene, and the limited spatio-temporal characterization of the transcriptomes. Despite these constraints, differences in gene modeling were accounted for by discarding all orthologous clusters lacking at least three species as best as possible. A majority of gene sequences analyzed in this work were supported by transcriptomics evidence for each genome, although the prediction of the 5′ start site can be variable. Within the pan-genomes, predicted transcripts and proteins were generated using a uniform set of models and algorithms, which should mitigate some of the caveats. This study therefore provides an initial predictive framework at best, which will serve as an initial reference. It warrants an in-depth spatiotemporal study of plastid proteomes via transcriptomics or more aptly in combination with high throughput proteomics methods. Follow up wet-lab experimentation will unravel the diversity of the plastid proteome in specific tissues or conditions as well as across the plant kingdom, and validate or correct the localization predictions presented in this study.
Conclusions
Gain and loss of plastid transit peptides yield subcellular relocalization of the proteins they chaperone, leading to changes in the diversity and function of the plastid proteome. This study describes that this phenomenon, despite the caveats noted in the preceding section, is widespread and likely responsible for significant phenotypic changes. The primary sequence composition of monocot and eudicot transit peptides was surprisingly divergent, possibly due to differences in the composition of the TIC translocon at the inner plastid envelope. However, for both monocots and dicots the data supported the hypothesis that transit peptides may evolve via simple substitutions, insertions and deletions, or alternative start sites.
It was observed that gain of transit peptides occurs regularly both across diverse genera and within pan-genomes. However, transit peptide loss occurred roughly four times more frequently than the transit peptide gain within orthologous protein clusters of both the Arabidopsis and Brachypodium pan-genomes. Small insertions and deletions were determined to be the dominant form of novel transit peptide evolution, followed by residue substitutions. A majority of indel events represent probable alternative start sites, but internal indels and alternative splicing were also major factors equaling or surpassing residue substitutions in importance. Finally, it was found that gene duplications and alternative protein isoforms are more important factors in the evolution of novel plastid-targeted proteins than allelic variants.
Based on GO enrichment, it was apparent that plastid localization variants across multiple species were related to secondary metabolism, transcriptional regulation, and protein regulation. Since plastids are critical for various key metabolic functions, a better understanding of the unique plastid-targeted proteins could reveal important gene candidates for improving yield, nutrient content, environmental stress tolerance, and production of valuable medicinal or aromatic compounds. The outcome of these analyses has established a foundational collection of candidate proteins for confirming localization and functional validation in vivo.
It could be concluded that plastid-targeting peptides continue to be acquired or lost in wild populations. As the attendant environment changes, proteins experiencing subcellular relocalization may position the subpopulations at a competitive advantage.