
Unlocking insights: integrated text mining and interpretive structural modeling for enhanced user review analysis
- Published
- Accepted
- Received
- Academic Editor
- Bilal Alatas
- Subject Areas
- Data Mining and Machine Learning, Data Science, Visual Analytics, Text Mining
- Keywords
- User reviews, TF-IDF, Word2vec, Knowledge graph, ISM
- Copyright
- © 2024 Li et al.
- Licence
- This is an open access article distributed under the terms of the Creative Commons Attribution License, which permits unrestricted use, distribution, reproduction and adaptation in any medium and for any purpose provided that it is properly attributed. For attribution, the original author(s), title, publication source (PeerJ Computer Science) and either DOI or URL of the article must be cited.
- Cite this article
- 2024. Unlocking insights: integrated text mining and interpretive structural modeling for enhanced user review analysis. PeerJ Computer Science 10:e2541 https://doi.org/10.7717/peerj-cs.2541
Abstract
Effective keywords are extracted from the massive milk product user review data to construct thematic terms and explore the elemental influence relationships to assist manufacturers, and e-commerce platforms in understanding user behaviour and preferences and further optimise product design and marketing strategies. By fusing two different text mining methods, term frequency-inverse document frequency (TF-IDF) and Word2vec, we explore the semantic relationships, then visualise the relevance of user reviews by drawing knowledge graphs with Neo4j, and finally, be able to explore the relationship between the themes of the mined reviews, interpretative structural model (ISM) was used for a comprehensive evaluation, and the effectiveness of the method was verified on the Suning.com website dataset. The fusion of text mining and systematic analysis helps users to locate products quickly and precisely from the huge review information. The six elements of user reviews were categorized as freshness of taste, discounted prices, logistics, customer repurchase, product packaging, nutritional composition, and their element levels were divided into three layers. the first layer was discounted prices, customer repurchase, and logistics; the second layer was product packaging and nutritional composition; and the third layer was taste freshness.
Introduction
With the emergence of the Big Data era, the vast amount of resources and diverse forms of data on the Internet have posed a considerable challenge to information mining research. As a basic form of expressing users’ opinions and demands on products, the collection, mining, and analysis of user reviews have become an objective basis for e-commerce platforms to improve their service standards, enhance user satisfaction, as well as for manufacturers to solve user pain points and focus on user experience. How to quickly grasp the information of interest to users from the vast amount of user comment text, visualize user needs and dig deeper into the hidden connections in user comment information is not only an important technology that enterprises need to develop and improve but also a hot issue for scholars at present. Discovering the hot content users discuss based on text mining techniques and knowledge graphs is possible. At the same time, through the interpretative structural model (ISM), it is possible to find the interrelationships between the ranges, thus helping enterprises to explore user needs and determine the management direction.
In text mining, term frequency-inverse document frequency (TF-IDF) is suitable for simple text feature representation and word frequency statistics and is more effective for handling large-scale text collections (Toosi, Ghaaderi & Shokrani, 2021); Word2Vec is ideal for capturing the semantic and syntactic relationships of words, with better representation and inference capabilities and is suitable for language modelling and semantic-related tasks (Hong et al., 2022); ISM can describe the non-linear and non-symmetric relationships between multiple variables, and can better capture complex dependencies between variables, including non-linearities and interactions (Lin et al., 2022). Text mining methods can extract various information from the text to obtain a comprehensive description and understanding of the text (Kayikci, 2022). At the same time, explanatory structural modelling can further structure this information to reveal the relationships and dependencies between variables, further improving the accuracy and reliability of modelling and prediction and hence a better understanding of textual data. Thus, combining text mining and explanatory structural models can enhance overall performance, leading to more complete, accurate, and descriptive analysis results (Hattab, 2021).
In summary, unlike previous research methods that use a single method for text mining of user reviews, this study takes milk products on Suning.com website as the research object. It integrates word frequency analysis, relevance analysis, knowledge graph analysis and influencing factor analysis to mine key information in user reviews, i.e., word frequency analysis through TF-IDF to obtain keywords, relevance analysis through Word2vec to obtain word relevance, and visual display of the relationship of each word through Neo4j so as to classify the keywords into different categories, which in turn define the topics, and finally explore the relationship between topics through ISM. This study analyses the content of user discussions, areas of interest and interaction with products to better meet user needs and improve the quality of e-commerce platform services and manufacturers.
Literature Review
The mining of user review data has attracted many scholars because of its excellent research value and relevance. Much progress has been made in the research on comment data mining. The two main aspects of mining comment data are word frequency and systematic analysis.
In word frequency analysis, developing keyword extraction methods is a continuous process of innovation. Early in the field, Justeson & Katz (1995) proposed the TERMS system, which is based mainly on the distinguishing features of terms from ordinary words one by one technical terms are almost always composed of nouns and adjectives, as well as a small number of prepositions connecting two noun phrases. Liu, Teller & Friedman (2004) introduced the concept of association rules in natural language processing. Firstly, user comments were divided into words and lexical annotations, and then noun verbal terms were extracted using the technique of frequent item mining. Then, adjectives associated with the nouns were removed according to association rules, summarizing the item’s features. The aim was to understand user reviews better and thus extract critical parts of the things (Hu & Liu, 2004). Scaffidi et al. (2007) designed and implemented the Red Opal search system. The system removes product features using TF-IDF and lexical annotation methods and performs sentiment analysis on each segment. Li, Cui & Ji (2015) proposed a keyword extraction algorithm based on the Word2vec model. They used Word2vec for word separation, word embedding, and clustering by calculating the similarity between words to obtain text keywords. Experiments demonstrated that the algorithm’s keyword extraction accuracy was significantly better than others in longer texts. Cerisara, Krl & Lenc (2018) applied Word2vec to conversational behavior recognition and demonstrated that deep neural networks outperformed maximum entropy classifiers. Experimental results showed that the model could better capture the semantic features of spoken commentary text in the keyword extraction phase and achieved significant improvements in other baselines.
For systematic analysis, the similarity is calculated based on the corpus, i.e., based on the information in a more extensive set of texts, and this type of approach evaluates ’semantic’ similarity. Semantic similarity is obtained through statistical analysis of many documents, where the “large number of documents” is the corpus. Marom & Zukerman (2009) explored corpus-based approaches to automating email responses, focusing on information-gathering techniques and granularity. We evaluated different methods and found that they were successful in automatically generating most of the email responses. The meta-selection process was also investigated to provide a unified response automation solution for new query emails. Hashemi & Shakery (2014) proposed a method for mining high-quality translation knowledge from UTPECC, using term association networks (TAN) to extract translation knowledge. A post-processing step is used to detect mistranslated terms. The evaluation results show that the use of the UTPECC approach is significantly better than the dictionary-based approach and is particularly suitable for translating extra-lexical terms and extended query words; Tutubalina et al. (2017) conducted a study for different therapeutic groups of drugs to find compounds with potentially similar biological effects. By applying the Word2vec model, it was possible to model and analyze the semantic relationships between drugs, further revealing the similarity of their possible physical results; Qiu et al. (2019) combined a plain Bayesian model with Word2vec and experimentally demonstrated that this scheme was more efficient than TF-IDF, Text Rank and Rapid Automatic Keyword Extraction (RAKE), with a substantial improvement in F1 values.
In summary, the above provides a history of developing some keyword extraction methods, from early plans based on word frequency and location information to later ways that introduce techniques such as association rules and deep learning. However, text mining for information extraction of user comments still needs to improve, such as ignoring textual and contextual information, lack of accuracy in keyword selection, and poor extraction accuracy due to using a single method, which affects the final information extraction results. Therefore, this paper will be oriented to solving practical problems by considering the textual features and semantic similarity of the comment data, obtaining keywords of user comment texts through TF-IDF, conducting relevance analysis on the accepted keywords, displaying all word relationships, and constructing themes by drawing knowledge graphs through Neo4j, and finally treating each theme as an element and analyzing the influence and hierarchical relationship between the elements The knowledge graph is then used to analyze the impact and hierarchical relationships between the details, so that the information in the user reviews can be more comprehensively mined to understand better the user’s evaluation and demand for the product or service, providing a valuable reference for e-commerce platforms and manufacturers to make decisions and improvements.
Research Methodology and Empirical Analysis
Portions of this text were previously published as part of a preprint (https://www.researchsquare.com/article/rs-3375941/v1). The website was launched in December 2010, covering home appliances, department stores, mother and child, and books. In this paper, the user reviews of milk products on the Suning Tesco website are crawled, the crawled user reviews are stored in CSV format, and the user reviews are Chinese sub-phrased and used for subsequent data analysis. The overall process is shown in Fig. 1. This paper’s research idea will follow the logic of “word frequency analysis → correlation analysis → correlation visualisation → elemental relationship analysis” for empirical analysis.
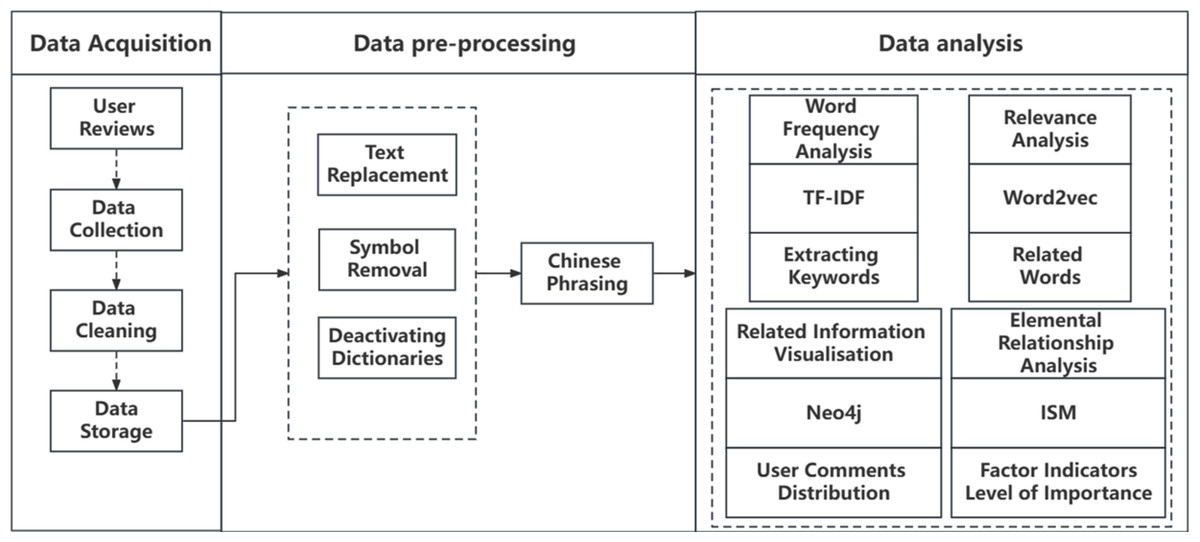
Figure 1: Research ideas.
This paper’s research idea will follow the logic of “word frequency analysis → correlation analysis → correlation visualisation → elemental relationship analysis” for empirical analysis.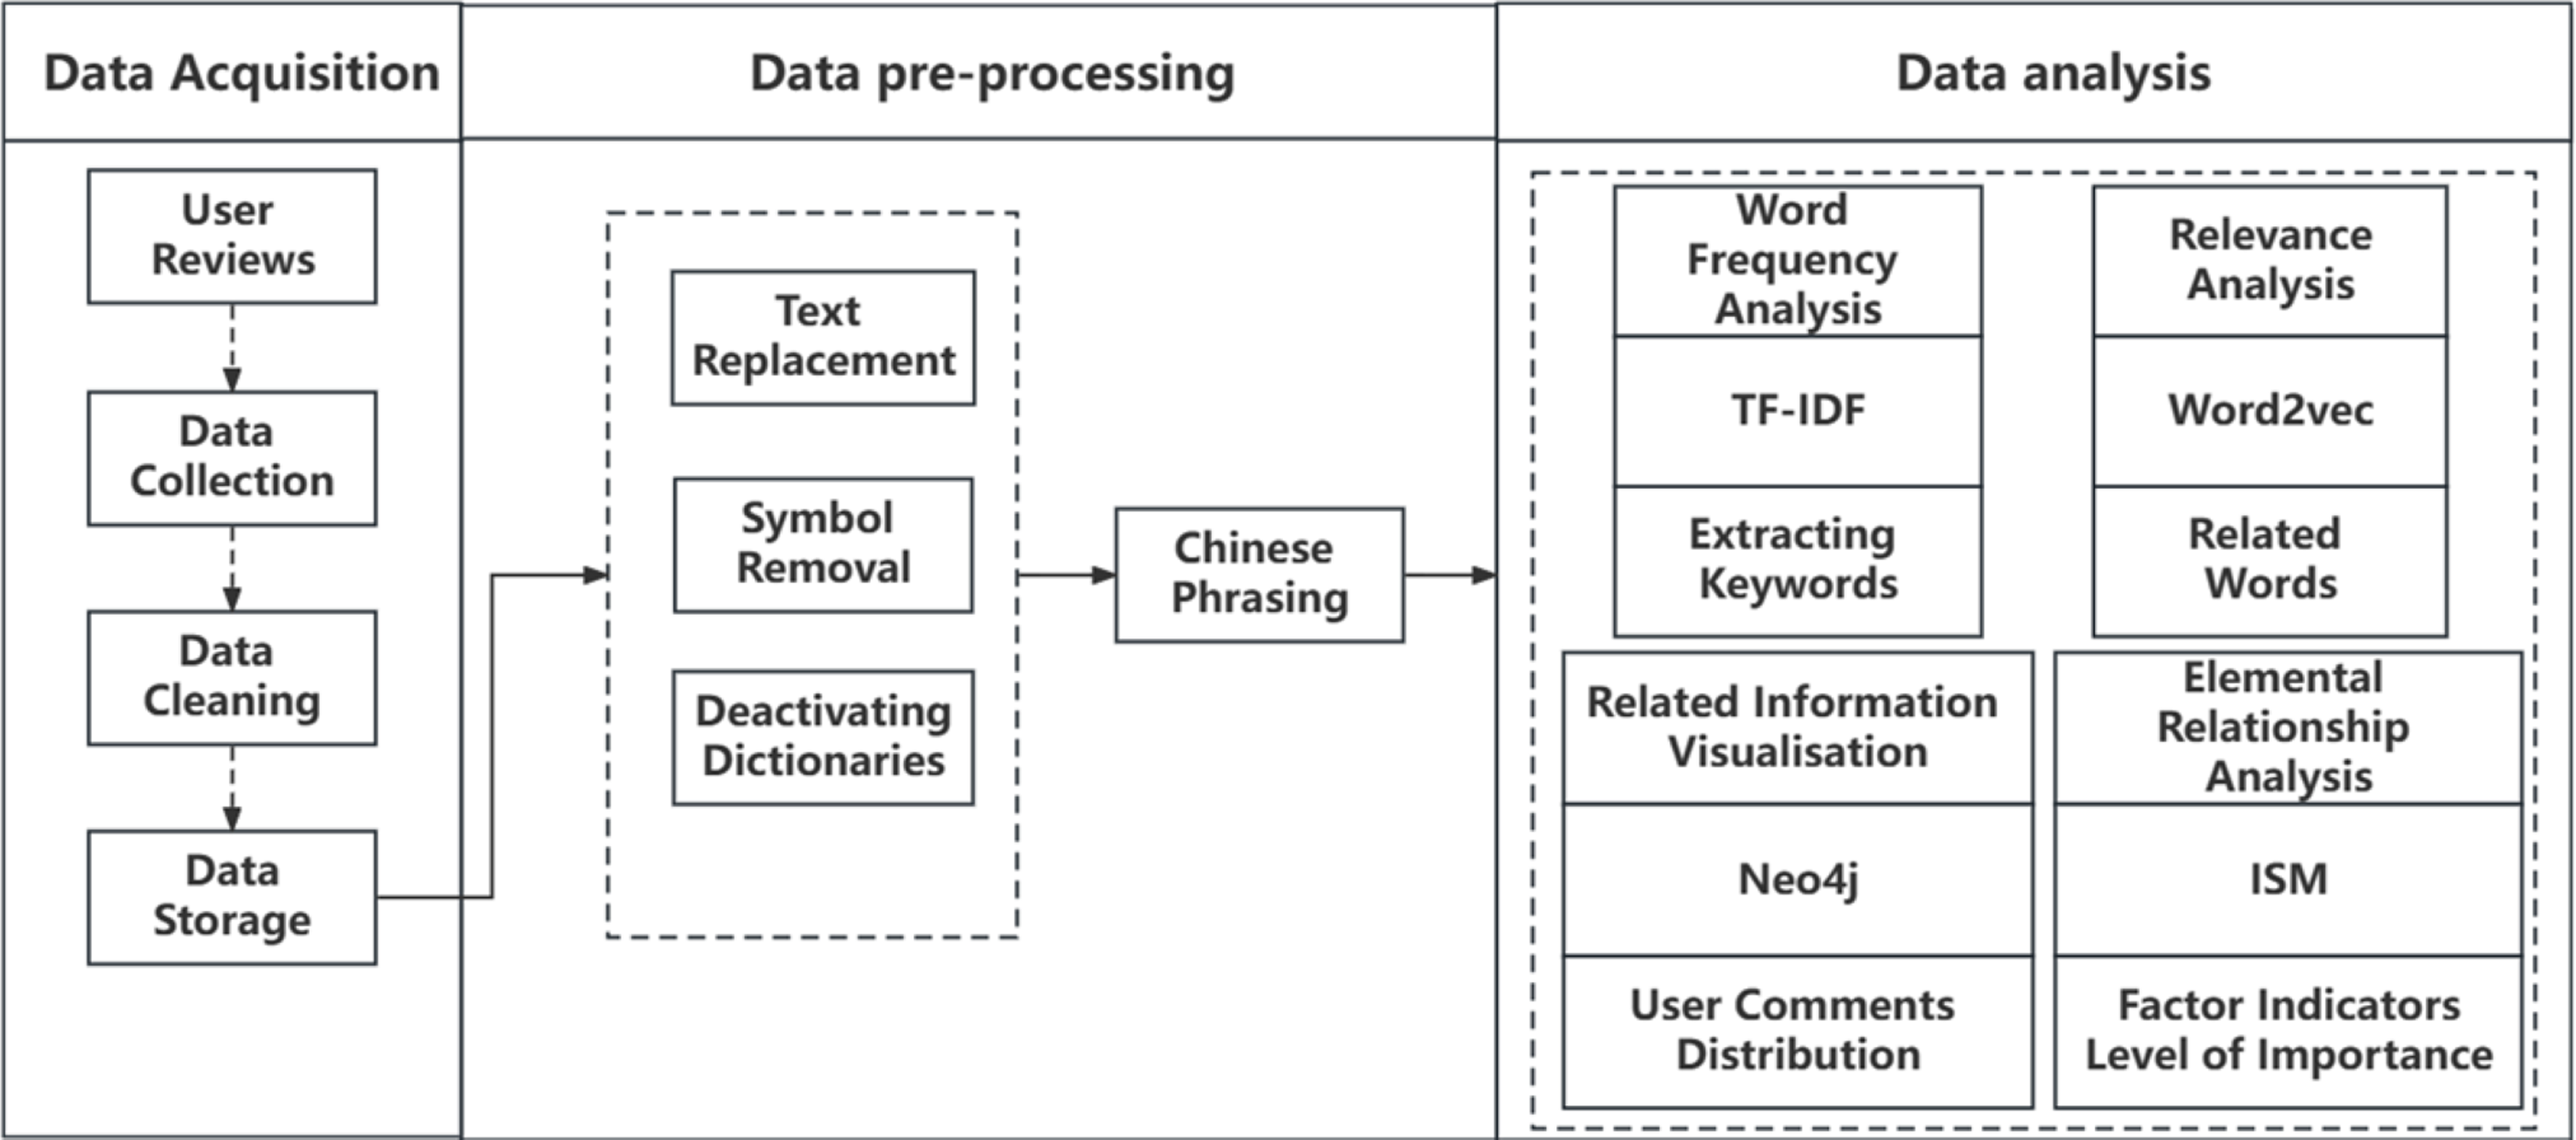
Research Methodology
(1) Word frequency analysis. The former is the ratio of the number of occurrences of a specific word in the user reviews of milk products to the total number of words in the text of user reviews, and the latter is the ratio of the number of user reviews of all milk products to the number of studies containing a specific word, and finally, the words with the highest word frequency will be used as keywords in user reviews;
(2) Relevance analysis. Since TF-IDF cannot reflect contextual information, the keywords calculated by TF-IDF need to be analyzed for relevance, i.e., Word2vec is used to measure the similarity between words to obtain semantic relationships. Firstly, the expression vector of each keyword is calculated, according to which the spatial distribution of each word can be obtained, and then the related terms of each keyword can be found;
(3) Visualisation of the correlation situation. The correlation analysis can obtain the correlation between individual words but cannot know the spatial relationship of unique words in the overall review. Based on the logical connection between words and relevance, comments can be considered nodes and relevance as relationships. Based on this idea, the relevance of keywords can be visualized through the Neo4j graphical database, which can clearly and intuitively show the classification of the content of user comments and define different themes for each category containing other words according to the variety;
(4) Element relationship analysis. The different themes obtained through the data visualization are considered content elements reflecting the user’s needs, and the interrelationships and hierarchies between the components are explored using the ISM systematic analysis method.
Data acquisition
This experiment is based on Python 3.7, and the data is based on user reviews of milk products on Suning.com official website of Suning.com, and the target data is obtained through a self-written web crawler. Since the target website is a dynamically loaded web page, capturing the page information through the requests module is impossible, so it is necessary to use Selenium to automatically simulate the operation to crawl the HTML tags of the web page (Chen et al., 2021).
In this study, we crawled 60,367 comments from Yili, Mengniu, Junlebao, Gandhi Farm, Huang’s Dairy, Shengmu, Anjia, and Deya milk products on the official website of Suning.com, excluding invalid comments such as default comments, blank comments, and garbled text, and finally obtained 10,273 valid user comments.
Before formal text analysis, the text of the comments needed to be word-separated using jieba word-separation. To achieve more accurate word separation results and subsequent text analysis accuracy, punctuation and useless characters (numbers, tone words, etc.) were deactivated, i.e., these results were word filtered so as not to affect keyword extraction and word relevance analysis. The data for the first 50 user comments are shown in Table 1. The top 50 user comments on the milk product on the Suning.com website, as crawled by the crawler, reveal users’ different attitudes towards the product’s consumption.
| Serial number | Splitting results | Serial number | Splitting results |
|---|---|---|---|
| 1 | The packaging design is atmospheric and the milk flavour is rich and good to taste. One praise! | 26 | I’ve been drinking this brand of milk, children love it, especially convenient |
| 2 | Very fast delivery, children love to drink | 27 | The pro futures at the end of July, the taste is not bad. |
| 3 | Special satisfaction, Suning DS | 28 | Still good, have bought twice |
| 4 | This milk purchase is more cost-effective, before the child also said the taste is good, so decisive purchase | 29 | The milk is very rich and the date is fresh |
| 5 | The milk has been repurchased, drink at ease very good. | 30 | It’s very good, very fast, arrived home fresh, good stuff ah! |
| 6 | The old brand. I’ve been drinking it for a long time. | 31 | Good price, fresh date, very fast logistics |
| 7 | It’s good value for money and worth buying! | 32 | As always, I always drink and buy Amush. |
| 8 | The milk is good, it’s rich and creamy! | 33 | Good good good good good good good good good good good |
| 9 | The original milk with no additives | 34 | The taste is okay, the price is affordable! |
| 10 | I bought it for the New Year’s Day, it’s economical and good for people | 35 | This is still very good, the production date is April 2022. I still feel satisfied with it, it is the original yogurt. The express delivery is also okay, the speed is also still relatively fast, still relatively satisfied, or indeed can, very recommendable to buy, really good it. Still more satisfied |
| 11 | The yogurt tastes very good, ah, the date is also quite fresh, S.F. super power, delivered to the yogurt is also still very fresh, family members are very like, praise praise! | 36 | quite thick, there are activities with coupons to use when more affordable |
| 12 | The banana-flavored yogurt from Gandhi Ranch is mellow and delicate, and the whole family loves it! | 37 | Good milk, will re-purchase many times, praise. |
| 13 | Very good, worth buying, next time continue | 38 | The pure milk is very nutritious and good to drink, children every day a bottle |
| 14 | The kids love to drink it | 39 | The milk was good, heated up and had a milk skin. |
| 15 | It was very fast. It is the same as the supermarket. | 40 | The price is also affordable, praise a! |
| 16 | Sweet milk, tasty and freshly dated | 41 | The old family milk, very like to drink |
| 17 | Cheap and very good ! ! ! ! | 42 | The date is very fresh, the important thing is so cheap |
| 18 | Creamy, smooth and thick, repurchased several times | 43 | Help parents bought directly sent home, parents are very happy old people also need to supplement calcium, we remember to care for children, but also need to care for parents! I didn’t take a picture of the real thing, I took a picture of it, but I still give credit to Suning.com, and the delivery was fast! |
| 19 | Very good! And it’s all sent out S.F. now? | 44 | Very good |
| 20 | Rich flavour, fresh date and easy to shop. | 45 | Drinkable |
| 21 | The goods are good and worth buying! | 46 | Junlebao yogurt, flavorful, fresh date, Suning Yi purchase price is more affordable, delivery on better. |
| 22 | The actual fact is that you can find a lot of people who have been in the marketplace for a long time, and they’ve been in the market for a long time. | 47 | Delicious and creamy! |
| 23 | Good Oh activity is really powerful | 48 | Fresh, flavorful, fresh date, very good service. |
| 24 | The yogurt quality is very good, the date is new, good to drink, the whole family like to drink, praise | 49 | Buy ........................ buy |
| 25 | Our family has always been drinking the Amosi good to drink | 50 | Very awesome, super fast logistics, genuine!!! |
Word frequency analysis
The jieba.analyze.extract_tags () function was used on the splitting results to obtain the keywords in the comment text, with the top K parameter set to 20, indicating that the top 20 keywords with the most significant TF-IDF weight values were returned (Budel et al., 2023), and the results are shown in Table 2. As seen from Table 2, users’ concerns about milk products can be roughly divided into elements, including taste, freshness, logistics and price, which are also user needs for food products. Based on the TF-IDF values in Table 2, the keywords in the results of this word frequency analysis were output as a word cloud diagram (Fig. 2).
| Ranking | Keywords | TF-IDF | Ranking | Keywords | TF-IDF |
|---|---|---|---|---|---|
| 1 | Delicious | 0.3568 | 11 | Price | 0.0775 |
| 2 | Date | 0.2476 | 12 | Full-Bodied | 0.0766 |
| 3 | Flavour | 0.1834 | 13 | Quick | 0.0745 |
| 4 | Fresh | 0.1791 | 14 | Express Delivery | 0.0724 |
| 5 | Mouthfeel | 0.1484 | 15 | Pure Milk | 0.0663 |
| 6 | Affordable | 0.1231 | 16 | Repurchase | 0.0662 |
| 7 | Logistics | 0.1199 | 17 | Many Times | 0.0621 |
| 8 | Packaging | 0.1153 | 18 | Taste | 0.0495 |
| 9 | Shipping | 0.1006 | 19 | Cheap | 0.0487 |
| 10 | Yoghurt | 0.0906 | 20 | Value For Money | 0.0471 |
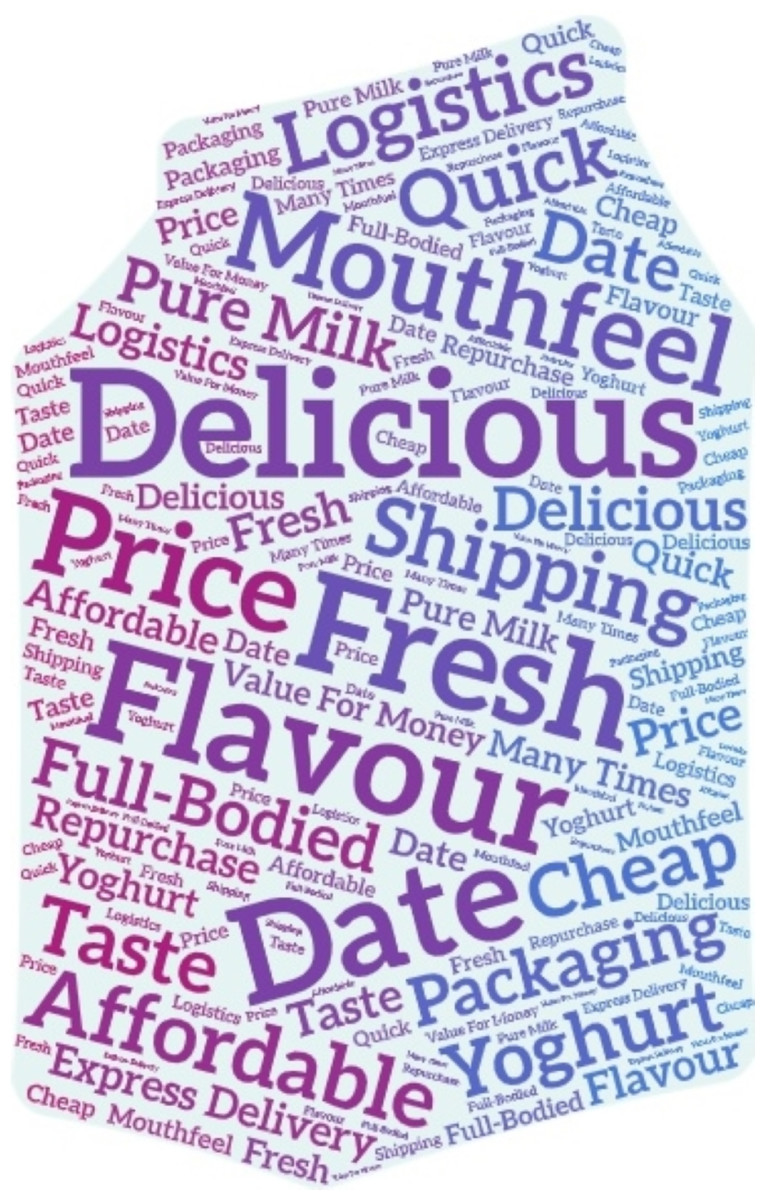
Figure 2: Milk products keyword word cloud.
Clearly shows the frequency of keywords, especially those that appear most frequently in the comments.
The word cloud diagram in Fig. 2 clearly shows the frequency of keywords, especially those that appear most frequently in the comments. For example, “delicious” and “taste” indicate that the main focus of customers on milk products is on the taste of the product itself, while “date” and “fresh” point to the freshness of the product, while “price”, “cheap” and “affordable” point to the price and benefits of the product itself. These are the core content that users are most concerned about, so e-commerce platforms or manufacturers can use the word cloud to dig deeper into users’ demands and ideas and also to give users a general understanding of their products so that they can quickly refine product information before making their own purchasing decisions.
Relevance analysis
To obtain the interrelationships between the keywords, i.e., to get the relevant words for each keyword, Word2vec was used for the relevance analysis. In this section, the Word2vec model is invoked for training, with default values used for most of the model parameters and other parameters set (Table 3).
As shown in Table 4, the word vector of each word shows its position in space, and the phrases most closely related to each keyword can be analyzed according to their distance, i.e., the terms related to each keyword can be calculated from the word vector (Heimerl & Gleicher, 2018).
Table 5 indicates the degree of relationship with the keyword-related words, and the higher the value, the closer the relationship with the word, i.e., closer to the meaning or pointing content of the keyword (Benito-Santos & Sanchez, 2019; Radhakrishnan et al., 2017). The related words for each keyword are shown in it. For example, the associated terms for the keyword good to drink are very fragrant, fragrant, fabulous, indeed, sour, and sweet, where the most relevant observation is very aromatic, reaching 0.7561, indicating that users think milk is good to drink mainly from the fragrance of milk (Fig. 3). To show the relationship situation of all words more visually, the relevance situation of all keywords was visualized by drawing a knowledge graph through Neo4j.
| Parameters | Meaning | Value | Value basis |
|---|---|---|---|
| vector_size | Word vector dimension | 20 | |
| window | Maximum distance allowed between words and predicted words | 2 | The distribution hypothesis proposed by Harris (1954) states that [5], taking values of [1,5] achieves a uniform distribution |
| min_count | Minimum threshold for words | 3 | [0,100] is more reasonable |
| negative | Sample size for negative sampling | 10 | Small-scale data taking [5,20] |
| topn | Output the number of words with the highest relevance to the target word | 5 |
| Keywords | Word vectors | |||||
|---|---|---|---|---|---|---|
| Delicious | [−0.6920 | −0.2668 | 0.1874 | −0.8941 | −0.5032 | −1.2193 |
| 0.7288 | −1.4380 | 0.8745 | −0.7369 | −1.0266 | −1.6656 | |
| −0.3567 | −0.8803 | 1.9274 | −1.3176 | 1.0117 | −0.5044 | |
| 0.8275 | −0.0159] | |||||
| Date | [−1.1384 | −1.5294 | 1.8028 | 2.1135 | −0.6066 | −0.8862 |
| −0.3928 | 0.1051 | −1.4157 | −0.8966 | −0.3170 | −1.6074 | |
| −1.9676 | −1.2788 | 2.3133 | −1.2268 | 0.2742 | 1.2267 | |
| −1.2418 | −0.6370] | |||||
| Flavour | (1.6519) | −1.5223 | 0.7011 | −0.2965 | −0.0714 | −0.4816 |
| 0.2895 | −1.1843 | 0.2961 | −0.6455 | 0.7143 | −3.2508 | |
| 0.0128 | −1.8315 | 1.5518 | −1.8104 | 0.3513 | 0.7882 | |
| 0.3918 | −0.1321] | |||||
| Fresh | [−1.6040 | −2.3627 | 2.3166 | 0.4502 | −0.1624 | −0.2030 |
| 1.1098 | 1.0415 | −0.9931 | −0.3903 | −1.6381 | −1.6145 | |
| −1.4940 | −0.9870 | 1.6570 | −0.6893 | 0.8794 | −0.8505 | |
| −0.1580 | −0.0888] | |||||
| Mouthfeel | [−1.9374 | −2.6161 | 1.1871 | 0.1442 | −0.2308 | 0.2078 |
| 0.3960 | −0.9050 | −0.6053 | −0.9586 | 0.8296 | −2.0282 | |
| 0.2411 | −1.7597 | 1.1260 | −0.9439 | 1.1340 | 0.9714 | |
| 0.5033 | −0.6855] | |||||
| Affordable | (0.9750) | −0.6701 | 0.9544 | 0.6316 | −1.0882 | −1.9741 |
| 2.9998 | 1.6253 | −0.1947 | −2.2018 | 0.7940 | −3.0239 | |
| −0.3342 | −0.1411 | 2.2813 | 0.3486 | 0.7932 | −0.5954 | |
| 1.2828 | −0.8490] | |||||
| Logistics | [−1.2479 | 0.4860 | 0.6396 | 3.9474 | −1.5368 | 0.4153 |
| 0.0849 | 1.9826 | −1.8231 | −1.0963 | 1.4801 | −2.1907 | |
| −0.3132 | −3.1924 | 0.7379 | 0.9645 | −2.1234 | 0.2577 | |
| 0.3876 | −1.0834] | |||||
| Packaging | −2.9240 | −3.4385 | 0.1487 | 0.5023 | −0.5255 | −1.1438 |
| [-0.4577 | 0.0294 | −3.1107 | 0.4715 | 1.3253 | −0.7490 | |
| −1.1457 | −4.2402 | −0.9431 | 0.0352 | −0.3170 | −0.8106 | |
| −0.7209 | −0.4160] | |||||
| Shipping | (1.1172) | −0.0130 | 0.6298 | 3.1526 | −3.0921 | −1.1576 |
| 0.8945 | 1.7930 | −2.4505 | −0.8090 | −0.3847 | −2.2052 | |
| −2.3654 | −4.3214 | 1.3561 | 1.8756 | −0.7713 | 1.4122 | |
| −1.1096 | −1.0064] | |||||
| Yoghurt | [−1.9703 | −1.4077 | 1.0407 | −0.2978 | −0.7383 | 0.2700 |
| −1.7449 | −2.9350 | 0.3295 | 0.2144 | −1.7305 | −1.9597 | |
| −1.8824 | −0.2530 | 0.0531 | −0.6260 | 0.3436 | −0.6049 | |
| 1.4202 | −1.0494] | |||||
| Price | [−2.1319 | −0.4495 | −0.2058 | 0.9452 | 0.1980 | 0.1336 |
| 0.1300 | 1.0743 | −2.5834 | −2.9149 | −1.0999 | −2.4789 | |
| 0.0068 | −0.2607 | 1.5269 | −0.0269 | −0.6963 | 0.9388 | |
| 2.7880 | −2.0117] | |||||
| Full-bodied | [−4.3586 | −2.7024 | 2.3281 | 3.1169 | −1.7908 | −0.2993 |
| 0.3643 | −0.7814 | −3.1217 | 1.1516 | −1.3400 | 0.2899 | |
| 1.1456 | −0.8703 | 2.6749 | −1.5490 | 1.3605 | 0.1313 | |
| 1.0740 | 1.9265] | |||||
| Quick | (0.4304) | −1.5430 | 1.3921 | −0.9669 | 1.0883 | −3.1407 |
| −1.6129 | 0.1777 | −2.1707 | −0.2330 | −0.2973 | −1.0211 | |
| −2.7294 | −2.9387 | 1.3056 | 2.1994 | 0.6401 | −1.2058 | |
| −0.6120 | −0.8508] | |||||
| Express delivery | [−3.0181 | 1.2122 | −0.4015 | 5.5648 | −2.2107 | −0.5137 |
| −1.6255 | 3.3593 | −1.6447 | 0.6221 | −0.5689 | 0.7878 | |
| −0.2562 | −3.0700 | 2.3077 | 0.3203 | −1.9505 | −2.3840 | |
| −1.5368 | −0.6940] | |||||
| Pure milk | [−1.7936 | −2.4432 | −0.5423 | −2.4205 | 2.1436 | 0.7165 |
| −2.9969 | −2.3708 | −0.0059 | −1.7267 | 0.1802 | −0.9618 | |
| 0.1011 | 1.4304 | 2.3570 | −1.1008 | 2.5010 | −2.0630 | |
| 2.8196 | 2.2313] | |||||
| Repurchase | [−5.1592 | 2.6877 | 3.3645 | −1.7283 | 1.0239 | −0.4188 |
| 1.8482 | 0.4781 | 2.5435 | −1.4603 | −0.4948 | 1.2099 | |
| 0.4250 | −2.6295 | 1.5306 | −1.5252 | −0.0393 | 1.9480 | |
| 1.4819 | 0.3295] | |||||
| Many times | (1.0438) | 0.8622 | 3.2431 | −0.1134 | −1.0965 | −0.1818 |
| 2.2224 | −1.7466 | −1.8196 | −1.3382 | −0.4418 | 1.0194 | |
| −3.5827 | −0.1511 | 1.7202 | −1.5122 | 3.0671 | 2.9381 | |
| 0.2620 | 1.1779] | |||||
| Taste | [−2.1463 | −2.8672 | 1.0249 | −1.0585 | 1.2043 | −0.5950 |
| 1.0592 | −3.7165 | 1.0586 | −0.6063 | 0.0896 | −1.8911 | |
| −1.4456 | −2.4598 | 0.2484 | −1.3719 | 1.9736 | −0.3180 | |
| −1.0923 | −1.2686] | |||||
| Cheap | (0.6931) | 0.7872 | −1.2885 | −0.0366 | −1.6105 | −2.2567 |
| 3.6182 | 2.2658 | 1.5676 | −1.8635 | 0.3790 | −2.8954 | |
| −0.4266 | 0.9024 | 3.3743 | 2.6467 | 2.0060 | 0.6304 | |
| 0.4459 | −2.2237] | |||||
| Value for money | [−0.2654 | −1.6181 | 3.1804 | 1.0337 | −0.1359 | 1.7024 |
| 5.5274 | 1.4372 | −3.0442 | −4.8828 | 0.9330 | −1.8727 | |
| 0.9065 | −2.2762 | −1.5181 | −3.6319 | 0.6312 | −0.1488 | |
| −0.1082 | 0.7111] | |||||
| Keywords | Related words | Relevance | Keywords | Related words | Relevance |
|---|---|---|---|---|---|
| Very Fragrant | 0.7561 | Economical | 0.8000 | ||
| Fragrance | 0.7093 | Prices | 0.7076 | ||
| Delicious | Wonderful | 0.6720 | Price | Awesome | 0.6521 |
| Indeed | 0.6691 | Events | 0.6501 | ||
| Sour and sweet | 0.6473 | Product prices | 0.6026 | ||
| Date of production | 0.8633 | Mellow and thick | 0.8239 | ||
| Freshness | 0.6997 | Strong aroma | 0.8040 | ||
| Date | Taste | 0.6962 | Full-Bodied | Pure | 0.7750 |
| Milk quality | 0.6882 | Finesse | 0.7612 | ||
| Shelf life | 0.6773 | Sweet and savory | 0.7452 | ||
| 0.9093 | Quick | 0.8709 | |||
| Mouthfeel | 0.8988 | Ultrafast | 0.8208 | ||
| Flavour | Milk quality | 0.7618 | Quick | In time | 0.7352 |
| Creaminess | 0.7386 | Rapid | 0.7316 | ||
| Delicious | 0.6699 | More Satisfaction | 0.7223 | ||
| Not bad | 0.7005 | Distribution | 0.8405 | ||
| Satisfaction | 0.6858 | Transport | 0.7940 | ||
| Fresh | Date | 0.6675 | Express delivery | Delivery to your door | 0.7922 |
| Strong aroma | 0.6642 | Logistics | 0.7547 | ||
| Pure | 0.6584 | Shipping | 0.7282 | ||
| Flavour | 0.8538 | High in calcium | 0.7809 | ||
| Milk quality | 0.7959 | Softened Milk | 0.7788 | ||
| Mouthfeel | Delicious | 0.7521 | Pure milk | Yoghurt | 0.7056 |
| Taste | 0.7480 | Sour milk | 0.6816 | ||
| Very fragrant | 0.6982 | Suitable for people | 0.6609 | ||
| Offers | 0.8695 | Repeat purchases | 0.8515 | ||
| Affordable | Suitable | 0.7730 | Repurchase | Patronage | 0.7720 |
| Cheap | 0.7636 | Purchase | 0.7617 | ||
| Value for money | 0.6993 | Bought | 0.6332 | ||
| Bargain buy | 0.6793 | Later | 0.5892 | ||
| Distribution | 0.8723 | Second | 0.9120 | ||
| Shipping | 0.8653 | Many a time | 0.7044 | ||
| Speeds | 0.7834 | Numerous times | 0.6978 | ||
| Logistics | Delivery to your door | 0.7787 | Many times | Long-term | 0.6848 |
| Courier | 0.7557 | Regular Clients | 0.6869 | ||
| Milk crate | 0.8296 | Flavour | 0.8709 | ||
| Careful | 0.7115 | Mouthfeel | 0.7276 | ||
| Packaging | Strictly | 0.7115 | Taste | Delicious | 0.6600 |
| Packaging | 0.6766 | Products | 0.6263 | ||
| Serving size | 0.6696 | Very fragrant | 0.6276 | ||
| Transport | 0.8612 | Offers | 0.7974 | ||
| Logistics | 0.8594 | Value for money | 0.7478 | ||
| Shipping | Distribution | 0.8316 | Cheap | Affordable | 0.7373 |
| Delivery | 0.7999 | Coupons | 0.6617 | ||
| Delivery to your door | 0.7449 | Events | 0.6479 | ||
| Milk | 0.7573 | Nutritional value | 0.7656 | ||
| Pure milk | 0.7120 | Calcium milk | 0.6794 | ||
| Yoghurt | Sour milk | 0.6958 | Value for money | Nutritional composition | 0.6688 |
| Authentic | 0.6879 | Contains calcium | 0.6517 | ||
| Products | 0.6700 | Content | 0.6404 |
According to Table 6, classification of the results of the relevance analysis of user comments. Based on the results of the keyword relevance analysis in Fig. 3, it can be seen that the user comments on the items are divided into eight sections.
Analysis of influencing factors
By analyzing Table 6, it can be seen that Category 3 and Category 5 both described content in terms of logistics and express delivery and, therefore, could be classified into one category; while Category 4 and Category 7 both referred to the situation where consumers trusted the shop and thus returned to it repeatedly, and therefore could also be classified into one category. The above analysis was combined, and Table 6 was rearranged to finally organize the user review content into six categories and group the categories into different themes based on the range of the keywords included (Gonalves et al., 2023), with the complete results shown in Table 7. The six subject terms collated as the six elements of user comments are analysed by the ISM explanatory structural model to investigate the influence between the elements.
As shown in Table 8, drawing on the findings of Stan et al. (2010) and others, the following can be specified: freshness of taste and discounted prices offer both influence customer repurchase, while customer repurchase, logistics and product packaging all influence discounted prices of the product. In addition, discounted price and product packaging affect logistics, freshness of taste directly affects nutritional composition. this shows the adjacency matrix of the model, the initial input matrix, abstracted from the relationships between the elements.
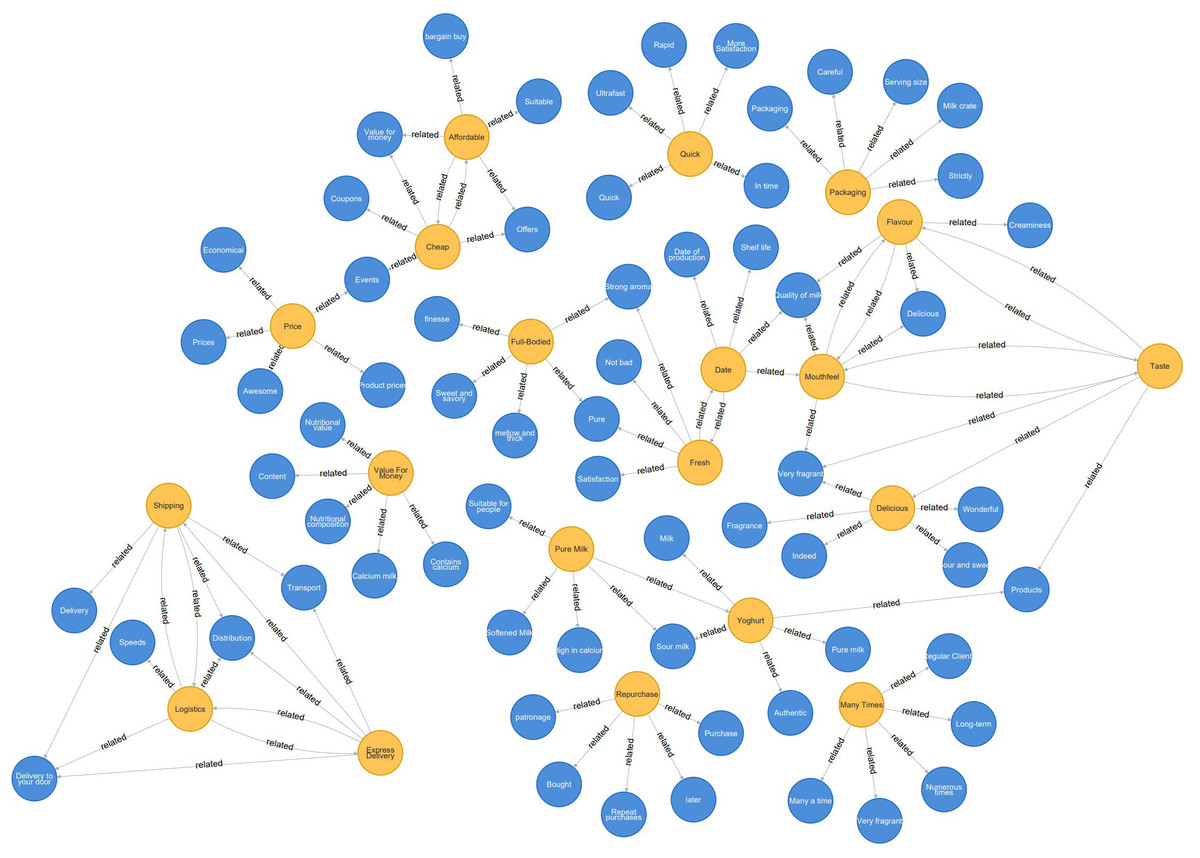
Figure 3: Milk product keyword relevancy analysis.
To show the relationship situation of all words more visually, the relevance situation of all keywords was visualized by drawing a knowledge graph through Neo4j.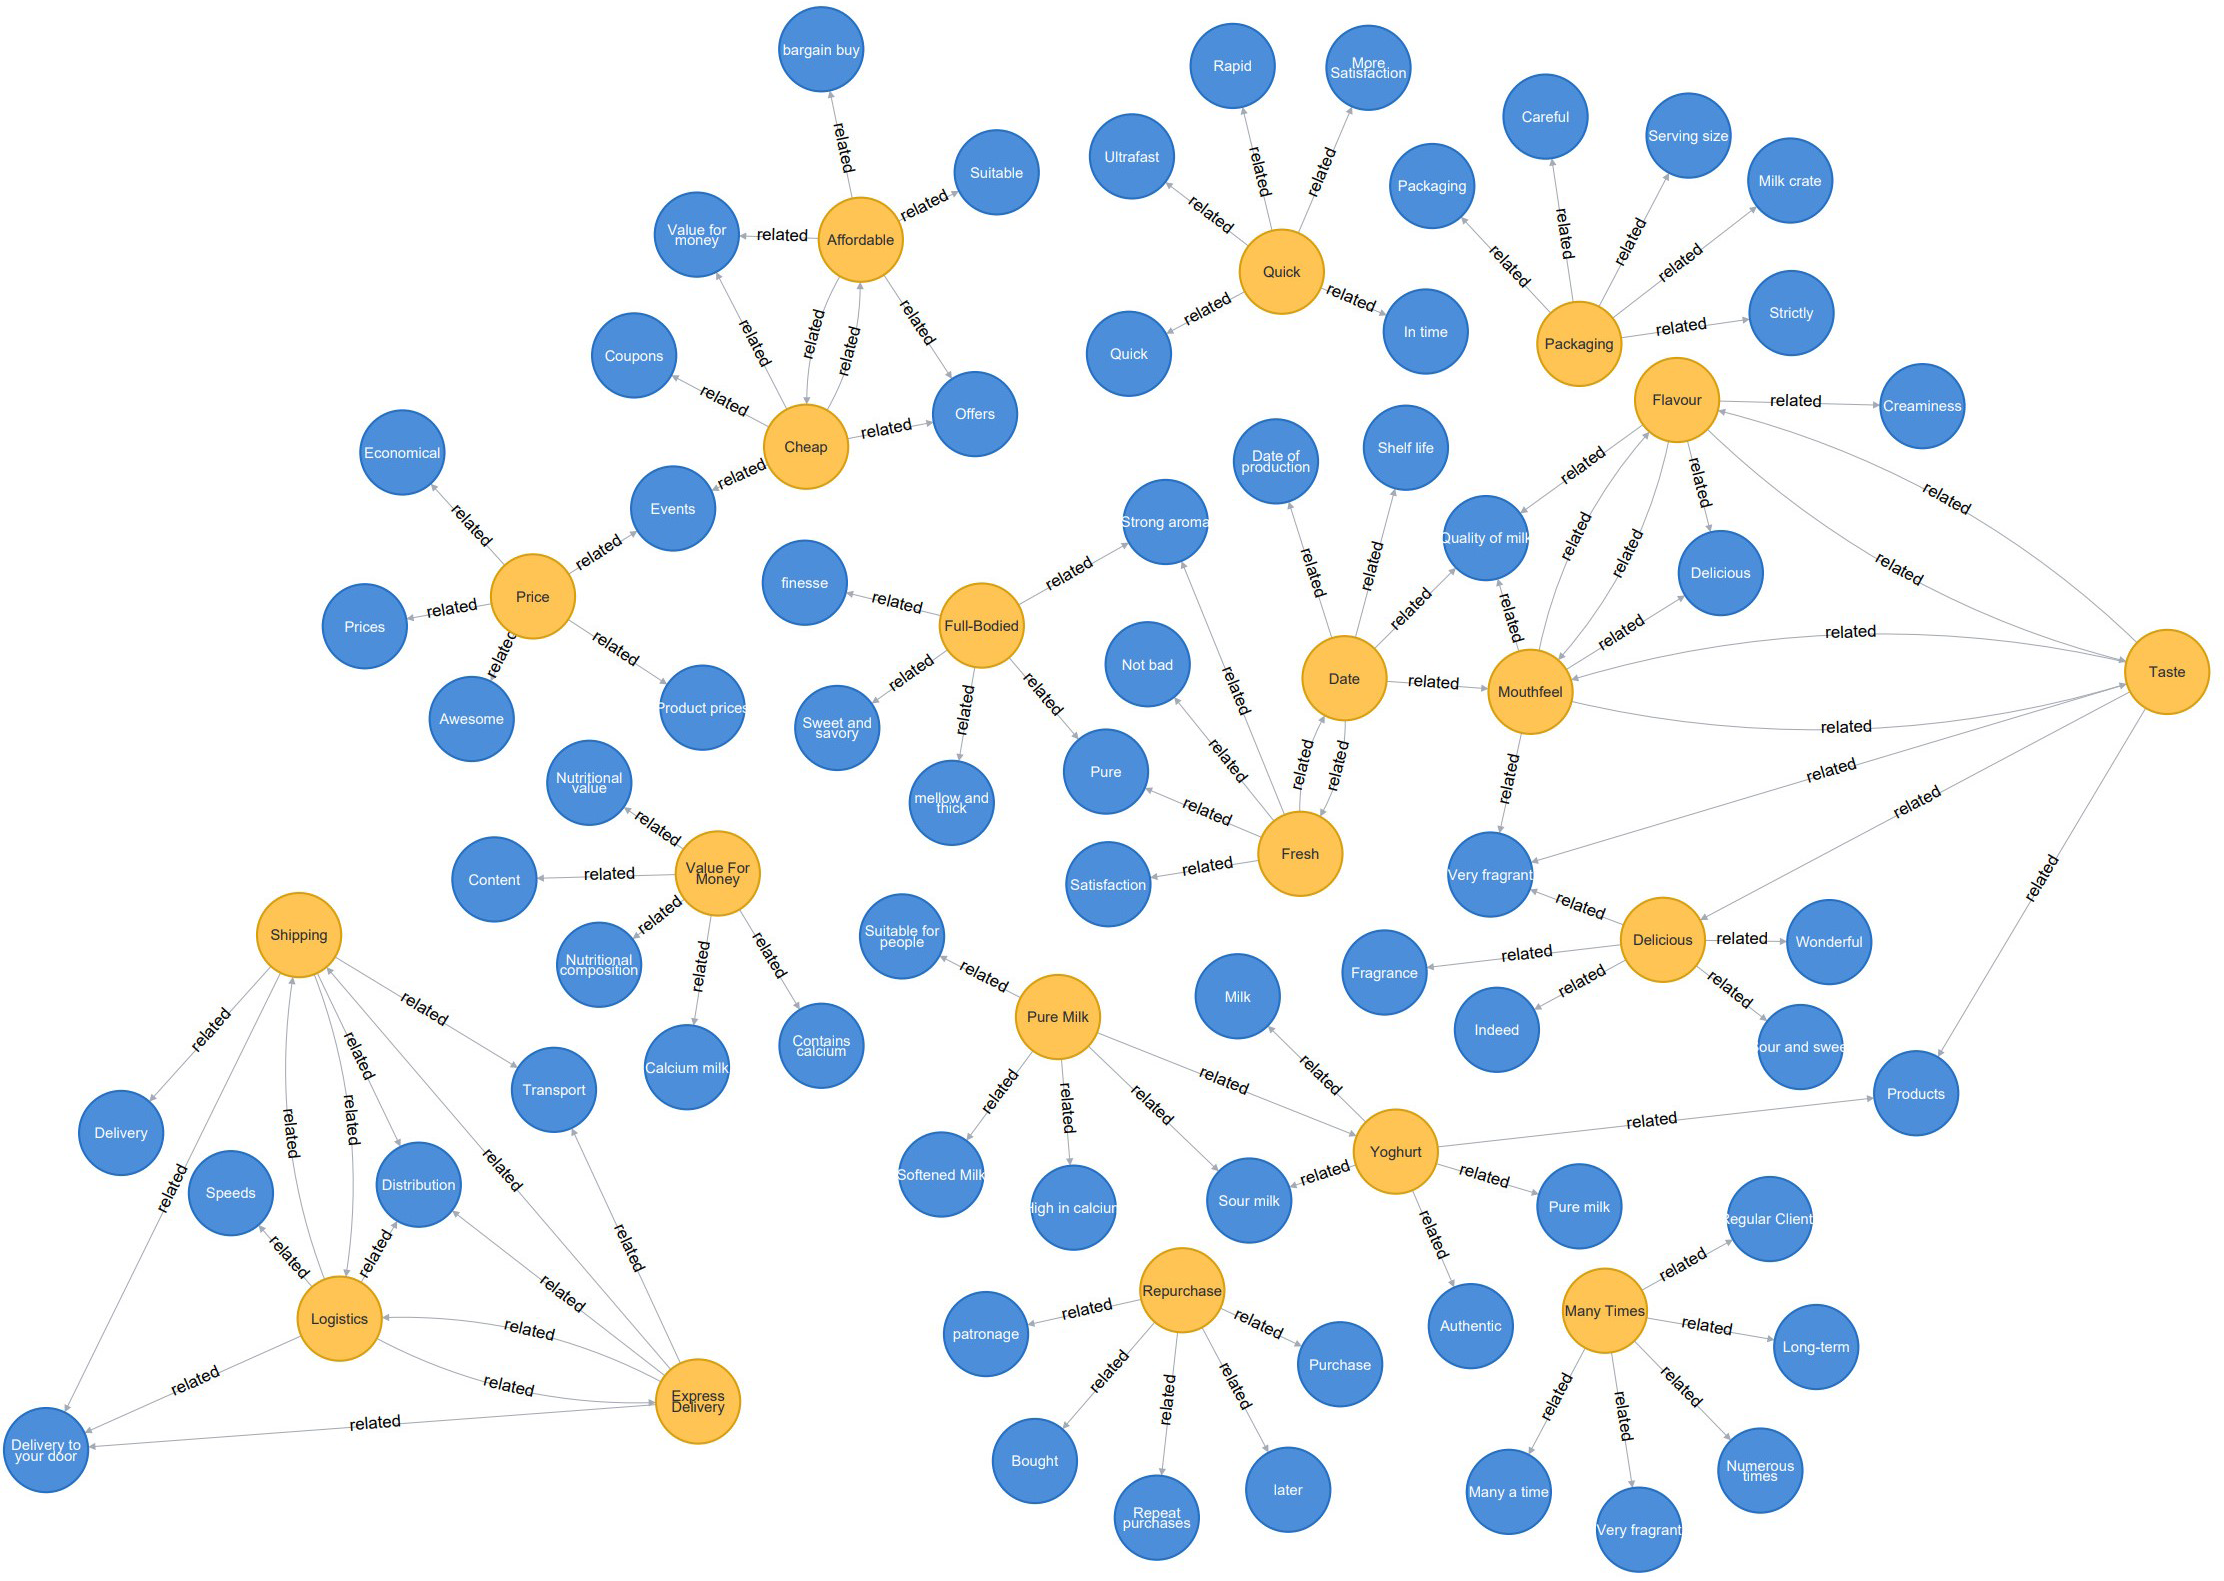
| Category | Contains words |
|---|---|
| 1 | Pure Milk, Softened Milk, Suitable for People, High Calcium, Sour Milk, Pure Milk, Authentic, Yogurt, Product, Delicious, Great, Very Fragrant, Taste, Sweet and Sour, Fragrant, Indeed, Taste, Milk Carton, Milk Quality, Delicious, Date, Shelf Life, Production Date, Satisfied, Fresh, Good, Strong, Pure, Mellow, Delicate, Rich, Sweet And Delicious |
| 2 | Affordable, Cheap, Good Value, Suitable, Discount, Bargain, Item Price, Event, Price, Coupon, Economy, Awesome, Price |
| 3 | Logistics, Express, Speed, Home Delivery, Delivery, Distribution, Delivery, Dispatch |
| 4 | Many Times, Long Term, Regular Customer, Many Times, Second Time, Countless Times |
| 5 | Very Fast, Quick, Prompt, Superfast, More Than Satisfactory, Prompt |
| 6 | Packaging, Tight, Careful, Portions, Boxes, Milk Cartons |
| 7 | Repurchase, Buy, Bought, Repurchase, Future, Patronage |
| 8 | Value For Money, Nutritional Composition, Content, Calcium Milk, Nutritional Value, Calcium Content |
| Category | Contains words | Topics |
|---|---|---|
| 1 | Pure Milk, Softened Milk, Suitable for People, High Calcium, Sour Milk, Pure Milk, Authentic, Yogurt, Product, Delicious, Great, Very Fragrant, Taste, Sweet and Sour, Fragrant, Indeed, Taste, Milk Carton, Milk Quality, Delicious, Date, Shelf Life, Production Date, Satisfied, Fresh, Good, Strong, Pure, Mellow, Delicate, Rich, Sweet and Delicious | Freshness of taste |
| 2 | Affordable, Cheap, Good Value, Suitable, Discount, Bargain, Item Price, Event, Price, Coupon, Economy, Awesome, Price | Discounted prices |
| 3 | Logistics, Express, Speed, Home Delivery, Delivery, Distribution, Delivery, Shipping, Very Fast, Quick, Timely, Superfast, More Than Satisfactory, Rapid | Logistics |
| 4 | Many Times, Long Term, Regular Customer, Many Times, Second Time, Countless Times, Repurchase, Buy, Bought, Repurchase, Future, Patronage | Customer Repurchase |
| 5 | Packaging, Tight, Careful, Portions, Boxes, Milk Cartons | Product Packaging |
| 6 | Value For Money, Nutritional Composition, Content, Calcium Milk, Nutritional Value, Calcium Content | Nutritional composition |
| Key elements | Freshness of taste | Discounted prices | Logistics | Customer repurchase | Product packaging | Nutritional composition |
|---|---|---|---|---|---|---|
| Freshness of taste | 0 | 1 | 0 | 1 | 0 | 1 |
| Discounted prices | 0 | 0 | 1 | 1 | 0 | 0 |
| Logistics | 0 | 0 | 0 | 1 | 0 | 0 |
| Customer repurchase | 0 | 1 | 0 | 0 | 0 | 0 |
| Product packaging | 0 | 1 | 1 | 0 | 0 | 0 |
| Nutritional composition | 0 | 0 | 0 | 1 | 0 | 0 |
According to Table 9, the adjacency matrix multiplication of the model, which is an intermediate computational procedure to obtain the reachable matrix by successively multiplying the adjacency multiplication matrix until the matrix does not change (Mallick, Chaudhari & Joshi, 2022).
| Key elements | Freshness of taste | Discounted prices | Logistics | Customer repurchase | Product packaging | Nutritional composition |
|---|---|---|---|---|---|---|
| Freshness of taste | 0 | 1 | 0 | 1 | 0 | 1 |
| Discounted prices | 0 | 0 | 1 | 1 | 0 | 0 |
| Logistics | 0 | 0 | 0 | 1 | 0 | 0 |
| Customer repurchase | 0 | 1 | 0 | 0 | 0 | 0 |
| Product packaging | 0 | 1 | 1 | 0 | 0 | 0 |
| Nutritional composition | 0 | 0 | 0 | 1 | 0 | 0 |
As shown in Table 10, with the adjacency matrix representing the direct relationship between elements and the accessibility matrix representing whether the transmission between elements leads to an indirect influence relationship.
| Key elements | Freshness of taste | Discounted prices | Logistics | Customer repurchase | Product packaging | Nutritional composition |
|---|---|---|---|---|---|---|
| Freshness of taste | 0 | 1 | 0 | 1 | 0 | 1 |
| Discounted prices | 0 | 0 | 1 | 1 | 0 | 0 |
| Logistics | 0 | 0 | 0 | 1 | 0 | 0 |
| Customer repurchase | 0 | 1 | 0 | 0 | 0 | 0 |
| Product packaging | 0 | 1 | 1 | 0 | 0 | 0 |
| Nutritional composition | 0 | 0 | 0 | 1 | 0 | 0 |
Table 11 shows the hierarchical decomposition process of the model. At each extraction, if the intersection of the reachable and reachable sets with the initial stage is the same, the element set can be extracted for hierarchical decomposition (Fernandes, Simsek & Kantarci, 2021). Table 12 shows the hierarchy of models, where the top level is the system’s ultimate goal, while the following levels are the reasons for the upper levels respectively.
| Results after 1st draw | |||
|---|---|---|---|
| Key elements | Accessible collection | Reachable sets and prior sets | |
| Freshness of taste | Freshness of Taste, Discounted Prices, Logistics Customer Repurchase, Nutritional Composition | Freshness of Taste | |
| Discounted prices | Discounted Prices, Logistics, Customer Repurchase | Discounted Prices, Logistics, Customer Repurchase | |
| Logistics | Discounted Prices, Logistics, Customer Repurchase | Discounted Prices, Logistics, Customer Repurchase | |
| Customer repurchase | Discounted Prices, Logistics, Customer Repurchase | Discounted Prices, Logistics, Customer Repurchase | |
| Product packaging | Discounted Prices, Logistics, Customer Repurchase, Product Packaging | Product packaging | |
| Nutritional composition | Discounted Prices, Logistics, Customer Repurchase, Nutritional Composition | Nutritional Composition | |
| Results after the 2nd draw | |||
| Key elements | Accessible collection | Reachable sets and prior sets | |
| Freshness of taste | Freshness of Taste | Freshness of Taste | |
| Product packaging | Product Packaging | Product Packaging | |
| Nutritional composition | Nutritional Composition | Nutritional Composition | |
| Results after 3rd draw | |||
| Key elements | Accessible collection | Reachable sets and prior sets | |
| Freshness of taste | Freshness of taste | Freshness of taste | |
| Levels | Key elements |
|---|---|
| Level 1 | Discounted Prices, Logistics, Customer Repurchase |
| Level 2 | Product Packaging, Nutritional Composition |
| Level 3 | Freshness of Taste |
A directed connectivity diagram based on the results of the hierarchy can show the scale of the model more visually (Fig. 4).
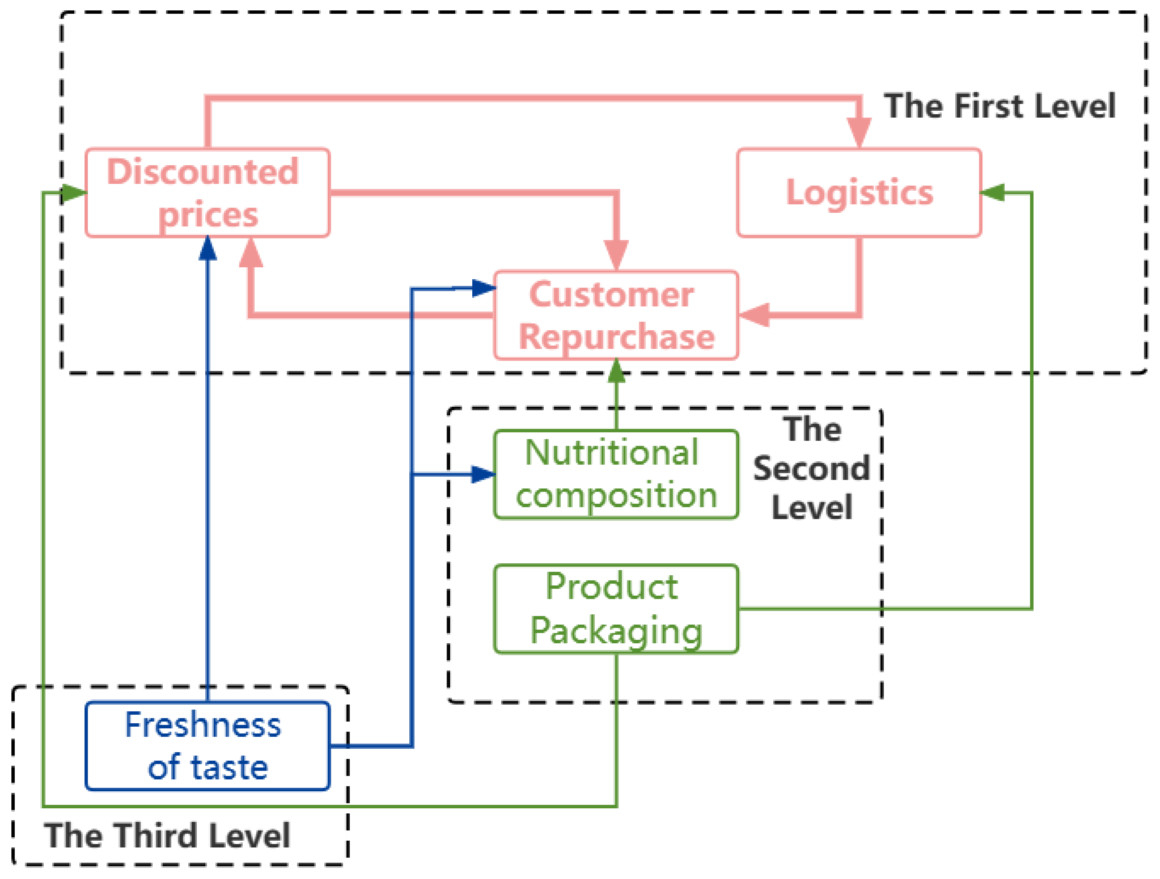
Figure 4: Hierarchy diagram.
A directed connectivity diagram based on the results of the hierarchy can show the scale of the model more visually.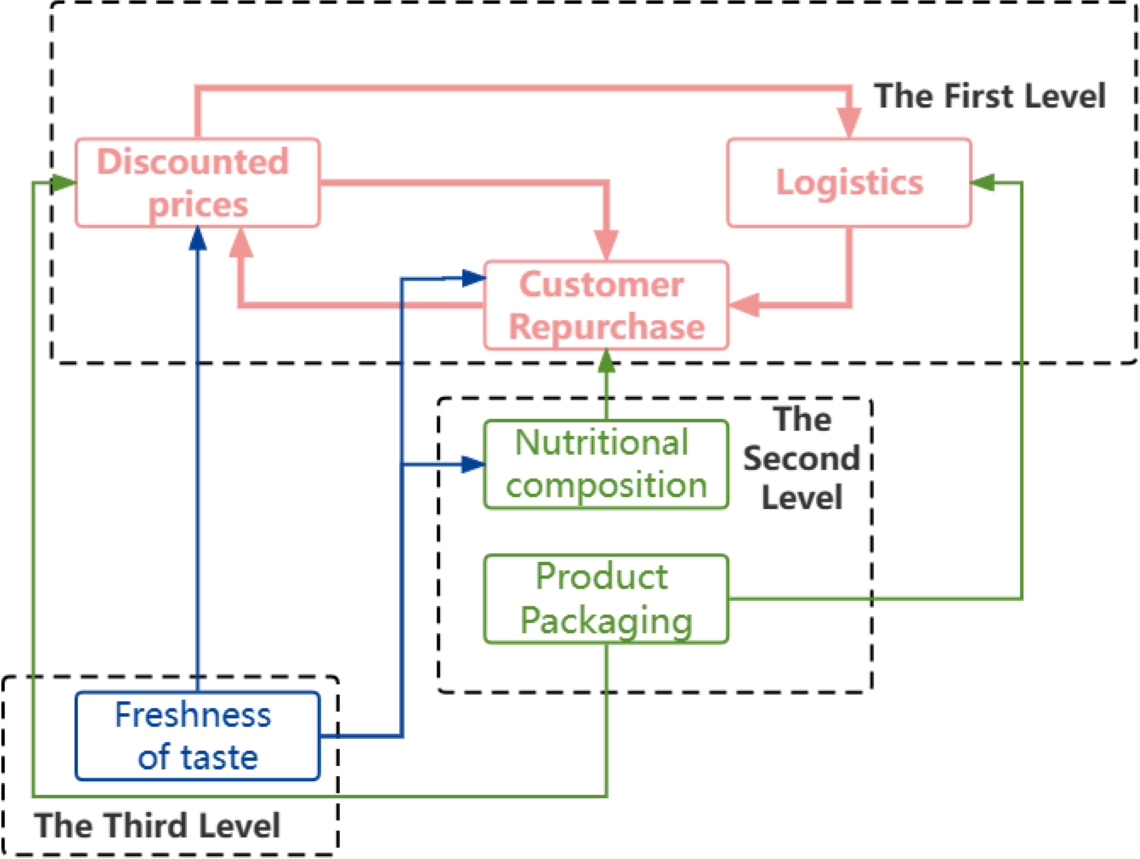
User review results analysis and route optimisation
Analysis of results
By analyzing the user reviews of milk products on Suning.com, the data were mined, analyzed, and comprehensively evaluated through three methods, TF-IDF, Word2vec, and ISM, in turn. The above three methods could drill a large amount of characteristic information, interrelationships, and the influence between each element from the user reviews, thus e-commerce platforms, producers, and other system management inspiration and decision-making advice (Bhatt & Kankanhalli, 2011).
(1) Through the overall analysis of user reviews, its main content revolves around six elements of milk products: freshness of taste, discounted prices, logistics, customer repurchase, product packaging, nutritional composition;
(2) TF-IDF was able to dig out the words that appeared more frequently in the user reviews. In the word frequency ranking, “delicious” and “date” occupy the top positions in word frequency. In the top 10 rankings, keywords related to taste and texture ranked 1st, 3rd, and 5th, respectively. In contrast, keywords related to freshness ranked 2nd and 4th, respectively, indicating that users focus on the taste and freshness of the milk product. In addition, the 7th and 9th rankings are for “logistics” and “shipping”, indicating that users are particularly concerned about the logistics of the product, in addition to the taste and freshness of the product;
(3) Word2vec can analyze the related words of each keyword to obtain the connection between each word. For example, “date” is related to “freshness”, “shelf life“, “date of production” and so on. “price” is similar to “prices”, “event”, and “economical”;
(4) The knowledge graph drawn by Neo4j can visualize the relevance of each word, visually display the connection between all comments, and categorize the overall content of user reviews into specific categories according to the classification, defining different topics according to the class. For example, words such as “delicious”, “milk quality”, “taste” and their related words point to taste the freshness, “regular clients”, “repurchase”, and “long-term”, and their associated terms point to customer repurchase;
(5) ISM can analyze the interplay between the elements. In tier 3 elements, taste freshness affects discounted prices, customer repurchase, and nutritional composition; in tier 2 elements, product packaging affects discounted prices, and logistics, nutritional composition affects customer repurchase; in tier 1 elements, discounted prices and customer repurchase affect each other and logistics, while price offer involves logistics and logistics express affects customer repurchase. Since milk is a nutritious food that can be consumed directly, the results of this study can be applied to other beverages, fruits and vegetables, and other foods. For manufacturers, the results can be used to improve their products, such as strictly controlling the packaging and paying attention to the degree of freshness of the food, etc. For consumers, it is important to pay attention to the time to consume the products in time to prevent them from exceeding the shelf-life.
Path optimisation
According to the hierarchy diagram in Fig. 4, the elements of layers 3 and 2 points to the producers, while the aspects of layer one end to the e-commerce platform, i.e., the e-commerce platform is the core of the entire hierarchy. Also, it serves as a bridge between the producers and consumers, whose goal is to attract consumers and promote product sales by providing convenient shopping channels and an engaging shopping experience. The smooth operation of an e-commerce platform depends on its operational strategy and the quality of the products supplied by producers (Kolay, 2015).
For producers, ensuring the freshness of their dairy products means adopting appropriate production and storage methods to ensure that products remain fresh and of high-quality during transport and distribution and that hygiene standards and quality requirements are met at all stages. At the same time, producers should ensure that milk products have an excellent nutritional composition and meet the health needs of consumers by adding essential elements and other nutrients to the ingredients following scientific formulation requirements to provide consumers with a balanced choice of products. In addition, manufacturers should also focus on product packaging design. Good packaging not only attracts consumers’ attention and communicates the quality and value of the product to them but also provides the necessary protection to ensure that the product is not damaged during transportation and delivery.
When upstream producers can deliver high-quality products, downstream e-commerce platforms can develop appropriate and sensible marketing strategies to attract purchases and repeat purchases. For example, e-commerce platforms can highlight a product’s freshness and nutritional value and increase its exposure and appeal by showcasing its benefits and detailed descriptions. In addition, e-commerce platforms can promote sustained purchase behavior by actively collecting user feedback and reviews to improve product quality and service and continuously increase user satisfaction.
There is an interdependent relationship between the e-commerce platform and the manufacturer. The manufacturer’s provision of high-quality products is a prerequisite for the smooth operation of the e-commerce platform. In contrast, the effective marketing strategy of the e-commerce platform can facilitate the sale of the manufacturer’s products and user repurchases. Through close cooperation and continuous product quality improvement, both parties have jointly promoted the successful operation of milk products on the e-commerce channel.
Conclusion
In this study, based on the Word2Vec model, the semantic relationship between words is measured in terms of the cosine similarity between word vectors by employing the transformation of words in user comment texts into vectors. Specifically, the word vectors generated by Word2Vec characterize the semantic similarity between words by characterizing them in a multi-dimensional space, and these vectors not only reflect the frequency of occurrence of words, but also reveal their semantic associations in the context. To avoid the interference caused by different word vector lengths, the word vectors will be normalized (i.e., the modulus of the vectors is normalized to unit vectors), to more accurately measure the relative distance between words. This method effectively captures the semantic relationships implied in user comments, providing a more in-depth basis for product optimization and user demand analysis.
However, there are still some limitations in this paper: on the one hand, the research sample only involves user comments on milk products, and user concerns on other categories of products need to be further analyzed; on the other hand, the data source is limited to the Suning eBay Platform, and it does not cover comments on other e-commerce platforms such as Taobao and Jingdong. Therefore, the analysis of user comments on multiple platforms and categories will be a key direction for subsequent research. In addition, future research should further introduce and compare other embedding methods (Pouli et al., 2015), such as transformer-based embedding models (e.g., BERT), to more comprehensively explore the deep semantic relationships in user reviews. This will help assess the applicability and advantages of different embedding methods in user comment analysis and provide a stronger theoretical basis for the selection of text mining techniques.
Supplemental Information
Raw Data
We crawled the data of Erie, Mengniu, Junlebao, Ganti Farm, Huang’s Dairy, Shengmu, Anjia, Deya and other brands of milk products in the official website of Suning E-shopping, and crawled a total of 60,367 pieces of data, removing the system’s default comments, blank comments, garbled text and other invalid comments, and finally obtaining the effective The total number of data crawled is 60,367. Before the formal text analysis, it is necessary to use the jieba participle for the participle processing of the comment text. In order to achieve more accurate segmentation results and the accuracy of the subsequent text analysis, the punctuation marks and useless characters (numbers, intonation, etc.) are deactivated, i.e., the results are filtered by words, so as not to affect the extraction of keywords and the analysis of word relevance.