
Tab transformer with meta-ensemble learning approaches for enhanced diabetes prediction
- Published
- Accepted
- Received
- Academic Editor
- Fabio Cumbo
- Subject Areas
- Algorithms and Analysis of Algorithms, Artificial Intelligence, Data Mining and Machine Learning, Data Science
- Keywords
- Diabetes prediction, Machine learning, Hyperparameter tuning, SMOTE, Ensemble learning, Stacking, Tab transformer
- Copyright
- © 2025 Khalid et al.
- Licence
- This is an open access article distributed under the terms of the Creative Commons Attribution License, which permits unrestricted use, distribution, reproduction and adaptation in any medium and for any purpose provided that it is properly attributed. For attribution, the original author(s), title, publication source (PeerJ Computer Science) and either DOI or URL of the article must be cited.
- Cite this article
- 2025. Tab transformer with meta-ensemble learning approaches for enhanced diabetes prediction. PeerJ Computer Science 11:e3206 https://doi.org/10.7717/peerj-cs.3206
Abstract
Diabetes represents a significant metabolic disorder marked by elevated glucose levels due to suboptimal insulin production or function. Early diagnosis and effective diabetes management are crucial to reducing related health complications. This study introduces a robust approach for predicting diabetes through advanced machine learning methods. Utilizing the diabetes dataset from the University of California Irvine (UCI) machine learning repository, we performed extensive preprocessing to guarantee data quality and integrity. To counteract class imbalance, we employed the synthetic minority over-sampling technique, which improved the representation of minority classes. We explored several machine learning (ML) models, including Random Forest (RF), logistic regression (LR), and K-nearest neighbors (KNN), while optimizing hyperparameters through grid search and randomized search techniques. Additionally, we introduced a stacking ensemble method paired with a tab transformer model, effectively harnessing the advantages of both techniques for efficient handling of tabular data. The outcomes from the stacking and tab transformer models were later aggregated using a meta learner, specifically extreme gradient boosting (XGBoost), to create a robust ensemble model. Our comprehensive methodology yielded an impressive accuracy rate of 99%, significantly outperforming individual models. Unlike previous studies that rely solely on individual models, our approach fills the gap by combining deep learning with ensemble methods to enhance generalization and interpretability in diabetes prediction. We have validated the model’s performance using ablation studies and paired statistical significance tests. These results highlight the efficacy of integrating diverse ML strategies to enhance both the accuracy and reliability of diabetes prediction.
Introduction
Diabetes mellitus encompasses a spectrum of metabolic disorders that are defined by significantly elevated blood glucose concentrations. This condition results from either insufficient insulin production or inadequate cellular responses to insulin (Sneha & Gangil, 2019). The research methodology involves the analysis of extensive patient datasets utilizing data-driven techniques. Key variables incorporated into the analysis include age, body mass index (BMI), blood pressure, glucose levels, number of pregnancies, skinfold thickness, insulin concentrations, and diabetes pedigree function. Through the application of machine learning (ML) algorithms, patterns and correlations within the data are discerned, enabling the prediction of diabetes likelihood in the individuals assessed. Evidence suggests that the prevalence of diabetes among adults aged 18 years and older has increased from 4.7% in 1980 to 8.5% in 2014, demonstrating a pronounced upward trend in both developing and developed nations (Collaboration, 2010).
Diabetes is primarily categorized into two types: Type 1 and Type 2. Type 1 diabetes typically affects individuals under the age of 30. The clinical manifestations of diabetes include increased thirst and elevated blood sugar levels (Shah et al., 2020). Individuals over the age of 30 are increasingly susceptible to Type 2 diabetes, which is associated with clinical indicators such as overweight, hypertension, dyslipidemia, atherosclerosis, and various other health complications. The management of Type 2 diabetes often requires insulin injections in conjunction with other medications (Halpern et al., 2010; Chaudhury et al., 2017). There are nearly 40 identified forms of diabetes mellitus, and public awareness concerning diabetes remains low due to insufficient resources within the healthcare system (Aguirre et al., 2013). Type 1 is a prevalent form of diabetes that depends on insulin and other medications. It typically manifests during childhood (Kaur & Sharma, 2018). In contrast, Type 2 diabetes can affect individuals of all ages and is not reliant on insulin; instead, it is significantly influenced by lifestyle factors, making it a common type of diabetes (Ganie & Malik, 2022). In diabetes, there is an elevation in blood sugar levels. Insulin, a hormone secreted by the pancreas, regulates the utilization of glucose from ingested food, facilitating its entry into the bloodstream. A deficiency in insulin contributes to the development of diabetes (Pandeeswari, Rajeswari & Phill, 2015).
The prevalence of diabetes affects over half a billion individuals and continues to increase daily. Approximately 175 million cases remain undiagnosed. Furthermore, 21 million women experience elevated glucose levels during pregnancy (Sarwar et al., 2020). When the human body ingests carbohydrates, starchy foods, sugary foods, fruits, milk, and certain dairy products, these substances are digested in the stomach and converted into simple sugars, which are essential for the body’s energy production. Although the human body can detect increases in blood glucose levels, excessive carbohydrate intake leads to a heightened release of insulin, which provides energy to the body. However, individuals suffering from diabetes may not produce sufficient insulin to meet their needs (Olokoba, Obateru & Olokoba, 2012).
Hyperglycemia is a significant medical condition for which prompt diagnosis and accurate treatment are essential. Various ML techniques, including transformer models, have been employed to enhance diabetes prediction and address these needs. Recent research has explored the potential of ML in improving both the effectiveness and accuracy of diabetes prediction, thereby supporting early diagnosis and efficient treatment planning. In recent years, numerous methods have been developed and published for diabetes prediction. One such approach is detailed by Doğru, Buyrukoğlu & Arı (2023), where a super learner was implemented, incorporating four fundamental algorithms: logistic regression (LR), decision tree (DT), Random Forest (RF), and gradient boosting. Additionally, a support vector machine was utilized as the meta-learner, employing diverse dimensions and cross-validation strategies. This ML model underwent thorough evaluation for optimal feature selection utilizing the chi-square method across five distinct techniques. Hyperparameter tuning was conducted through grid search to achieve optimal results in the detection of hyperglycemia. The model has demonstrated effectiveness in identifying the early stages of diabetes mellitus. Nevertheless, the application of this ML model to the detection of diabetes mellitus presents several considerable challenges. Key limitations include restricted data access, missing data, and the presence of irrelevant data. These complications detrimentally affect the model’s performance and hinder our capacity to devise innovative techniques (Abnoosian, Farnoosh & Behzadi, 2023).
While progress in machine learning has improved diabetes prediction, most existing methods rely on limited model diversity and fail to exploit deep learning architectures tailored for tabular data. Prior studies predominantly use shallow or conventional models, lacking hybrid frameworks capable of capturing both linear and non-linear dependencies effectively. In this study, we propose a novel hybrid ensemble that integrates a tab transformer based model with a classical stacking ensemble, optimized to capture complex feature interdependencies in tabular datasets. The probabilistic outputs from these models are fused and passed to a meta-level extreme gradient boosting (XGBoost) learner. This architecture not only enhances generalization and interpretability but also delivers superior predictive performance and robustness, addressing a critical gap in high-fidelity diabetes prediction systems.
This research advances the field of diabetes prediction by integrating multiple ML methods to enhance model performance and accuracy. We implemented rigorous data preprocessing techniques and utilized the Synthetic Minority Over-sampling Technique (SMOTE) to address the class imbalance, thereby creating a dataset that facilitates improved learning outcomes. We conducted a comparative analysis of various models, including RF, logistic regression (LR) and K-nearest neighbor (KNN), while performing hyperparameter tuning. Additionally, we employed stacking and innovatively applied a tab transformer, which significantly enhanced the predictive capabilities of the ensemble model. Ultimately, our approach demonstrates the effectiveness of combining diverse methodologies and provides a comprehensive framework for improving the accuracy of diabetes prediction.
Research questions and objectives
This work aims to address the research questions derived from its objectives:
How do various ML algorithms, including LR, RF, and KNN, perform in predicting diabetes when refined through hyperparameter tuning techniques such as Grid Search and Randomized Search?
In what ways does the application of advanced hyperparameter tuning impact the prediction accuracy of different ML models for diabetes?
How does the performance of the tab transformer model compare with that of manually tuned models?
Which ML model, evaluated using metrics such as recall, F1-score, accuracy, precision, and receiver operating characteristic area under the curve (ROC-AUC), demonstrates the highest accuracy and optimal performance for diabetes prediction, taking into account the preprocessing methods and optimization strategies employed?
Research contributions
The key contributions of our research are summarized as follows:
We developed a comprehensive prediction pipeline that includes preprocessing steps such as calculating summary statistics, normalizing data, and utilizing a Standard Scaler.
We compared various ML classifiers with ensemble learning techniques, specifically KNN, RF, and LR, to predict diabetes.
We employed grid search and randomized search methods to improve hyperparameter tuning, thereby enhancing the performance of the majority of algorithms.
The application of the tab transformer has significantly improved the accuracy of diabetes predictions by effectively capturing complex feature interactions in tabular data through self-attention mechanisms.
We introduced a novel integration of the tab transformer and stacking with the ensemble meta-learner XGBoost, which resulted in improved performance for identifying top performers and increased accuracy in diabetes prediction.
The study is structured as follows: First, it presents a comprehensive overview of diabetes, followed by an analysis of the pertinent literature. Then, the methodology section details the proposed methodology. In the Results and Discussions section, the findings are articulated along with a critical discussion. Finally, the Conclusion and Future Directions section summarizes the conclusions drawn from the research and outlines potential avenues for future research.
Related work
A comprehensive review of diabetes mellitus highlights it as a significant global health issue affecting millions of individuals worldwide. The onset of diabetes is influenced by various factors, including lifestyle, genetic predispositions, and a lack of awareness (Abnoosian, Farnoosh & Behzadi, 2023). Research utilizing the Iraqi Patient Dataset for Diabetes (IPDD) has demonstrated the effectiveness of ensemble learning techniques combined with thorough data preprocessing and approaches to managing missing values for diabetes prediction. Additionally, another study (Yadav & Pal, 2021) employed ensemble methods alongside rule-based classification algorithms, such as OneR, JRIP, and Decision Table, to examine a dataset sourced from the UCI repository. Banfield et al. (2006) compare various ensemble methods for DT creation, including RF, bagging, boosting, and random subspaces. Through statistical testing on 57 datasets, the findings indicated that while some methods achieve marginally higher accuracy than bagging, bagging remains a strong contender in the accuracy domain.
Gupta & Goel (2023) demonstrated that preprocessing techniques enhance ML prediction performance in diabetic classification. The results of the RF classifier achieved the highest accuracy at 88.61%, accompanied by an F1-score of 75.68%. Their findings underscore the importance of addressing the missing value problem in datasets to ensure model fidelity. This research lays the groundwork for utilizing larger datasets and improved algorithms to enhance diagnostic accuracy in diabetes prediction. Additionally, the study by Aguilera-Venegas (2023) compares various ML algorithms for modeling type 2 diabetes mellitus (T2DM). The results were awe-inspiring, especially for the RF algorithm, which achieved an accuracy of 92.91%, followed by decision tree at 89.74%, neural networks at 85.40%, and KNN, which demonstrated lower performance. Another promising case-based method utilizes expert-generated rules in a tiered model abstraction, preceded by a preprocessing loop to ascertain which attributes are relevant to predictive modeling based on historical diagnostic data. However, several critical issues remain unaddressed, including the generalizability of findings derived from a single Spanish cohort, insufficient detail regarding 18 variables and the selection criteria employed, and a notable absence of discussion concerning model interpretability, particularly pertinent for advanced algorithms such as neural networks. These factors could significantly impact the generalizability and applicability of the results in diverse clinical settings.
The study’s findings (Ulutas, Günay & Sahin, 2024) indicate that the application of ensemble learning significantly enhances the accuracy of diabetes diagnosis. The highest reported accuracy was 98.10% using an RF classifier. The hybrid particle swarm optimization and gray wolf optimization (PSO-GWO) method employed for hyperparameter tuning ensured optimal performance of the models, addressing the limitations identified in previous research that developed suboptimal models due to inadequate optimization and overdependence on specific classifiers. The current study integrates multiple classifiers and ensemble methods, improving individuals’ accuracy, precision, recall, and F1-scores. This signifies a robust model for the early detection of diabetes. Furthermore, this article (Hasan et al., 2020) concentrates on constructing an ML model for diabetes prediction based on the Pima Indian Diabetes Dataset. Various classifiers, including KNN, DT, and ensemble methods, were evaluated to achieve the highest area under the curve (AUC) of 0.950, demonstrating an effective capability to distinguish between diabetic and non-diabetic patients. This advancement provides a reliable model for future predictions based on new datasets regarding the diabetic status of patients. These findings underscore that the proposed approach enhances prediction performance, suggesting a promising direction for the early detection of diabetes.
The findings of two studies (Olisah, Smith & Smith, 2022; Abnoosian, Farnoosh & Behzadi, 2023) reaffirm the significance of employing ML models for diabetes prediction. The research demonstrates the implementation of techniques such as feature selection and missing value imputation, utilizing advanced deep neural network (DNN) architectures to enhance predictive performance. Notable metrics, including precision, recall, and F1-scores, have been achieved, with models exhibiting accuracies of up to 98.6% for multi-layer perceptron (MLP) and approximately 93% for the two-layer generalized decision directed neural network (2GDNN). This underscores the necessity of data preprocessing and further studies to validate this methodology, particularly due to its limitations in diabetes diagnosis predictability. Zhou, Myrzashova & Zheng (2020) introduce a deep learning model for diabetes prediction, which achieves accuracies of 94.02% on the diabetic type dataset and 99.41% on the Pima Indians dataset during the training phase. Furthermore, it improves performance by employing dropout in hidden layers and utilizing binary cross-entropy as the loss function. However, the model does face potential drawbacks, including the risk of overfitting due to hyperparameter tuning, along with a need for enhanced predictions regarding diabetes complications and the management of diverse data types.
Two studies (Prasanth, Banujan & Btgs, 2021; Jenitta, Swetha Rani & Manasa, 2023) were employed for predicting diabetes mellitus utilizing various ML algorithms. The first study implemented artificial neural network (ANN), RF, and K-Means clustering, achieving accuracies of 75.7%, 74.7%, and 73.6%, respectively. However, it indicated that the application of ensemble methods would yield superior results. The second study utilized hyperparameter tuning with algorithms such as LR, DT, XGBoost, support vector machine (SVM), and KNN, discovering that KNN with random search produced the highest accuracy, surpassing other measures in both precision and recall. Overall, both studies demonstrate that ensemble methods and hyperparameter optimization are of considerable importance in enhancing the accuracy of diabetes prediction.
In a recent study (Tran, Choi & Byeon, 2024), the application of stacking ensemble to predict diabetes in a men group with the utilization of a Feature Tokenizer Transformer (FT-Transformer) and standard machine learning models such as Random Forest and XGBoost is studied in this article. The model suggested above showed the best performance measures, such as an accuracy level of 0.8786 and an AUC of 0.8618, which implies that the idea of applying deep learning and ensemble methods can be successful. Maniruzzaman et al. (2020) systematize current knowledge on the impact of psychological interventions on glycemic control in middle-aged and older patients with type 2 diabetes using an extensive and specific search of the literature in different databases and rigorous selection of randomized controlled studies. The independent evaluators involved in data extraction and quality assessment found that their results with RevMan 5.4 software showed that the benefit of such interventions to glycosylated haemoglobin (HbA1c) values was significant despite moderate overall study quality.
A recent study (Zou et al., 2018) investigates the application of ML techniques for predicting diabetes mellitus. The study utilized DT, RF, and neural network algorithms on data collected from physical examinations at hospitals in Luzhou, China. The results indicated that the random forest algorithm achieved the highest accuracy, reaching 80%. Another investigation (Singh & Singh, 2020) introduces a stacking-based multi-objective evolutionary ensemble model for predicting diabetes mellitus. The NSGA-II-Stacking model highlighted in this research demonstrated improved accuracy and sensitivity compared to conventional models, suggesting its potential to enhance the scientific diagnosis of diabetes. Additionally, Kumari, Kumar & Mittal (2021) proposed a soft voting classifier that integrates LR, naive Bayes, and Random Forest ML techniques using the Pima Indian Diabetes dataset. This ensemble method outperformed other ML approaches in terms of accuracy, precision, recall, and F1-score. This alternative model may surpass newer methods in effectiveness for disease prediction.
In contrast, the work cited in Sarwar et al. (2020) presents a diabetes diagnosis system that utilizes an ensemble approach for the identification of type-II diabetes. This robust system facilitates the initial screening of individuals affected by this condition, and the results demonstrate that the ensemble technique achieves an accuracy rate of 97.34%. Furthermore, the study introduces a hybrid ensemble technique that surpasses the performance of individual models, proving effective in the primary-level screening of diabetes.
Conversely, the research referenced in Wang et al. (2019) employs various ML techniques for the diagnosis and categorization of diabetes. The accuracy of these methods ranges from 75.9% to 84.7%, utilizing diverse combinations of techniques, including attribute-weighted artificial immune systems, ANN, SVM, and KNN. This investigation addresses critical challenges such as missing data and class imbalances within medical datasets, highlighting the essential role of securing an accurate early diagnosis of diabetes (Althobaiti, Althobaiti & Selim, 2024). Successful treatment significantly relies on this.
The proposed model is demonstrated to outperform existing models based on metrics such as the area under the receiver operating characteristic curve (AUC-ROC), sensitivity, specificity, and overall accuracy, which play a vital role in clinical decision-making. Additionally, it serves as an informative resource, enhancing understanding of diabetes-related disorders. A detailed analysis of the performance of state-of-the-art approaches from the literature is provided in Table 1.
| Ref | Year | Dataset | Methods used |
|---|---|---|---|
| Hasan et al. (2020) | 2020 | Pima Indian Diabetes Dataset | k-NN, DT, Ensemble Methods |
| Abnoosian, Farnoosh & Behzadi (2023) | 2023 | Iraqi Patient Dataset for Diabetes (IPDD) | Ensemble Learning, Data Preprocessing, Missing Value Handling |
| Yadav & Pal (2021) | 2021 | UCI Repository | Ensemble Methods, Rule-Based Classification (OneR, JRIP, Decision Table) |
| Kumari, Kumar & Mittal (2021) | 2021 | PIMA Indian Diabetes Dataset | Soft Voting (LR, Naive Bayes, RF) |
| Zou et al. (2018) | 2018 | Hospital Physical Inspections (Luzhou, China) | Decision Tree, Random Tree, Neural Network |
Materials and Methods
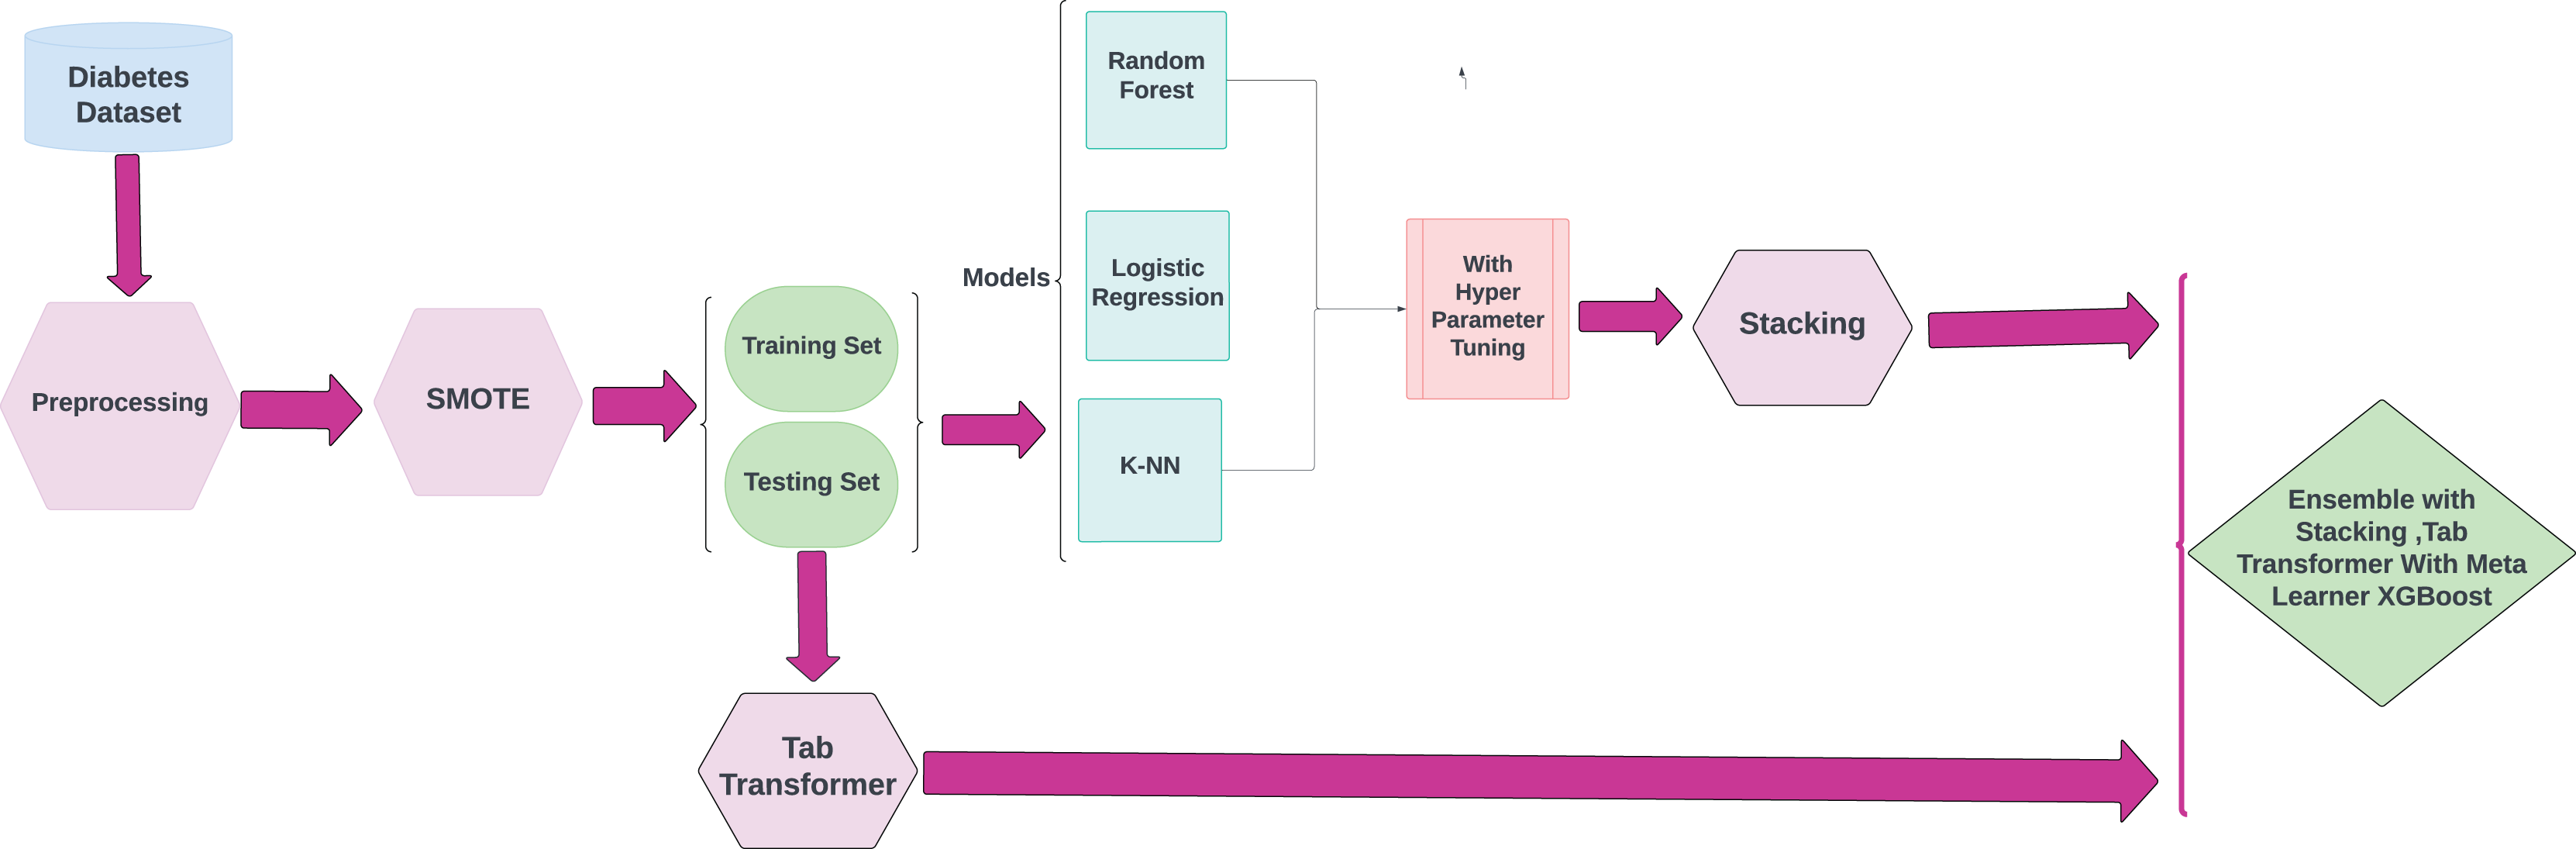
This research highlights the utilization of ML techniques for the early detection and diagnosis of chronic diseases, with a specific emphasis on diabetes. The objective of this approach is to improve disease management and treatment strategies, which may help reduce the severe complications frequently associated with these conditions. The methodological framework for the proposed research is illustrated in Fig. 1.
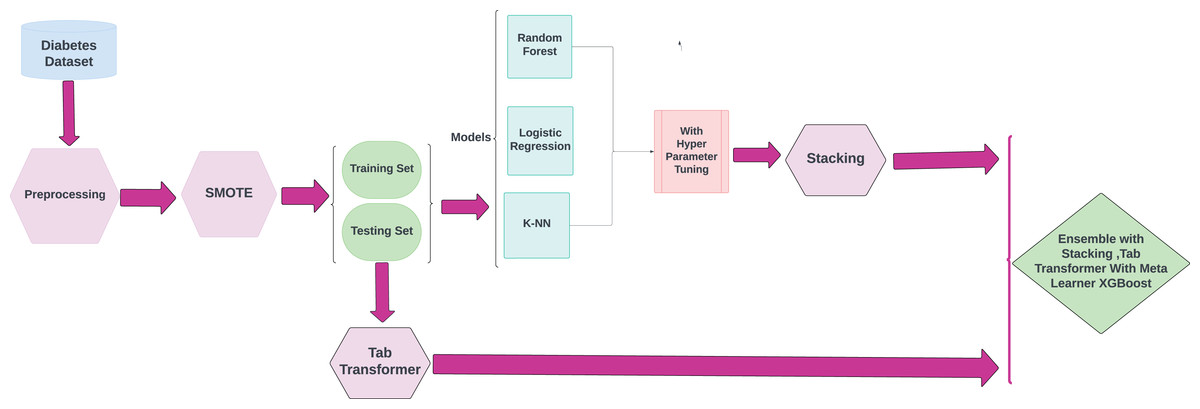
Figure 1: Methodology workflow diagram analysis for targeted research.
Diabetes dataset
In this research, we utilized the dataset from the UCI ML Repository and collaborated with Kaggle (Smith et al., 2024). The dataset comprises data on 768 diabetic patients, aged above 21 years, of eight medical variables that are pertinent in the diagnosis of diabetes. We selected the diabetes dataset as our primary source due to its comprehensive and well-structured nature. Each data point encompasses eight attributes, detailed as follows:
Pregnancies: Number of times the patient has been pregnant.
Glucose: Plasma glucose concentration after 2 h in an oral glucose tolerance test.
Blood Pressure: Diastolic blood pressure (mm Hg).
Skin Thickness: Triceps skinfold thickness (mm), used as a proxy for subcutaneous fat.
Insulin: 2-h serum insulin (mu U/ml).
BMI: Body mass index, calculated as weight in kg divided by height in m2.
Diabetes Pedigree Function: A function that scores the likelihood of diabetes based on family history.
Age: Patient age in years.
Outcome: A binary variable (0 = Non-diabetic, 1 = Diabetic).
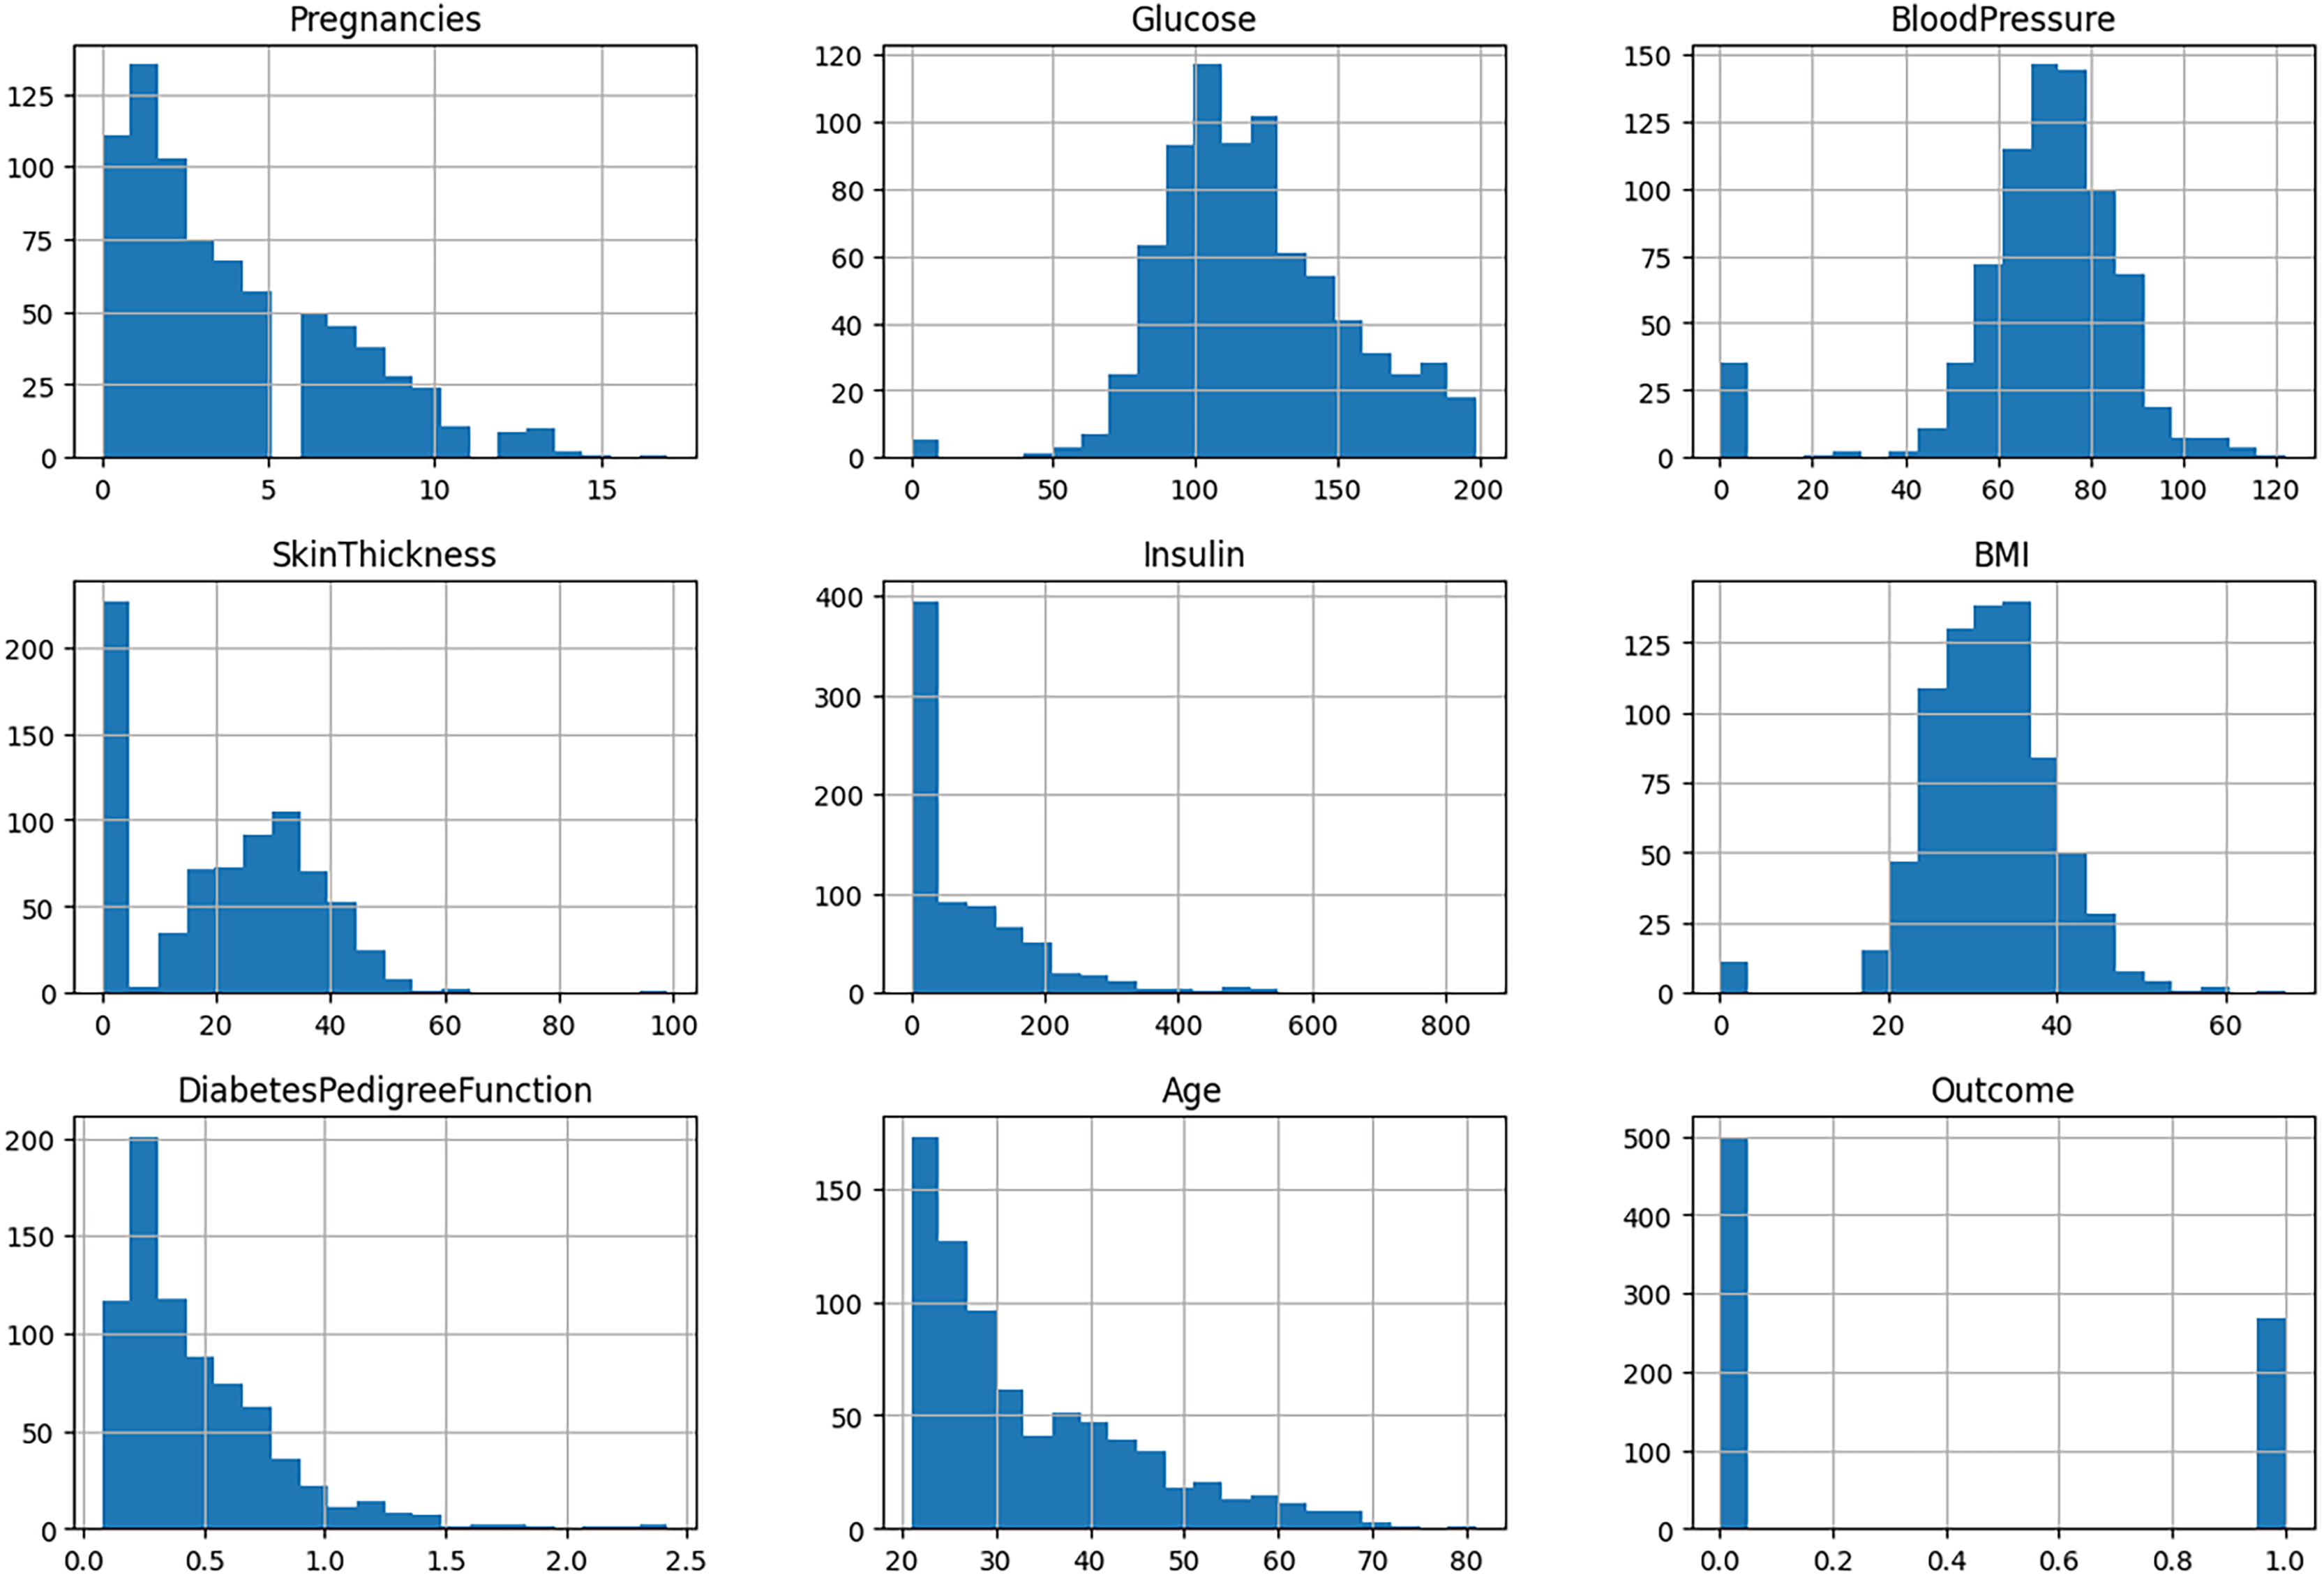
The ninth attribute of each data point is the outcome variable, which may take on one of two values: “Normal” or “Diabetes.” This dataset provides a robust foundation for the development and evaluation of an ML model, enhancing predictive capabilities and yielding valuable insights into the disease. The specifics of the attributes are detailed in Table 2. The histogram of features is depicted in Fig. 2.
| No | Attribute | Representation |
|---|---|---|
| 1 | Age | Numeric (integer) |
| 2 | BMI | Numeric (float) |
| 3 | Blood pressure | Numeric (integer) |
| 4 | Glucose | Numeric (integer) |
| 5 | Pregnancies | Numeric (integer) |
| 6 | Skin thickness | Numeric (integer) |
| 7 | Diabetes pedigree function | Numeric (float) |
| 8 | Insulin level | Numeric (integer) |
| 9 | Output | Numeric (integer) |
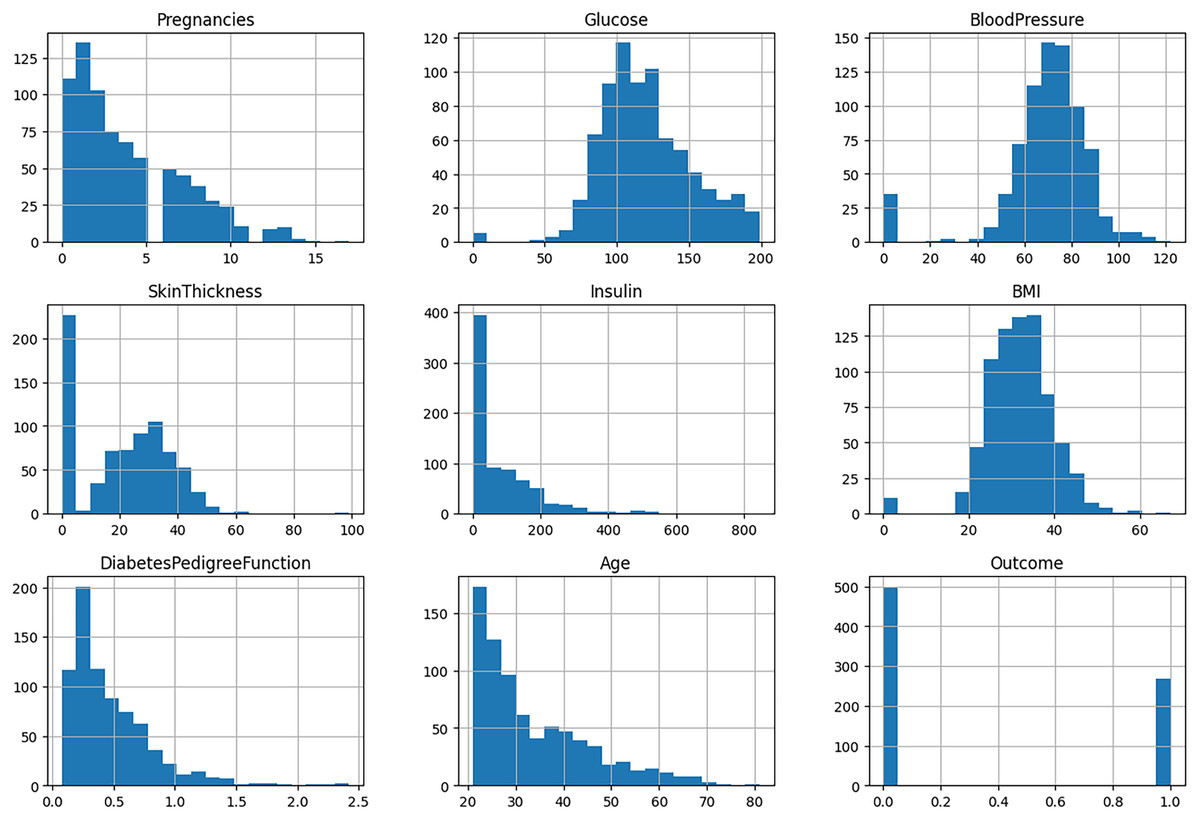
Figure 2: Histogram of features.
Ethical considerations
Since this data is publicly available, anonymized and does not require any special permissions to view, there is also no need to seek ethical approval or special permissive to use it in the academic setting. There is no personally identifiable information on it, and it is in line with the ethical requirements of the use of secondary information.
Data preprocessing
Data preprocessing, which encompasses data cleansing, the management of missing values, feature scaling, and class balancing, is a crucial phase in ensuring both the quality and reliability of a dataset, ultimately enhancing model performance. The dataset employed in this study is devoid of missing values, thus permitting direct data standardization and ensuring that all features are weighted equally during the model training process. Standardization serves to prevent any individual feature from exerting an undue influence on the results, which could otherwise compromise model performance. These preprocessing procedures are fundamental in preparing the data for subsequent modeling and analysis. Feature scaling is specifically implemented for numerical attributes such as age, BMI, and blood pressure to guarantee that all features contribute equally during the model training. This study employed standardization techniques to normalize the values of these features.
Data standardization and feature scaling
During preprocessing, no outlier removal was found in the dataset. Standardization was used to normalize all features before training the model to make every numerical aspect help the model. One of them is the following. In this process, features are transformed to a normal statistical distribution with a mean of 0 and standard deviation of 1, computationally achieved by the Z-score normalization formula. Standardization helps avoid bias in learning due to varying feature scales, particularly for models sensitive to distance metrics such as KNN and SVM. Features such as age, BMI, and blood pressure were normalized using this approach with the scikit-learn standard scale. This step ensures uniform feature weighting, stabilizes gradient descent during training, and contributes to faster model convergence.
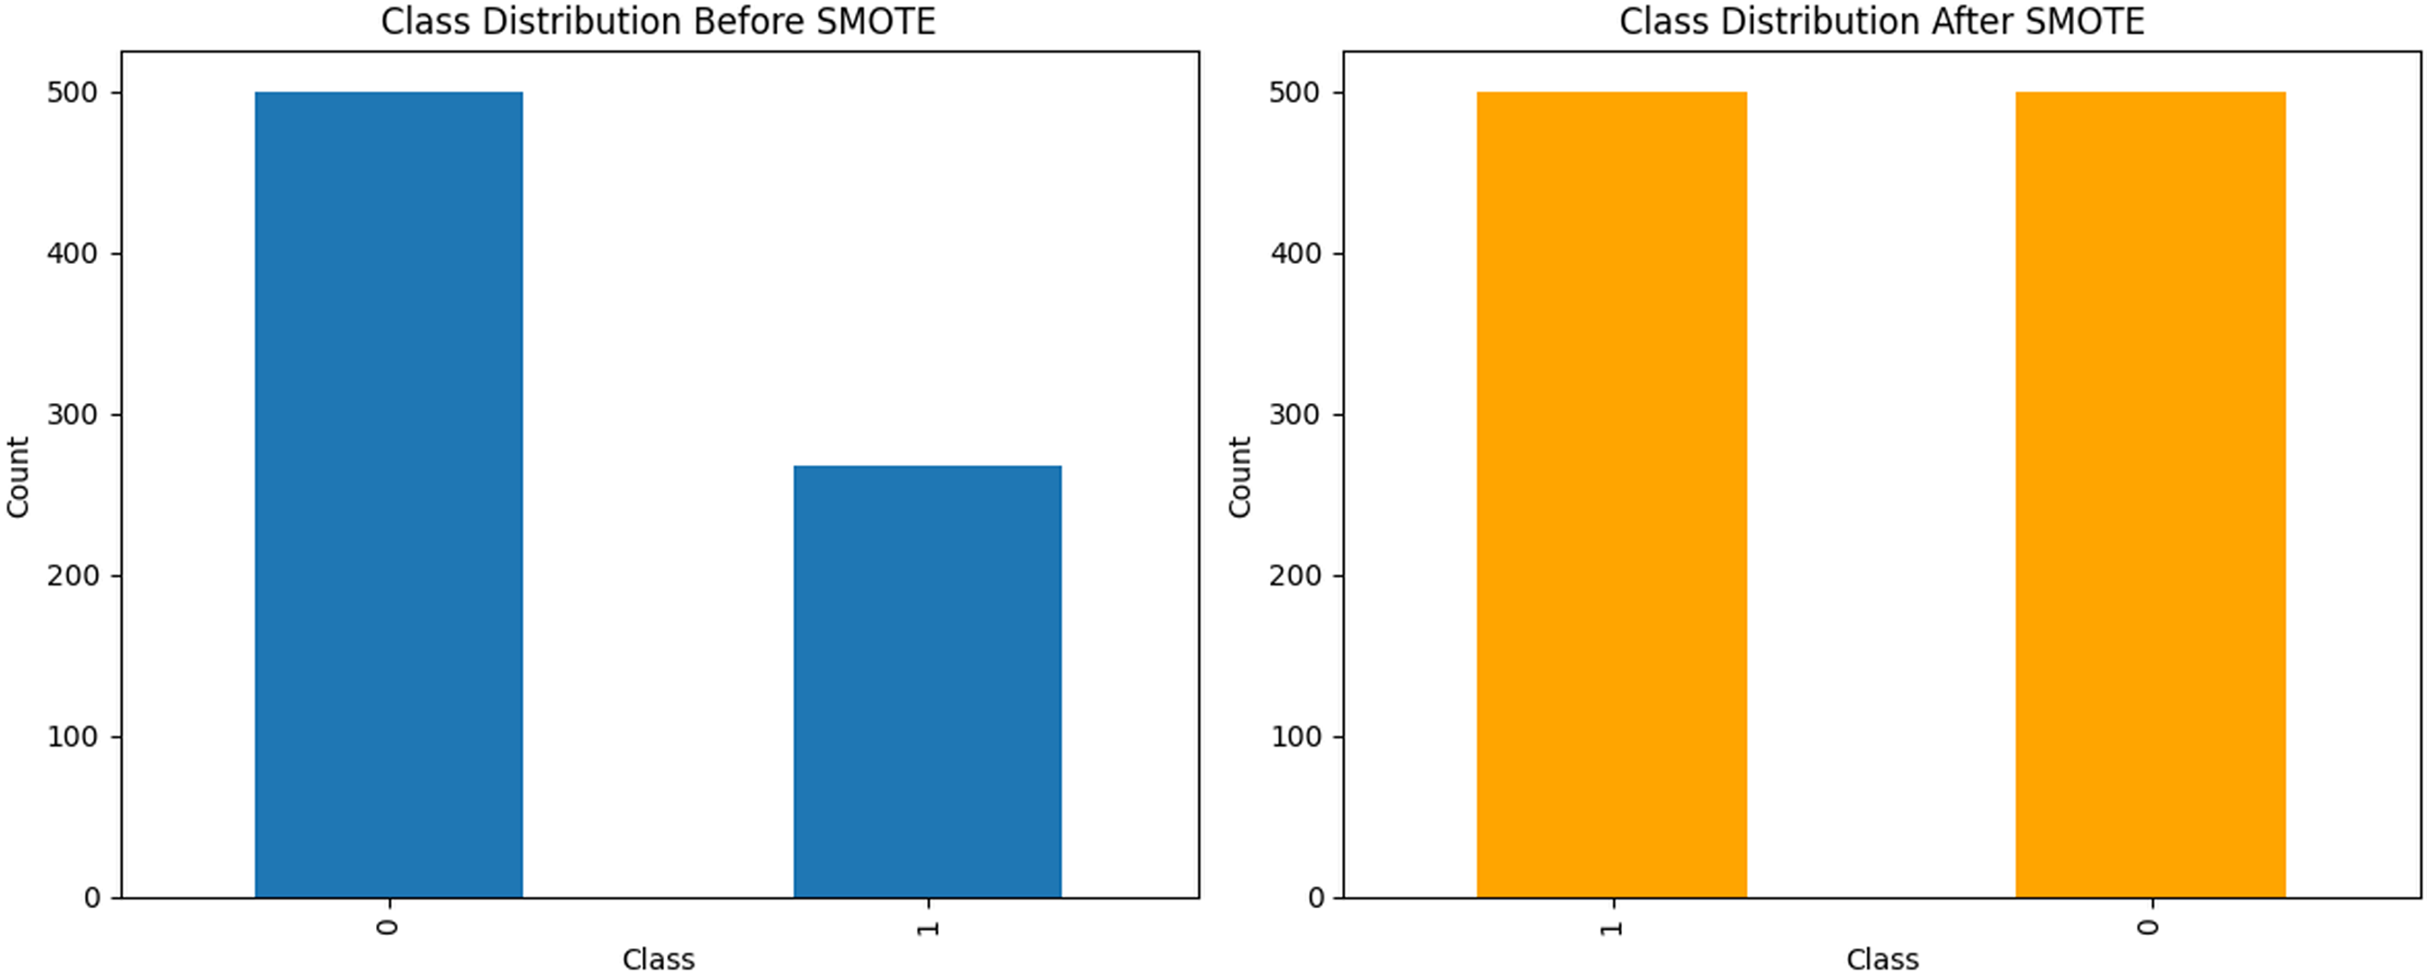
Handling imbalanced data with SMOTE
A prevalent challenge in ML is managing imbalanced datasets in which certain classes are significantly underrepresented. Such an imbalance can result in biased models that exhibit suboptimal performance in minority classes. To mitigate this issue, we employed the SMOTE to generate synthetic samples for the less represented categories. This enhancement improved the balance of the dataset, thereby facilitating more effective model training. The resultant dataset following the application of SMOTE is illustrated in Fig. 3.

Figure 3: The data analysis before and after balancing by SMOTE.
Exploratory data analysis
Correlation attribute
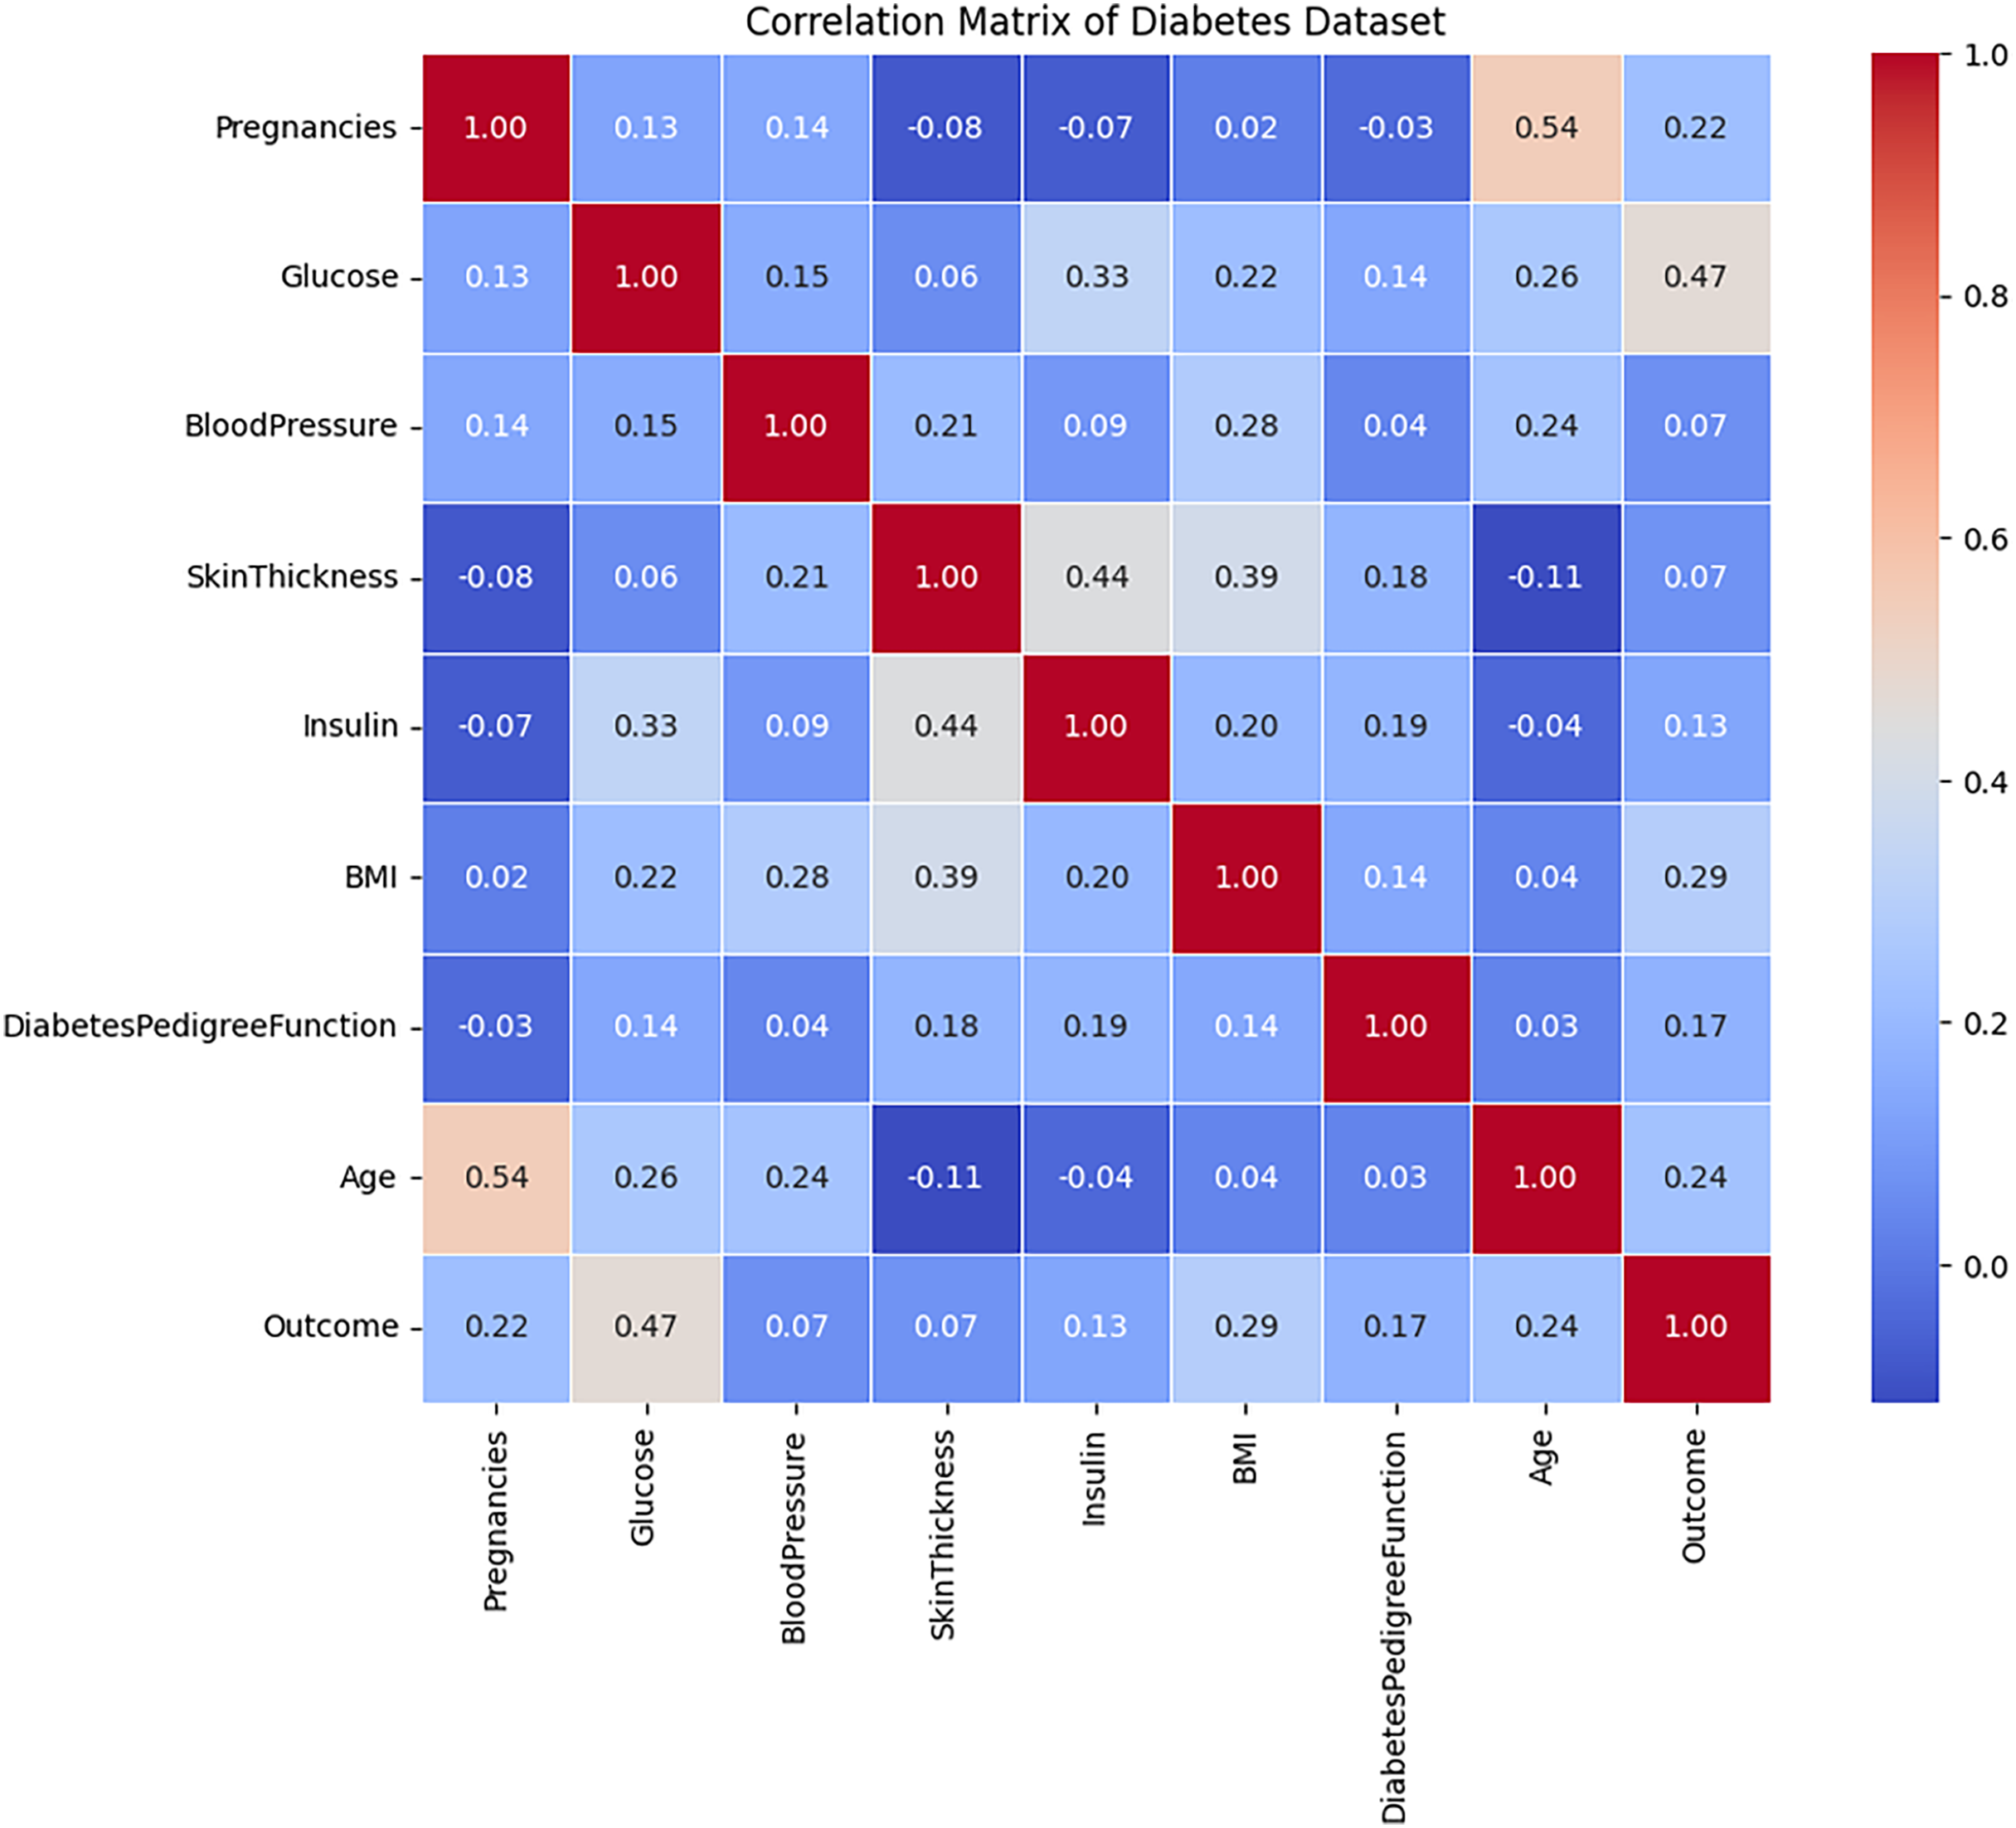
The correlation analysis of the diabetes dataset, presented in Fig. 4, indicates that the majority of attributes exhibit relatively weak linear relationships with one another, as evidenced by correlation coefficients that approach zero. Notable attributes such as Age, BMI, blood pressure, and glucose display slight linear relationships with the Outcome variable. Among these, glucose demonstrates the highest correlation with the target feature, followed by age and BMI, although these correlations remain moderate in strength. This observation suggests that no individual feature significantly determines the target outcome, implying that diabetes prediction is likely dependent on a combination of multiple attributes rather than a singular dominant factor. Furthermore, the low correlation observed between the independent variables signifies minimal multicollinearity, which can enhance model performance by mitigating the influence of redundant information.
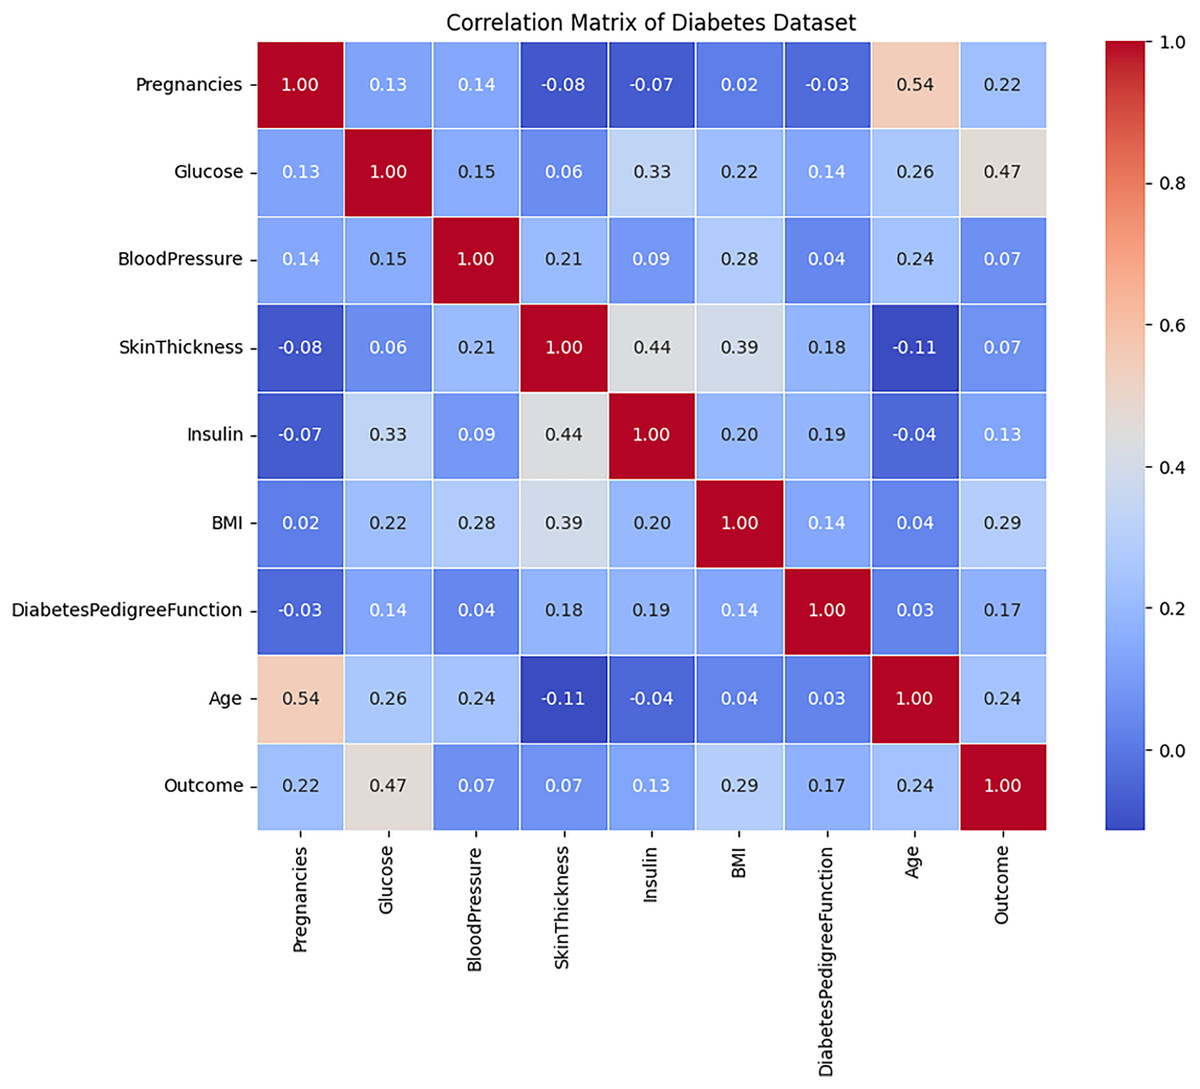
Figure 4: The correlation evaluation of the Diabetes dataset’s attributes.
Feature importance
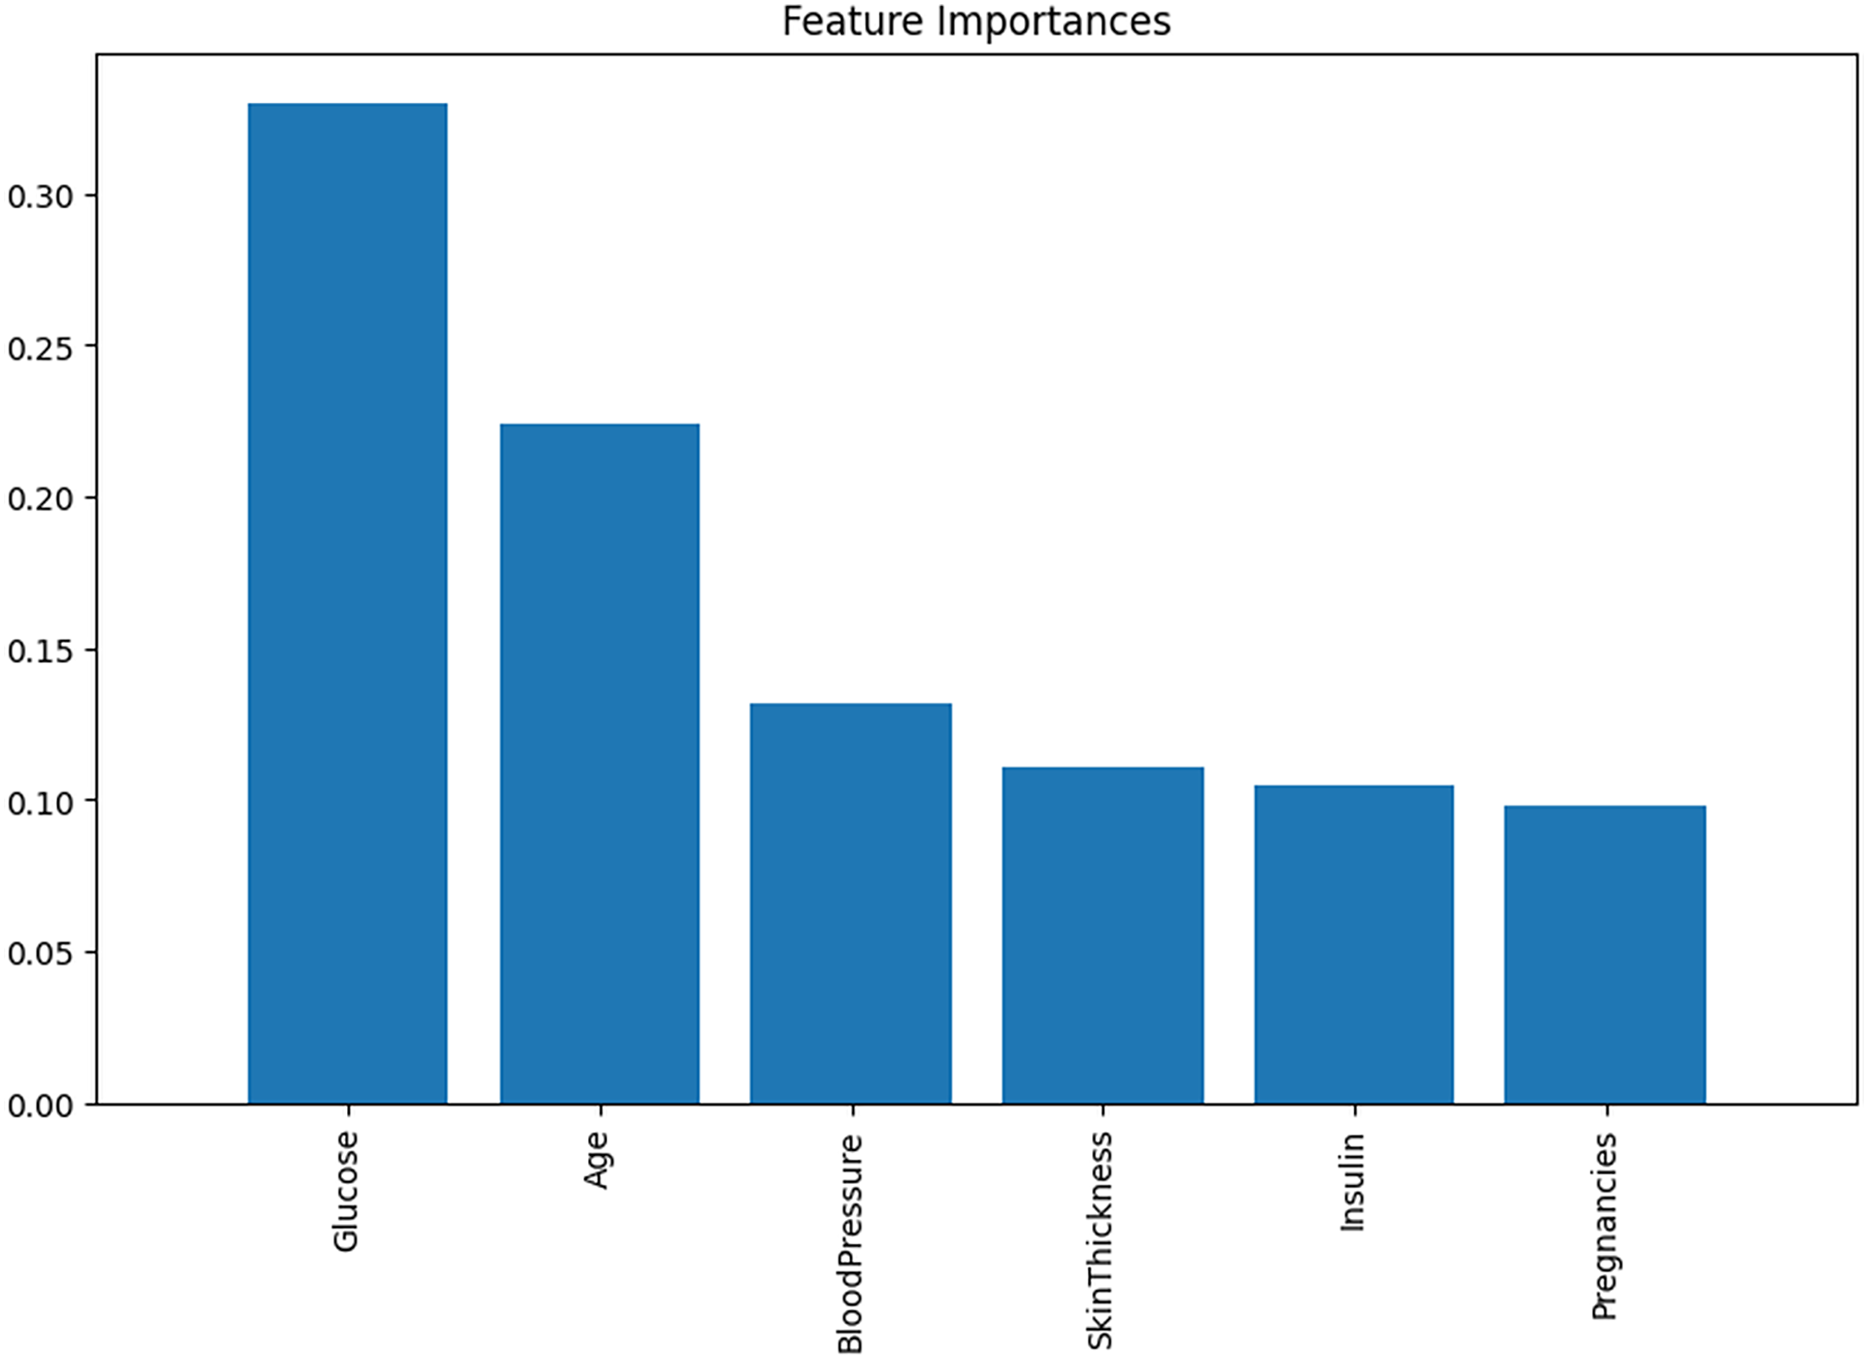
Following the correlation matrix, analyzing the Feature Importance graph is advisable. This will allow us to examine the various causes and correlations present in modeling. In certain models, the behaviors of individual predictors are not static. Rather, they fluctuate as other variables take on different values. LR is particularly well-suited for these scenarios, where specific predictions may hold greater significance for a boosted regression model than its average predictions. The significance of each feature’s importance is illustrated in Fig. 5.
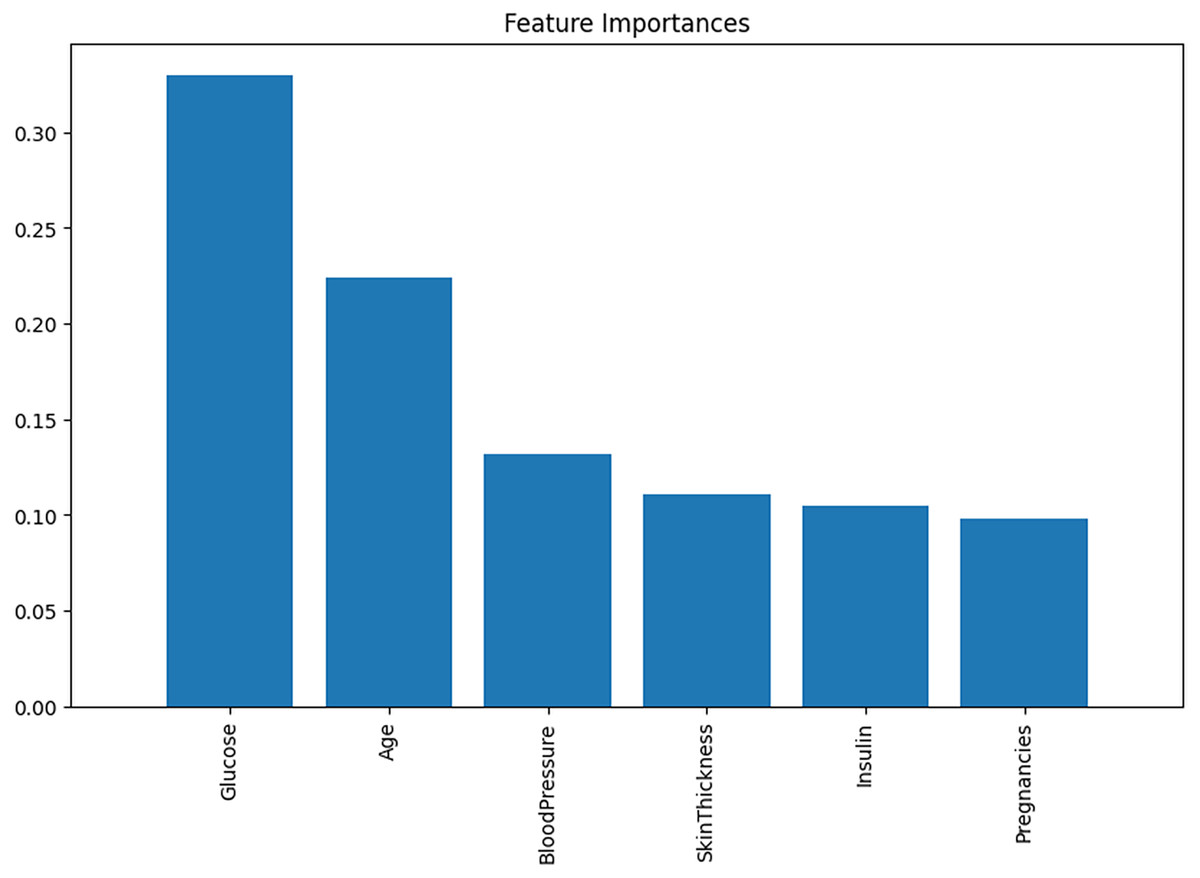
Figure 5: The feature importance.
Applied ML algorithms
This article discusses and utilizes ML algorithms, specifically LR, KNN, and RF, in the proposed methodology in the subsequent subsections.
LR
LR is a supervised ML model primarily utilized to address classification problems. It investigates the correlation between input features and the probabilities of specific outcomes. The output of LR is a probability value that ranges from 0 to 1, reflecting the likelihood of occurrence for various classes. This model incorporates a regularization mechanism, where the regularization strength is governed by the hyperparameter C; higher values of C denote weaker regularization. It is important to note that while LR shares fundamental similarities with linear regression, their applications differ significantly in practice.
KNN
KNN is among the most widely utilized algorithms in supervised ML, primarily employed for classification tasks, though it can also be adapted for regression problems. As a non-parametric method, KNN does not impose any assumptions regarding the underlying distribution of the data. It is often referred to as a “lazy learner” because it retains the entire training dataset for reference during the prediction process. KNN classifies new data points by calculating the distance between the input and all points in the training dataset. The algorithm’s performance is significantly affected by the selection of the parameter K, highlighting the importance of effective hyperparameter tuning to achieve optimal results.
RF
RF is an ML algorithm used for regression and classification tasks. It employs an ensemble technique that integrates multiple DTs to tackle complex problems and improve the model’s performance. Each split within the DT is based on a random subset of the dataset and a random selection of features. This methodology effectively manages intricate data structures, mitigates the risk of overfitting, and delivers reliable predictions under diverse conditions.
Novel proposed hybrid approach
Ensemble methods
Ensemble learning is a technique that integrates multiple ML algorithms to achieve optimal predictive performance. This approach generally enhances accuracy compared to using a single model. Common methods of ensembling include bagging, boosting, adaptive boosting (AdaBoost), stacking, and averaging.
The primary database for hyperglycemia classification is divided into two segments: the training dataset and the testing dataset, adhering to an 80:20 ratio. Three algorithms demonstrating high levels of accuracy are trained using the training dataset, while the performance of these algorithms is evaluated using the testing dataset. Instances within the dataset are assessed against algorithms’ unseen data. Each of the three algorithms generates predictions for new cases, and the results from all algorithms are compiled. This process occurs after the results are calculated and ensembled through the technique, which incorporates inputs from the classifiers to classify the test instance into the class with the most accurate output prediction.
Stacking is a specific ensemble technique that leverages the performance of leading ML models to function collaboratively. This method entails fitting several base learners on the same training set, subsequently using their predictions to inform a higher-level model known as a meta-model. The meta-model learns to produce final predictions based on the outputs provided by the base models. This technique synergizes the strengths of individual models, often resulting in improved accuracy and generalization. In our study, we apply a stacking-based ensemble classifier that integrates various classifiers, such as KNN, RF, and LR, to enhance classification outcomes and improve output predictions.
Tab transformer
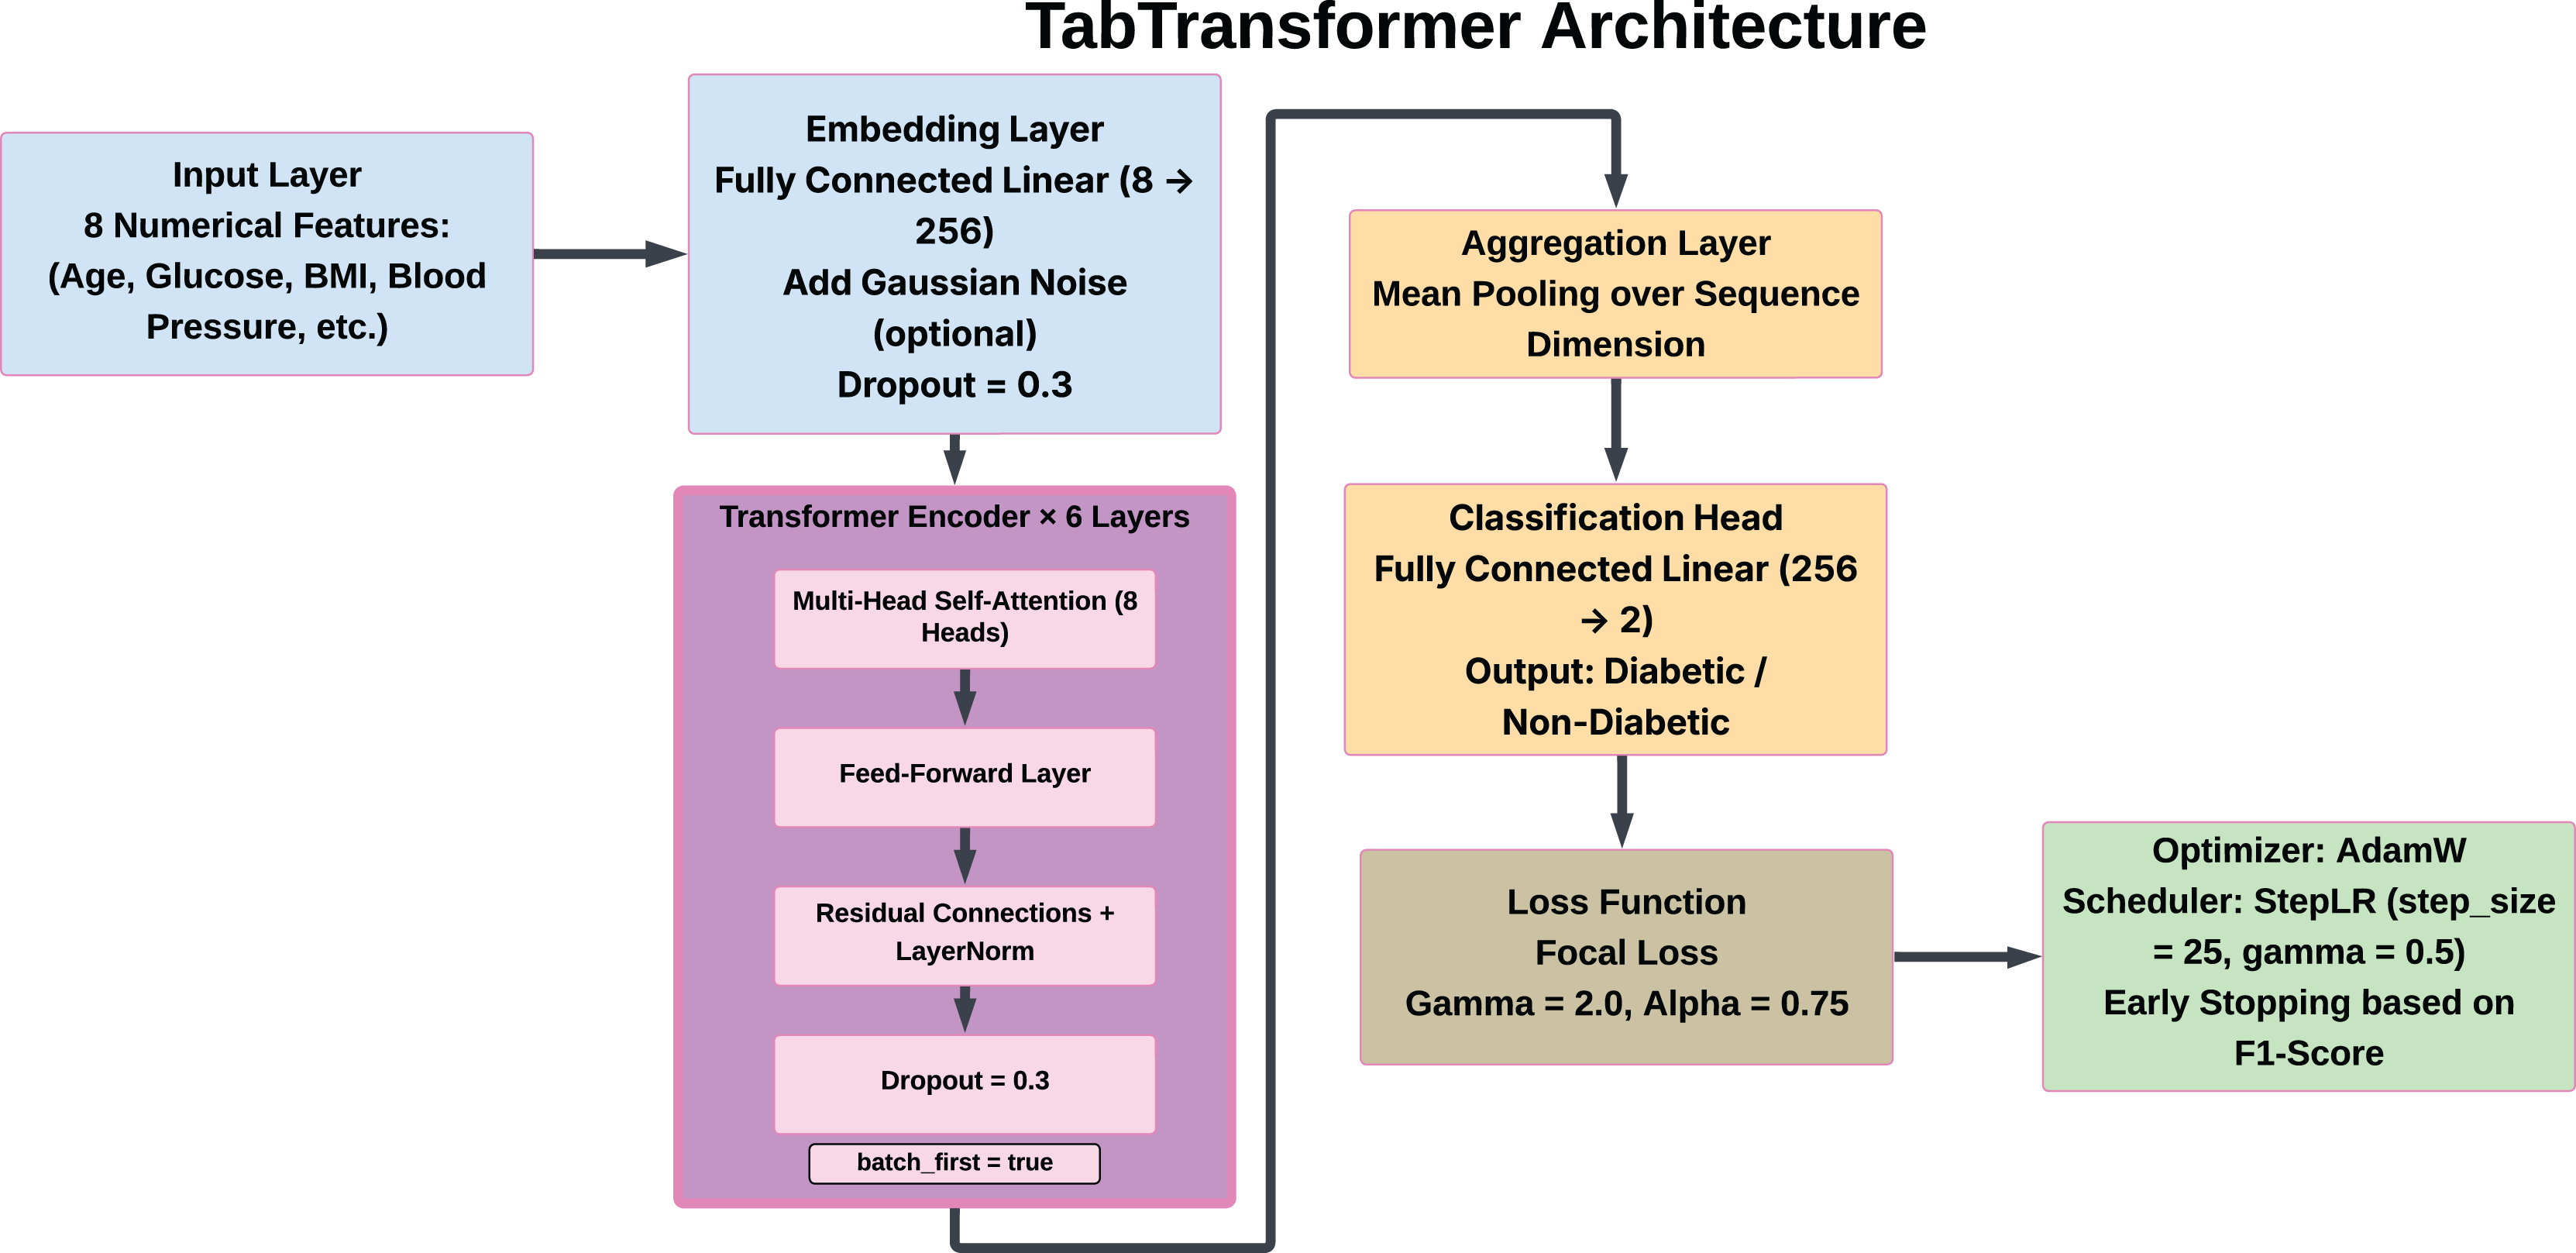
To enhance the accuracy of diabetes prediction, the tab transformer model functions as a specialized deep learning technique designed for tabular data analysis. This model employs a self-attention mechanism, distinct from conventional ML approaches, to effectively capture complex interactions among features. This capability is particularly advantageous for datasets wherein attributes may exhibit intricate correlations. The tab transformer integrates tabular features, thereby enabling the attention mechanism to identify and weigh the most significant relationships among these features. This methodological framework not only improves the model’s interpretability but also aids in uncovering critical feature dependencies that traditional models may overlook. To assess its contribution to overall predictions within an ensemble context, the Tab Transformer was first utilized as an isolated model before being incorporated into an ensemble with other models. This strategy leverages the strengths of both transformer-based and traditional models, resulting in a more nuanced and comprehensive analysis of diabetes risk factors. The architecture has the following structure:
-
•
Input features: The model analyzes eight numerical features of dataset. There do not exist any categorical features, there is no need to tokenize the data, and the numerical input is used.
-
•
Embedding layer: An embedding layer that is fully connected serves to map each of the scalar features to a dense feature space of 256 dimensions, the feature representation thus can be considered to have shape (8, 256) per sample.
-
•
Dropout layer: A dropout layer with a rate of 0.3 is placed in between the embedded representation in order to reduce overfitting.
-
•
Transformer encoder blocks: The embeddings obtained are the input of six Transformer encoder pairs stacked on top of each other. In each layer, there is:
-
–
Multi self-attention, eight heads,
-
–
Feed-forward neural networks position wise,
-
–
Remaining, links, and
-
–
Pre-layer normalization (norm_first = True) in order to enhance training stability.
-
-
•
Aggregation: The outputs of the final encoders are then aggregated by averaging them along the feature dimension (pp. Aggregation: The outputs of the last encoders are all pooled together via mean along the feature dimension (i.e., along the eight features).
-
•
Output layer: A fully connected classification layer is used to which the pooled vector is passed and this will print the probabilities of the classes in the binary classification problem (diabetic vs. non-diabetic).
The architecture, including the embedding, attention layers, pooling operation, and classification head, is depicted in Fig. 6.
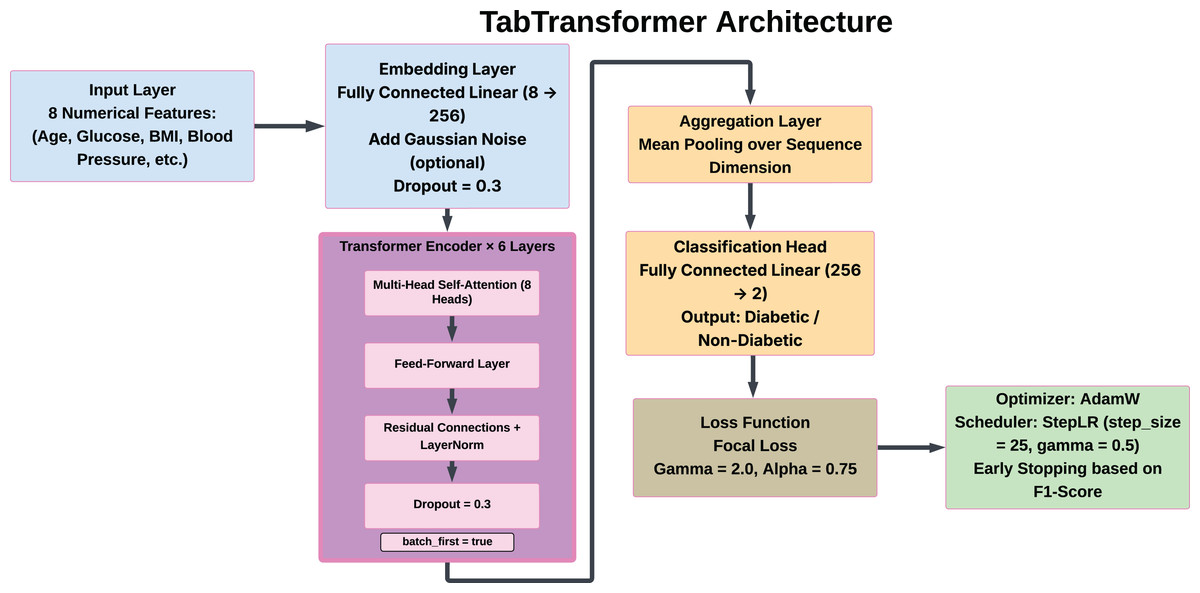
Figure 6: Architecture of the tab transformer model.
Meta learner XGBoost
XGBoost serves as the meta-learner within our ensemble methodology, effectively integrating the predictive capabilities of Tab Transformers with stacking ensembles. This stacking model is designed to capture a variety of patterns present in the diabetes dataset by incorporating multiple ML techniques, including RF, LR, and KNN. Each of these models is trained independently to ensure optimal performance. The tab transformer model utilizes attention mechanisms to identify complex, non-linear relationships among features trained on the same dataset utilized by the stacking ensemble. The tab transformer distinctly focuses on high-order feature correlations, which traditional models may overlook, thus enhancing the stacking model’s efficacy in handling tabular data. Upon completion of the training phase, outputs from both models are combined, followed by the application of the meta-learner XGBoost to these collective predictions. As a prominent final estimator, XGBoost, renowned for its efficiency and effectiveness in gradient-boosted DT, capitalizes on the strengths offered by both the Tab Transformer and stacking models. By amalgamating the various advantages inherent in traditional ensemble methodologies with the transformational capabilities of attention-based models, this ensemble approach aspires to enhance predictive accuracy, thereby establishing a robust and comprehensive framework for diabetes prediction.
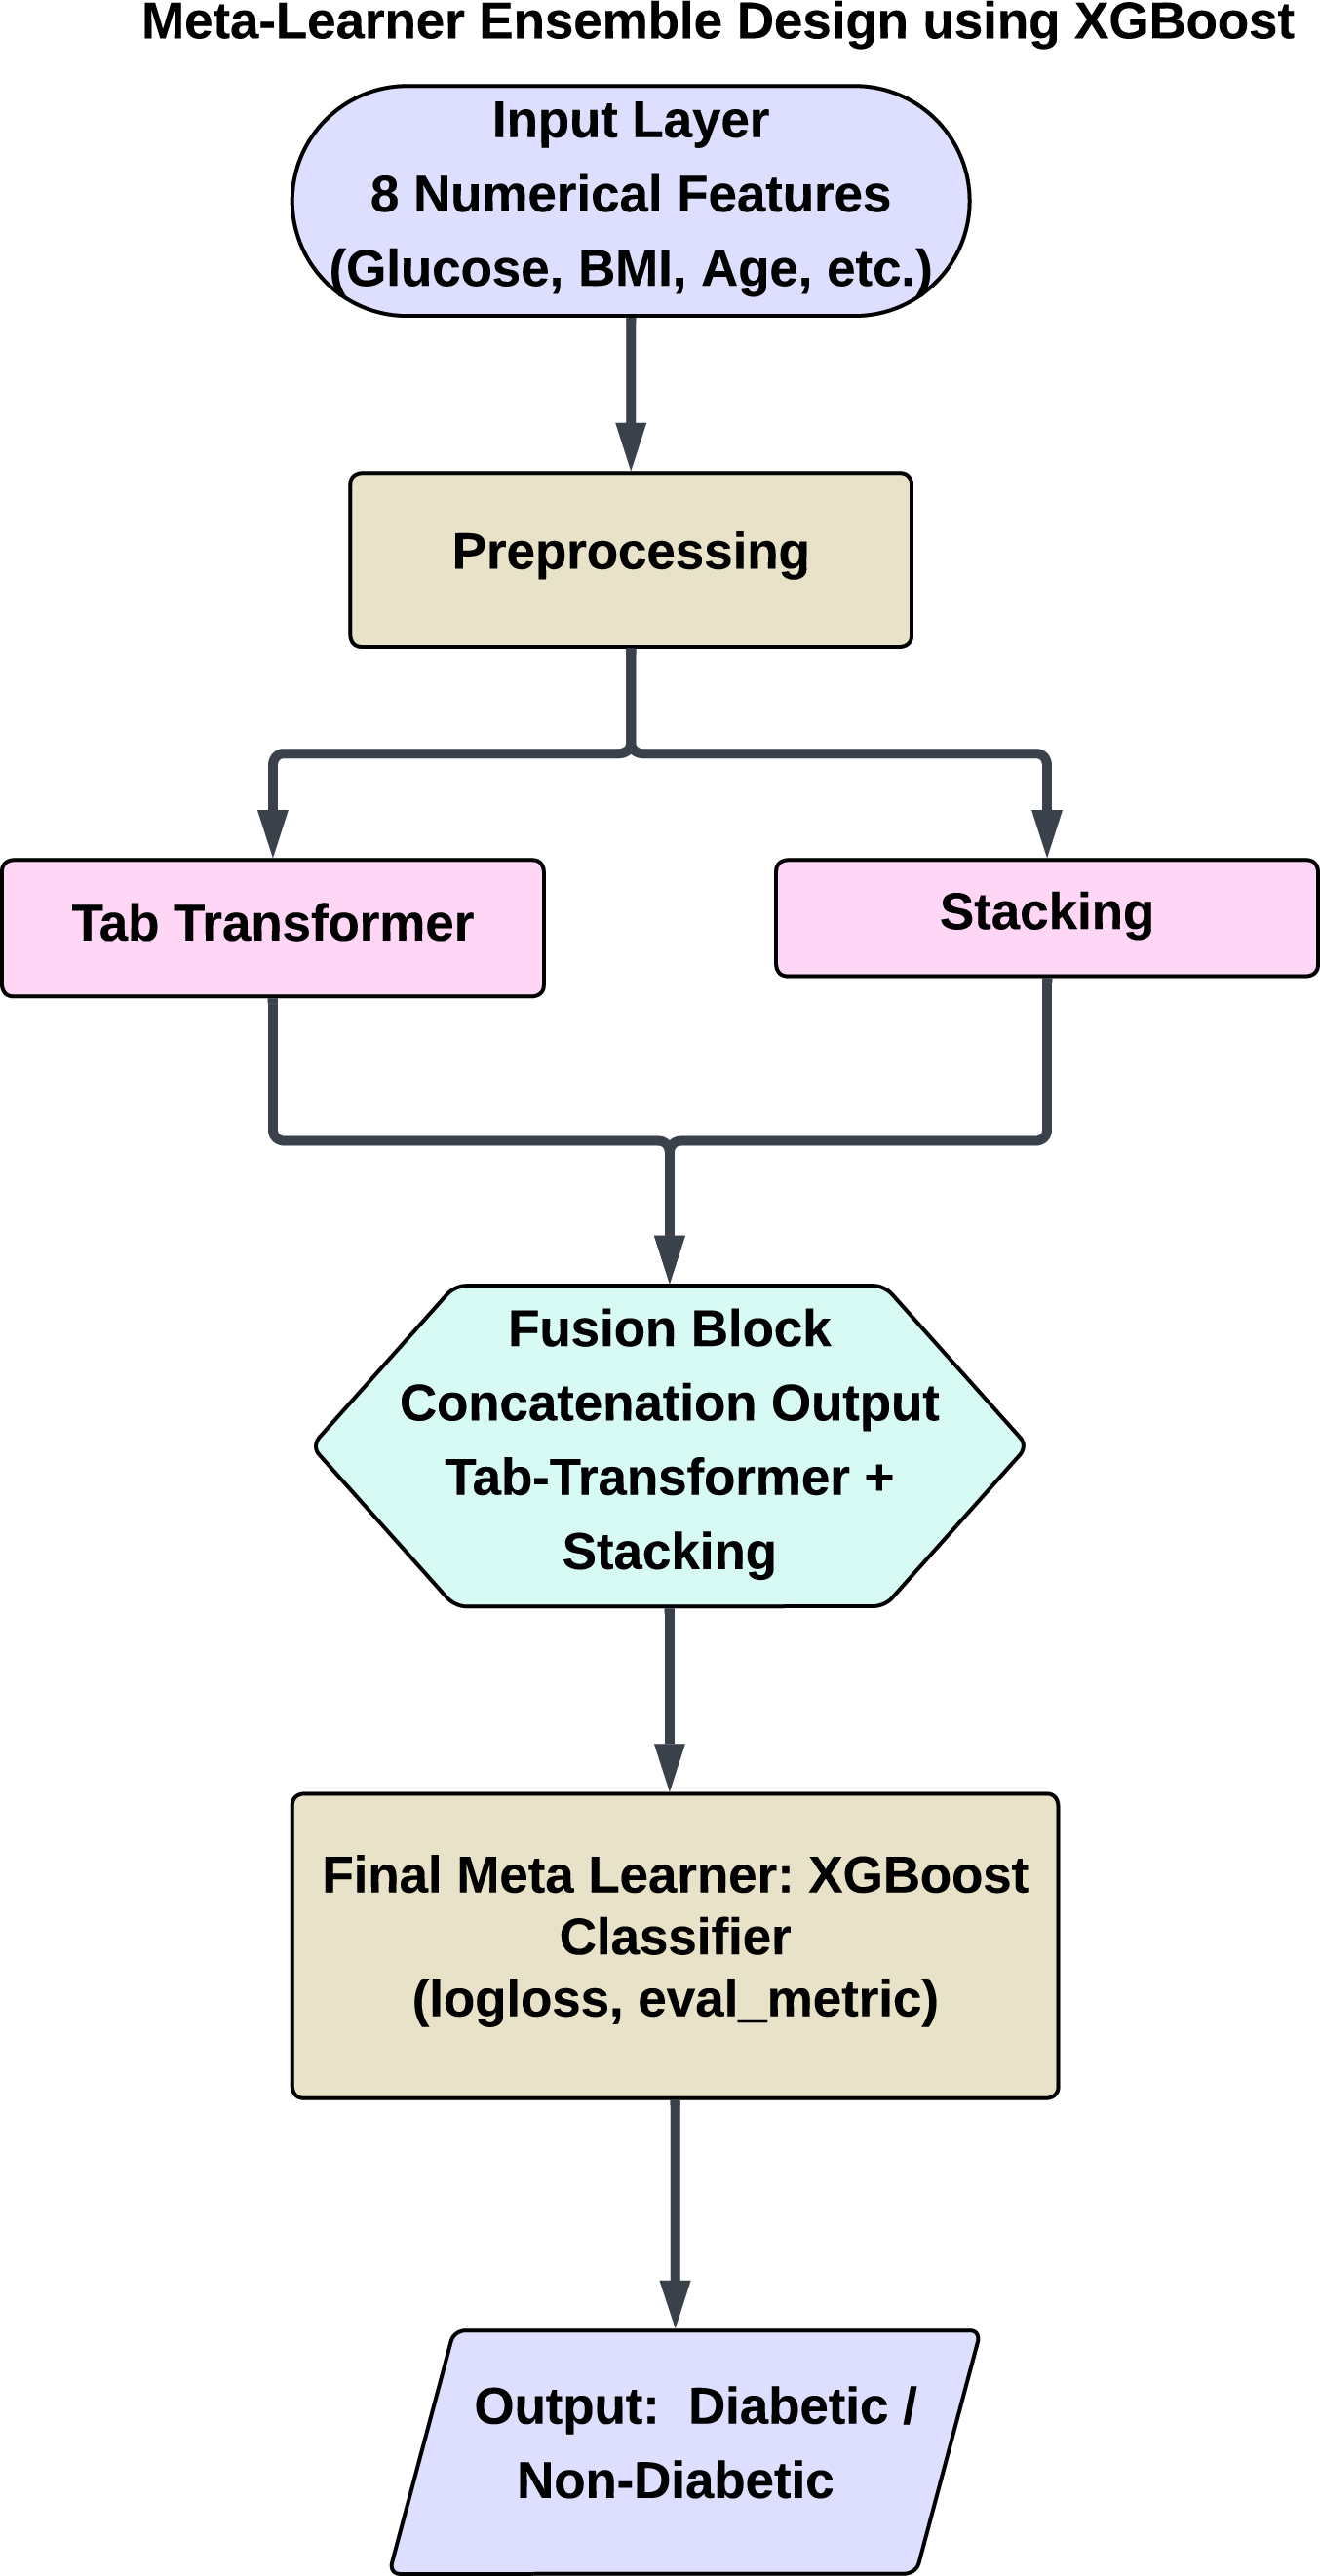
This hybrid meta-ensemble design allows XGBoost to leverage the strengths of both shallow and deep learners. It captures linear, non-linear, and global feature interactions across learners, resulting in a robust architecture particularly well-suited for medical prediction tasks such as diabetes classification. Figure 7 shows a schematic overview of the proposed hybrid architecture, including the flow of information from preprocessing to final prediction. This figure depicts the system’s dual-branch structure, with one employing traditional ensemble learning through stacking and the other using a TabTransformer for deep feature learning.
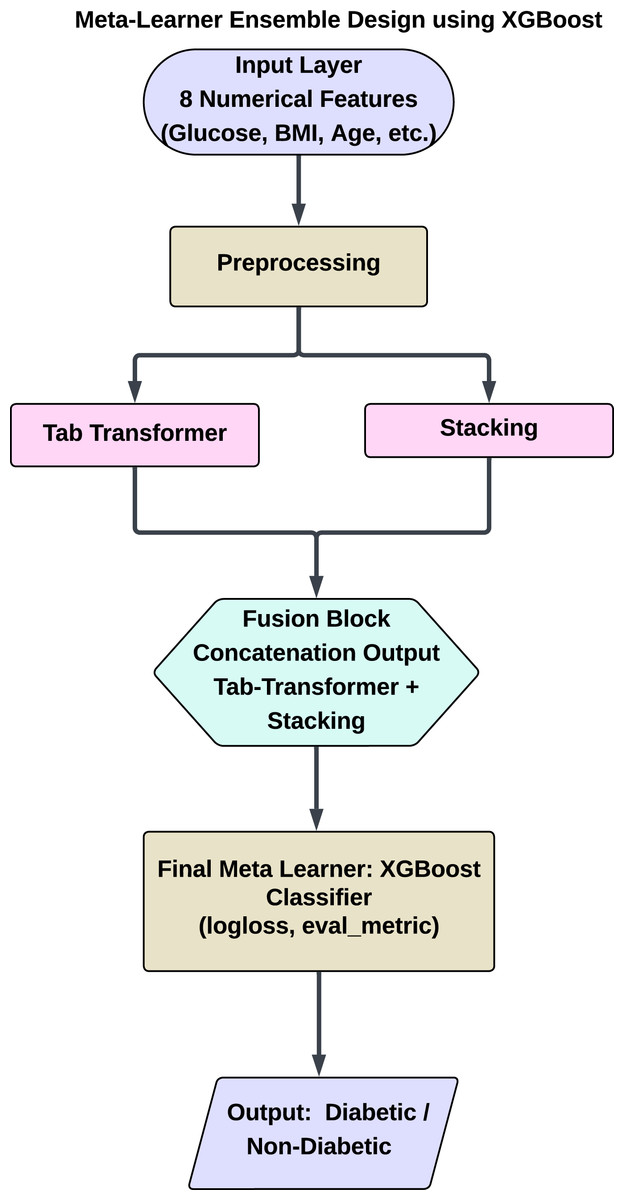
Figure 7: Proposed hybrid ensemble architecture combining a stacking classifier and tab transformer.
Hyperparameter tuning strategy
Eighty percent (80%) of the samples were allocated for training the model, while 20% of the dataset was reserved for testing each version. We employed both grid search and randomized search techniques on KNN, RF, and LR. Following parameter tuning, the ML algorithms produced accurate predictions and improved overall accuracy. Table 3 presents a comprehensive list of the tuned parameters considered in our research (Elgeldawi et al., 2021). The results demonstrate a significant matrix score, enhancing the accuracy of our ML models. All tuning was conducted within the training data using a stratified 5-fold stratified validation to avoid data leakage.
| ML models | Hyperparameters |
|---|---|
| LR | C: 0.01 |
| Penalty: L2 | |
| Solver: saga | |
| KNN | Algorithm: auto |
| n_neighbors: 10 | |
| weights: distance | |
| RF | n_estimators: 200 |
| Min_samples spilt: 10 | |
| Min_samples_leaf: 1 | |
| Max_depth: 40 | |
| Bootstrap: false |
Hyperparameter tuning enables each model to reach optimal performance by fine-tuning the parameters that govern the learning process. We employed two primary strategies:
Grid search: This method comprehensively examines all possible combinations of specified hyperparameters; however, it is computationally intensive. Grid search is utilized for LR and KNN due to their reduced parameter counts and lower computational complexity. The search space was exhaustive and validation strategy was cross-validation.
Randomized search: This approach samples a predetermined number of hyperparameter combinations from a designated distribution, thereby enhancing efficiency, particularly with complex models such as RF, which possess an extensive parameter space. The search space was random sampling and validation strategy was cross-validation.
The tuning process was designed to improve accuracy, precision, recall, and F1-score, as these evaluation metrics are critical for assessing the robustness of models in accurately identifying true diabetes cases.
Evaluation metrics
In this study, we compared the performance of various ML models by evaluating their F1-score, recall, precision, accuracy, and additional metrics. These evaluation metrics were computed for each classifier, including RF, KNN, and LR, each of which underwent hyperparameter tuning. Furthermore, we employed an ensemble technique known as Stacking, which integrated the tab transformer with a meta learner, XGBoost. This approach ultimately surpassed the performance of the individual classifiers. The comparative analysis reveals that all classifiers exhibited efficient performance in terms of accuracy, F1-score, precision, and recall.
Accuracy
A specific metric is used to assess the model’s overall performance. In the context of classification models, performance is defined as the proportion of accurate predictions relative to the total number of predictions made and is calculated as follows:
Precision
Precision, or positive predictive value, measures how accurately a model predicts positive outcomes. It represents the ratio of true positive predictions to the total number of positive predictions and is calculated as follows:
Recall
Recall, often referred to as Sensitivity or True Positive Rate, quantifies a model’s efficacy in accurately identifying all positive instances. It is defined as the ratio of true positive predictions to the total number of actual positive instances and is calculated as follows:
F1-score
The F1-score is the harmonic mean of Recall and Precision. This metric provides a singular measure that effectively balances precision and recall, making it especially valuable for addressing imbalanced class distributions. Additionally, the F1-score offers critical insights into the accuracy and reliability of the classifier model under evaluation and is calculated as follows:
Computing infrastructure
ML models have been employed to evaluate the performance of an algorithm. We constructed the ML classifier utilizing the Python programming language in conjunction with the scikit-learn library. All experiments were conducted in a cloud-based environment via Google Colab, utilizing a Linux 6.1.123+ system with 12.67 GB RAM and CPU-only processing (x86_64 architecture). To promote transparency and reproducibility, we recorded the average training time for each machine learning model as follows:
RF: 81.27 s
LR: 1.52 s
KNN: 1.38 s
Stacking Ensemble: 166.47 s
TabTransformer: 50.42 s
These runtime values reflect the average time required to train each model using the default or tuned hyperparameters, as outlined in the previous section. All experiments were performed using CPU processing to simulate low-resource environments and ensure the broad applicability of the proposed method. We used stratified 5-fold cross-validation during hyperparameter tuning, and stratified 10-fold cross-validation for final robustness evaluation.
Results and discussions
This section presents the findings from the application of various ML and ensemble models to the diabetes dataset. We systematically evaluated the performance of individual classifiers, their enhancements achieved through hyperparameter tuning, and the effectiveness of ensemble techniques, specifically stacking with TabTransformer and XGBoost. The performance of each model was assessed using several key metrics, including accuracy, precision, recall, and F1-score, thereby providing a comprehensive evaluation of their capabilities in the context of diabetes prediction.
ML models with hyperparameter tuning
This section provides an analysis of the performance improvements achieved through hyperparameter tuning applied to the ML models, specifically KNN, RF, and LR, utilized in our research. Hyperparameter tuning is performed using randomized search and grid search techniques, aiming to enhance each model’s predictive capabilities by identifying the optimal combination of parameters. This tuning process is particularly critical in medical classification tasks, such as diabetes prediction, as even minor adjustments can significantly improve the model’s proficiency in accurately identifying both positive and negative cases.
Tuned hyperparameters and model performance
The results of hyperparameter tuning for each model are presented in Table 4. By optimizing the hyperparameters, each model demonstrated significant performance enhancements. Notably, the RF classifier achieved the highest accuracy and recall metrics, establishing it as a formidable contender for diabetes prediction.
| Model | Accuracy | Precision | Recall | F1-score |
|---|---|---|---|---|
| LR (Tuned) | 0.96 | 0.97 | 0.97 | 0.96 |
| - Class 0 | – | 0.95 | 0.98 | 0.96 |
| - Class 1 | – | 0.98 | 0.95 | 0.97 |
| RF (Tuned) | 0.98 | 0.99 | 0.98 | 0.98 |
| - Class 0 | – | 1.00 | 0.97 | 0.98 |
| - Class 1 | – | 0.97 | 1.00 | 0.99 |
| KNN (Tuned) | 0.97 | 0.98 | 0.97 | 0.97 |
| - Class 0 | – | 0.98 | 0.97 | 0.97 |
| - Class 1 | – | 0.97 | 0.98 | 0.98 |
Analysis of model improvements
Each optimized model demonstrated significant enhancements in its capacity to classify both diabetic and non-diabetic cases, as detailed below:
LR: The hyperparameter tuning for LR concentrated on adjusting the regularization parameter C and the penalty type. The optimized LR model attained a balanced accuracy of 96% with a high precision of 0.97 for both classes. The class-specific results indicate that Class 0 (non-diabetic) achieved a precision of 0.95 and a recall of 0.98, while Class 1 (diabetic) attained a precision of 0.98 and a recall of 0.95. This equilibrium illustrates the model’s robustness in predicting both classes without bias.
RF: The tuning process for RF involved adjusting the number of estimators, the maximum tree depth, as well as the minimum samples required for splitting and leaf nodes. The optimized RF model achieved the highest overall accuracy of 98% with a precision of 0.99 and an F1-score of 0.98. Notably, Class 1 (diabetic) recorded a precision of 0.97 and a perfect recall of 1.00, underscoring RF’s capability in accurately identifying all positive cases. The elevated F1-score for both classes confirms the model’s strong balance between precision and recall, which is crucial for minimizing false negatives in healthcare applications.
KNN: The tuning for KNN primarily centered on selecting the optimal number of neighbors (n_neighbors) and adjusting the distance weights. Following the tuning, KNN achieved an accuracy of 97% with a balanced precision of 0.98 across both classes. The class-specific results reflect a precision of 0.98 for Class 0 and 0.97 for Class 1, resulting in a consistent F1-score. This indicates that KNN performed well with minimal variance in class performance, thereby establishing it as a reliable option for balanced predictions.
Discussion of results with hyperparameter tuning
The enhancements achieved through hyperparameter tuning highlight the significance of parameter optimization in ML models, especially in healthcare applications where the costs associated with misclassification are substantial. Among the tuned models:
RF demonstrated superior performance, achieving the highest accuracy and recall, which are critical in healthcare environments as they reduce the likelihood of overlooking diabetes cases.
LR exhibited a balanced performance across both classes, suggesting its effectiveness in managing linear relationships within the dataset.
KNN attained competitive accuracy, indicating that non-parametric methods can be potent when appropriately tuned.
These results imply that hyperparameter tuning improves overall accuracy and significantly contributes to achieving a balanced performance across classes, thereby enhancing the reliability of model outputs for clinical applications.
Study results discussion with stacking
In this section, we perform a detailed analysis of the results obtained from the stacking classifier, which amalgamates the strengths of multiple ML models to enhance prediction accuracy. This ensemble method consolidates the predictions of three base learners: RF, LR, and KNN, employing LR as the meta-learner. By aggregating diverse models, the stacking classifier leverages the distinct advantages of each base learner, resulting in a more balanced and robust predictive model, which effectively mitigates the limitations associated with individual classifiers.
Construction and function of the stacking model
The stacking classifier integrates the outputs of the base models, namely RF, LR, and KNN, each of which generates predictions for the dataset. These predictions are subsequently input into the LR meta-learner, which determines the final classification by evaluating the outputs of the base models. This architecture enables the stacking classifier to leverage the strengths inherent in each base model while utilizing the meta-learner’s capacity to detect patterns within the predictions made by the base models. As a result, this approach yields improved overall accuracy and robustness.
Performance metrics of individual models and stacking classifier
Table 5 presents a comparative analysis of the performance metrics for each individual model, including the optimized versions of LR, RF, and KNN, alongside the stacking classifier. The stacking classifier demonstrates superior performance metrics, achieving an accuracy of 98%, which closely aligns with or exceeds those of the individual base models.
| Model | Accuracy | Precision | Recall | F1-score |
|---|---|---|---|---|
| LR (Tuned) | 0.96 | 0.97 | 0.97 | 0.96 |
| - Class 0 | – | 0.95 | 0.98 | 0.96 |
| - Class 1 | – | 0.98 | 0.95 | 0.97 |
| RF (Tuned) | 0.98 | 0.99 | 0.98 | 0.98 |
| - Class 0 | – | 1.00 | 0.97 | 0.98 |
| - Class 1 | – | 0.97 | 1.00 | 0.99 |
| KNN (Tuned) | 0.97 | 0.98 | 0.97 | 0.97 |
| - Class 0 | – | 0.98 | 0.97 | 0.97 |
| - Class 1 | – | 0.97 | 0.98 | 0.98 |
| Stacking | 0.98 | 0.99 | 0.98 | 0.99 |
| - Class 0 | – | 1.00 | 0.97 | 0.98 |
| - Class 1 | – | 0.97 | 1.00 | 0.99 |
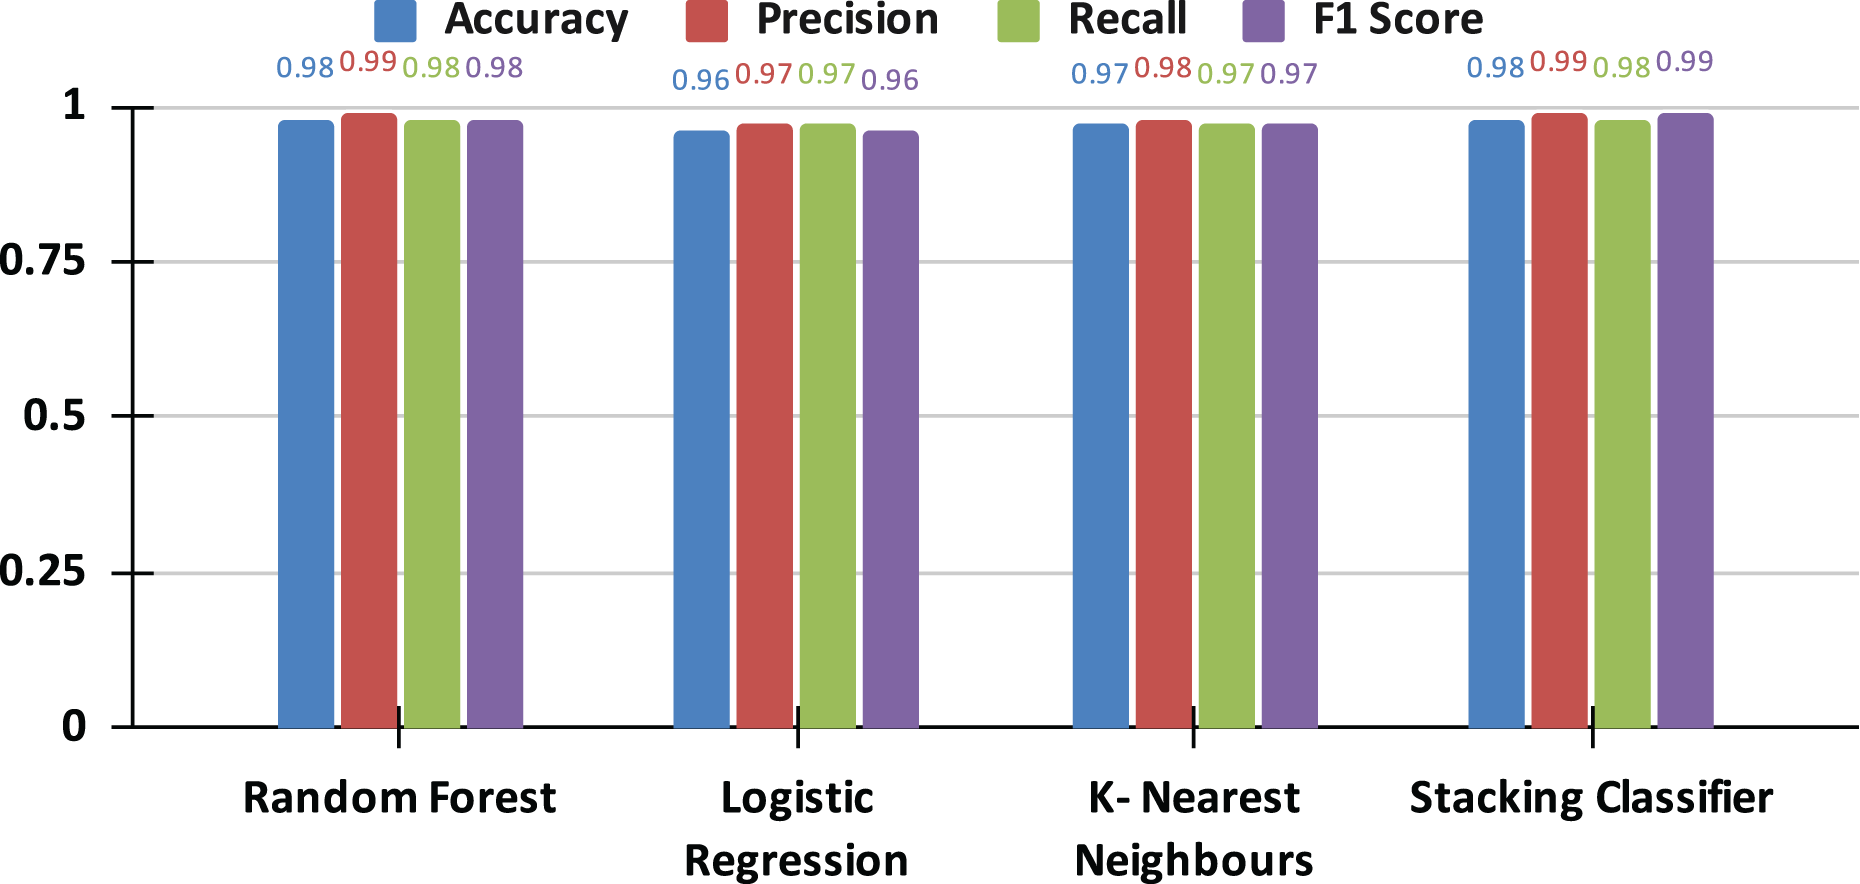
Overall comparative analysis with graphical insights
The results presented in the comparison graph (see Fig. 8) offer a clear visual representation of the performance disparities among the models. The graph delineates the performance of each metric across the individual models and the stacking classifier, emphasizing the advantages the stacking classifier gains from the synergistic strengths of its base learners.
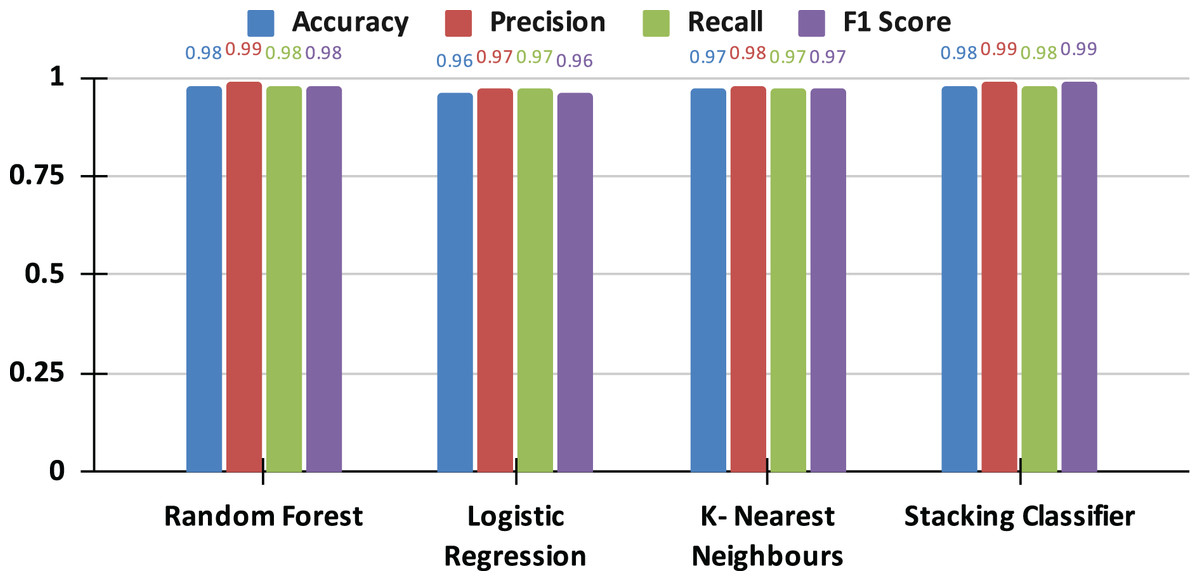
Figure 8: The comparative analysis of applied models.
Analysis of tab transformer performance in diabetes prediction
The tab transformer model, designed to effectively capture complex feature interactions via self-attention mechanisms, was applied to a diabetes dataset, achieving a test accuracy of 72.7% after 100 epochs. Although this accuracy is lower than that of both the stacking ensemble and traditional models, the attention-based approach of the tab transformer provides unique insights into the dependencies among features, such as glucose levels and BMI, which are critical for diabetes prediction. The model exhibited a gradual reduction in loss, decreasing from 0.934 at the initial epoch to 0.324 by epoch 90, indicating stable convergence. While the standalone performance of the model is considered moderate, the tab transformer’s capability to prioritize feature relationships suggests potential for integration into ensemble frameworks, where its strengths in capturing non-linear patterns could complement traditional models, ultimately enhancing overall predictive accuracy in healthcare applications.
Hybrid ensemble using XGBoost (Stacking + Tab transformer)
To enhance the predictive capabilities of diabetes models, we implemented a hybrid approach that integrates Transformer-based architectures with ensemble learning techniques. This section details the combination of the tab transformer model and a meta-learning approach utilizing XGBoost, an effective gradient-boosting algorithm. The hybrid model capitalizes on the attention mechanism of the tab transformer for modeling feature relationships, while XGBoost acts as a meta-learner to amalgamate predictions from multiple models, thereby resulting in a more robust classifier.
To address the challenge of storing complex relationships among tabular data features, the tab transformer model is employed. In medical datasets, where interactions between variables such as age, BMI, and glucose levels may be intricate, the tab transformer adopts a Transformer-based architecture coupled with self-attention mechanisms to prioritize and evaluate significant feature correlations.
Although the tab transformer achieved a test accuracy of 72%, which is lower than that of the stacking ensemble models, it provided valuable structural insights. The model exhibited stable convergence during the training process, with the loss decreasing from 0.934 in the first epoch to 0.324 by epoch 90. This suggests that despite moderate standalone performance, the model successfully learns the underlying patterns within the data, particularly regarding feature dependencies.
Ensemble approach: stacking classifier with tab transformer integration
To leverage the complementary strengths of both models, we integrated the predictions from the stacking classifier and the tab transformer. The stacking classifier comprises RF, LR, and KNN as base models, with an LR meta-learner serving as a robust foundation for our ensemble approach. By incorporating the tab transformer into the ensemble, our objective was to enhance the overall accuracy and robustness of the system.
The predictions from both the stacking classifier and the tab transformer were subsequently input into an XGBoost meta-learner. XGBoost, recognized for its efficiency and scalability, was employed to amalgamate the predictions from the ensemble models alongside the tab transformer. This hybrid methodology enables the capture of both linear and non-linear patterns within the data, thereby improving overall predictive performance.
Meta-learning with XGBoost
XGBoost is selected as the meta-learner due to its capability to effectively manage imbalanced datasets and its strength in integrating weak learners to enhance generalization. The XGBoost model is trained on the outputs of the stacking classifier and the tab transformer, which offer a comprehensive set of features for the final meta-model. This combination improves the predictive model by leveraging the distinct strengths of each component: the feature interaction modeling provided by the tab transformer and the ensemble aggregation facilitated by the stacking classifier.
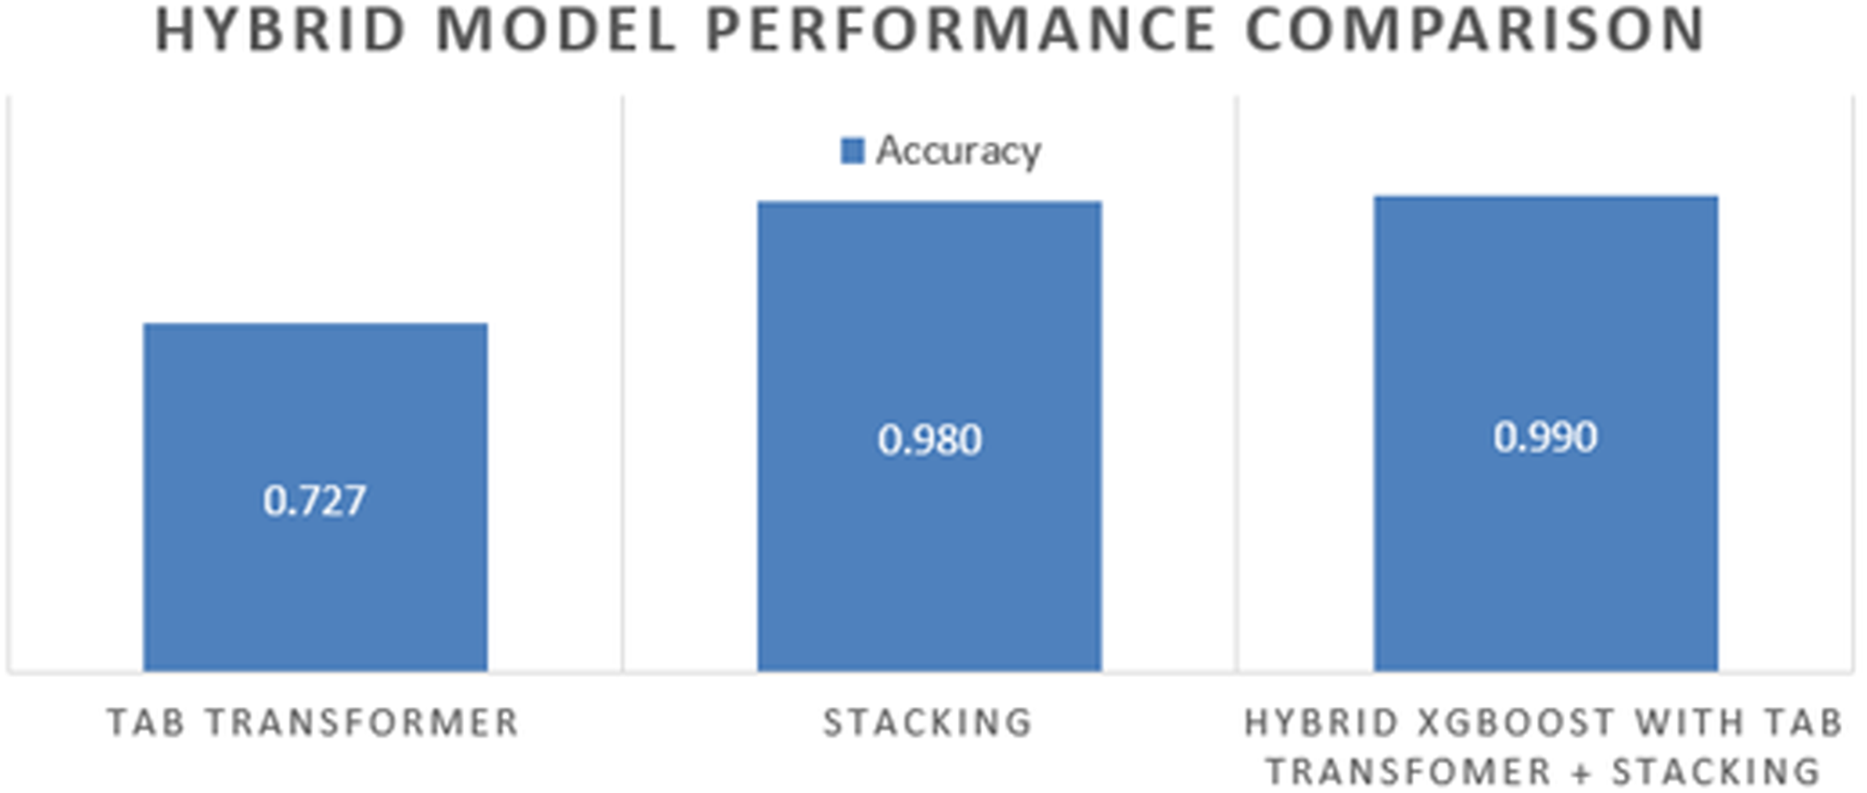
The final ensemble model, which integrates the tab transformer and stacking classifier with XGBoost, has demonstrated superior performance relative to each individual model. Table 6 displays the performance metrics associated with the final hybrid model, highlighting significant improvements in accuracy, precision, recall, F1-score, and ROC-AUC compared to traditional models.
| Model | Accuracy | Precision | Recall | F1-score | ROC-AUC |
|---|---|---|---|---|---|
| Stacking classifier | 0.98 | 0.99 | 0.98 | 0.99 | 0.99 |
| Tab transformer | 0.72 | 0.75 | 0.70 | 0.72 | 0.78 |
| Hybrid ensemble using XGBoost (Stacking + Tab transformer) | 0.99 | 0.99 | 0.99 | 0.99 | 0.99 |
The hybrid model outperformed both the individual classifiers and the tab transformer across all evaluation metrics. The incorporation of the tab transformer alongside XGBoost as a meta-learner culminated in a highly effective model adept at capturing complex feature interactions while minimizing prediction errors, especially in challenging cases.
Figure 9 depicts the comparative performance of the individual models, the tab transformer, and the final hybrid ensemble. The hybrid model consistently exhibits enhancements across all evaluation metrics, particularly in recall and precision. This makes it a valuable asset for healthcare applications where the identification of true positives (e.g., diabetic cases) and the reduction of false negatives are paramount.
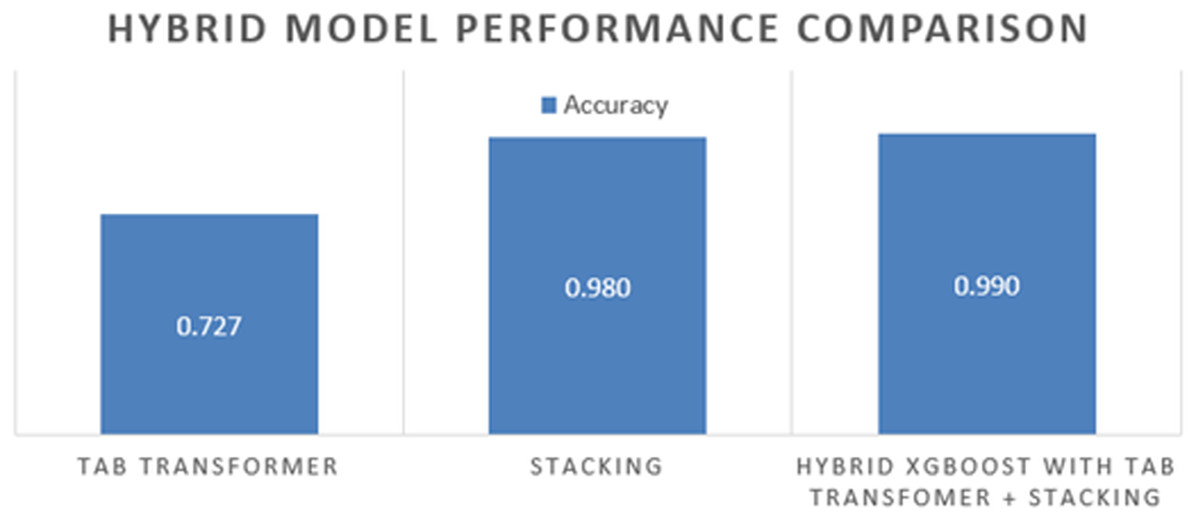
Figure 9: The hybrid model comparison.
The integration of transformer-based attention mechanisms with gradient boosting capabilities, particularly through XGBoost, underscores the effectiveness of hybrid methodologies in enhancing predictive accuracy. This is especially pertinent in intricate medical prediction tasks, such as the detection of diabetes.
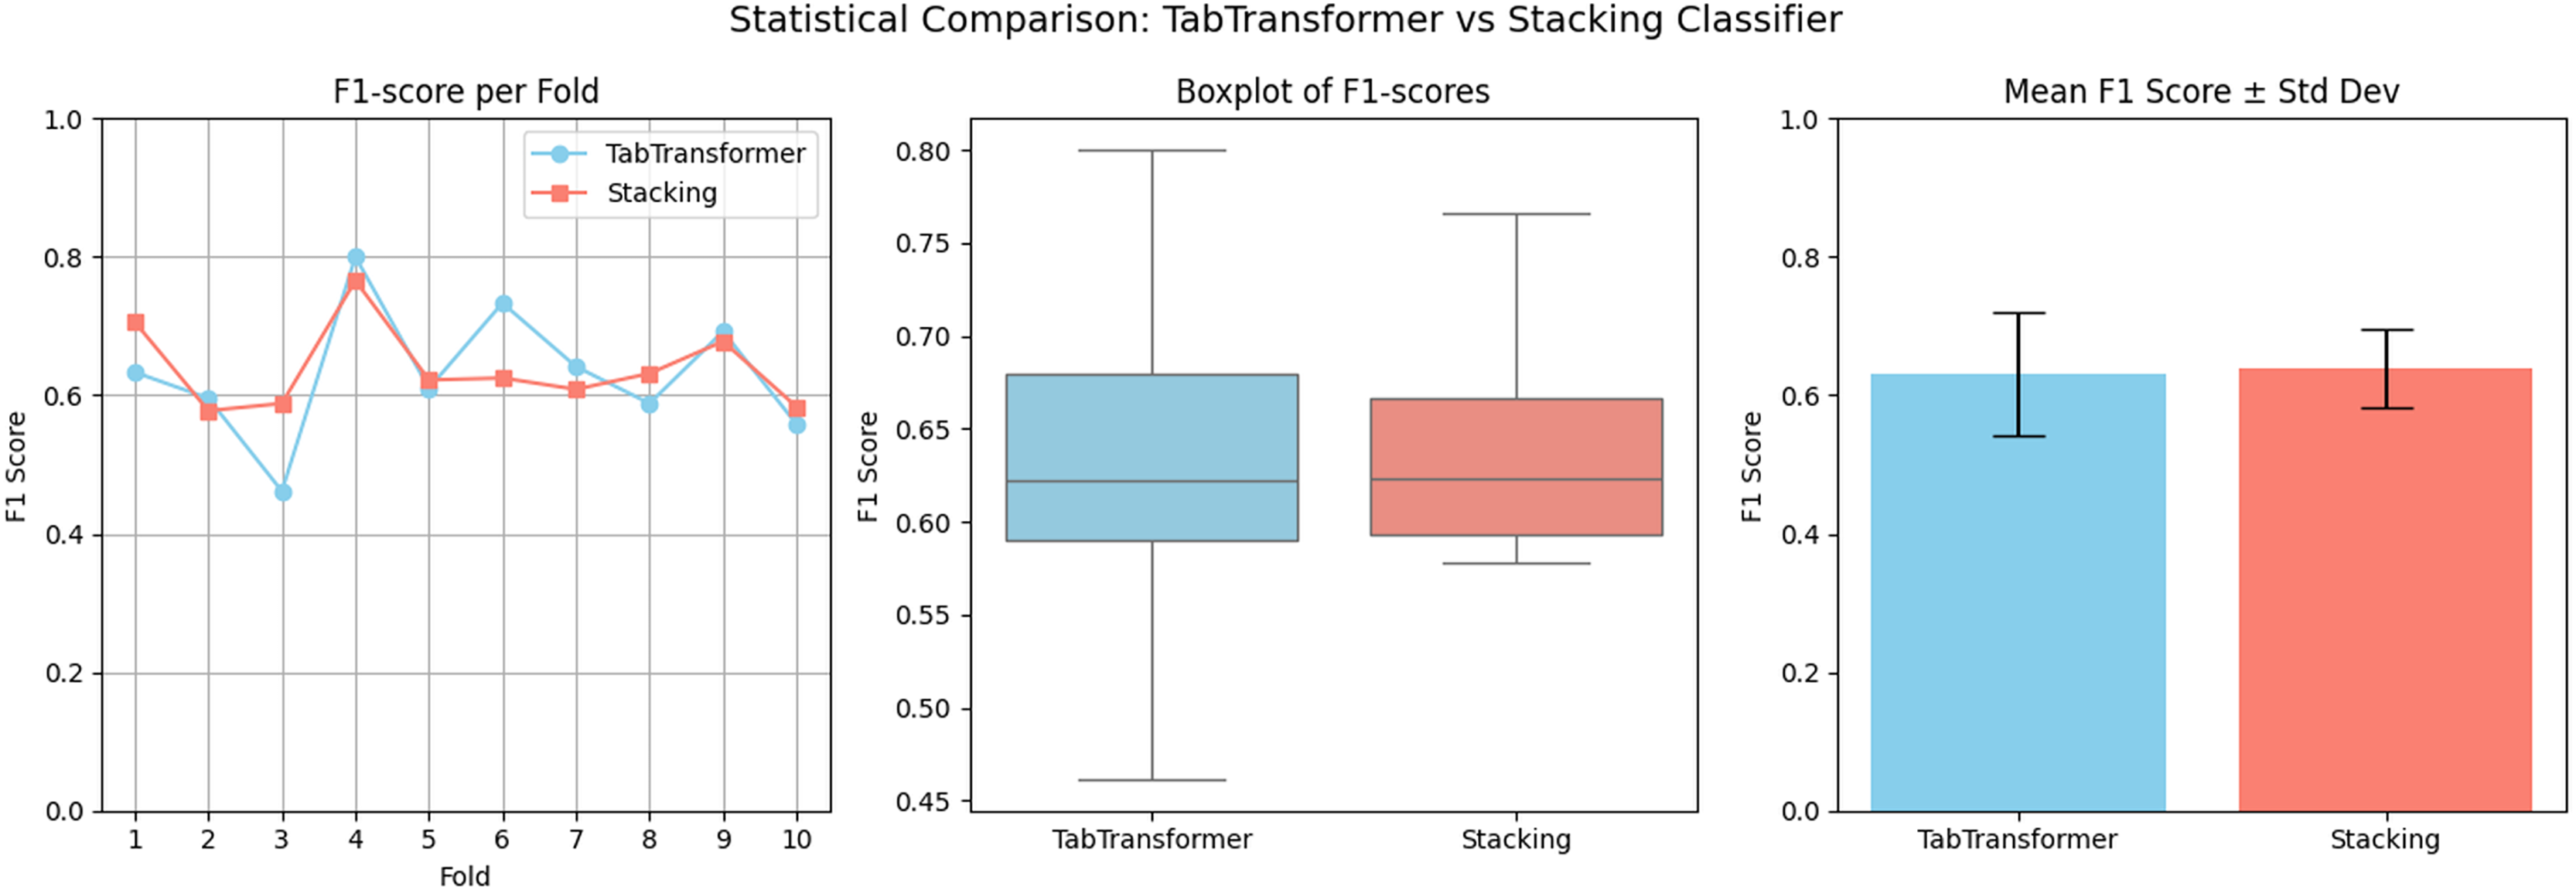
Statistical validation
To statistically validate the performance difference, a paired t-test is conducted on the F1-scores of the stacking classifier and the hybrid ensemble across 10-fold cross-validation. The results show a t-statistic value of 17.0807 and a p-value of 0.0000. Since the p-value < 0.05, we conclude that the improvement achieved by the hybrid model is statistically significant. This confirms that integrating tabtransformer with the stacking classifier using XGBoost yields meaningful and consistent gains in predictive performance. A visual comparison is presented in Fig. 10, where the hybrid model surpasses individual models. In this analysis, we have analyzed F1-scores across 10-fold cross-validation.
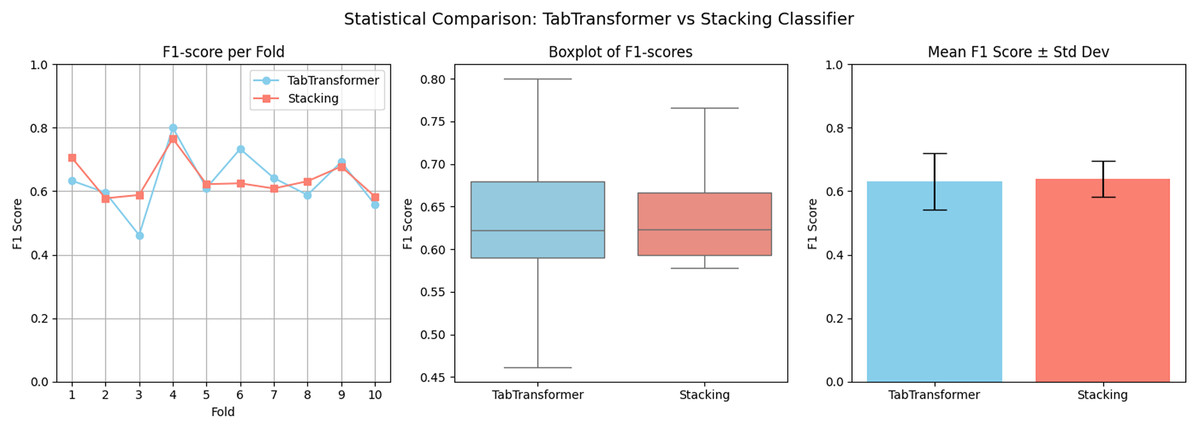
Figure 10: Visual statistical comparison between the hybrid ensemble (XGBoost + TabTransformer + Stacking).
Ablation study
To validate the contribution of each component in the proposed hybrid architecture, we conducted an ablation study by incrementally removing or isolating modules such as the TabTransformer, Stacking ensemble, and the XGBoost meta-learner. The performance of each configuration was evaluated using Accuracy, Precision, Recall, F1-score, and ROC-AUC. As shown in Table 7, the full hybrid model combining TabTransformer, stacking classifier, and XGBoost achieves the highest accuracy (98.7%) and ROC-AUC (99.6%). Removing the XGBoost meta-learner or evaluating TabTransformer or stacking classifier in isolation resulted in a noticeable drop in performance. This confirms that the integration of deep feature representations (tab transformer), classical ensemble predictions (stacking classifier), and boosting-based meta-learning (XGBoost) is complementary and collectively enhances predictive performance.
| Model variant | Accuracy | Precision | Recall | F1-score | ROC-AUC |
|---|---|---|---|---|---|
| Full Hybrid (XGBoost + Stacking + TabTransformer) | 0.9870 | 0.9815 | 0.9815 | 0.9815 | 0.9965 |
| Stacking only | 0.7532 | 0.6600 | 0.6111 | 0.6346 | 0.8281 |
| TabTransformer only | 0.7403 | 0.6061 | 0.7407 | 0.6667 | 0.8069 |
| Without meta-learner | 0.7468 | 0.6364 | 0.6481 | 0.6422 | 0.8237 |
Impact of SMOTE on model performance
The impact of applying SMOTE and hyperparameter tuning is assessed by testing each machine learning model in two different scenarios: without SMOTE and with SMOTE applied just to the training data. The models’ performance is evaluated using four essential metrics: accuracy, precision, recall, and F1-score, both overall and by class (Class 0 for non-diabetics and Class 1 for diabetic patients).
Table 8 displays the results of tuned models without SMOTE, providing a breakdown of each model’s predictive performance. This table shows that KNN had the greatest accuracy (0.75) of the three models when SMOTE is not utilized, with somewhat balanced class-wise metrics. LR and RF followed closely after, with accuracies of 0.74 each.
| Model | Accuracy | Classes | Precision | Recall | F1-score |
|---|---|---|---|---|---|
| RF (Tuned) | 0.74 | Class 0 | 0.77 | 0.86 | 0.81 |
| Class 1 | 0.67 | 0.52 | 0.58 | ||
| LR (Tuned) | 0.74 | Class 0 | 0.84 | 0.74 | 0.79 |
| Class 1 | 0.61 | 0.74 | 0.67 | ||
| KNN (Tuned) | 0.75 | Class 0 | 0.79 | 0.84 | 0.81 |
| Class 1 | 0.66 | 0.57 | 0.61 |
In contrast, Table 9 presents the results of the same models when SMOTE is applied to the training data. Here, RF showed the most improvement, increasing its accuracy to 0.75. LR slightly decreased to 0.73, and KNN’s performance dropped more notably to 0.65. These tables clearly demonstrate that the impact of SMOTE varies across different classifiers and that careful tuning and sampling are essential to achieving reliable performance in imbalanced medical datasets.
| Model | Accuracy | Classes | Precision | Recall | F1-score |
|---|---|---|---|---|---|
| RF (Tuned) | 0.75 | Class 0 | 0.84 | 0.76 | 0.80 |
| Class 1 | 0.62 | 0.74 | 0.68 | ||
| LR (Tuned) | 0.73 | Class 0 | 0.84 | 0.72 | 0.77 |
| Class 1 | 0.59 | 0.74 | 0.66 | ||
| KNN (Tuned) | 0.65 | Class 0 | 0.76 | 0.67 | 0.71 |
| Class 1 | 0.50 | 0.61 | 0.55 |
Error analysis
To assess the usefulness of the model in practice, we would provide error evaluation based on the confusion matrix and F1-scores of each class. The confusion matrix of the final hybrid model was quite good, with a minimal number of false negative and false positive cases than those of all the base learners. This is vital in the clinical arena, such that inability to classify diabetic patients (false negative) may result in delayed therapy and unfavourable health implications. The hybrid model was exact and also achieved good recall on the two classes, especially the highly sensitive positive (diabetic) values.
State of the art comparison
We evaluated the proposed model’s effectiveness by comparing its accuracy with that of existing research that employed ML methods to predict diabetes. Table 10 presents a review of various strategies, highlighting the accuracy improvements achieved by different ensemble and optimized methodologies. The proposed hybrid ensemble model, which integrates XGBoost with stacking classifier and tab transformer techniques, achieved a 99% accuracy rate, exceeding the predictive capabilities of previous models.
| Ref | Proposed technique | Accuracy |
|---|---|---|
| Gupta & Goel (2023) | RF with preprocessing techniques | 88.61% |
| Ulutas, Günay & Sahin (2024) | PSO-GWO optimized RF | 98% |
| Hasan et al. (2020) | RF with pima Indian dataset | 95% |
| Proposed | Hybrid Ensemble using XGBoost (Stacking + Tab Transformer) | 99% |
Conclusion and future directions
The accuracy of diabetes predictions has significantly improved through the integration of the tab transformer with a stacking ensemble model enhanced by a meta-learner utilizing XGBoost. This stacking ensemble model, which incorporates RF, KNN, and LR, surpasses the performance of the individual models. The tab transformer employs a self-attention mechanism that effectively captures complex relationships among features, thereby providing valuable insights into non-linear interactions among key variables. By incorporating XGBoost as a meta-learner, the predictive capabilities of these models have been further enhanced, resulting in more reliable and versatile outcomes. This mixed design has attained the mean accuracy of 97.92%, F1-score of 97.02%, and ROC-AUC of 99.58% in terms of 10-fold cross-validation. The overall performance of these results is a major improvement compared to the performance of the best individual model (RF) whereby its average F1-score and ROC-AUC were 64.87 and 83.99 respectively. To ascertain the statistical significance of these improvements, a paired t-test run between the hybrid model and the baseline stacking classifier was successful (p < 0.001). This approach underscores the significance of utilizing innovative ML techniques to address the challenges encountered in medical prediction tasks.
Limitations
While the results are promising, it is essential to acknowledge the research’s limitations. First, the dataset used for this work, the PIMA Indian Diabetes dataset, has 768 patient samples, which might restrict the model’s potential to generalize to a larger dataset. Furthermore, the absence of comprehensive hyperparameter tuning may have hindered the tab transformer’s predictive capabilities, thereby affecting its overall performance. Furthermore, although the model performed satisfactorily on the diabetic dataset, it requires evaluation on a broader range of real-world clinical datasets. Such assessments could introduce additional challenges, including issues related to class imbalances, noise, and missing values.
Future research
Future research should concentrate on optimizing the convergence and performance of the tab transformer. Key areas for investigation include hyperparameter tuning, regularization techniques, learning rate scheduling, and advanced optimization algorithms. Additionally, examining domain-specific feature engineering methods could facilitate a more effective capture of complex relationships within the data. To further improve model performance, it may be advantageous to explore alternative collaborative approaches and meta-learning strategies. Moreover, to evaluate the model’s generalizability and robustness, it is essential to test it across a diverse array of datasets, including real clinical data. Also, it is necessary to validate this model using larger, more varied external clinical data to see how applicable it would become to the real world. Lastly, to boost trust and transparency in the medical ML applications, future work can consider other ensemble techniques and explainability tools, such as SHapley Additive exPlanations (SHAP), to provide detailed feature attribution.