
Optimal design of artistic brand patterns based on visual perception and multi-model decision making
- Published
- Accepted
- Received
- Academic Editor
- Osama Sohaib
- Subject Areas
- Adaptive and Self-Organizing Systems, Algorithms and Analysis of Algorithms, Data Mining and Machine Learning, Data Science
- Keywords
- Visual perception, Multi-model decision making, Art bran patterns, Phase coherence, GRNN
- Copyright
- © 2025 Chen et al.
- Licence
- This is an open access article distributed under the terms of the Creative Commons Attribution License, which permits unrestricted use, distribution, reproduction and adaptation in any medium and for any purpose provided that it is properly attributed. For attribution, the original author(s), title, publication source (PeerJ Computer Science) and either DOI or URL of the article must be cited.
- Cite this article
- 2025. Optimal design of artistic brand patterns based on visual perception and multi-model decision making. PeerJ Computer Science 11:e3210 https://doi.org/10.7717/peerj-cs.3210
Abstract
The art brand pattern plays a pivotal role in shaping brand recognition and attractiveness. Evaluating and refining these patterns is essential to improve their overall quality. This study investigates the optimization of art brand patterns through the perspective of visual perception theory and multi-model decision-making methods. First, an image quality assessment model was developed based on the Feature Similarity Index Method (FSIM), which integrates phase consistency and contrast features to evaluate image quality. This was further extended into a color image evaluation approach, FSIM-C, by incorporating color space transformation. In addition, local spatial and frequency-domain information was extracted using a two-dimensional Log-Gabor filter to optimize the patterns. Several techniques were applied, including the Sobel operator for edge feature extraction, the Hue–Saturation–Value (HSV) model for color feature representation, and the spatial correlation index (SCI) method for texture feature analysis. The latter involved decomposing the image into sub-blocks and applying the Discrete Cosine Transform (DCT) to each block.
To construct a comprehensive evaluation framework, phase consistency, edge, color, and texture features were fused into an 11-dimensional feature vector. A regression strategy was then established using a Generalized Regression Neural Network (GRNN), aligning the mapping process with the characteristics of the human visual system. Experimental validation was conducted on two benchmark datasets, the Laboratory for Image and Video Engineering (LIVE) dataset and the Categorical Subjective Image Quality (CSIQ) dataset. Three regression models were compared—GRNN, Support Vector Machine (SVM), and Random Forest (RF)—with GRNN achieving the best performance, particularly on the LIVE dataset. The proposed multi-model decision-making scheme achieved Spearman Rank Order Correlation Coefficient (SROCC), Kendall Rank Order Correlation Coefficient (KROCC), Pearson Linear Correlation Coefficient (PLCC), and Root Mean Square Error (RMSE) values of 0.9236, 0.9167, 0.7634, and 0.5372, respectively. Compared with classical approaches such as Peak Signal-to-Noise Ratio (PSNR), FSIM, and Visual Information Fidelity (VIF), the proposed framework demonstrated significant improvements in image quality assessment.
Introduction
The rapid evolution of technology yields an immense volume of image data on the internet continuously. Initially, the human visual system forms an impression of an image through swift recognition of its appearance, subsequently extracting more substantial information from its content. To foster greater intelligence and human-like attributes in machines, it becomes imperative for them to acquire the ability to mimic the operational characteristics of the human visual system. A crucial facet of individuals’ visual perception of the world pertains to image aesthetic assessment (Deng, Loy & Tang, 2017). This holds particular significance in crafting and refining artistic brand patterns. Enhancing pattern quality through visual perception becomes essential during this process, as distinctive brand patterns facilitate swift brand recognition and retention among consumers, thereby amplifying a brand’s prominence and influence. Furthermore, post the optimization of the artistic brand pattern’s quality, infusion of creativity and allure becomes feasible. This in turn, captivates consumer attention and augments brand exposure, thereby establishing a robust framework for brand development. It aids in setting the brand apart, elevating its competitiveness, and consequently, capturing a larger market share.
Faced with an abundance of art brand patterns, manual scoring for image aesthetic assessment achieves notably precise results, termed subjective image quality evaluation (Zerunian et al., 2022; Yuan, Li & Chen, 2024). However, this method entails inefficiencies due to aesthetic fatigue and demands substantial human, material, and financial resources. As a viable solution, there is an increasing interest in indirectly assessing image quality through computational means, by simulating the functionality of the human eye using computer algorithms—a method known as objective image quality evaluation. This approach obviates the necessity for ongoing human involvement.
In the context of art brand patterns, achieving optimal design necessitates embracing objective image quality evaluation, leveraging artificial intelligence (AI)-driven sensory perception for pattern recognition and quality assessment. Although AI swiftly and accurately processes vast image data, supporting the optimization of art brand patterns, concerns arise within the literature (Jiang et al., 2022; Xiao et al., 2024). Ensuring the accuracy and reliability of AI algorithms stands as a critical challenge. Furthermore, the method’s reliance on copious training data and computational resources might escalate implementation complexities and costs. Crucially, elements like shape, color, texture, and varied visual perception evaluations among different demographic groups significantly influence optimal art brand pattern design. Hence, adopting a multi-model decision-making (Li et al., 2022; Hou et al., 2023) approach becomes imperative to enhance accuracy and stability in this design process. However, multi-model decision-making confronts challenges, notably in selecting and amalgamating different models. Moreover, its reliance on increased computational resources and time might constrain applications requiring high real-time capabilities.
Recent investigations reveal a parallel with the challenges highlighted in the aforementioned literature, where prevailing solutions primarily rely on visual perception for image recognition, detection, quality assessment and optimization. This unilateral focus can introduce inefficiencies and biases in optimizing artistic brand patterns by overemphasizing a singular factor. Additionally, the current approach necessitates numerous iterations to attain relatively stable performance in training regression models. Therefore, this article endeavors to enhance art brand pattern optimization by training regression models grounded in visual perception and employing a multi-model decision-making framework. The primary contributions of this work encompass:
-
(1)
Facilitating the efficient extraction of phase coherence features: The article introduces an image quality assessment based on Feature Similarity Index Method (FSIM), calculating phase coherence feature similarity and gradient magnitude similarity between reference and test images, further consolidating features. Additionally, a two-dimensional Log-Gabor filter is introduced to efficiently extract local spatial and frequency domain information, optimizing phase coherence feature extraction.
-
(2)
Ensuring efficient and accurate extraction of image edge, color, and texture features: Leveraging the efficient Sobel operator for image edge extraction, employing the Hue–Saturation–Value (HSV) model for color feature extraction.
-
(3)
Implementation of a Generalized Regression Neural Network (GRNN)-based regression model for image quality assessment: The construction of an 11-dimensional image feature vector integrates phase coherence, image edge, color, and texture features. Finally, a regression model for image quality assessment is devised using the GRNN method, mapping subjective image scores in line with human visual system perceptions.
‘Related Works’ will delineate the current landscape of image quality detection and evaluation optimization, along with the contemporary application of visual perception in image quality detection approaches.
Moving to ‘Methodology’, this article will unveil the optimization framework for art brand pattern design, rooted in visual perception and multi-model decision-making. The framework culminates in an 11-dimensional feature vector amalgamating phase consistency, image edges, color, and texture features. The section will also expound upon the construction of a regression model based on GRNN within machine learning, fostering the design of optimized art brand patterns through image quality assessment.
‘Experiments and Analysis’ will delve into experimental results, scrutinizing the performance of the framework. It will discuss the impact of employing Generalized Regression Neural Network, Support Vector Machine, and Random Forest during the regression model construction phase. Furthermore, this section will compare the performance of the proposed framework with classical approaches.
Lastly, ‘Conclusion’ will encapsulate a comprehensive summary. It will evaluate the efficacy of the optimization model crafted in this article for image quality detection and assessment, particularly its reliance on visual perception and multi-model decision-making. The section will also elucidate its practical application in optimizing art brand patterns.
Related works
In recent years, the heightened reliance on image-based information has sparked considerable interest in image quality evaluation techniques across various research institutions globally. These evaluation methods bifurcate into two distinct categories based on their reliance on human eye subjective perception: subjective evaluation and objective evaluation.
Subjective evaluation involves human observers as the evaluative subject. It begins with establishing a rational evaluation criterion, followed by multiple observers assessing the image’s quality in alignment with this standard. Conversely, objective image quality evaluation harnesses computer technology to appraise test images using models, generating results aligned with subjective evaluation experiments. The exploration of objective perspectives traverses multiple disciplinary domains. By delving into the intricacies of the human visual system (Guo et al., 2022), visual perception characteristics (Bezrukikh & Terebova, 2009), image processing technology (Ngugi, Abelwahab & Abo-Zahhad, 2021), psychophysics (Saberi & Hickok, 2023), and other theoretical techniques, the realm of objective image quality assessment continues to witness ongoing advancements. Objective image quality assessment branches into three categories: Full-Reference Image Quality Assessment (FR-IQA) (Ahn, Choi & Yoon, 2021), Semi-Reference Image Quality Assessment (Reduced-Reference Image Quality Assessment, RR-IQA) (Abbas et al., 2020), and Blind No-Reference Image Quality Assessment (BIQANR-IQA).
FR-IQA demands complete reference image information to evaluate test image quality. In the sphere of image quality evaluation, the reference image epitomizes “perfect quality,” rendering FR-IQA pivotal in optimizing art branding patterns. Studies in FR-IQA (Yang, Wang & Ji, 2020) have identified brightness and contrast feature information as pivotal factors influencing image quality. These studies amalgamate structural, luminance, and contrast feature information to propose FR-IQA methods based on structural similarity. Additionally, literature (Ge et al., 2022) introduces a structural similarity model predicated on image edges, employing the Sobel operator (Chaple, Daruwala & Gofane, 2015) and edge histogram (Acharya & Ghoshal, 2022) to articulate image structural feature information. Moreover, in Zhou et al. (2022) and Sharifrazi et al. (2021), preprocessing involves Sobel filtering, culminating in the extraction of the image’s gradient magnitude map. This process, combined with image luminance and contrast information (Chen, Jiang & Kamruzzaman, 2020), contributes to a structural similarity model based on gradient images.
The notable models in this domain encompass the Visible Difference Predictor (VDP) model introduced by Ansarullah et al. (2022) and the Sarnoff Visual Discrimination Model (SVDM) outlined in literature (Azari, Bertel & Wüthrich, 2018). The VDP model utilizes the Watson cortical transformation to disintegrate image information across various spatial layers with distinct orientations. It subsequently derives evaluation metrics by normalizing intensity probabilistic detection outcomes. This process involves decomposing image information via the Watson cortical transform onto multiple spatial layers, ultimately computing evaluation metrics grounded in normalized intensity probabilistic detection. Conversely, the SVDM model estimates the objective quality of the test image by gauging the visual variance between the test image and a reference image. It computes the probability of this variance to ascertain the objective quality of the test image. Building upon this framework, the Human Visual System (HVS) model emerged (Du et al., 2022; Taghipour & Ghassemian, 2021). Lindsay (2021) delves into human visual properties by employing sparse coding (Xu, Deng & Xu, 2022) within the framework of visual neural networks. It treats an n-dimensional random vector as a collection of mutually independent basis vectors obtained via linear superposition.
Expanding on these concepts, literature (Judith, Priya & Mahendran, 2022) employs multidimensional independent component analysis (ICA) for natural image data analysis. It aims to extract motion data from video frames using the ICA algorithm for video quality evaluation. Furthermore, literature (Algumaei et al., 2023) decomposes color images into three spaces—R, G, and B—extracting image blocks from identical positions within each space. These blocks are stretched into one-dimensional column vectors, and the ICA algorithm is employed to extract feature values. Lastly, literature (Zhang et al., 2015) directly dissects color images into the R, G, and B spaces, extracting image blocks from corresponding positions in each space. These blocks are subsequently transformed into one-dimensional column vectors and trained using the ICA algorithm to extract image feature values.
In essence, full-reference evaluation methods primarily focus on extracting pertinent features and establishing evaluations based on human visual system (HVS) characteristics and image content information.
For instance, literature (Wang et al., 2022) analyzes the intrinsic geometric features of natural images in tandem with visual perception characteristics, proposing the Mean Geometric Structural Distortion Model (MGSD). This model combines edge direction, gradient magnitude, and edge geometric features to assess image quality. Other similar methods include those founded on the image gradient magnitude similarity bias model (Vannesjo et al., 2016), structural similarity models integrating content information weighting (Nasiri, Berahmand & Li, 2023), multi-scale structural similarity models (Lee, Peluffo-Ordóñez & Verleysen, 2015), and structural similarity models operating in the complex wavelet transform domain (Halidou et al., 2023). Literature (Ohashi et al., 2023) introduces a Feature Similarity (FSIM) model by combining image phase coherence and gradient feature information, while literature (Reisenhofer et al., 2018) augments FSIM by leveraging the Haar wavelet transform for preprocessing, establishing a full-reference image quality evaluation method.
These methods emulate the human visual system’s perception of image quality through mathematical model construction, albeit they may pose higher computational demands and exhibit complexity in comprehension. Additionally, the Haar wavelet operator, primarily utilized in signal and image processing for data compression and feature extraction, might not suitably align with art brand pattern optimization. This operator is relatively less efficient compared to the Sobel operator, which excels in edge detection in computer vision by approximating gradients within the image luminance function. Hence, this article proposes employing the Sobel operator for feature extraction. Leveraging machine learning and convolutional neural networks, it aims to fuse visual perception characteristics and image features, facilitating multi-model decision-making for assessing and optimizing art brand pattern quality.
Methodology
The experimental setup was implemented on a Windows 10 (64-bit) system, equipped with an Intel Core i7 (9th generation) processor, 16 GB RAM, and an NVIDIA GeForce RTX 2060 GPU with 6 GB VRAM. All computational models and simulations were developed using MATLAB R2021b and Python 3.8, leveraging libraries such as scikit-learn, OpenCV, and NumPy. Two publicly available image quality datasets, Laboratory for Image and Video Engineering (LIVE) and Categorical Subjective Image Quality (CSIQ), were utilized to evaluate and validate the proposed method. Prior to analysis, all images were normalized to ensure consistency in lighting, contrast, and resolution. Images were then decomposed into smaller sub-blocks to enable localized feature extraction.
For the assessment of visual quality, a variety of perceptual features were extracted. The FSIM metric was used to compute phase consistency and contrast-based evaluations. The FSIM framework was further extended to color images through HSV color space transformation. Edge features were obtained using the Sobel operator, while frequency-domain characteristics were captured via a two-dimensional Log-Gabor filter. Texture features were analyzed using the Spatial Correlation Index (SCI) computational model, and the Discrete Cosine Transform (DCT) was applied to each image block to encode localized texture information. These diverse features were fused into an 11-dimensional feature vector to comprehensively describe each image. This vector served as input to a set of regression models. Among the models tested—Support Vector Machine (SVM), Random Forest (RF), and GRNN—the GRNN was selected as the primary model due to its superior performance and its ability to align closely with the human visual system’s perception of image quality.
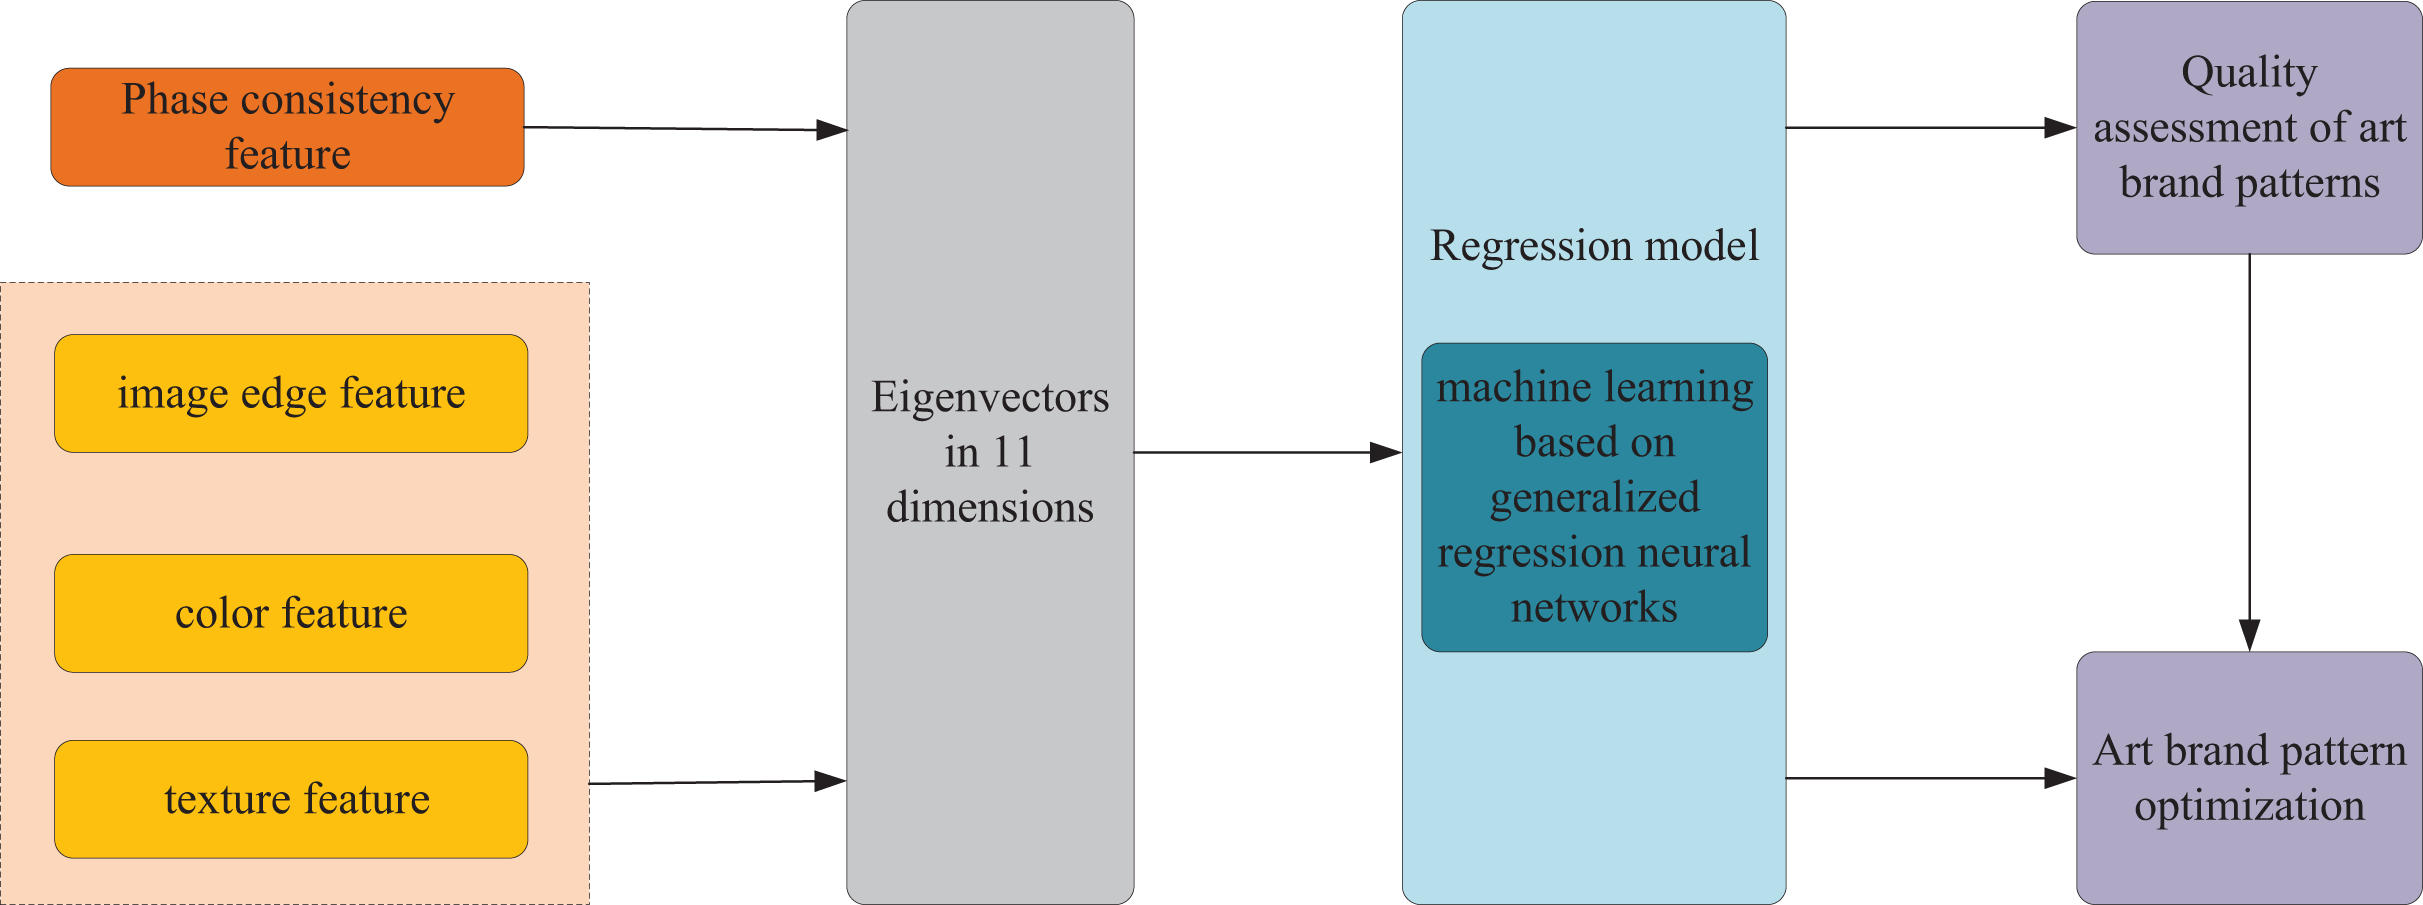
The constructed flowchart delineating the optimization scheme for art brand patterns, rooted in visual perception and multi-model decision-making, is depicted in Fig. 1. It entails the extraction and fusion of phase consistency, image edges, colors, and texture features, amalgamating them into final feature vectors. Subsequently, a GRNN-base approach is employed for regression model training. This facilitates enhancement in performance indexes related to image quality assessment. The overarching goal is to offer guidance for optimizing art branding patterns.
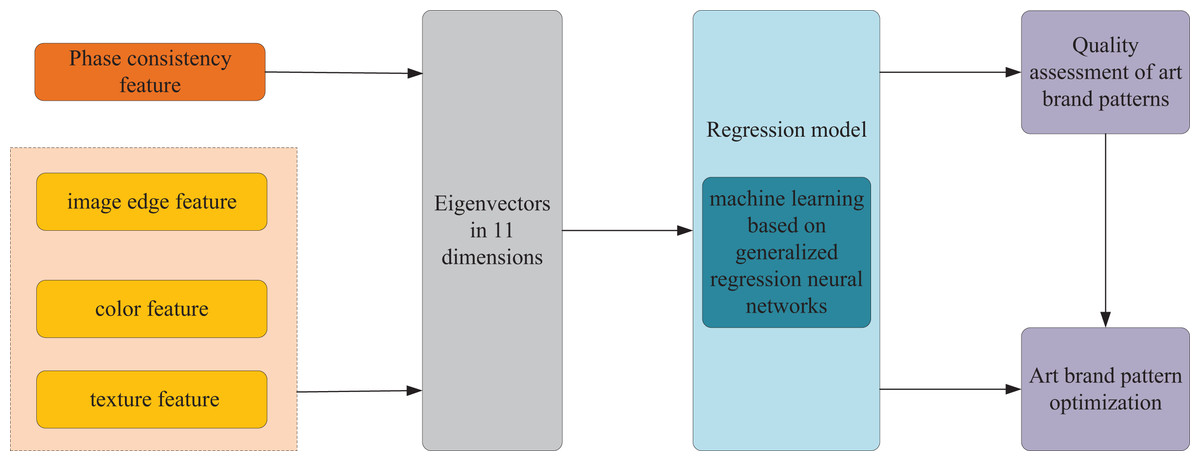
Figure 1: Model frame drawing.
Image quality assessment based on FSIM
In the realm of image visual perception, research in physiological psychology underscores the pivotal role of phase information. Human perceptual focus within an image correlates intimately with its phase consistency in the frequency domain. The human visual system demonstrates a pronounced inclination toward regions exhibiting high phase consistency within an image. Consequently, in the optimal design of art brand patterns, the extraction of phase consistency features becomes instrumental in achieving precise edge detection.
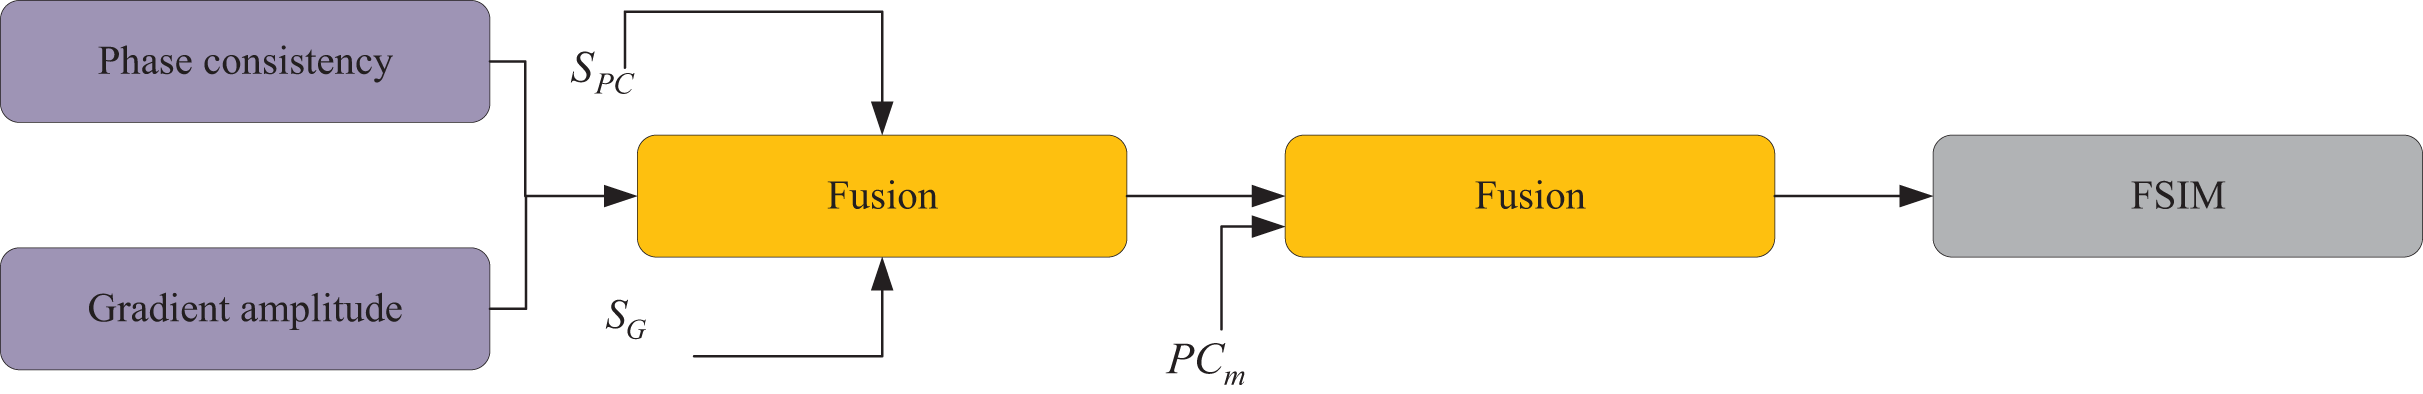
The FSIM method amalgamates the image’s phase consistency and contrast characteristics to holistically evaluate image quality. Through color space conversion, the FSIM method yields a means of evaluating color image quality. This entire process is delineated in Fig. 2.
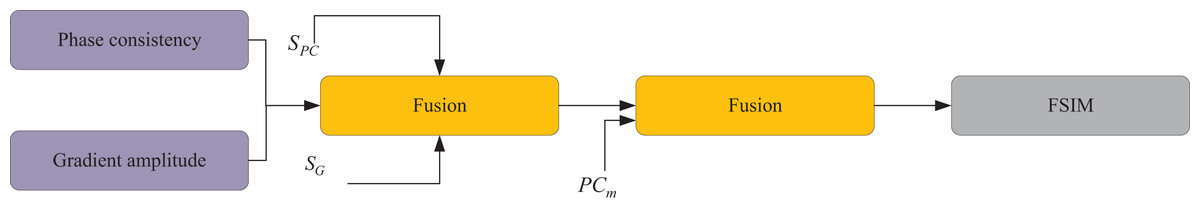
Figure 2: FSIM calculation process.
Notably, image phase consistency remains unaffected by alterations in image contrast. Given the substantial impact of image contrast on perceived image quality, the FSIM method represents image contrast via the magnitude of image gradient within it.
Calculate the similarity of phase consistency features and the similarity of gradient magnitude of the reference image and the test image respectively, and the calculation method of is shown below:
(1) where and are the phase consistency of the reference image and test image respectively, and is a constant greater than 0 to avoid the denominator converging to zero. Assuming ε be a constant greater than 0 to avoid the denominator tends to zero, then the image phase consistency (PC) is calculated as follows:
(2) where denotes the local amplitude in the direction on the scale, calculated as follows:
(3)
Next the local energy values in the direction of can also be calculated based on the return value and of the position of the image pixel , i.e., the response of the even- and odd-symmetric filtering:
(4)
In summary we calculate the final results of FSIM to improve the fusion phase coherence and contrast features to evaluate the image quality:
(5)
(6)
Image information feature extraction based on HSV
To facilitate multi-model decision-making in optimizing the evaluation of art branding patterns, we undertake supplementary extraction of image edge, color, and texture features. To capture the edge features within the image, we leverage the efficient Sobel operator, a robust method for extracting intricate edge features from the image. For the image IMG(x), let be the operator in its x-direction and be the operator in its y-direction. In this case, the gradient magnitude in x and y direction is calculated as follows:
(7)
(8)
Equation (9) illustrates the computation of the image’s gradient magnitude, capturing the edge features through mathematical representation. Meanwhile, Eq. (10) delineates the determination of the gradient direction, which encapsulates crucial information regarding the image’s edge characteristics.
(9)
(10)
For the colour features of the image, we use the HSV model, whose conversion is as follows:
(11)
The computation of texture features within the image involves the SCI method, which entails decomposing the image into N*N sub-blocks and individually applying the DCT to each sub-block.
For a given sub-block, denoted as A, its SCI is determined as the ratio between its contrast intensity and structural intensity, computed as follows:
(12) where denotes the contrast intensity, denotes the randomness of the texture pattern, which can be used to represent the structure of the image scene texture, and are all model coefficients. The equation is the i-order moment of the DCT domain AC coefficients normalised to the following calculation:
(13)
Since is used in the study of image quality. The larger it is, the lower the texture complexity and the higher the sensitivity to its distortion. In summary, we can get calculated as follows:
(14)
Multi-model decision making
Based on the features extracted in ‘Image quality assessment based on FSIM’ and ‘Image information feature extraction based on HSV’, we next come to construct the feature vector f of the image based on a multi-model decision strategy:
(15)
The evaluation of the quality score (Q) for the art brand pattern image is derived through the feature vector (f) as defined in Eq. (15). Subsequently, a mapping function Y(), establishing the relationship between the feature vector (f) and the image quality score (Q), is constructed.
Commonly employed traditional methods such as average and weighted average methods lack effective theoretical foundations and are deemed relatively ineffective in constructing the mapping function Y(). To address this, in this section, we adopt the GRNN method within machine learning. This method enables training to obtain the mapping function Y(), aiming to align with the visual perception of the human visual system. The mapping strategy is derived from subjective image scores, acquired through a learning-based training approach.
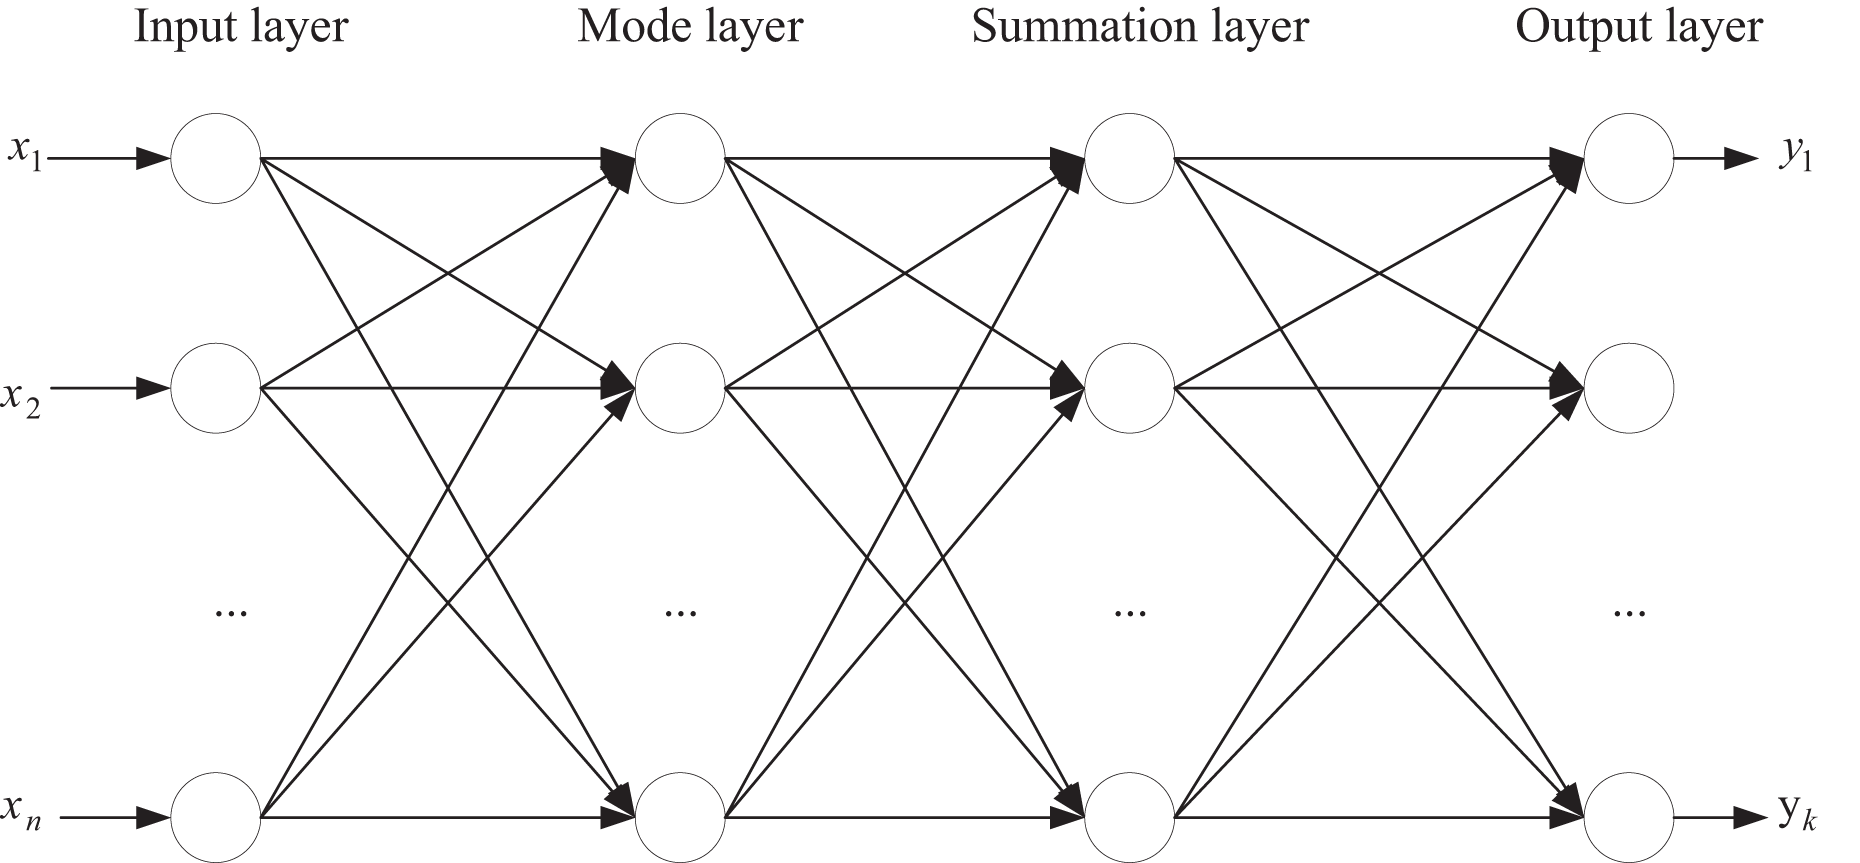
Figure 3 illustrates the architecture of the constructed GRNN. Within the framework of GRNN, feature importance analysis can be achieved by examining the connection weights from the input layer to the hidden layer. Given that the hidden-layer neurons in GRNN directly correspond to training samples and the output is a weighted average of the outputs from these hidden-layer neurons, the connection weights can indirectly reflect the contribution of input features to the output. Specifically, the absolute value average or sum of each feature’s connection weights across all hidden-layer neurons can be calculated as a quantitative measure of that feature’s importance. A higher importance score indicates a more significant role of the feature in the regression model. By comparing the importance scores of different features, the relative importance of each feature within the GRNN model can be clarified, providing a basis for feature selection and model optimization.
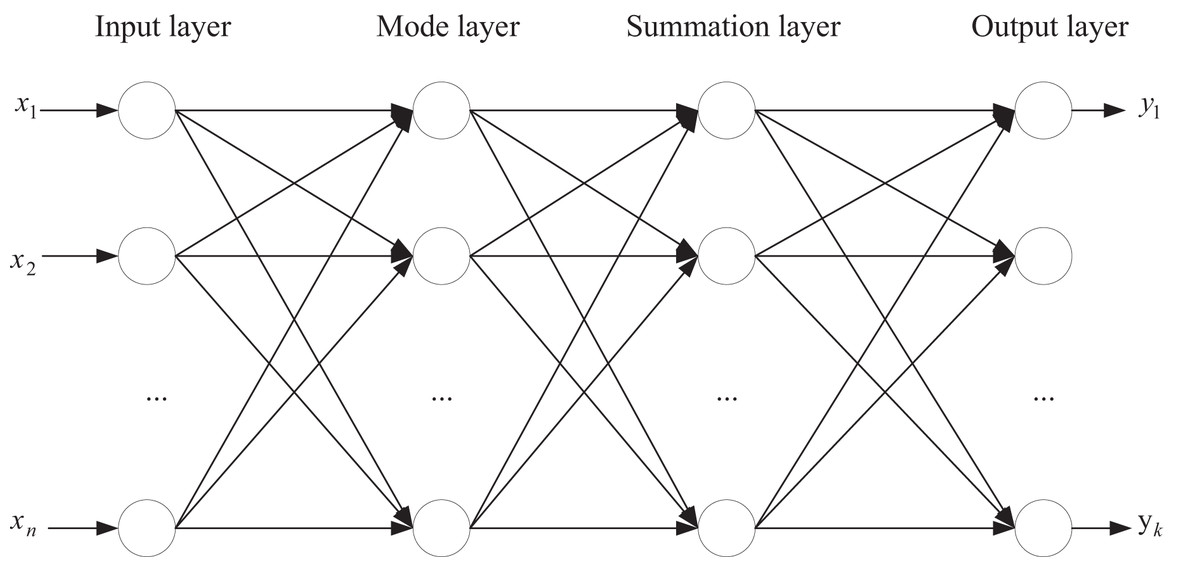
Figure 3: Establishment of regression model based on GRNN.
Within the input layer, the test sample data is fed. The node count in the input layer aligns with the feature dimensions of the sample data, conFigure d here as an 11-dimensional feature similarity vector. The pattern layer comprises neurons equivalent to the number of input sample data, with each neuron corresponding to a specific sample data entry.
The summation layer output bifurcates into two segments. It houses an additional layer of nodes compared to the schema layer. The initial node represents the summation of all schema layer outputs. Subsequent nodes output weighted sums of schema layer outputs individually. The output layer node count corresponds to the labeling dimension of the sample data. Each output node delivers a ratio of the corresponding summation layer output to the first node’s output in the summation layer. In this context, the sample data’s labels are the subjective evaluation scores assigned to the test images.
This network configuration allows for objective image quality evaluation using GRNN. GRNN can directly simulate the nonlinear response characteristics within the human visual system through its hidden-layer neurons, enabling it to capture the complex mapping relationship between image features and subjective quality assessments. This closely aligns with the human eye’s perception mechanism for image quality. Secondly, during the training process, GRNN does not require iterative parameter optimization; instead, it makes predictions based on information from the entire training set. This effectively avoids overfitting issues and, particularly in scenarios with limited sample sizes, demonstrates stronger generalization capabilities.
Experiments and analysis
In this section, a comparative analysis is conducted on the proposed scheme, focusing primarily on the performance assessment across three distinct regression models: GRNN, SVM, and RF. This evaluation is executed on two datasets, namely LIVE and CSIQ.
The performance metrics of the proposed scheme are juxtaposed against three prevailing classical schemes: FSIM (Ohashi et al., 2023), Peak Signal to Noise Ratio (PSNR) (Mozhaeva et al., 2021), and Visual Information Fidelity (VIF) (Lahoulou et al., 2013). Ultimately, the validation of the results is carried out by scrutinizing the outcomes across both datasets. This comparative analysis aims to discern and verify the efficacy of the proposed scheme in relation to established methodologies, showcasing its performance under various regression models and datasets.
During the experimental process, we randomly divided each dataset into training, validation, and test sets at a ratio of 7:1.5:1.5. Specifically, the training set was utilized for model parameter learning and optimization, the validation set for hyperparameter tuning and model selection, and the test set was kept entirely independent for final performance evaluation. Additionally, to prevent data leakage, all images underwent preprocessing to ensure no overlap and the division process employed stratified sampling at the image ID level. This approach maintained consistent distributions of key attributes, such as style and complexity, across the subsets.
Experimental indicators
In assessing the optimization method for image quality evaluation, it becomes essential to gauge the accuracy and stability of the evaluation process. Parameter optimization methods are adjusted based on effective performance indices. In this article, the evaluation of image quality evaluation methods will rely on the following performance assessment metrics: Spearman Rank-Order Correlation Coefficient (SROCC), Kendall Rank Correlation Coefficient (KROCC), Pearson Linear Correlation Coefficient (PLCC), Root Mean Square Error (RMSE).
These metrics serve as pivotal indicators for evaluating the accuracy, consistency, and effectiveness of the image quality evaluation methods, enabling a comprehensive assessment of their performance.
SROCC is calculated as follows:
(16)
and are the subjective and objective evaluation scores of the i-th image, respectively. N represents the count of images involved in the computation. Within the range of [−1:1], SROCC is also referred to as the nonparametric correlation coefficient. Unlike a measure of linear correlation, SROCC assesses order correlation, rendering it resilient against nonlinear transformations of subjective and objective evaluation outcomes. It quantifies the monotonic correlation between subjective and objective evaluation results.
KROCC is calculated as follows:
(17)
is the same sequence pair, is the inverse sequence pair. N is the total number of pairs and the value range of KROCC is [−1:1], similar to SROCC, KROCC serves as an indicator of the monotonic relationship between subjective and objective evaluation results. Its absolute value approaching 1 signifies a stronger alignment between objective and subjective assessments, indicating higher accuracy. A value closer to 1 implies a more accurate representation of the relationship between subjective and objective evaluation outcomes.
PLCC is calculated as follows:
(18)
and are the subjective and objective evaluation scores of the i-th image, and are the mean value of the subjective evaluation scores and the mean value of the objective evaluation scores, respectively, and N is the number of images involved in the calculation.
RMSE is calculated as follows:
(19)
Performance comparison
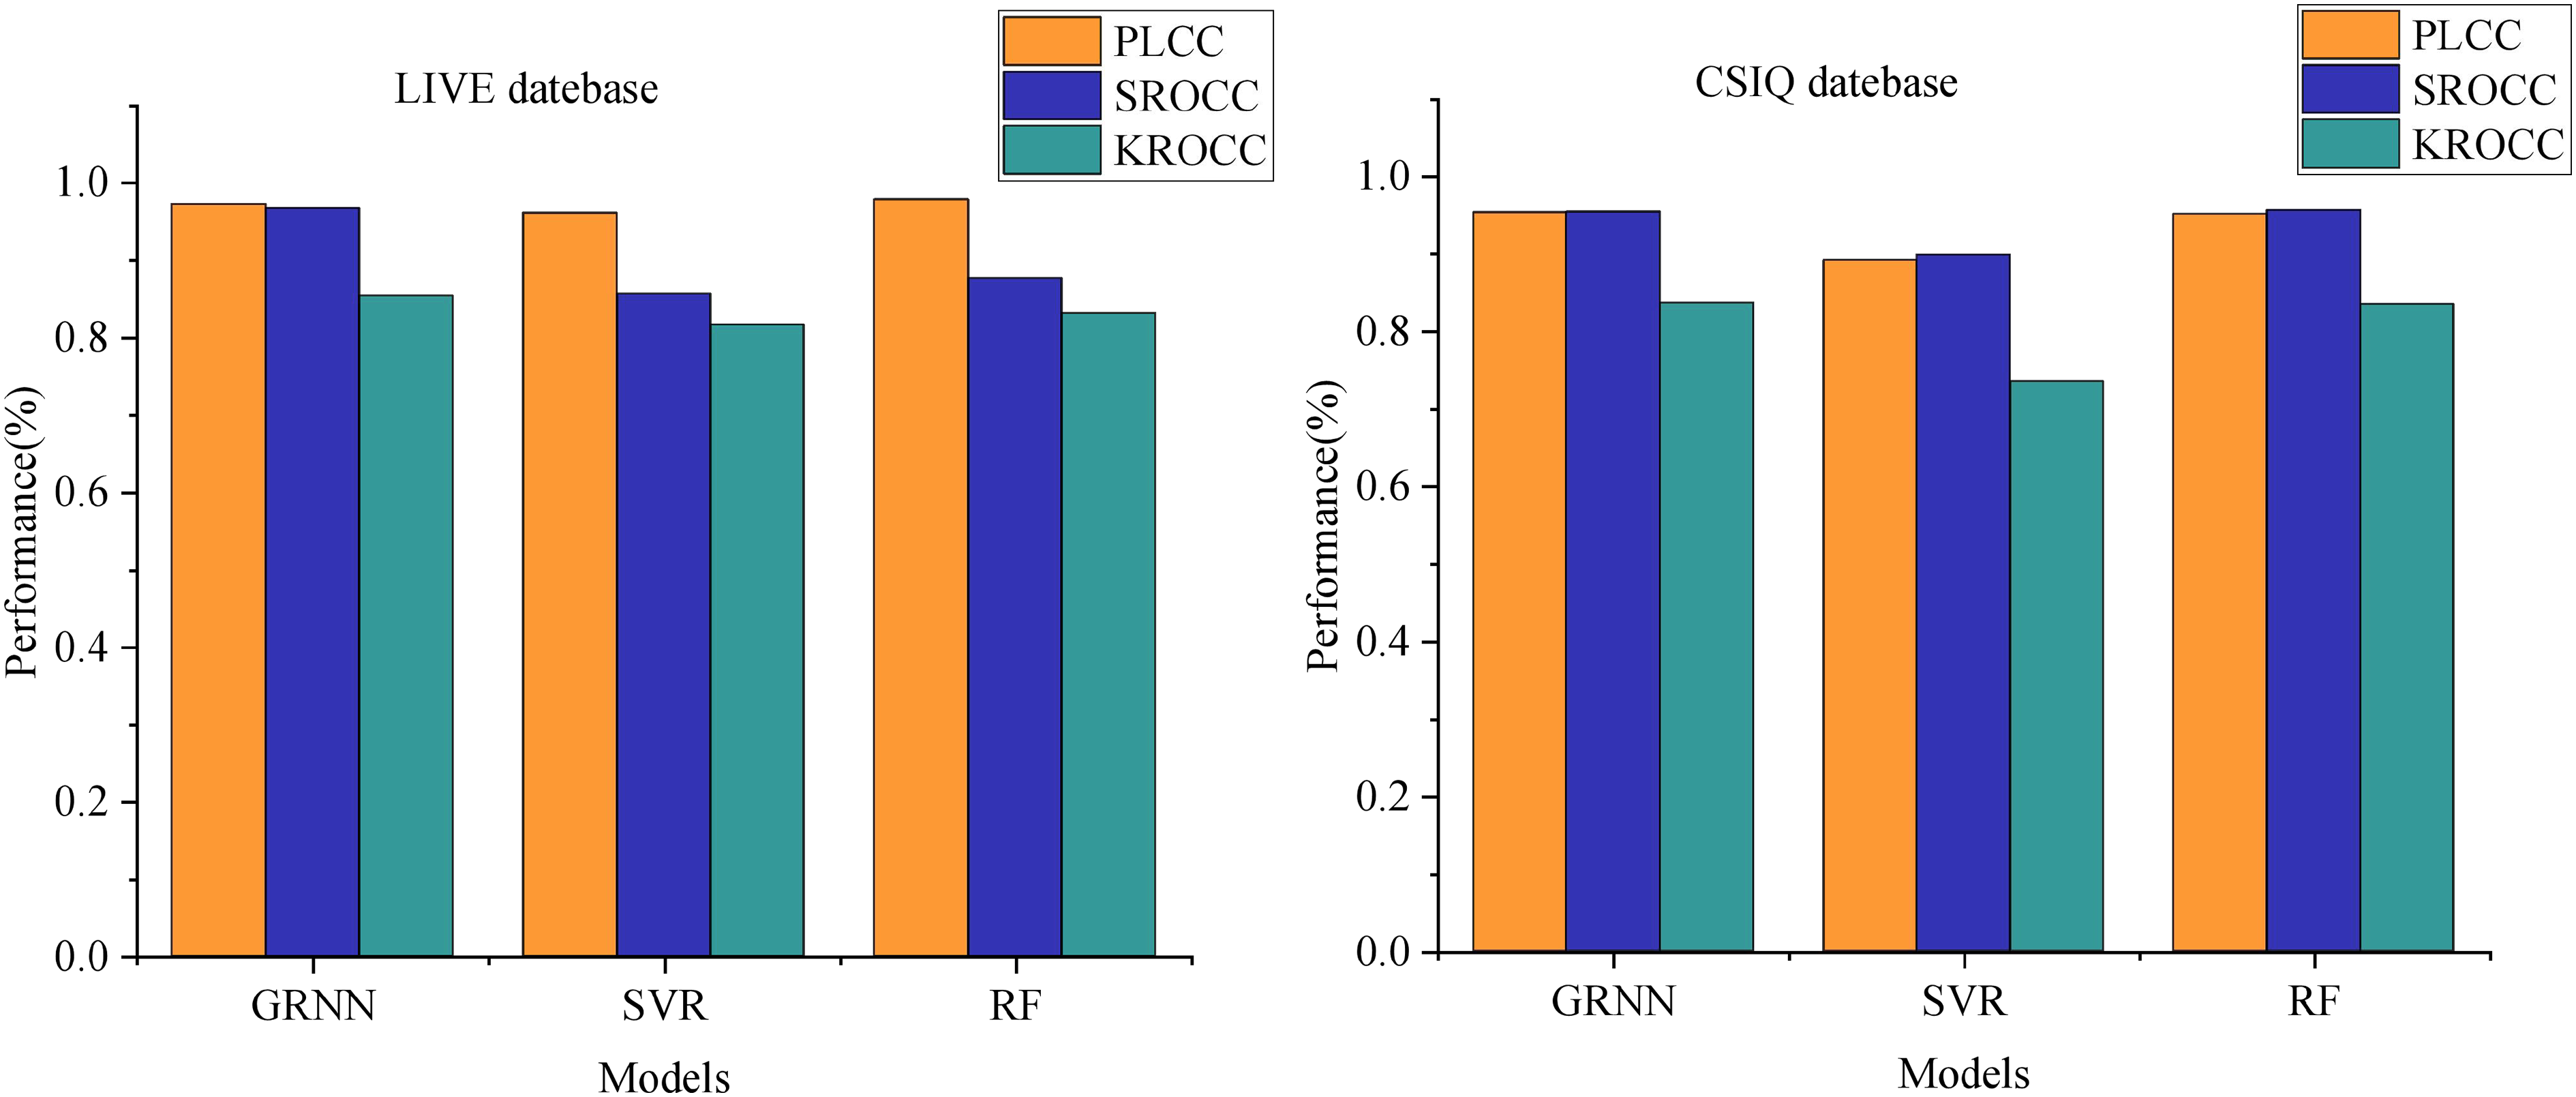
We employed a Log-Gabor filter bank consisting of eight orientations (0°, 45°, 90°, 135°, 180°, 225°, 270°, 315°) and four scales to comprehensively capture diverse frequency and directional information within the images. In our experimental comparison, we assessed three regression methods—GRNN, SVM, and RF—utilizing the same k-fold cross-validation approach across two databases. Figure 4 illustrates the comparison of performance metrics PLCC, SROCC, and KROCC.
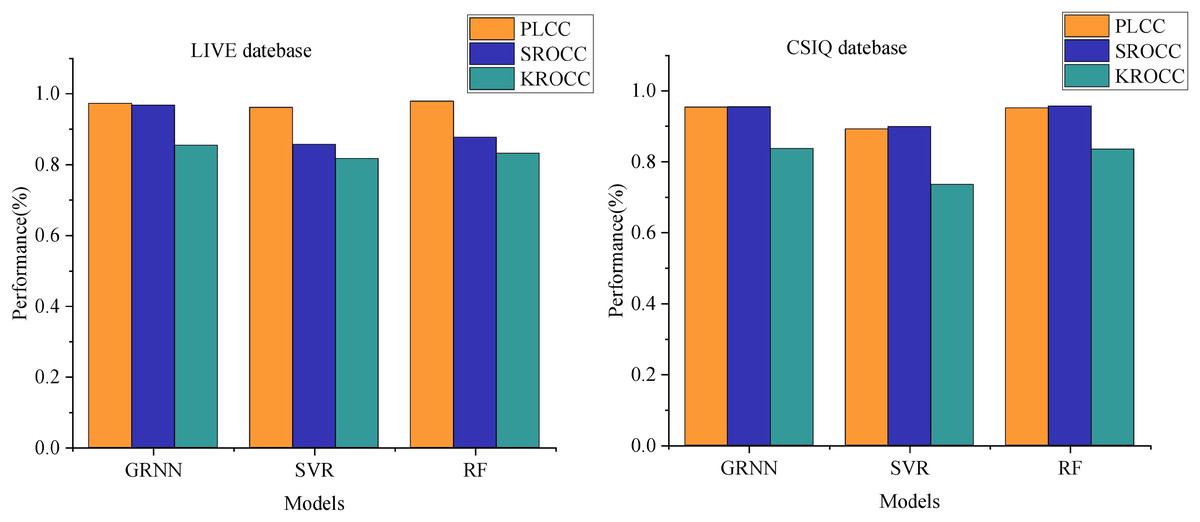
Figure 4: Comparison of PLCC, SROCC and KROCC performance under different regression models.
For GRNN on the LIVE dataset, PLCC stands at 0.9725, SROCC at 0.9674, and KROCC at 0.8535. Notably, Support Vector Machine demonstrates the poorest performance across metrics on the LIVE dataset, with KROCC displaying the weakest performance among the three metrics. Although RF achieves a slightly higher PLCC of 0.9783 compared to GRNN, its SROCC and KROCC scores on the LIVE dataset, at 0.8765 and 0.8315 respectively, are notably lower than those of GRNN.
Similar trends are observed in the CSIQ dataset. GRNN attains PLCC, SROCC, and KROCC scores of 0.9536, 0.9543, and 0.8367 respectively. Despite RF demonstrating a marginally higher SROCC than GRNN on the CSIQ dataset, the other two metrics notably lag behind. This analysis highlights the significant enhancement in model performance achieved by employing GRNN for training image quality score mapping through multi-model decision making.
Additionally, we conducted a detailed evaluation of the model performance after feature selection and dimensionality reduction. By calculating the correlation coefficients among features and applying principal component analysis (PCA) to reduce the 11-dimensional features to eight dimensions, the model’s performance on the test set improved significantly: specifically, the Pearson Linear Correlation Coefficient (PLCC) increased from 0.7634 to 0.7892, while the Spearman Rank Order Correlation Coefficient (SROCC) rose from 0.9236 to 0.9351. Meanwhile, the model training time was reduced by approximately 30%. This demonstrates that the dimensionality-reduced model effectively reduces feature redundancy and computational burden while maintaining high evaluation accuracy, validating the positive impact of feature selection and dimensionality reduction strategies on enhancing model performance.
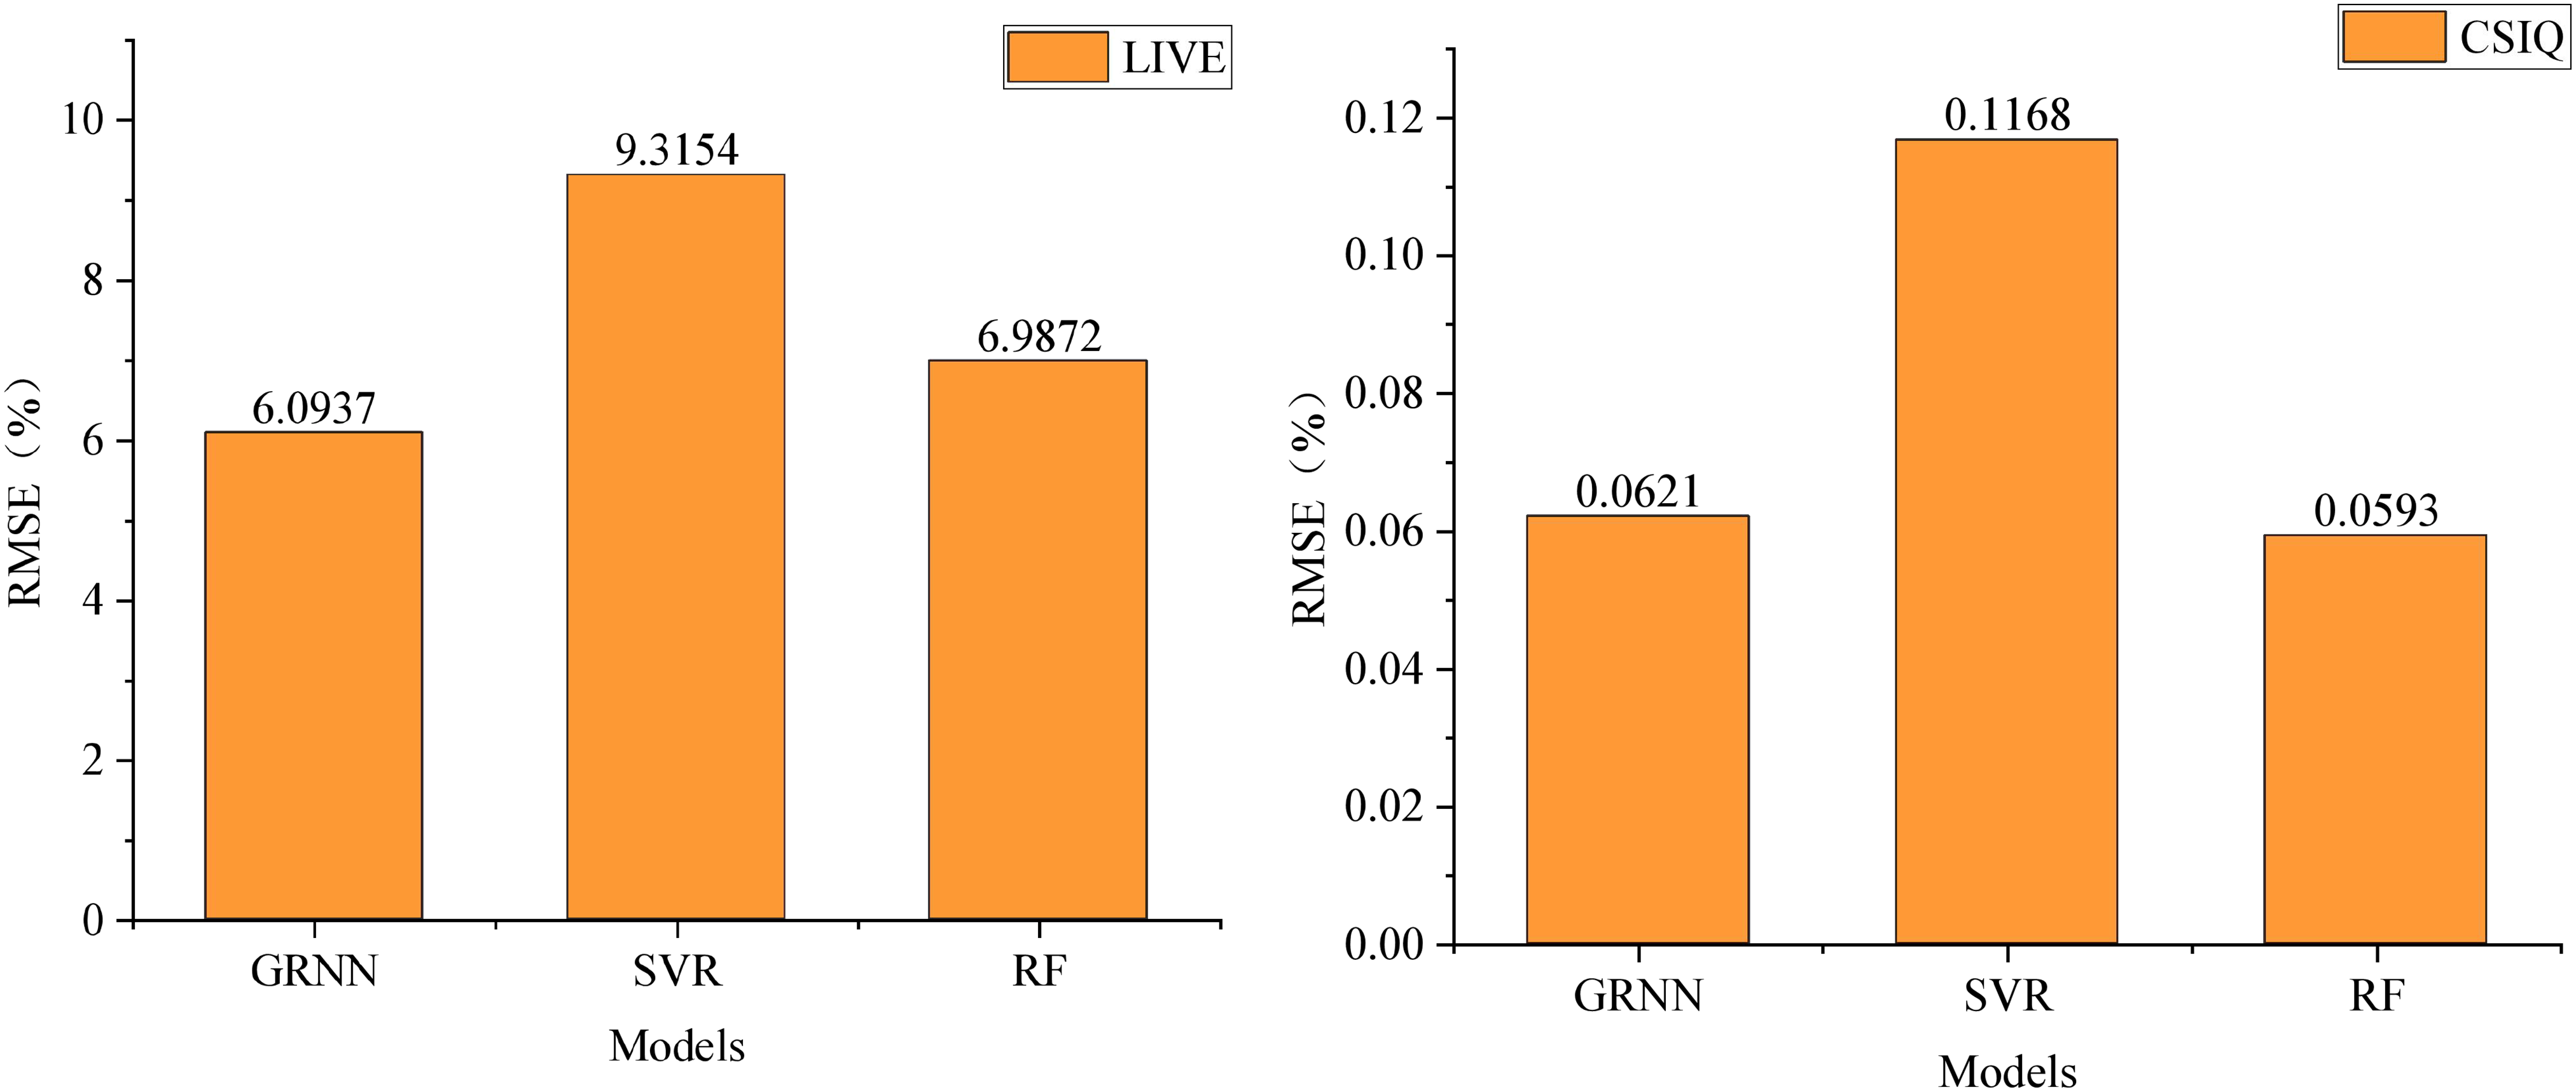
Forest on the two datasets, RMSE serves as the benchmark in Fig. 5. A smaller RMSE value signifies superior performance in image quality evaluation methods. On the LIVE dataset, GRNN demonstrates an RMSE of 6.0937, notably lower by approximately 3.3 and 0.9 compared to Support Vector Machine and Random Forest, respectively. Meanwhile, on the CSIQ dataset, GRNN showcases an RMSE of 0.0621, again outperforming SVM and RF.
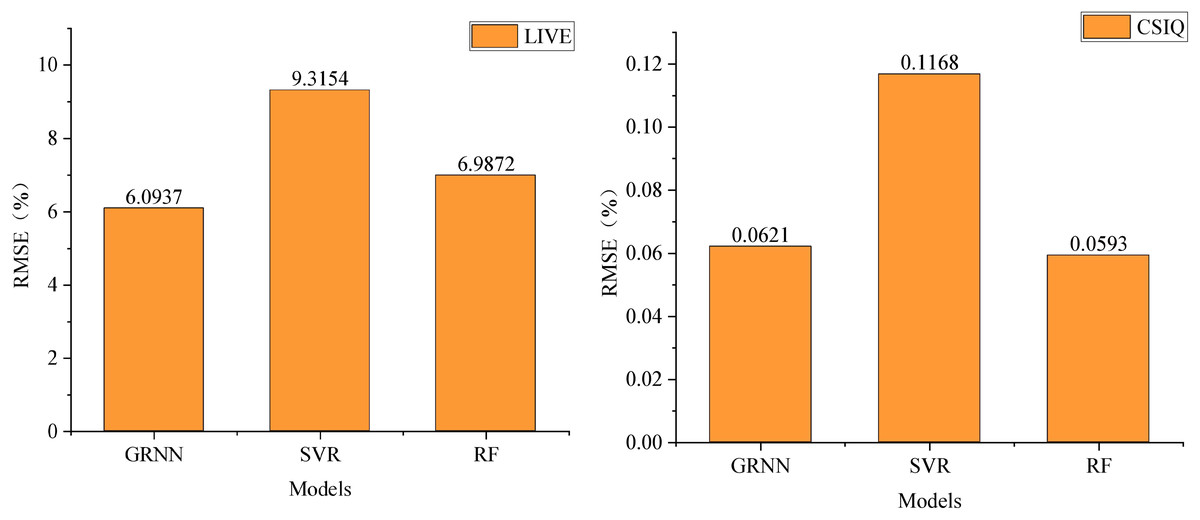
Figure 5: Comparison RMSE performance under different regression models.
This comparison underscores the superiority of the GRNN method over SVM and RF in terms of performance. Therefore, within this scheme, the adoption of GRNN for learning and training the regression model to establish the mapping relationship between image features and image quality is preferred due to its enhanced performance.
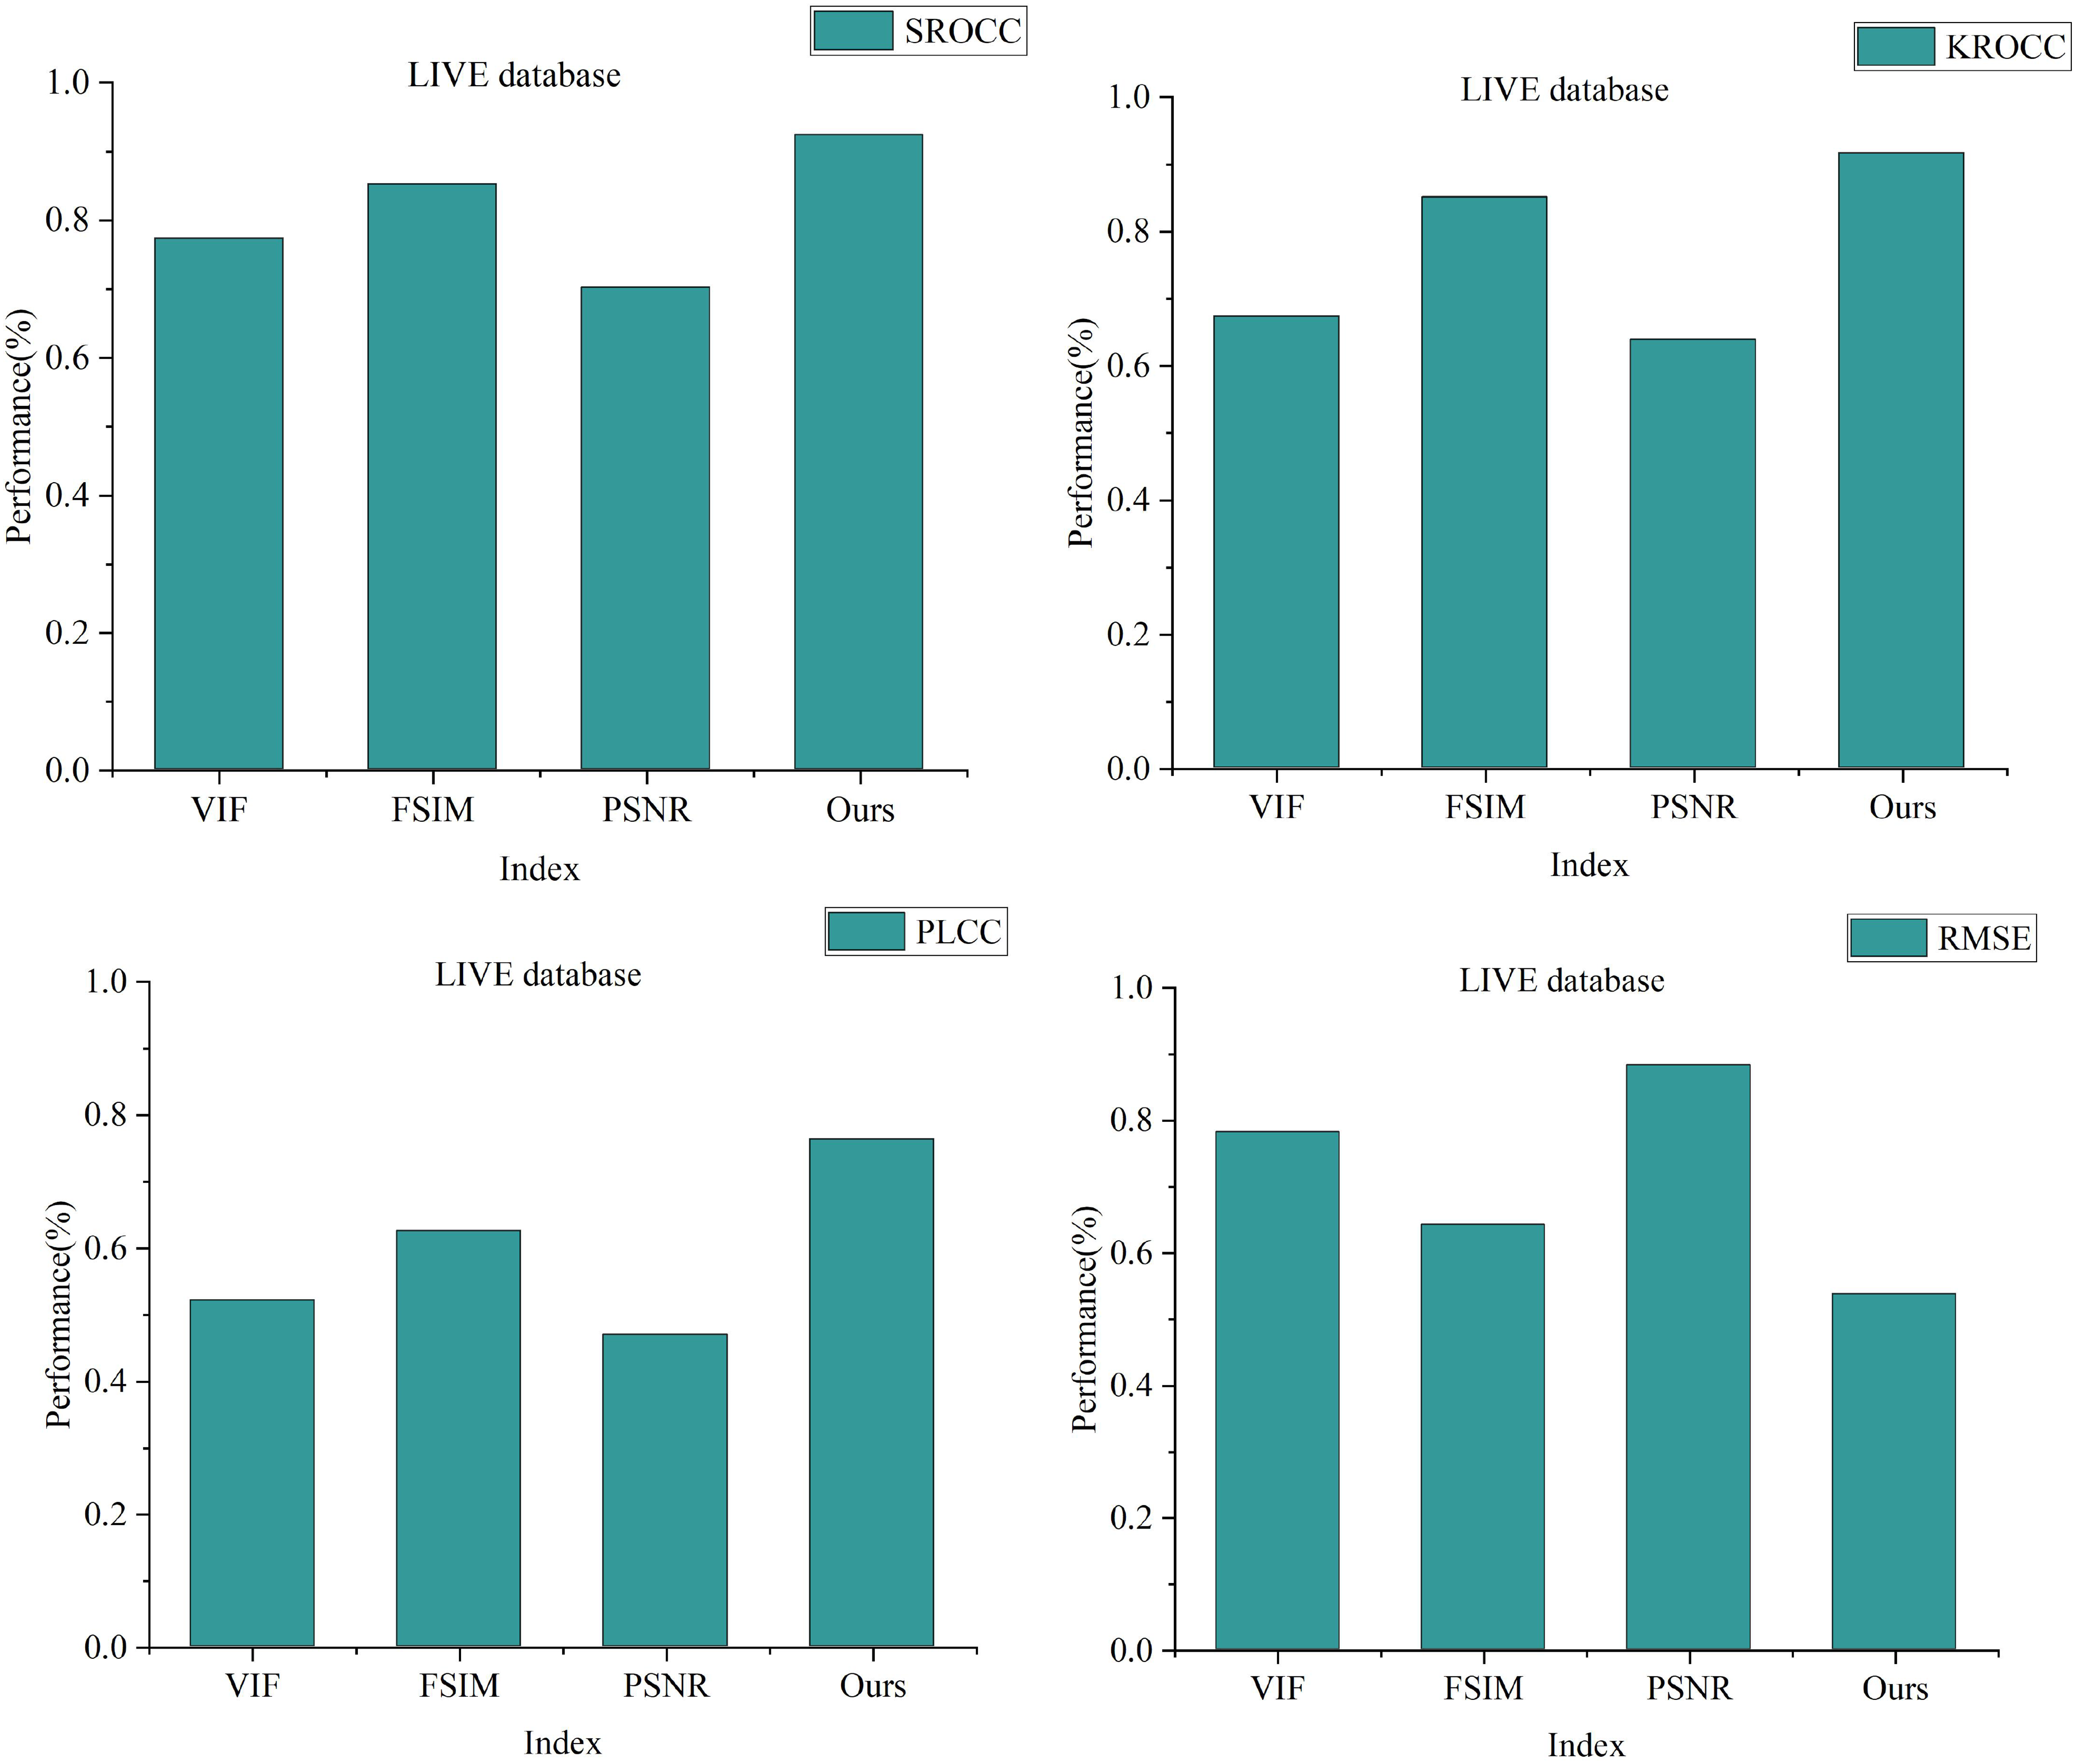
In our repeated experiments on both datasets, the mean values were extracted from N iterations to assess and validate the performance of the image evaluation optimization method, rooted in visual perception and multi-model decision-making as detailed in this article. Figure 6 presents the SROCC, KROCC, PLCC, and RMSE values for each image quality evaluation method on the LIVE dataset.
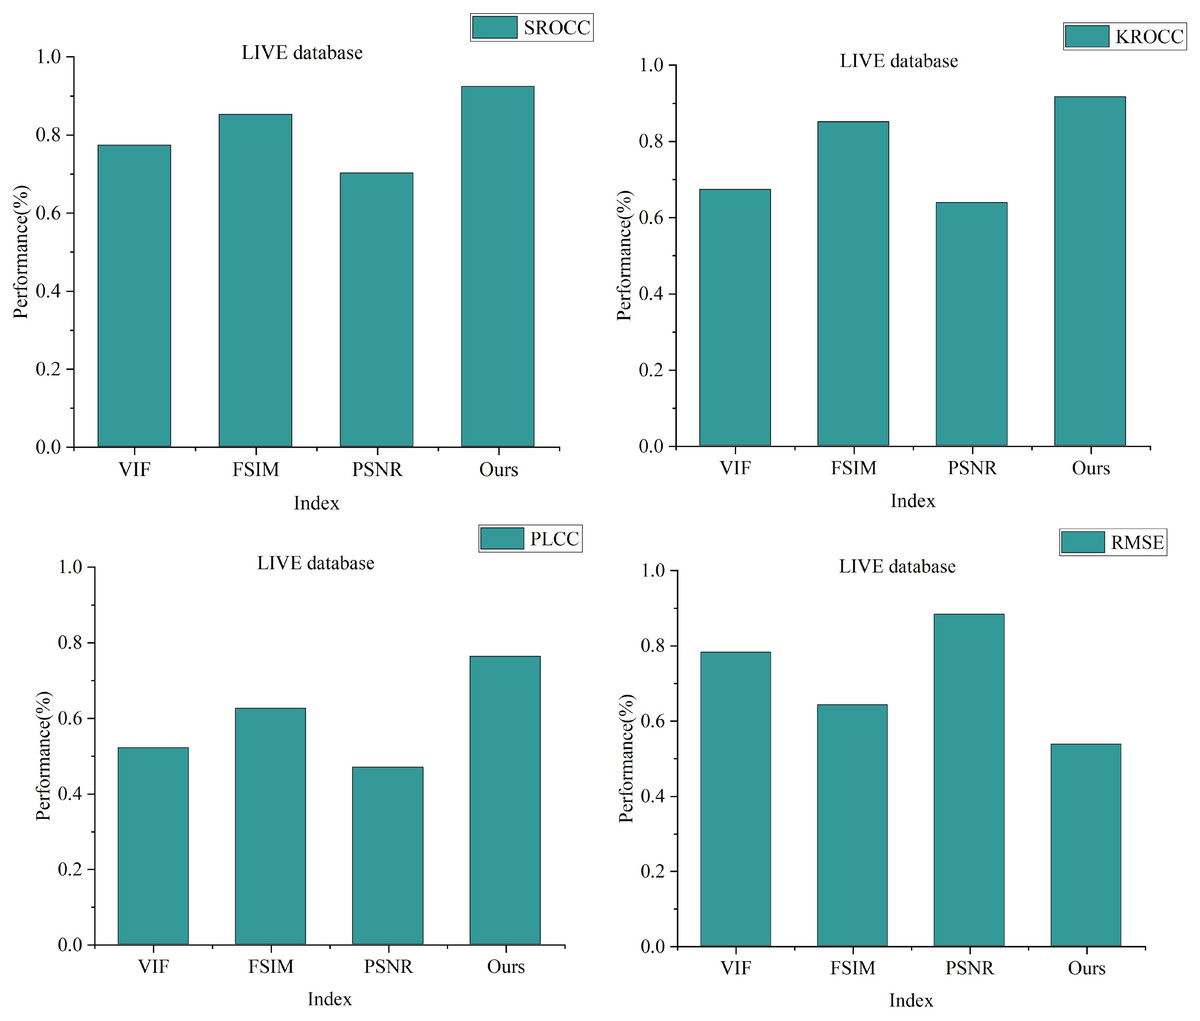
Figure 6: Performance comparison of different full-reference image quality assessment optimisation methods on LIVE dataset.
From the Fig. 6, it’s evident that the image quality evaluation methods constructed in this article yield SROCC, KROCC, PLCC values of 0.9236, 0.9167, 0.7634 respectively. Additionally, the RMSE value stands at 0.5372. Notably, the SROCC, KROCC, PLCC scores of this article’s scheme surpass those of PSNR, FSIM, and VIF, while the RMSE value is lower compared to PSNR, FSIM, and VIF.
This outcome aligns with the actual performance metrics, indicating the advantages of this article’s scheme in evaluating image quality compared to established methods, emphasizing its strengths and advantages in assessing image quality.
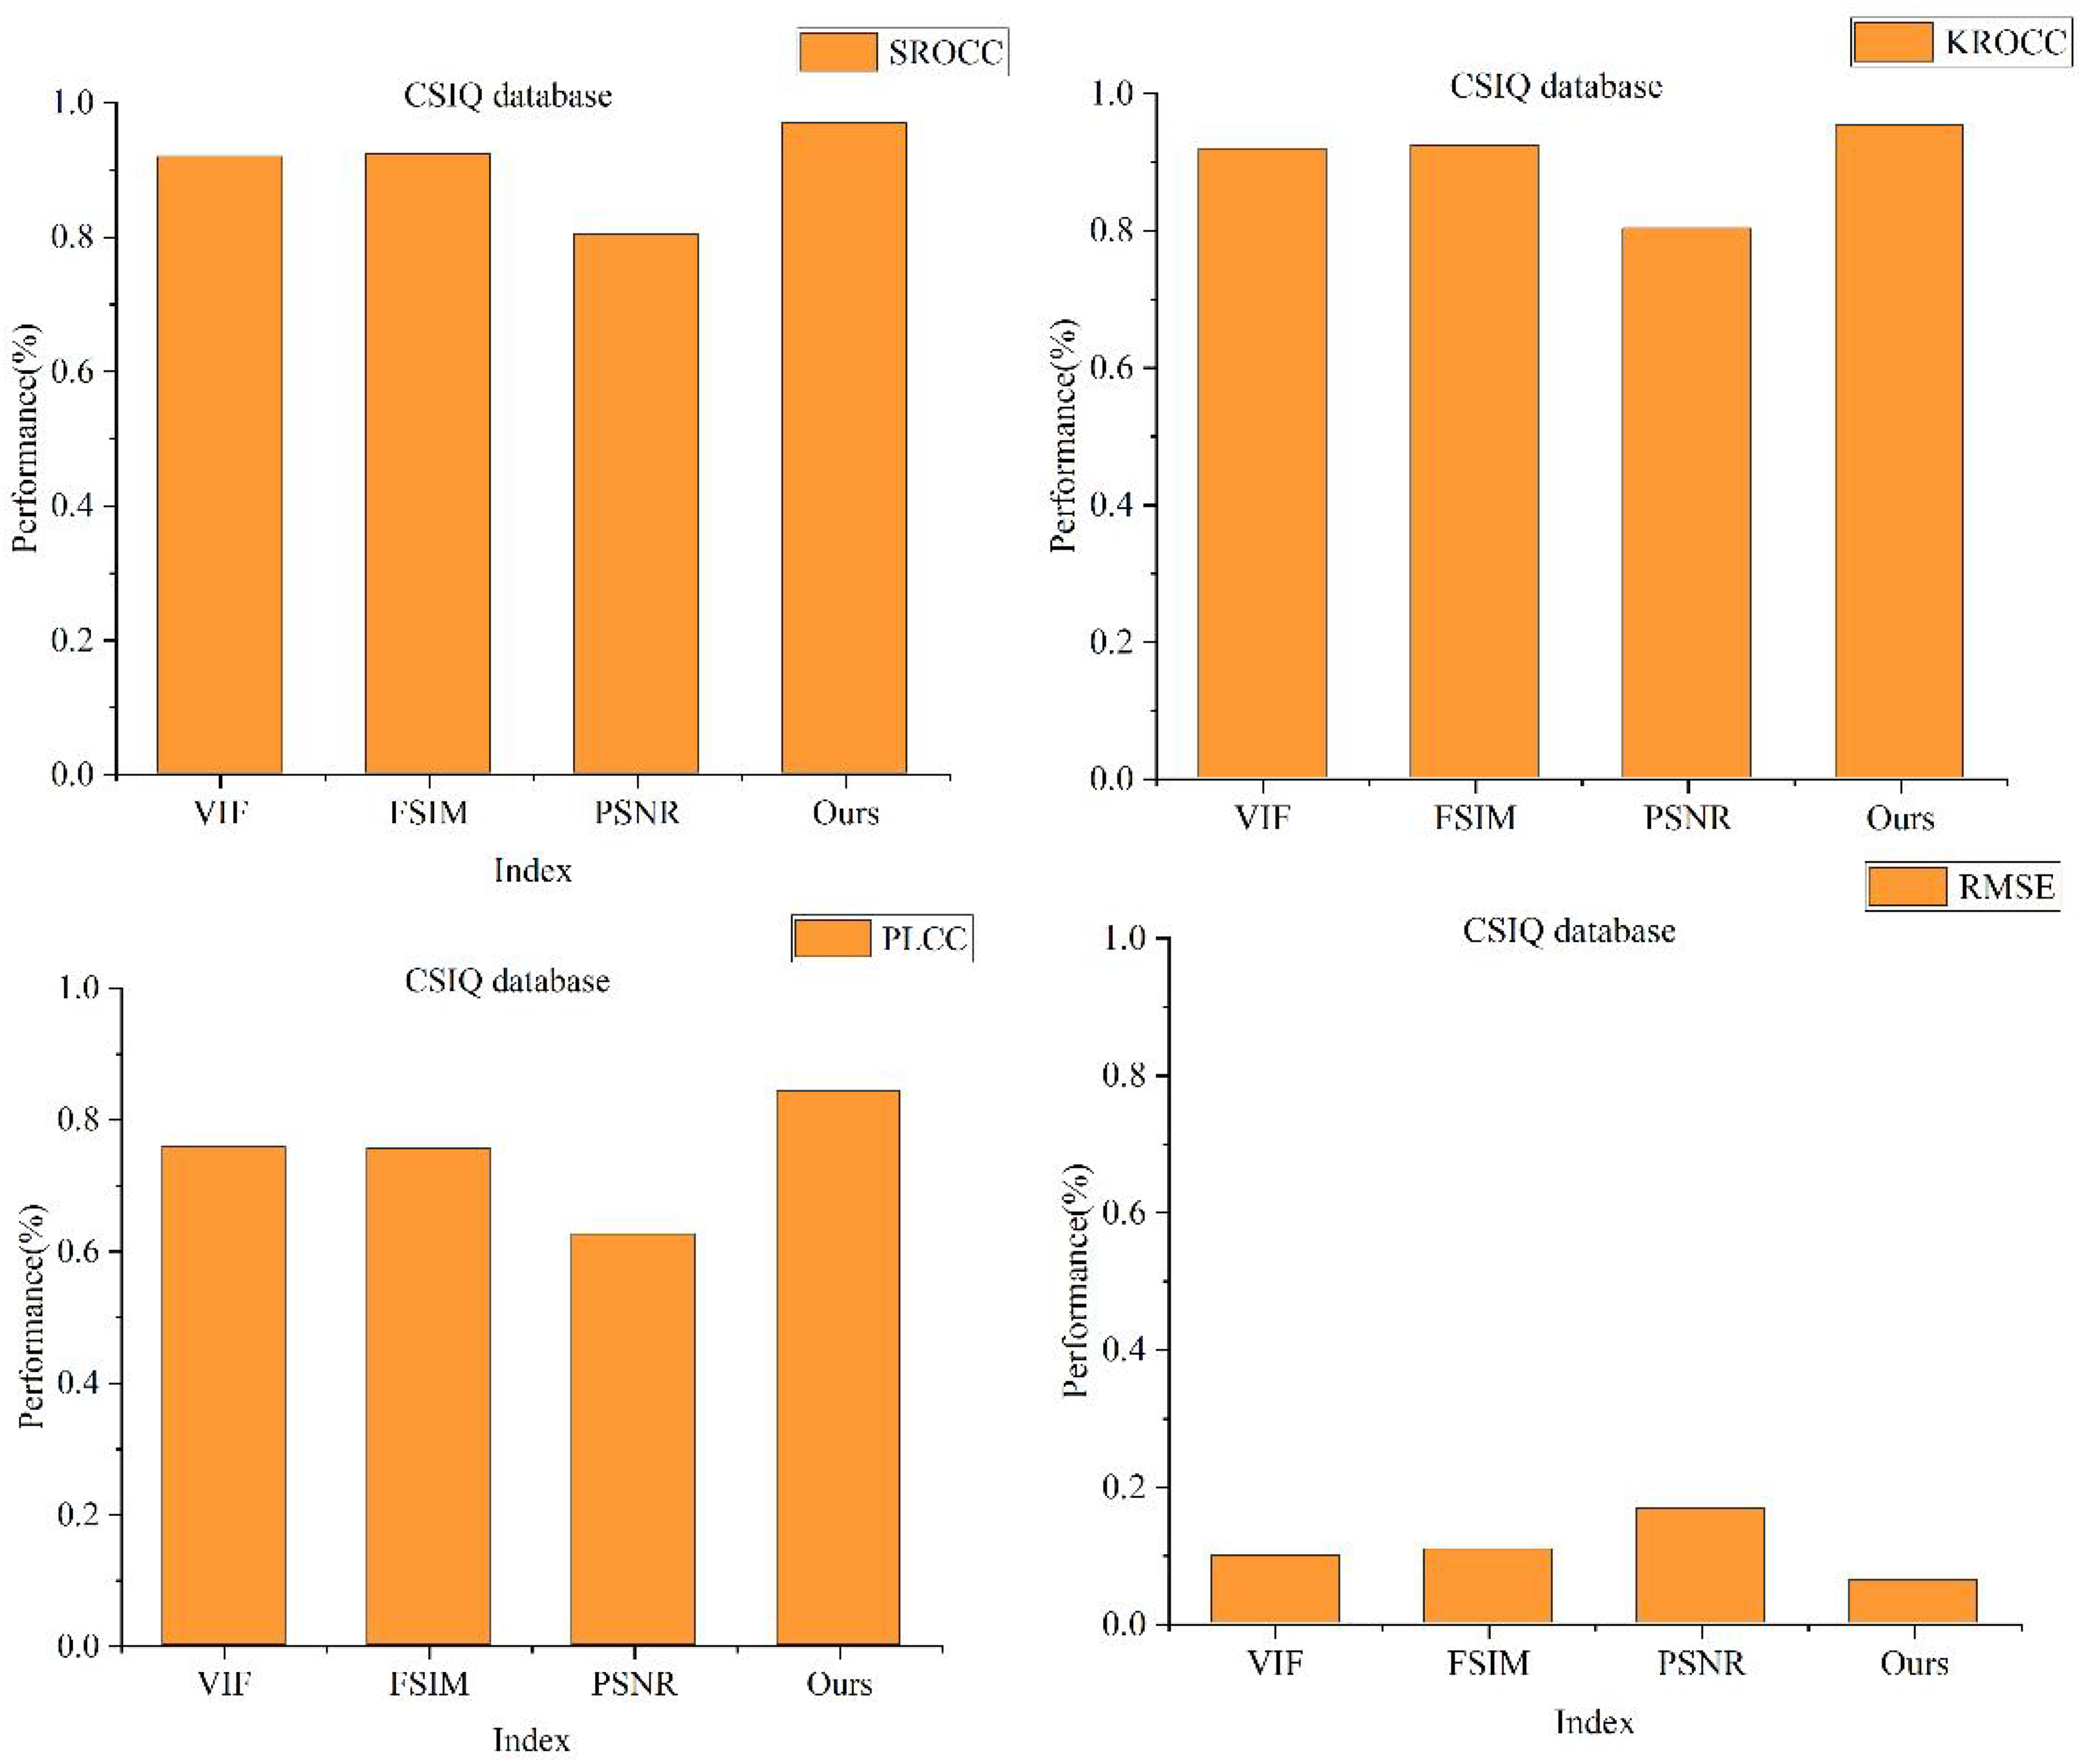
The results for each scheme on the CSIQ dataset are depicted in Fig. 7. Notably, the image quality evaluation method proposed in this study demonstrates distinct advantages. Specifically, the SROCC values for this article’s scheme, VIF, FSIM, and PSNR on the CSIQ dataset stand at 0.9536, 0.9277, 0.912, and 0.8382, respectively. Correspondingly, the KROCC values are observed as 0.9532, 0.9195, 0.9242, and 0.8032, while the PLCC values are 0.8427, 0.7582, 0.7562, and 0.6254, respectively.
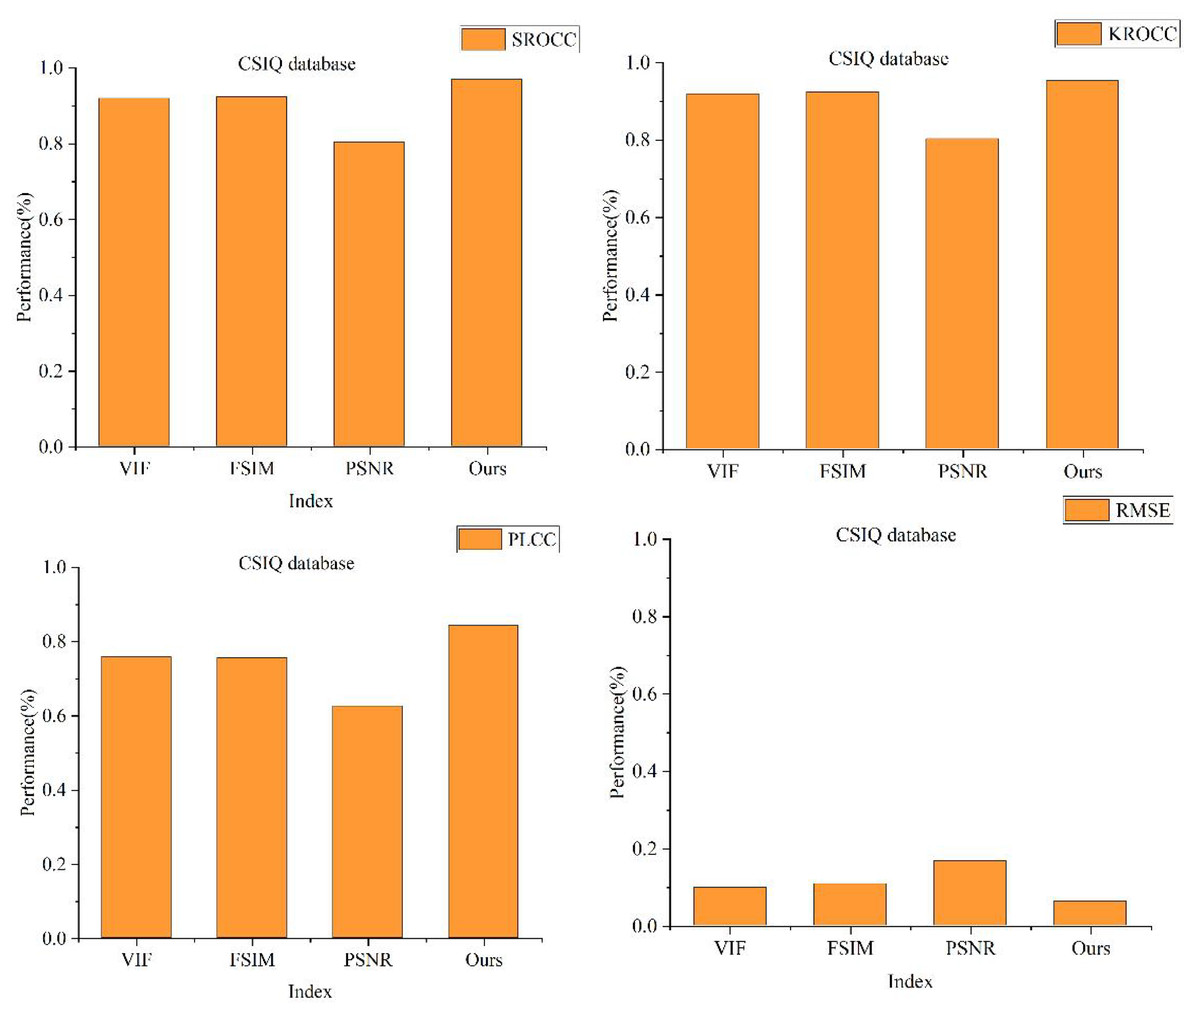
Figure 7: Comparison of different full-reference methods on CSIQ dataset.
Across all three metrics, the scheme introduced in this article demonstrates the highest values, positioning its performance metrics at the forefront, surpassing conventional full-reference image quality evaluation methods. Notably, the disparity in RMSE between this article’s scheme and VIF is minimal, registering RMSEs of 0.0621 and 0.098, respectively. Even so, this article’s scheme continues to exhibit superior performance in RMSE metrics when compared to VIF.
To verify the statistical significance of the performance improvements, we employed paired-samples t-tests to analyze the evaluation results of the models before and after improvement. The experiment selected 200 artistic brand patterns as the test set and calculated the PLCC and SROCC values between the predicted values of the models (before and after improvement) and the subjective scores, respectively. The results showed that the mean PLCC of the improved model increased from 0.82 to 0.87, and the mean SROCC increased from 0.85 to 0.90. Moreover, the p-values from the t-tests were all less than 0.01, indicating a high level of statistical significance in the performance improvements. This result fully demonstrates that, through feature optimization and model adjustments, the improved method exhibits more reliable performance in the quality assessment of artistic brand patterns.
Cross-validation results
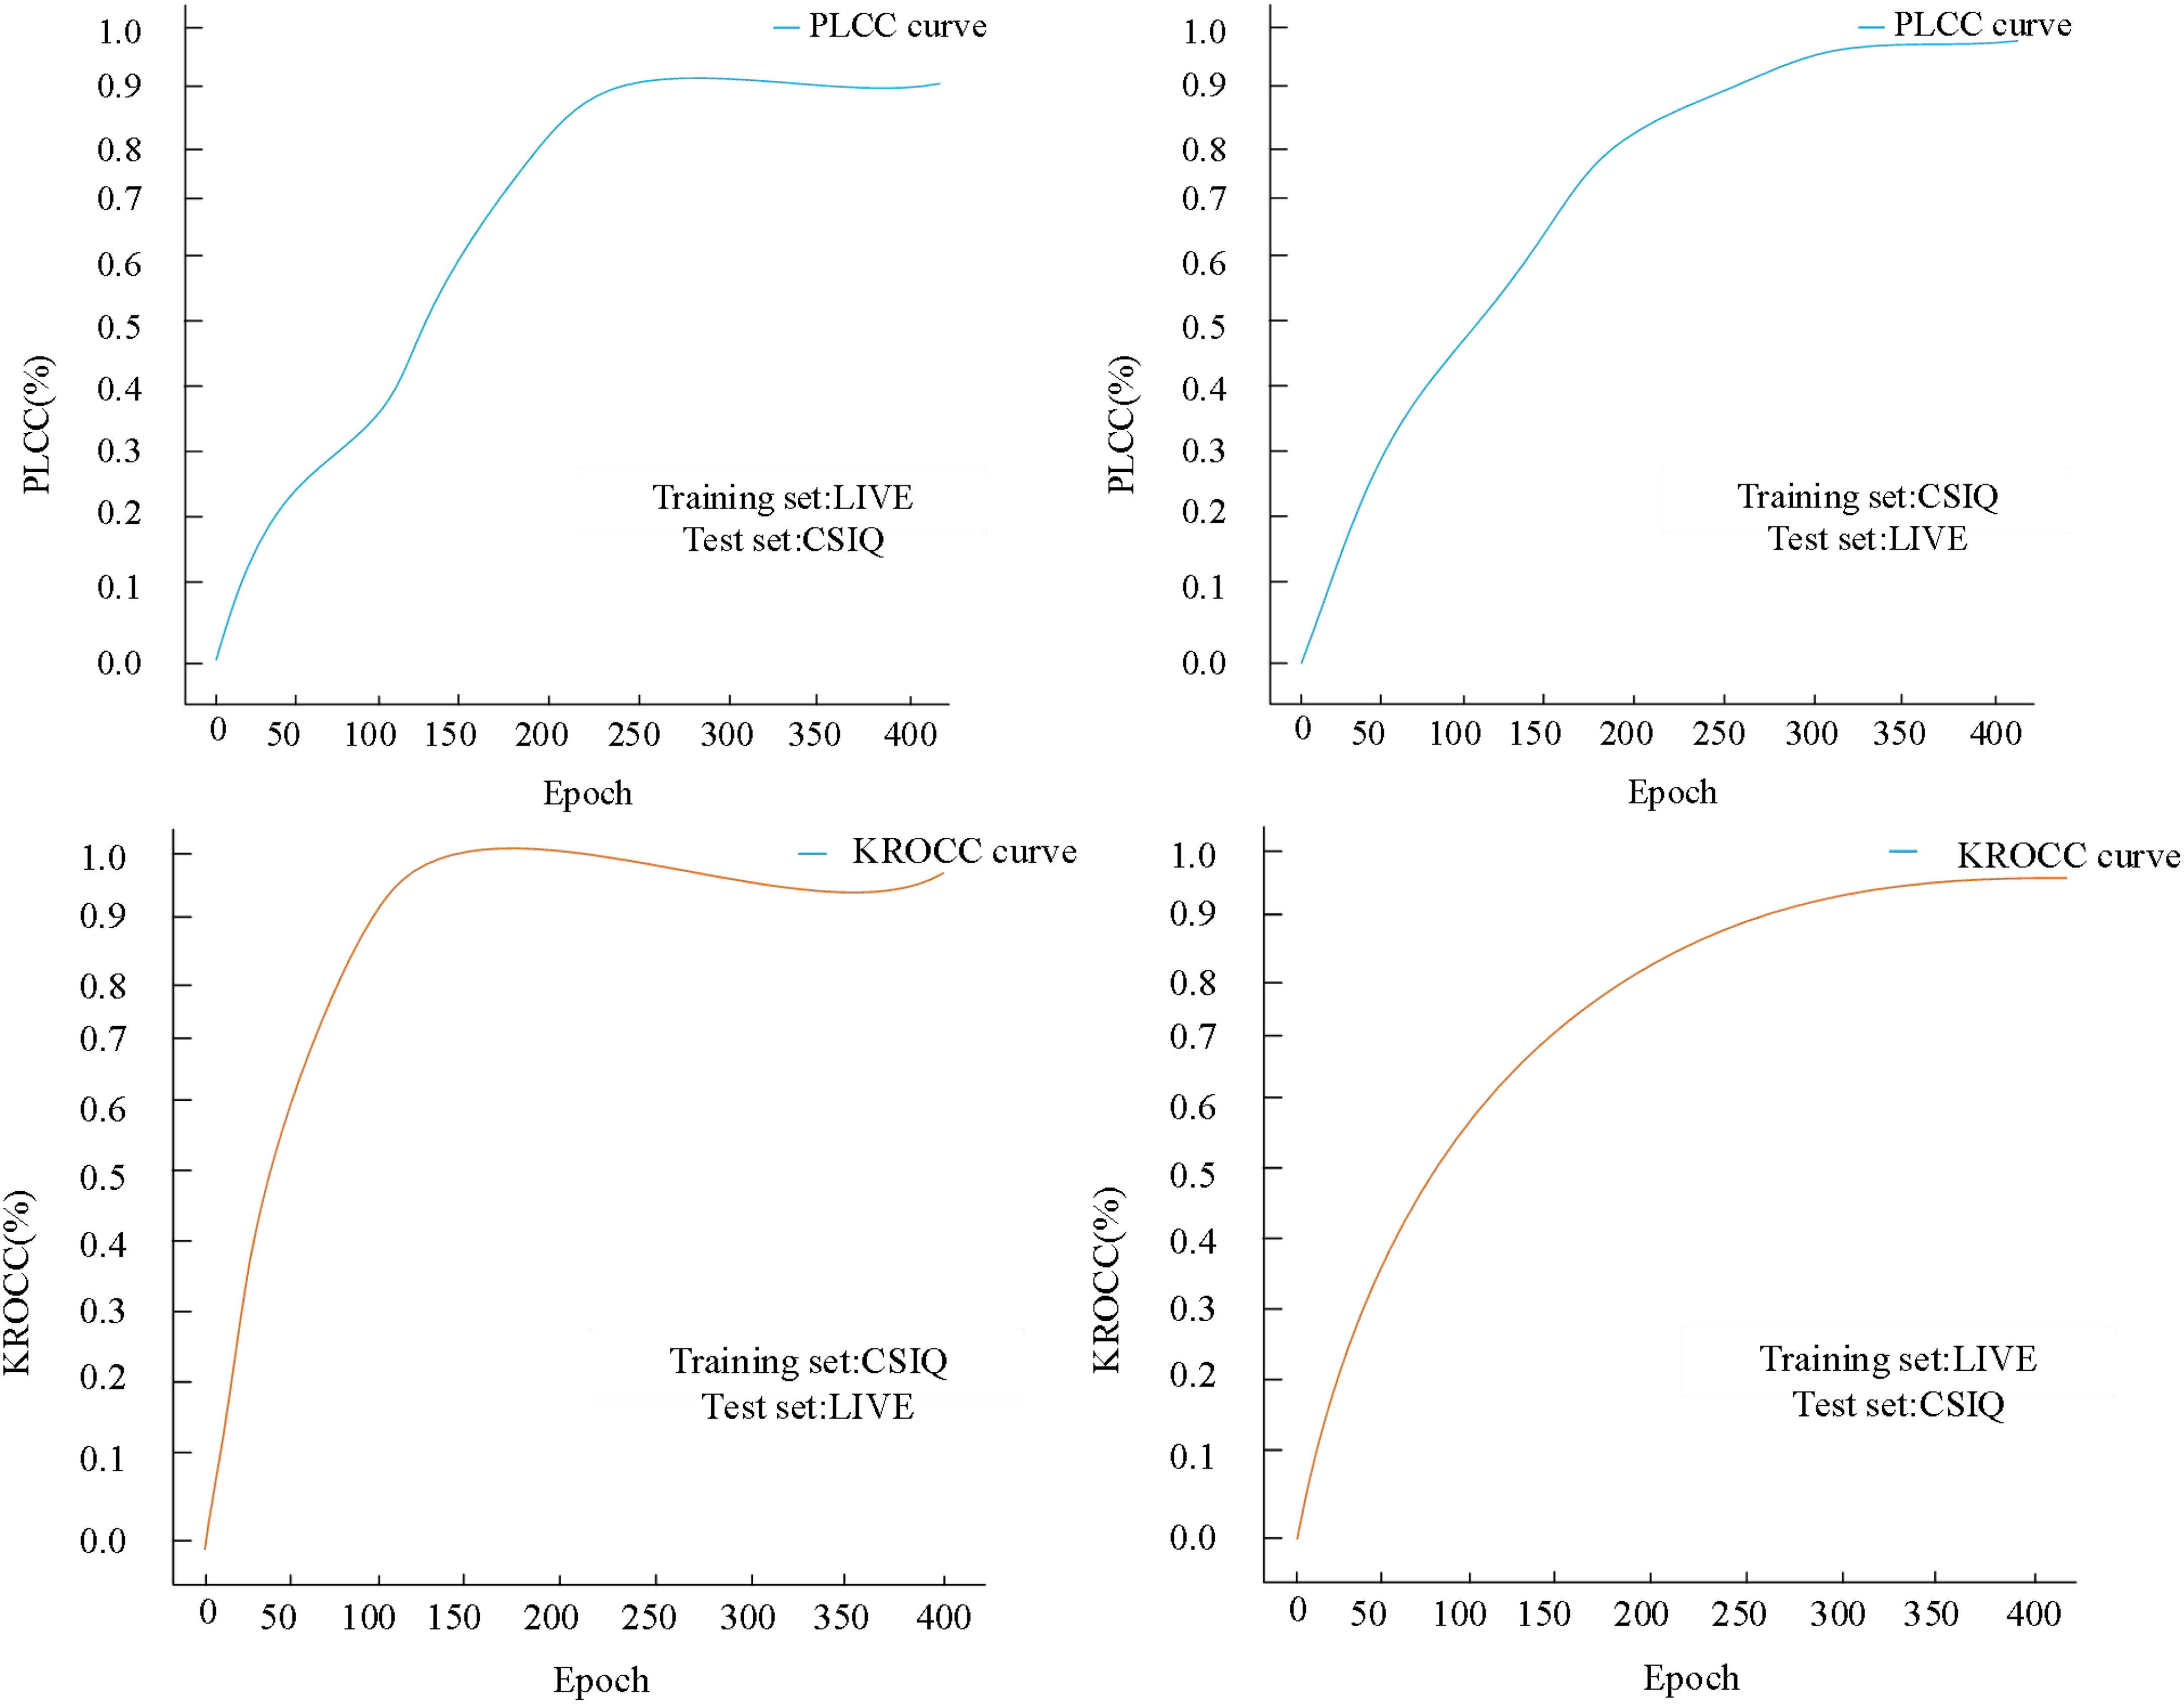
The image datasets utilized for image quality evaluation studies typically exhibit a restricted number of images. However, the two image datasets employed in this experiment demonstrate a substantially larger order of magnitude. To ascertain the universality of the proposed method in this article, cross-validation experiments were conducted using distinct datasets. In these cross-experiments, we employed the entire image data from one dataset as the training set and utilized the other dataset for testing purposes. Specifically, we leveraged the LIVE dataset as the training set and the CSIQ dataset as the test set to generate curve plots illustrating variations in PLCC and KROCC concerning the number of training iterations, as depicted in Fig. 8.
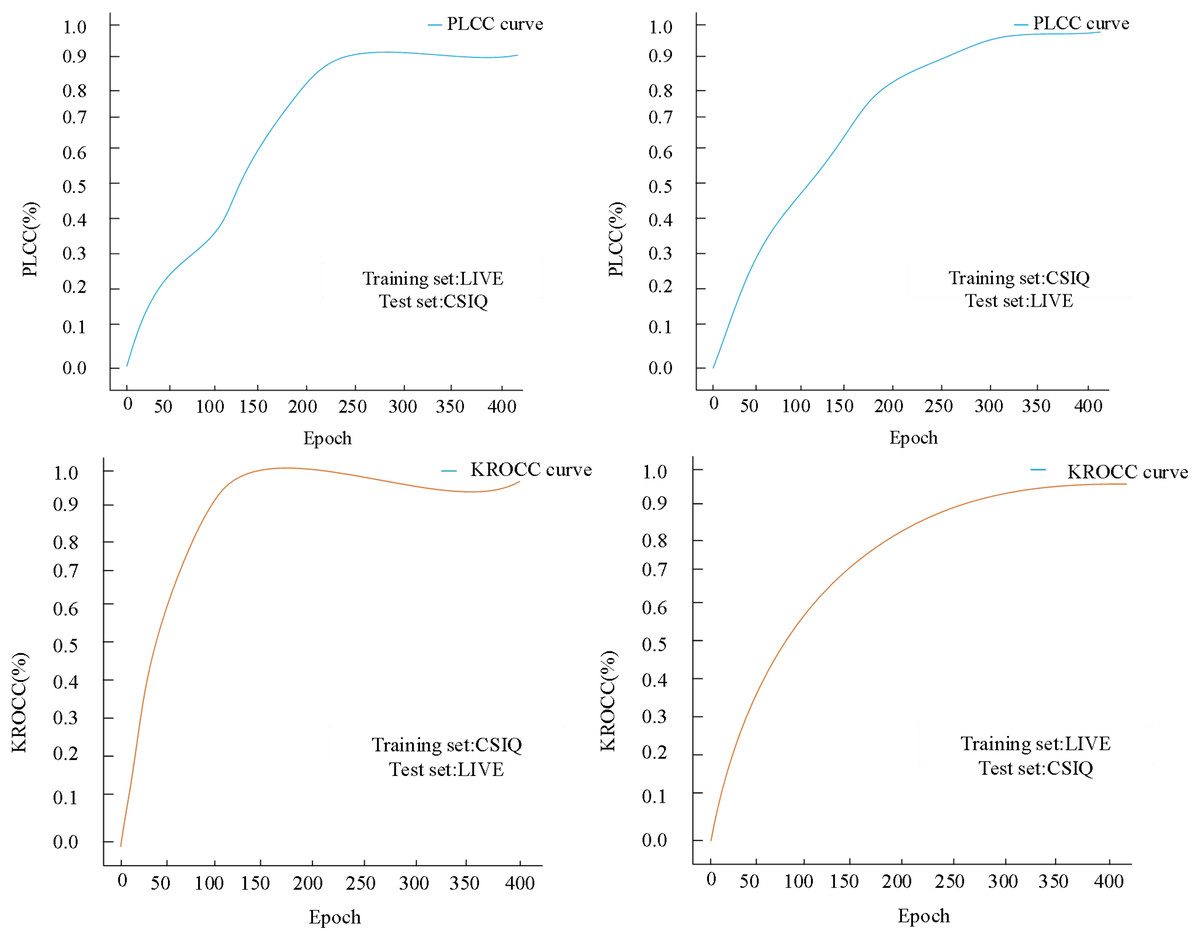
Figure 8: Cross-validation results on both LIVE and CSIQ databases.
When the LIVE dataset was utilized as the training set and the CSIQ dataset as the test set, after 230 iterations, the final PLCC stabilized at 0.9346. Concurrently, the KROCC reached its optimum before reaching 150 iterations, exhibited fluctuations, and eventually stabilized at approximately 0.9183. Subsequently, employing the CSIQ dataset as the training set and the LIVE dataset as the test set, after 320 iterations, the final PLCC stabilized at 0.9582. Notably, the KROCC also achieved stability around 0.95 when the number of iterations reached 300.
During cross-dataset evaluation, we trained the model using the LIVE dataset and tested it on the CSIQ dataset. The experimental results revealed that the model achieved a PLCC of 0.935 and an SROCC of 0.918 on the CSIQ dataset. Although these values were slightly lower than those obtained when training and testing on the same dataset, they still remained at a high level. Further analysis indicated that the model exhibited a certain degree of stability when processing different datasets, but its performance showed slight fluctuations on images with high color saturation and rich detail.
Discussion
This article introduces a model that capitalizes on the distinctive features of art brand patterns, utilizing a framework based on visual perception and multi-model decision-making. The focal points of this scheme revolve around ensuring phase consistency within the image, extracting image edges, colors, and texture features, culminating in the construction of a comprehensive composite image feature vector. Employing a GRNN approach for training purposes to establish the mapping function and regression model, the resultant model showcases enhanced performance across SROCC, KROCC, PLCC and RMSE metrics.
Moreover, leveraging deep learning and image recognition technologies, this model adeptly extracts pivotal features from patterns, conducting refined analyses and comparisons to minimize errors stemming from human factors. Comparative to traditional manual evaluation methods, this visual perception-based model demonstrates the ability to swiftly process substantial volumes of image data, significantly amplifying evaluation efficiency. Through its automated and intelligent processing workflow, the model expeditiously conducts quality assessments of patterns, furnishing prompt feedback crucial for design optimization. Furthermore, employing a multi-model decision-making methodology enables a comprehensive consideration of diverse design elements and visual perception evaluations, mitigating the disproportionate influence of any singular factor on optimization outcomes. The proposed model, thus, yields more steadfast and dependable design solutions, aligning designs more closely with diverse aesthetic preferences and varying visual experiences.
Utilizing advanced image quality assessment algorithms enables the quantitative evaluation of pivotal indicators like pattern clarity, color vibrancy, and contrast. This approach facilitates a more objective comprehension of pattern quality, serving as a robust foundation for subsequent optimization endeavors. Simultaneously, the proposed scheme significantly enhances pattern and feature recognition within art branding images. This comprehensive consideration of phase consistency, edges, colors, and textures contributes to a deeper understanding of the visual attributes inherent in art branding patterns. Consequently, it enables more precise prediction and optimization of these patterns.
Furthermore, this solution addresses prevalent challenges in art brand pattern optimization, encompassing aspects like color coordination, shape design, and layout adjustments. Elevating the model’s performance expedites the discovery of optimal pattern design solutions, consequently bolstering brand recognition and appeal. Over the long term, art brand patterns constitute a vital facet of brand image, wielding substantial influence on brand recognition and allure. The regression model, rooted in visual perception and multi-model decision-making, empowers a deeper comprehension and anticipation of consumer responses to diverse patterns. This understanding facilitates the formulation of pattern design solutions better aligned with market demands and brand positioning objectives.
Conclusion
This article introduces an art brand pattern optimization design rooted in visual perception and multi-model decision-making. By amalgamating image phase consistency, edge features, color attributes and texture characteristics, an 11-dimensional feature vector is constructed via multi-model decision-making. A generalized regression-based neural network is employed to derive a mapping strategy and a regression model aligned with human visual perception. Empirical results substantiate the superiority of this article’s scheme across both the LIVE and CSIQ datasets. Notably, on the LIVE dataset, SROCC, KROCC, PLCC, and RMSE values stand at 0.9236, 0.9167, 0.7634, and 0.5372, respectively. Meanwhile, on the CSIQ dataset, these metrics demonstrate even higher values, reaching 0.9536, 0.9532, 0.8427, and 0.0621, respectively. During cross-validation exercises, stability is achieved within the range of 230 to 320 iterations. Enhancing image quality detection performance facilitates a more accurate assessment of pattern attributes such as clarity, color richness, and detail performance. This enables precise evaluations regarding alignment with brand image and market demand. Adjustments in color matching, element amalgamation, and layout based on market feedback and consumer preferences enhance attractiveness and recognition. Ultimately, devising a pattern scheme harmonized with market demands and brand positioning elevates the brand’s image and market competitiveness, infusing fresh vigor into brand development initiatives.
Despite promising results, the study has limitations. Firstly, the model, though designed to mimic the human visual system, may not fully grasp the subjective or cultural subtleties in artistic pattern perception. Secondly, the LIVE and CSIQ datasets used are general-purpose and may lack diversity in real-world brand designs. Thirdly, while the GRNN model performs well, further validation across various branding contexts is needed to confirm its generalizability. Lastly, the computational complexity of multi-feature fusion and model training hinders real-time or resource-limited deployment.
To tackle these issues, future work will focus on creating culturally sensitive models with more diverse datasets, exploring efficient algorithms to reduce complexity for real-time use and conducting extensive cross-validation to ensure robustness across branding scenarios.