
Applying vision transformer to assess multi-scale morphological features in mammography for breast cancer detection: multiscale image morphological extraction vision transformer (MIME-ViT)
- Published
- Accepted
- Received
- Academic Editor
- Ahmed Elazab
- Subject Areas
- Algorithms and Analysis of Algorithms, Artificial Intelligence, Computer Vision, Optimization Theory and Computation, Neural Networks
- Keywords
- Breast cancer detection, Mammography, Deep learning, Vision transformer (ViT), Convolutional neural networks (CNN), Multiscale analysis, Medical imaging
- Copyright
- © 2025 Kashiwada et al.
- Licence
- This is an open access article distributed under the terms of the Creative Commons Attribution License, which permits unrestricted use, distribution, reproduction and adaptation in any medium and for any purpose provided that it is properly attributed. For attribution, the original author(s), title, publication source (PeerJ Computer Science) and either DOI or URL of the article must be cited.
- Cite this article
- 2025. Applying vision transformer to assess multi-scale morphological features in mammography for breast cancer detection: multiscale image morphological extraction vision transformer (MIME-ViT) PeerJ Computer Science 11:e3252 https://doi.org/10.7717/peerj-cs.3252
Abstract
Background
Breast cancer screening using mammography often suffers from low sensitivity and specificity, particularly in dense breast tissue. This limitation can result in missed diagnoses and unnecessary procedures. The evolution of deep learning models, such as those based on convulational neural networks (CNNs) and Vision Transformers (ViTs), presents opportunities for significant advancements.
Methods
This study utilized the Chinese Mammography Database (CMMD) and enhanced it with detailed annotations from two radiologists for detection tasks. The Multiscale Image Morphological Extraction Vision Transformer (MIME-ViT) model, which integrates ViT and CNN, is designed to capture multiscale morphological features from mammographic images. Training of the model prioritized segmentation and classification, employing a combination of Dice and Focal losses to effectively tackle detection tasks.
Results
Without pre-training, MIME-ViT achieved a mean Intersection over Union (IoU) of 0.3342 across all images, 0.3797 for mass, and 0.2491 for calcification. In terms of IoU scores, MIME-ViT’s performance was inferior to that of Detection Transformer (DETR) with pre-training, yet it surpassed the performance of DETR without pre-training.
Conclusions
By merging Vision Transformers with CNNs to enhance mammographic imaging analysis, the MIME-ViT model represents a significant advancement in breast cancer detection. This development marks a critical step forward in medical imaging technology, with the goal of improving early detection rates and patient outcomes. As medical imaging technology continues to evolve, MIME-ViT emerges as a key innovation, paving the way for more effective and advanced cancer screening methodologies.
Introduction
Breast cancer is the most common cancer among women globally, and both its incidence and mortality rates are projected to rise (Harbeck & Gnant, 2017; Anastasiadi et al., 2017). Mammography screening programs are in place in various countries for early breast cancer detection and treatment (Myers et al., 2015). Randomized controlled studies have shown that mammography can reduce breast cancer-related mortality by approximately 20% (Nelson et al., 2009). Despite its efficacy, mammography-based screening has limitations, including low sensitivity, especially in patients with dense breast tissue. This may result in missed diagnoses, leading to delayed treatment (Nelson et al., 2009). Additionally, the high rate of false positives is also a significant issue, causing unnecessary stress and potentially triggering unwarranted medical interventions (Nelson et al., 2009).
During the clinical interpretation of mammography images, radiologists commonly use a multiscale evaluative approach to diagnose breast cancer (Fowler et al., 2013). This approach encompasses the assessment of features at both micro and macro scales. On the micro-scale, features like the shape of individual calcifications and minute morphological changes at tumor peripheries are examined. On the macro-scale, the distribution pattern of these calcifications and the overall tumor shape are considered. Such multiscale information is then synthesized to determine a comprehensive radiological diagnosis.
In recent years, artificial intelligence (AI)-based diagnostic systems have made significant advancements in breast imaging, surpassing the performance of traditional computer-aided detection systems (Lehman et al., 2015). Although conventional convulational neural network (CNN)-based deep learning (DL) algorithms have proven useful in breast cancer diagnostic systems (Raya-Povedano et al., 2021; van Leeuwen et al., 2022; Shoshan et al., 2022; Mendelson, 2019), their limitations have also been pointed out (Nassif et al., 2022; Cai et al., 2023). Furthermore, object detection techniques have shown promise as preprocessing steps for automated region-of-interest identification. For instance, Chen et al. (2023) demonstrated a You Only Look Once (YOLO)-based adaptive multiscale system that combines YOLOv4 for calcification localization with an ensemble classifier for malignancy assessment, achieving improved benign/malignant classification on spot magnification mammograms (area under the curve (AUC) 0.888) and potentially reducing unnecessary biopsies by over 80%. CNNs process image data through the use of localized filters in convolutional layers, and are particularly effective for identifying intricate details within a specific region of an image. Recently, the Vision Transformer (ViT) has been introduced as a novel architecture for DL-based image analysis (Dosovitskiy et al., 2020; Shamshad et al., 2023; Azad et al., 2024). ViT is adapted from the Transformer model, which was originally designed for natural language processing, and is designed to capture a wide range of positional relationships within the image. Unlike CNNs that process images through localized receptive fields with limited global context, ViTs employ self-attention mechanisms that enable direct modeling of long-range dependencies across the entire image (Vaswani et al., 2017; Han et al., 2022). This global receptive field capability is particularly advantageous for mammographic analysis, where subtle calcification patterns may be distributed across distant regions of the breast, and their spatial relationships provide crucial diagnostic information (Raghu et al., 2021). Furthermore, the self-attention mechanism allows ViTs to dynamically weight the importance of different image regions based on their relevance to the diagnostic task, making them well-suited for medical imaging where pathological features may vary significantly in size and location (Chen, Fan & Panda, 2021). Chen et al. (2022) proposed a specialized approach for pathological imaging called Hierarchical Image Pyramid Transformer (HIPT). The HIPT involves the extraction of hierarchical image features at multiple scales to input into the ViT architecture (Chen et al., 2022), which allows the model to reflect complex patterns and relationships across different image scales. A recent comprehensive review (Singh & Patnaik, 2024) has systematized the evolution from traditional CNN to ViT approaches in breast cancer detection systems. However, research incorporating multiscale morphological information remains limited.
The application of HIPT has been increasingly adopted in medical image analysis, particularly in digital pathology for Whole Slide Image (WSI) analysis, where hierarchical Transformers are employed to integrate local tissue patterns with global contextual information across the entire slide (Shoshan et al., 2024; Guo et al., 2023). Notably, Chen et al. (2022) developed a HIPT model that utilizes self-supervised learning to leverage the hierarchical structure of WSI data through a two-stage Vision Transformer pre-training approach, combined with a weakly-supervised ViT classifier to extract high-level feature representations from over 10,000 pathological WSIs derived from The Cancer Genome Atlas (TCGA) (Contreras et al., 2024). While such applications have shown considerable progress in pathological imaging and other medical imaging domains, the application of HIPT to mammography remains relatively limited and represents an area of significant potential for advancing breast cancer detection.
The purpose of our research is to develop a specialized DL model to detect breast cancer by combining ViT and CNN algorithms, facilitating the extraction of multiscale image features in mammography.
Materials and Methods
Dataset
In this study, we utilized the TOMPEI-CMMD dataset (https://www.cancerimagingarchive.net/analysis-result/tompei-cmmd/) (Kashiwada et al., 2024), derived from the Chinese Mammography Database (CMMD) (Cui et al., 2021). TOMPEI-CMMD extends the CMMD by incorporating lesion segmentation masks and corrections to certain lesion annotations. CMMD is a publicly accessible mammography database comprising data from 1,775 Chinese patients who underwent mammographic examinations from July 2012 to January 2016. All mammographic images were captured using digital mammography, with a resolution of pixels. Figure 1 illustrates the dataset selection process from the CMMD dataset. From the 1,775 patients in CMMD, 826 had bilateral mammograms, while 949 had unilateral mammograms, totaling 2,601 breast mammograms. The CMMD dataset encompasses both mediolateral oblique (MLO) and craniocaudal (CC) views. For this study, only MLO views were utilized. Furthermore, we utilized the lesion labels and segmentation masks available in the TOMPEI-CMMD dataset.
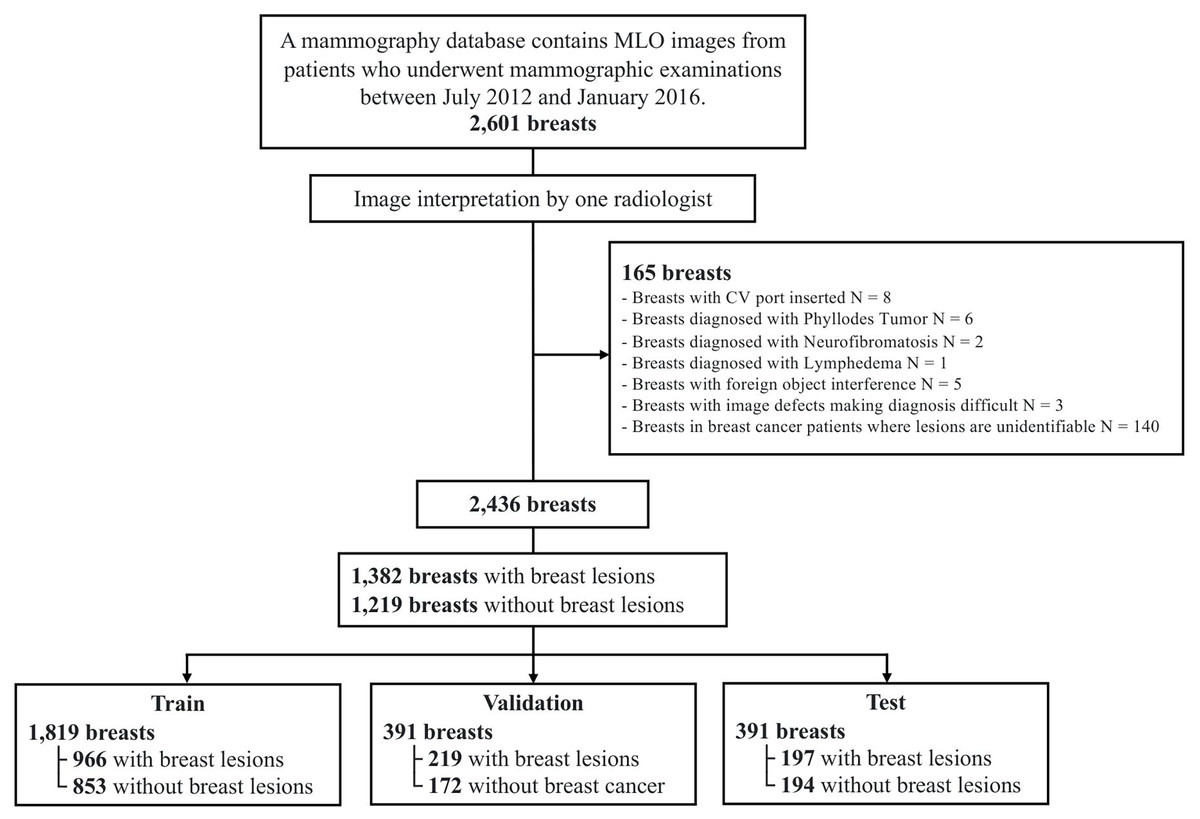
Figure 1: Dataset selection workflow from the original CMMD dataset.
Image data processing
Black pixel padding was applied to the distal sides of the body in each image, transforming the original pixel images into isotropic images with uniform dimensions. To meet the matrix size requirements of the multiscale deep learning model, the pixel images were resized to pixels.
Multiscale Image Morphological Extraction Vision Transformer (MIME-ViT) architecture
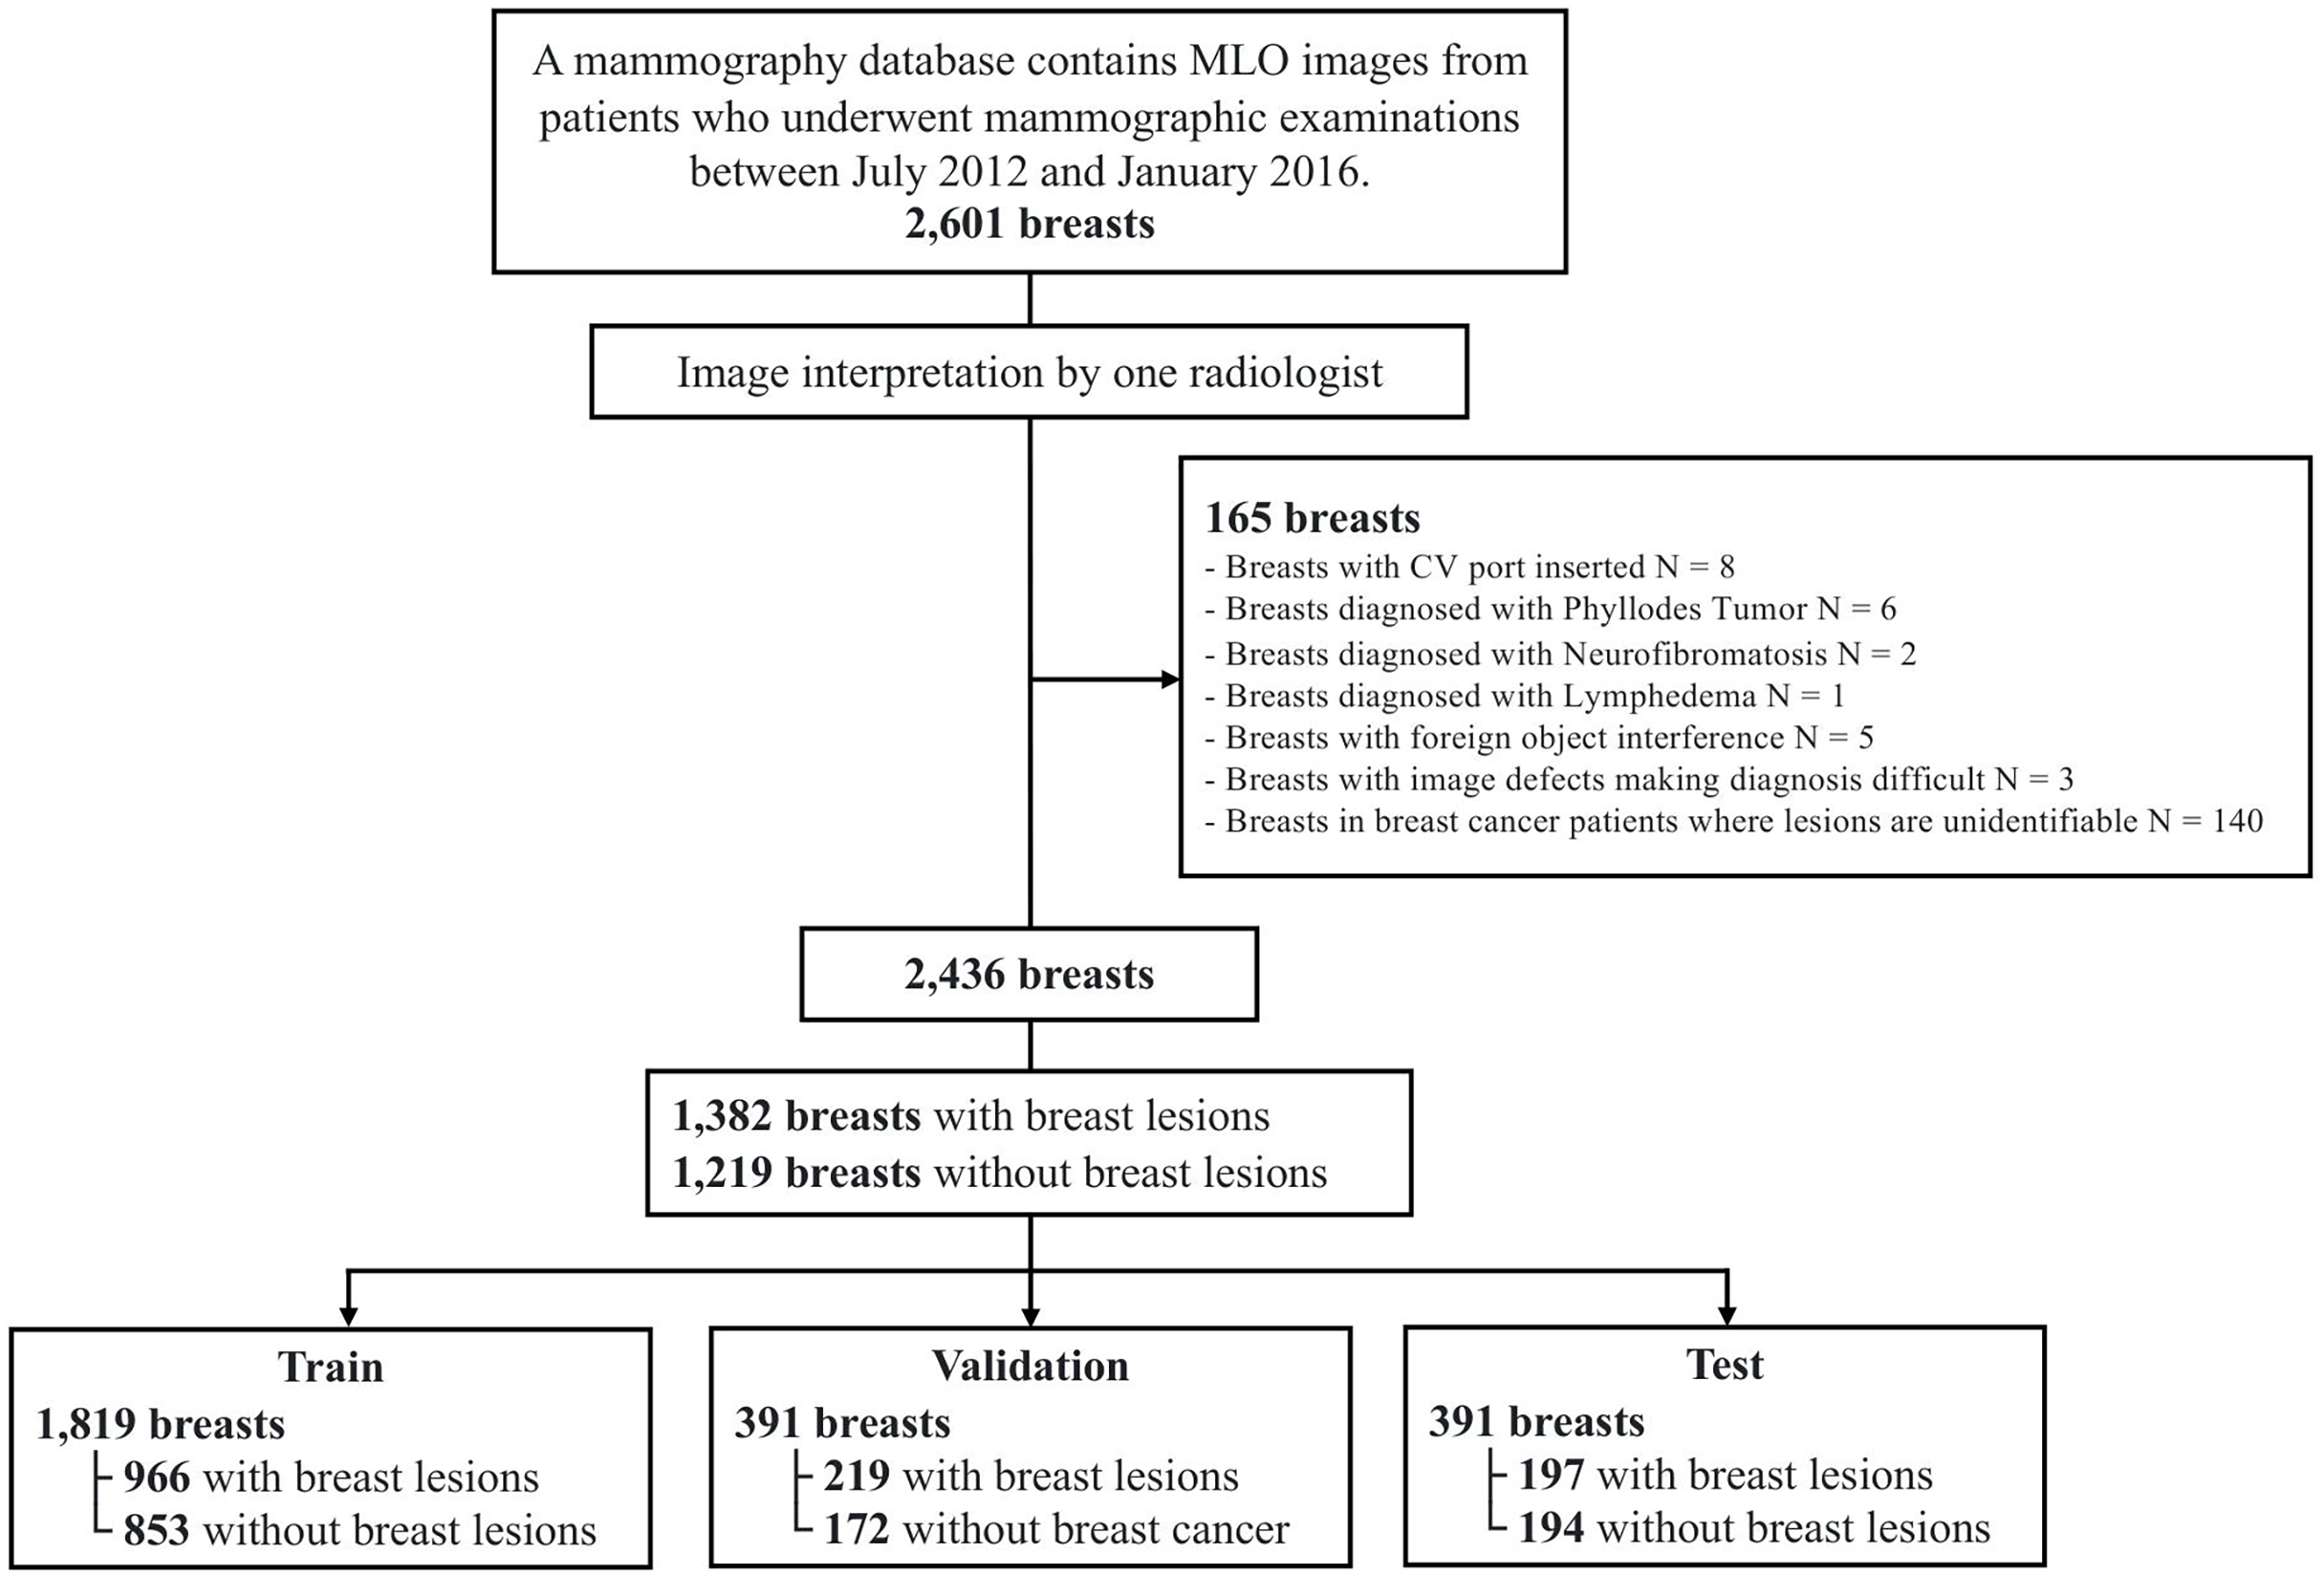
Figure 2 illustrates the architecture of our proposed DL model, the Multiscale Image Morphological Extraction Vision Transformer (MIME-ViT). MIME-ViT integrates the architectural characteristics of ViT and CNN in a hybrid design to capture multiscale morphological features of breast cancer in mammographic images. The selection of ViT as the foundation for multiscale analysis is motivated by its superior capability in handling hierarchical feature representations across different scales (Liu et al., 2021; Wang et al., 2022). Unlike traditional CNN architectures that require explicit multiscale designs through feature pyramid networks, ViTs naturally excel at multiscale analysis through their inherent ability to model both local and global dependencies simultaneously within the self-attention mechanism (Yuan et al., 2021). Within the ViT segment, discrete components are specifically designed to process image patches at various scales: , , , and . The and components are designed to extract macroscale morphological features, like the overall shape of a breast cancer mass or the segmental distribution of microcalcifications. The and components are intended to discern detailed morphological characteristics, such as the marginal irregularity of a breast cancer mass or the morphology of microcalcifications. Due to graphics processing unit (GPU) memory capacity limitations, the ViT component undergoes convolution and pooling operations before being introduced into the ViT, ensuring effective data dimension reduction. Following processing through these four multiscale ViT components and an additional CNN component, the architecture synthesizes the information and outputs it as a patch. The architectural design of MIME-ViT ensures proficiency in detecting features across various scales, from broad structures to intricate details, thus enhancing its capability to analyze breast cancer images. The architectural design of MIME-ViT, along with the accompanying code, is available for research purposes on GitHub (https://github.com/javasparrows/MIME-ViT and archived at https://doi.org/10.5281/zenodo.16221703).
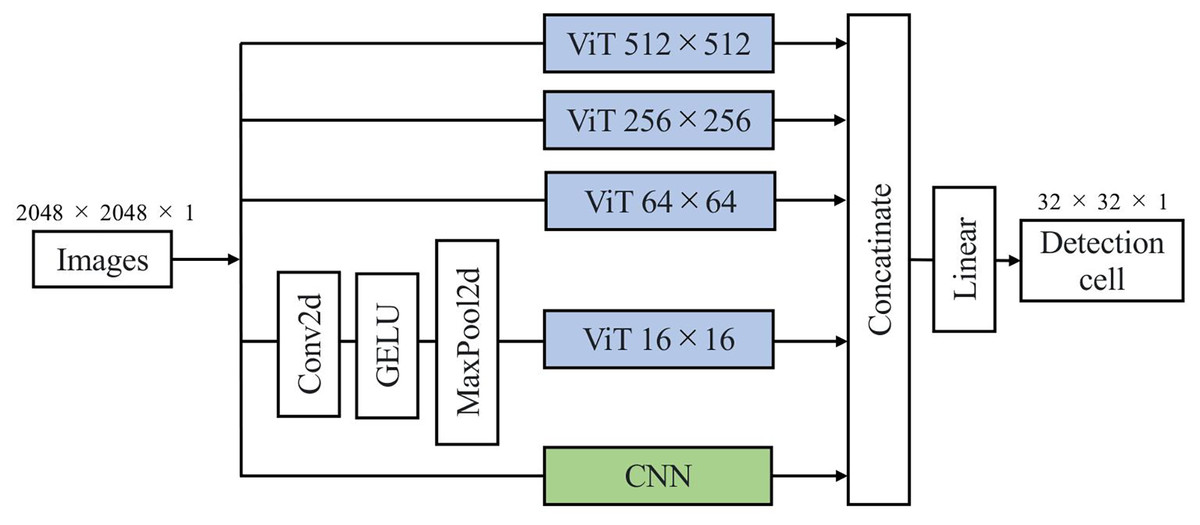
Figure 2: MIME-ViT model architecture proposed for enhanced breast cancer detection in mammograms in this research.
It uses a hybrid design to capture multiscale morphological features, with components for specific scale ranges from 512 512 to 16 16. This facilitates the extraction of both macro- and micro-morphological details of cancerous formations. The integration of multiscale processing and a loss function combining Dice and Focal losses enables MIME-ViT to effectively balance the detection of broad structures and fine details, thereby optimizing its performance in breast cancer detection.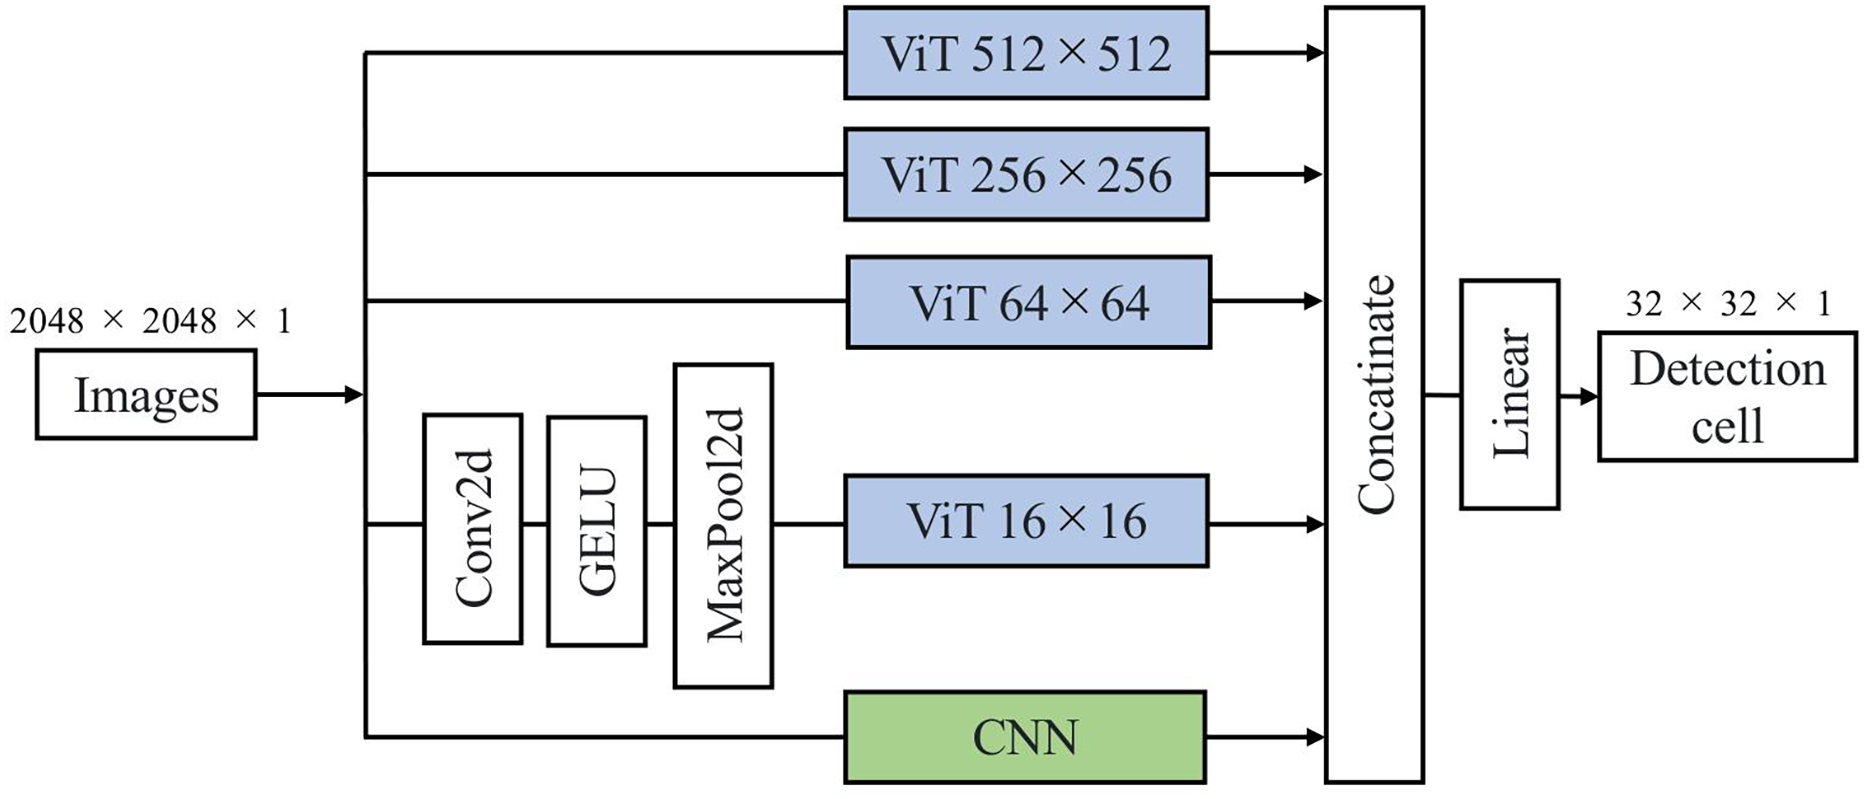
To validate the architectural design choices of MIME-ViT, we conducted systematic ablation studies. First, we evaluated the contribution of each ViT scale component by systematically removing individual components (ViT-512, ViT-256, or ViT-64) and measuring the performance impact on lesion detection accuracy. This approach allowed us to verify that each scale captures complementary information essential for accurate detection.
Second, we compared different CNN kernel sizes within the ResidualBlock components. The standard convolutional kernels were tested against kernels. The configuration enabled the use of pretrained weights from established computer vision models, while the configuration required random initialization due to dimensional incompatibility with existing pretrained models.
Finally, we investigated two feature fusion strategies for integrating multi-scale information. The initial approach employed additive fusion where features from different scales were combined through weighted summation ( ). The alternative approach used concatenation to preserve individual scale-specific features before final processing, allowing the model to learn optimal integration weights during training rather than enforcing a predetermined combination scheme.
Loss function
The loss function for MIME-ViT is defined as a combination of Dice loss and Focal loss (Lin et al., 2017). Dice loss is defined as (Sorensen, 1948; Dice, 1945), evaluating the overlap between the predicted segmentation mask and the actual ground truth. Meanwhile, Focal loss is defined as Eq. (1), prioritizing pixels that are more challenging to classify, thereby ensuring the model sufficiently attends to them. Term 2, as described in Eq. (2), represents the cross-entropy loss. By integrating both Focal loss and Dice loss, MIME-ViT is designed to address precise and refined detection tasks while managing the inherent imbalances between unmasked and masked pixels within the patch.
(1)
(2)
Model training and implementation
The DL dataset, comprising 2,601 mammography images, was divided into training, validation, and test sets at a 7:1.5:1.5 ratio, yielding 1,819, 391, and 391 images for each set, respectively (Fig. 1). To ensure that MLO images from the same patient’s right and left breasts were not split between the training and test sets, dataset partitioning was patient-based. To enhance the diversity and robustness of the trained deep learning model, rotational transformation, with a maximum of 40 degrees, was applied to the training set.
We trained the MIME-ViT model using the Adam optimizer with an initial learning rate of 0.001. Training was conducted for 15 epochs, employing cosine annealing as the learning rate scheduler (Fig. 3). Figure 3A displays the progression of the mean Intersection over Union (IoU) on the training data, while Fig. 3B shows the validation loss. The learning-rate schedule is presented in Figs. 3C, and 3D provides an analysis of the correlation between IoU and loss observed during the training process. To further optimize the training, we also utilized the AdamW optimizer (Loshchilov & Hutter, 2017) with a weight decay of 0.01, and Projected Conflicting Gradients (PCGrad) (Yu et al., 2020). The principal hyper-parameter settings are summarized in Table 1.
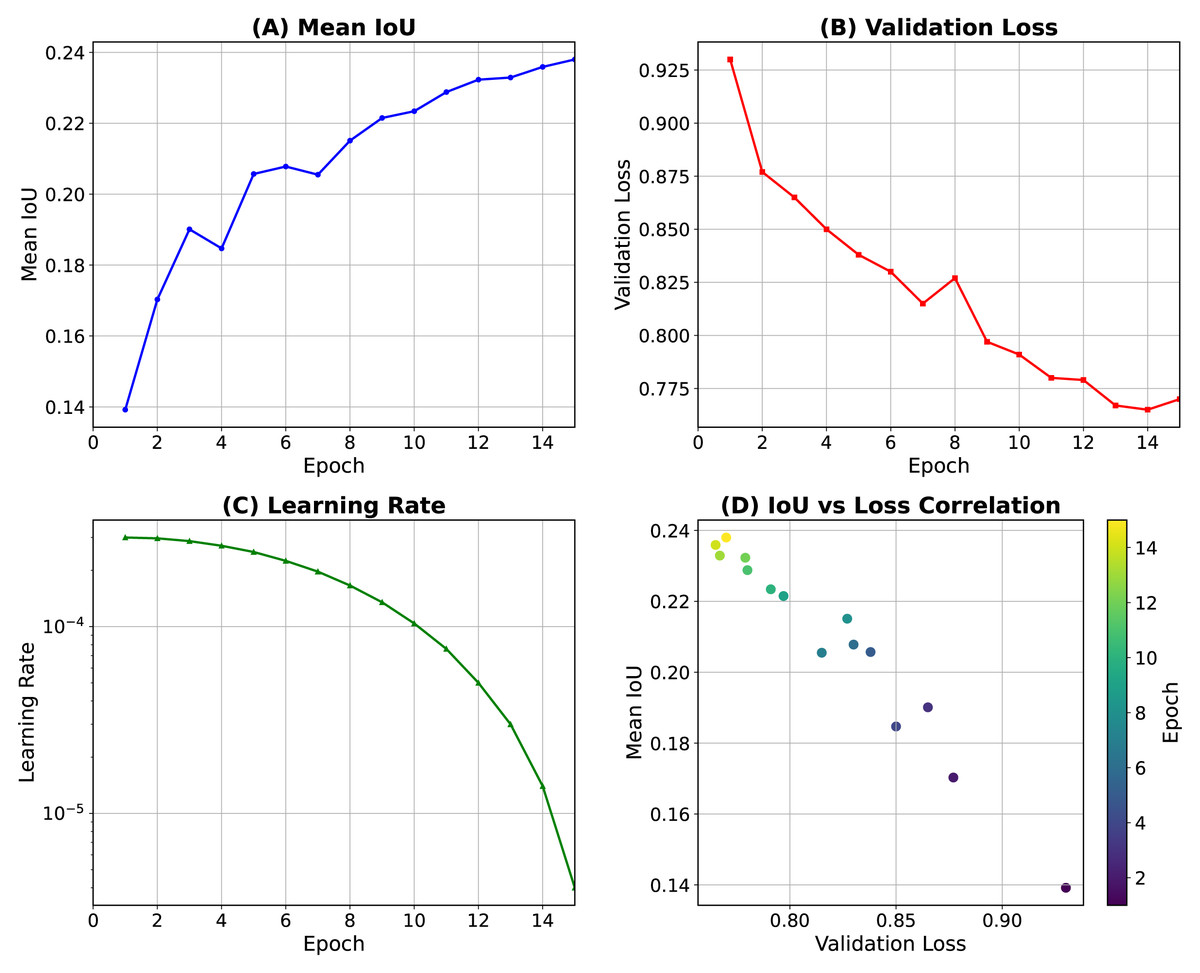
Figure 3: Training dynamics of the MIME-ViT model over 15 epochs.
(A) Mean intersection over union (IoU) on the training data. (B) Validation loss. (C) Learning-rate schedule using cosine (Loshchilov & Hutter, 2016). (D) Correlation between IoU and loss during training.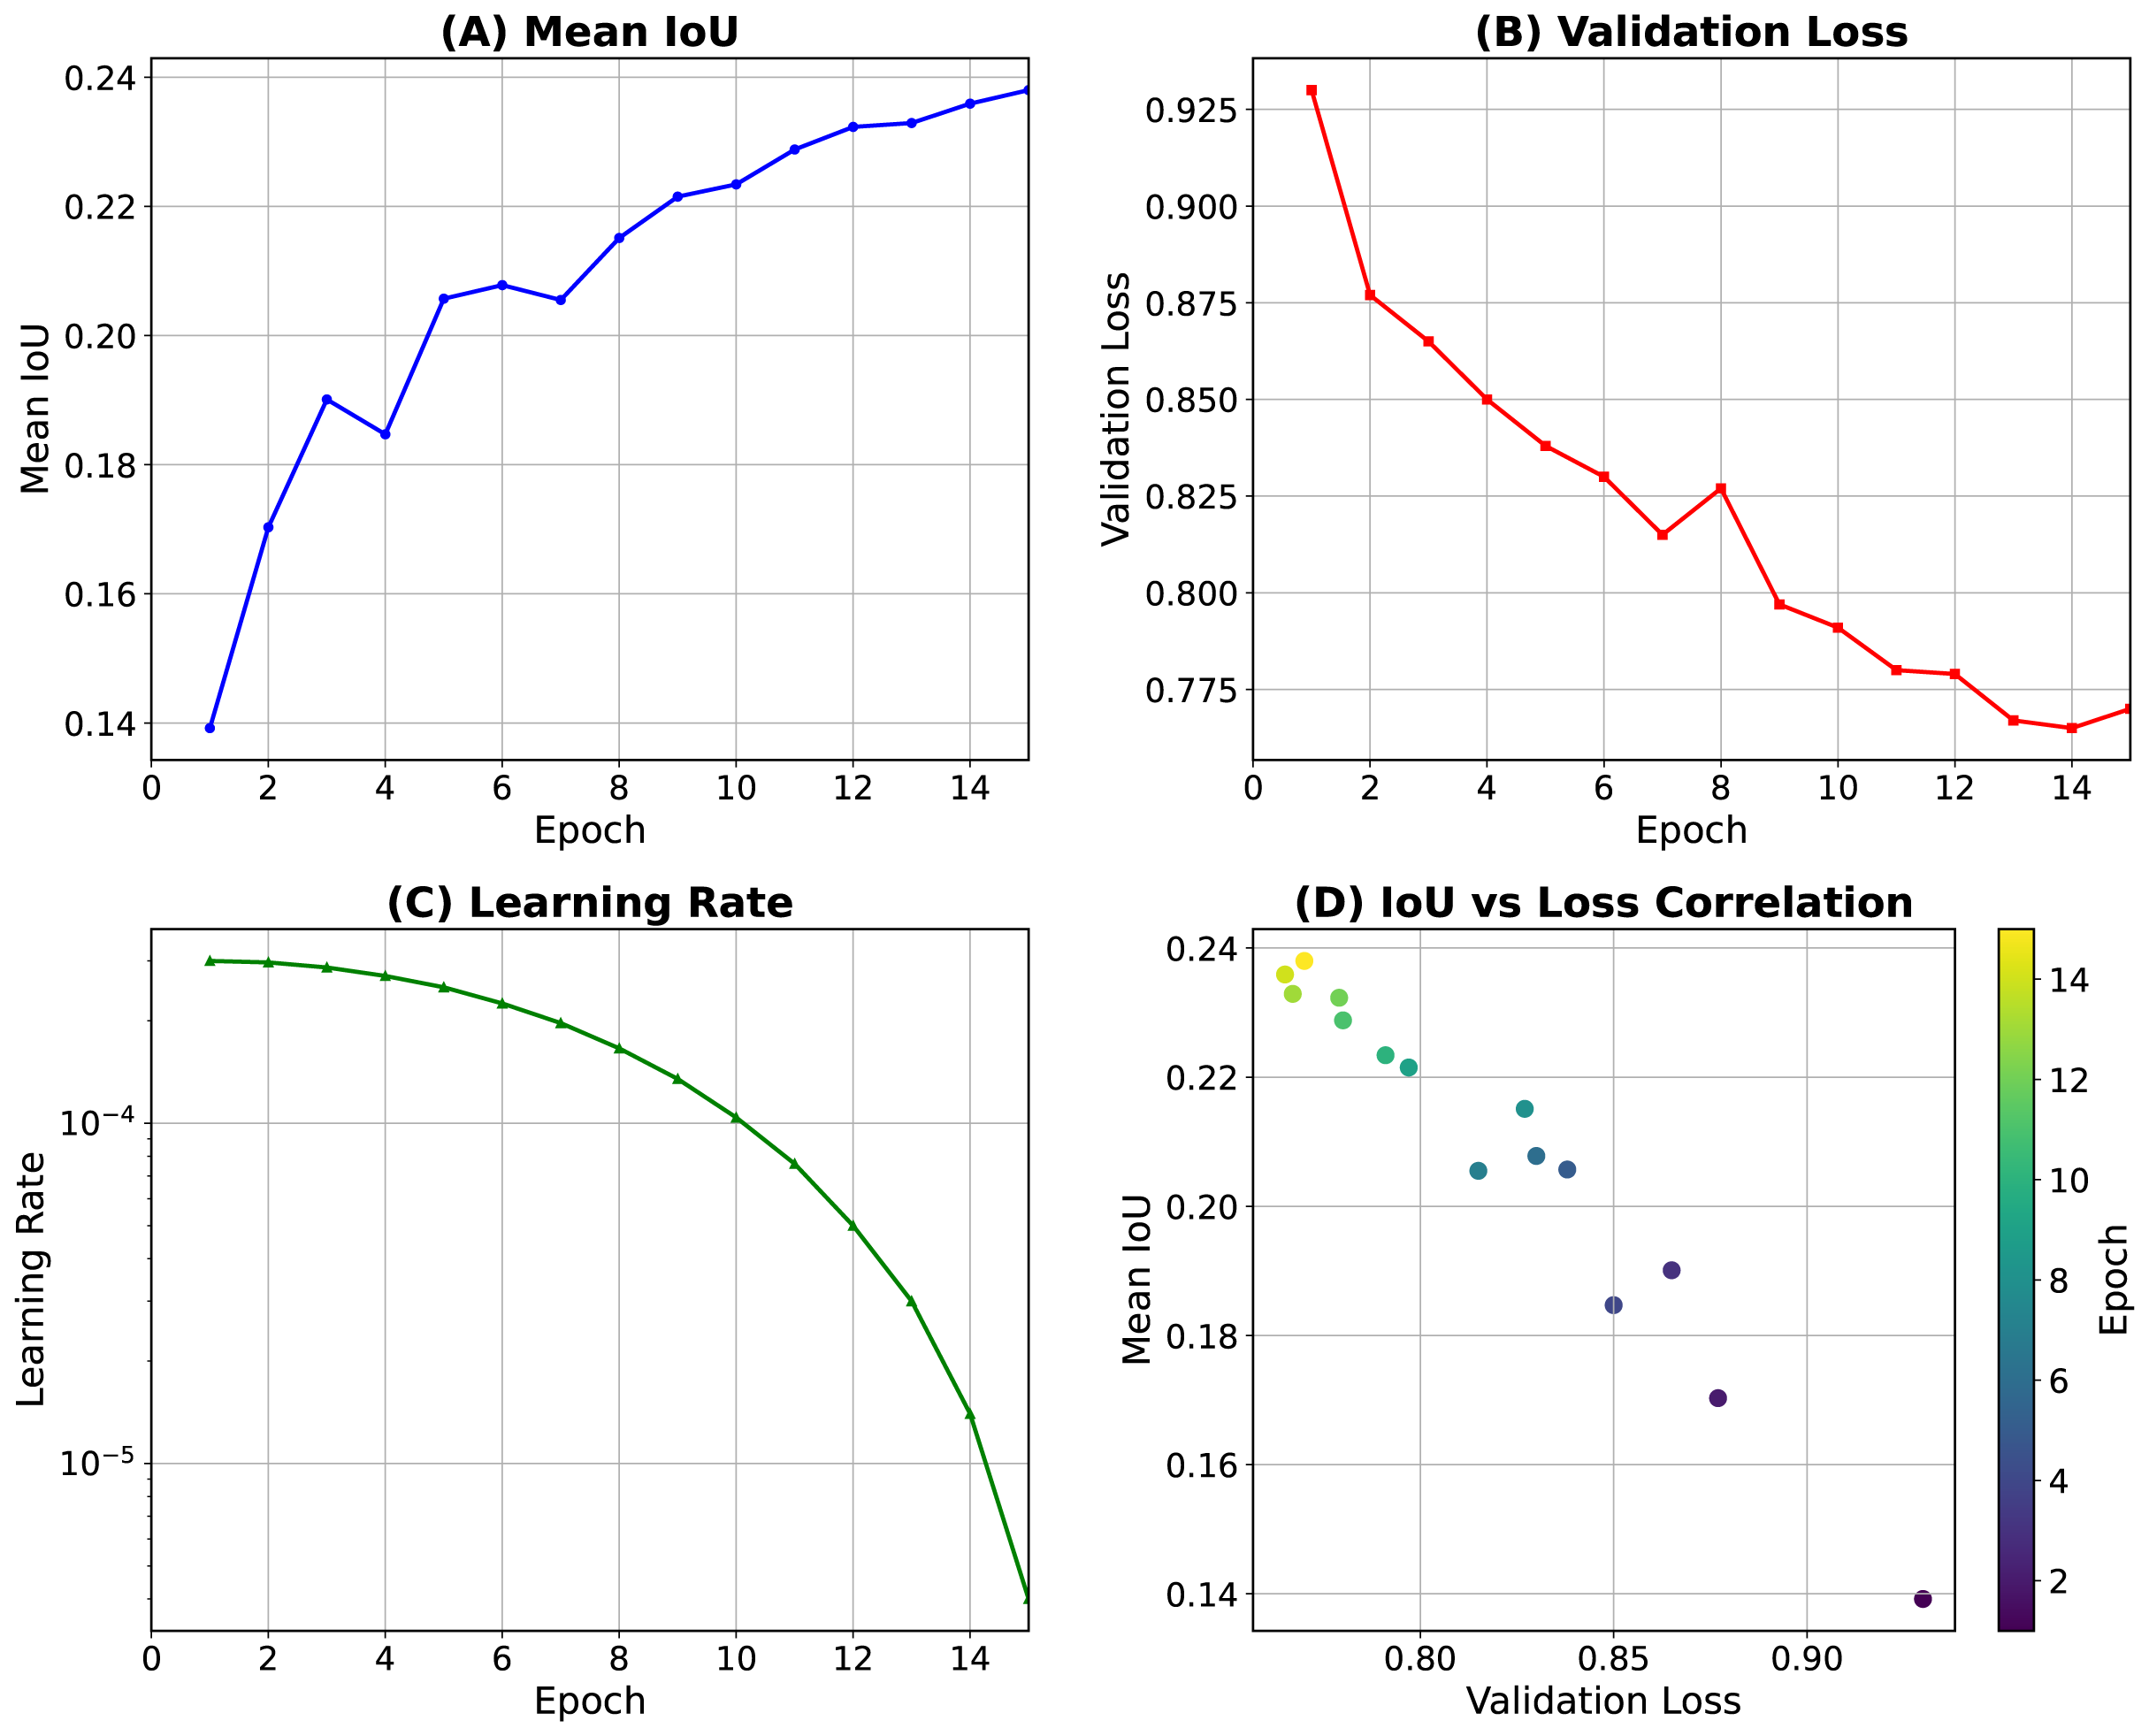
| Hyperparameter | Value |
|---|---|
| Batch size | 32 |
| Number of epochs | 15 |
| Learning rate | |
| Scheduler | CosineAnnealingLR ( , ) |
| Optimizer | AdamW (weight decay = 0.01) |
| Class weights | 6.0 (for non-empty annotations only) |
| Data augmentation | Horizontal flip, Rotation (within ± ) |
All ablation study configurations were trained using identical hyperparameters and data splits to ensure fair comparison, with model performance evaluated using the same IoU and specificity metrics as the main experiments.
Our computing system consisted of an Intel Core i5-10400 CPU and an NVIDIA RTX A6000 GPU with 48GB VRAM. Python 3.10 was utilized. The deep learning framework employed was PyTorch 1.13.0+cu117 with torchvision 0.14.0+cu117, running on CUDA 11.7.
Model assessment
The MIME-ViT model processes an input image to produce a tensor output, with each element representing a pixel mask patch within the original pixel image. These patches are binary, indicating the presence (1) or absence (0) of a feature, determined by the mask’s coverage area within the patch. In this study, a detection threshold of 0.2 was applied, whereby a patch was marked as ‘1’ if the mask covered over 20% of its area. This enhances the model’s sensitivity to subtle anomalies.
The Detection Transformer (DETR) model (Zhu et al., 2020), a Transformer-based object detection model, was adopted for comparison. DETR was implemented in two versions: with and without pre-training. Additionally, YOLOv8 (Jocher, Chaurasia & Qiu, 2023), a state-of-the-art convolutional neural network-based object detection model, was included for comparative evaluation. YOLOv8 was also implemented in two versions: with and without pre-training. In contrast, the MIME-ViT model was trained without pre-training.
(1) DETR-Scratch (DETR-S): without pre-training for any component. (2) DETR-Pretrained (DETR-P): with pre-training for both the backbone and detection head. (3) YOLOv8-Scratch (YOLOv8-S): YOLOv8x model without pre-training for any component. (4) YOLOv8-Pretrained (YOLOv8-P): YOLOv8x model with pre-trained weights on COCO dataset, representing the largest parameter variant in the YOLOv8 family.
The mean Intersection over Union (mIoU) for images with lesions and specificity for lesion-free images were used for comparative analysis. In mammography, a significant number of images do not contain any lesions. While mIoU is a suitable metric for evaluating detection performance on images with lesions, it cannot be directly applied to lesion-free images as there are no ground truth objects to calculate Intersection over Union against. Therefore, to assess the model’s ability to correctly identify lesion-free images, specificity was employed. Specificity is defined as the proportion of actual negatives that are correctly identified as such. The formula for specificity is:
(3) where TN represents the number of lesion-free images correctly classified as negative (i.e., no lesions detected), and FP represents the number of lesion-free images incorrectly classified as positive (i.e., lesions detected where none exist). As indicated in Table 1, the DETR-S model did not identify any lesions, calcifications, or masses. This means that for all images, including lesion-free ones, DETR-S produced no positive detections. Consequently, when evaluating lesion-free images, the number of FP was 0. Applying this to the specificity formula (TN/(TN + 0)), the specificity for DETR-S on lesion-free images is 100%, as all actual negative cases (lesion-free images) were correctly classified as negative due to the absence of any positive findings by the model.
A confidence score threshold of 0.5 was set for IoU calculation in DETR. Because MIME-ViT is designed for detection tasks and outputs patch-like masks rather than direct segmentation, bounding boxes were applied around the exterior of patches to enable IoU calculation for detection. For ground truth, patches were generated from labels, and bounding boxes were then applied around their exteriors.
Results
Tables 2 and 3 present IoU scores for lesion detection accuracy and specificity scores for identifying images without lesions, respectively, while Fig. 4 shows IoU score comparisons across different lesion categories. We employed YOLOv8x, the largest parameter model in the YOLOv8 family, which has been reported to achieve the highest accuracy among YOLOv8 variants. YOLOv8-Pretrained achieved the highest overall IoU score of 0.4516 across all lesions, with superior performance on mass lesions (0.4804) and moderate performance on calcification lesions (0.2796). DETR-Scratch failed to detect any lesions, resulting in zero IoU scores across all categories.
| Lesion type | Model | IoU (with lesions) | |
|---|---|---|---|
| Mean | Std. Dev | ||
| All | DETR-Scratch | 0.0000 | 0.0000 |
| DETR-Pretrained | 0.3691 | 0.3021 | |
| YOLOv8-Scratch | 0.3400 | 0.3728 | |
| YOLOv8-Pretrained | 0.4516 | 0.3260 | |
| MIME-ViT | 0.3342 | 0.2477 | |
| Mass | DETR-Scratch | 0.0000 | 0.0000 |
| DETR-Pretrained | 0.4227 | 0.2864 | |
| YOLOv8-Scratch | 0.3896 | 0.3743 | |
| YOLOv8-Pretrained | 0.4804 | 0.3220 | |
| MIME-ViT | 0.3814 | 0.2531 | |
| Calc | DETR-Scratch | 0.0000 | 0.0000 |
| DETR-Pretrained | 0.0280 | 0.1241 | |
| YOLOv8-Scratch | 0.0454 | 0.1759 | |
| YOLOv8-Pretrained | 0.2796 | 0.2948 | |
| MIME-ViT | 0.2491 | 0.2139 | |
| Model | Specificity |
|---|---|
| DETR-Scratch | 1.0000 |
| DETR-Pretrained | 0.6701 |
| YOLOv8-Scratch | 0.9124 |
| YOLOv8-Pretrained | 0.7887 |
| MIME-ViT | 0.2216 |
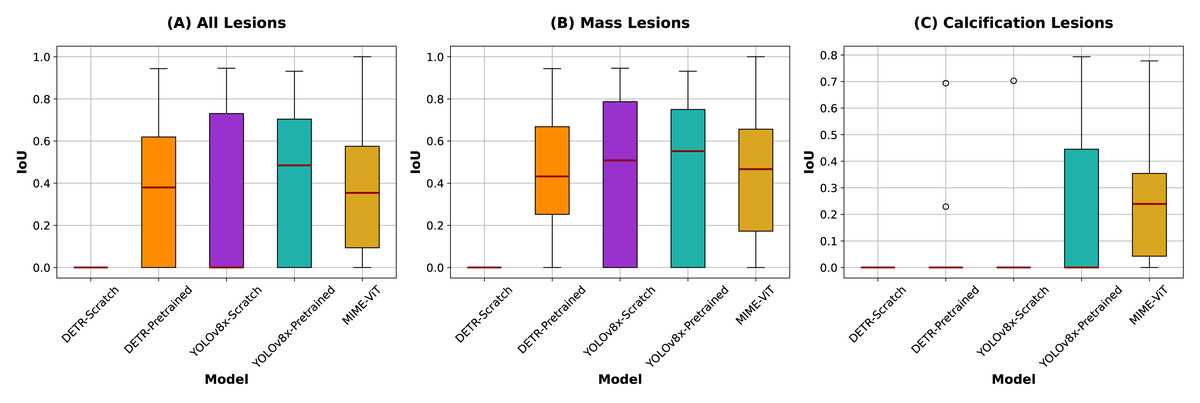
Figure 4: IoU scores comparison across different lesion categories.
Box plots illustrate the distribution of IoU scores for each model across all lesions (left), mass lesions (center), and calcification lesions (right), with red lines indicating the medians. For categories where IoU values are concentrated at 0.0000, dot plots are shown instead due to the lack of variability.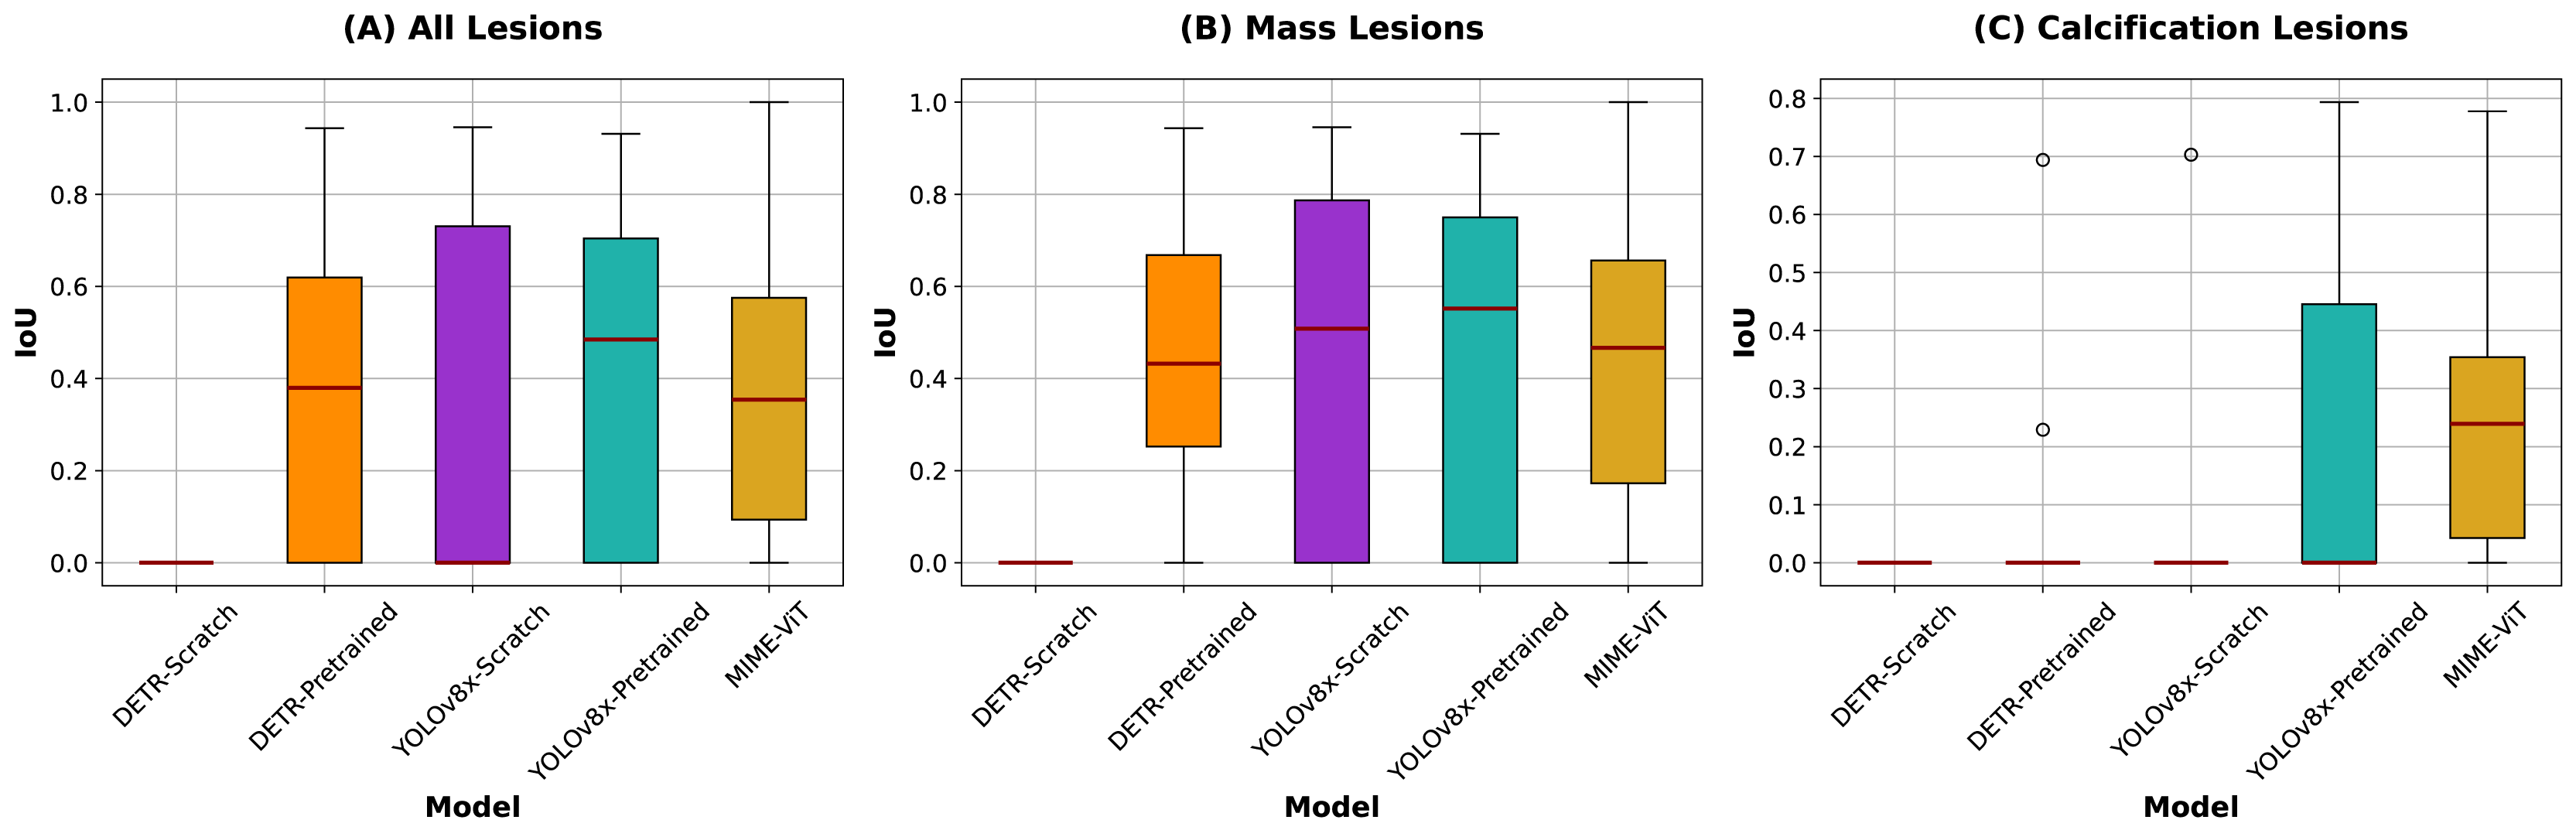
The proposed MIME-ViT model achieved an overall IoU of 0.3342, with scores of 0.3797 for mass lesions and 0.2491 for calcification lesions. While MIME-ViT showed lower mean IoU compared to YOLOv8-Pretrained, it demonstrated notably more stable performance with the lowest standard deviation across all lesion categories (0.2477 vs 0.3260 for overall, 0.2531 vs 0.3220 for mass lesions). For calcification detection, although MIME-ViT’s mean IoU (0.2491) was lower than YOLOv8-Pretrained (0.2796), MIME-ViT achieved superior median performance and substantially lower standard deviation (0.2139 vs 0.2948), indicating more consistent calcification detection capability.
For specificity in identifying images without lesions, excluding DETR-Scratch which achieved perfect specificity (1.0000) due to zero detections, YOLOv8-Pretrained demonstrated specificity of 0.7887. DETR-Pretrained showed a specificity of 0.6701. MIME-ViT exhibited the lowest specificity at 0.2216 among all detection-capable models, indicating higher false positive rates in lesion-free images.
Ablation studies and component analysis
To validate the architectural design choices and understand the contribution of each component, we conducted comprehensive ablation studies examining ViT scale ranges, CNN kernel sizes, and feature fusion strategies.
We first systematically evaluated the contribution of each ViT component through systematic removal experiments. Table 4 demonstrates that each scale contributes unique information to the final prediction:
| Configuration | Mean IoU | Mass IoU | Calc IoU |
|---|---|---|---|
| Full MIME-ViT | 0.3342 | 0.3814 | 0.2491 |
| w/o ViT-512 | 0.3156 | 0.3621 | 0.2287 |
| w/o ViT-256 | 0.3089 | 0.3547 | 0.2195 |
| w/o ViT-64 | 0.3198 | 0.3672 | 0.2341 |
The removal of any ViT component resulted in performance degradation across all metrics, with ViT-256 removal showing the largest impact (IoU decrease of 0.0253). This validates our hypothesis that each scale captures complementary information: ViT-512 for global context, ViT-256 for intermediate-scale features, and ViT-64 for high-resolution details.
We also investigated the impact of CNN kernel sizes within the ResidualBlock component by comparing kernels (baseline) vs kernels. Table 5 summarizes the results:
| Kernel size | Mean IoU | Mass IoU | Calc IoU | Pretrained weights | Training status |
|---|---|---|---|---|---|
| (baseline) | 0.3342 | 0.3814 | 0.2491 | Available | Stable convergence |
| 0.2947 | 0.3362 | 0.2198 | Not compatible | Random initialization |
The kernel configuration achieved superior performance (IoU = 0.3342 vs 0.2947) primarily due to its compatibility with pretrained weights, which enabled stable convergence and better feature initialization. The configuration, requiring random initialization due to dimensional incompatibility with pretrained weights, showed reduced performance despite the larger receptive field.
Finally, we systematically compared different feature fusion approaches to optimize multi-scale information integration. Table 6 presents the comparison between additive and concatenation-based fusion strategies:
| Fusion strategy | Mean IoU | Mass IoU | Calc IoU | Architectural benefit |
|---|---|---|---|---|
| Concatenation (final) | 0.3342 | 0.3814 | 0.2491 | Preserves scale-specific features |
| Additive fusion | 0.3087 | 0.3542 | 0.2218 | Simpler parameter count |
The concatenation-based approach achieved superior performance (IoU improvement of 0.0255) compared to the initial additive fusion strategy ( ). This improvement demonstrates that preserving individual scale-specific features enables the model to learn optimal integration strategies rather than enforcing uniform feature combination.
Figures 5, 6, and 7 depict the prediction results obtained using MIME-ViT. Figure 5 illustrates a representative true positive detection by MIME-ViT, accurately identifying breast lesions with an IoU score of . Figure 6 presents a complex scenario with the model’s predictions including both false positives (incorrect lesion predictions in lesion-free areas) and false negatives (missed detections of actual lesions). Figure 7 depicts a false negative case where the model failed to detect breast lesions despite their presence in the ground truth, resulting in an IoU score of .
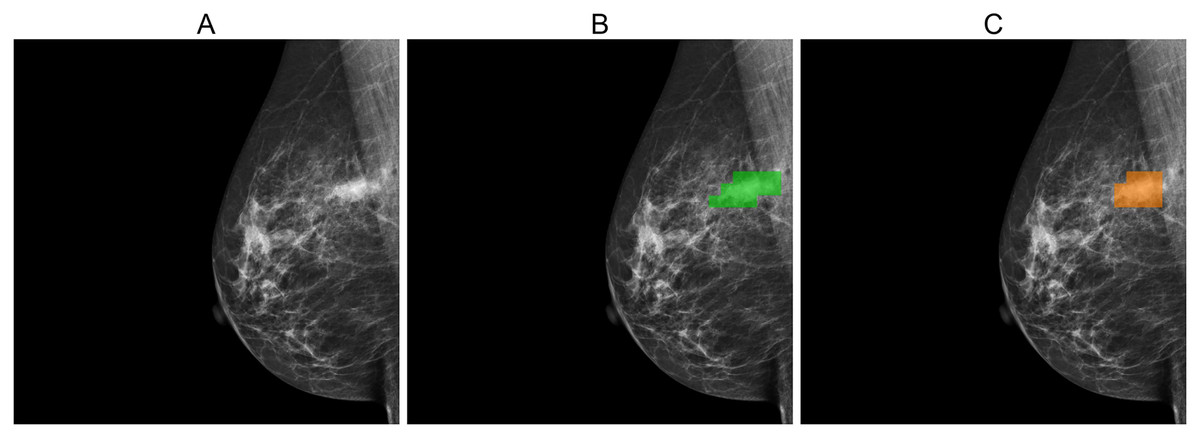
Figure 5: (A) Original image, (B) ground truth segmentation mask, (C) predicted segmentation mask using MIME-ViT.
This example illustrates a true-positive case where the model accurately predicted breast lesions, achieving an IoU score of 0.5882.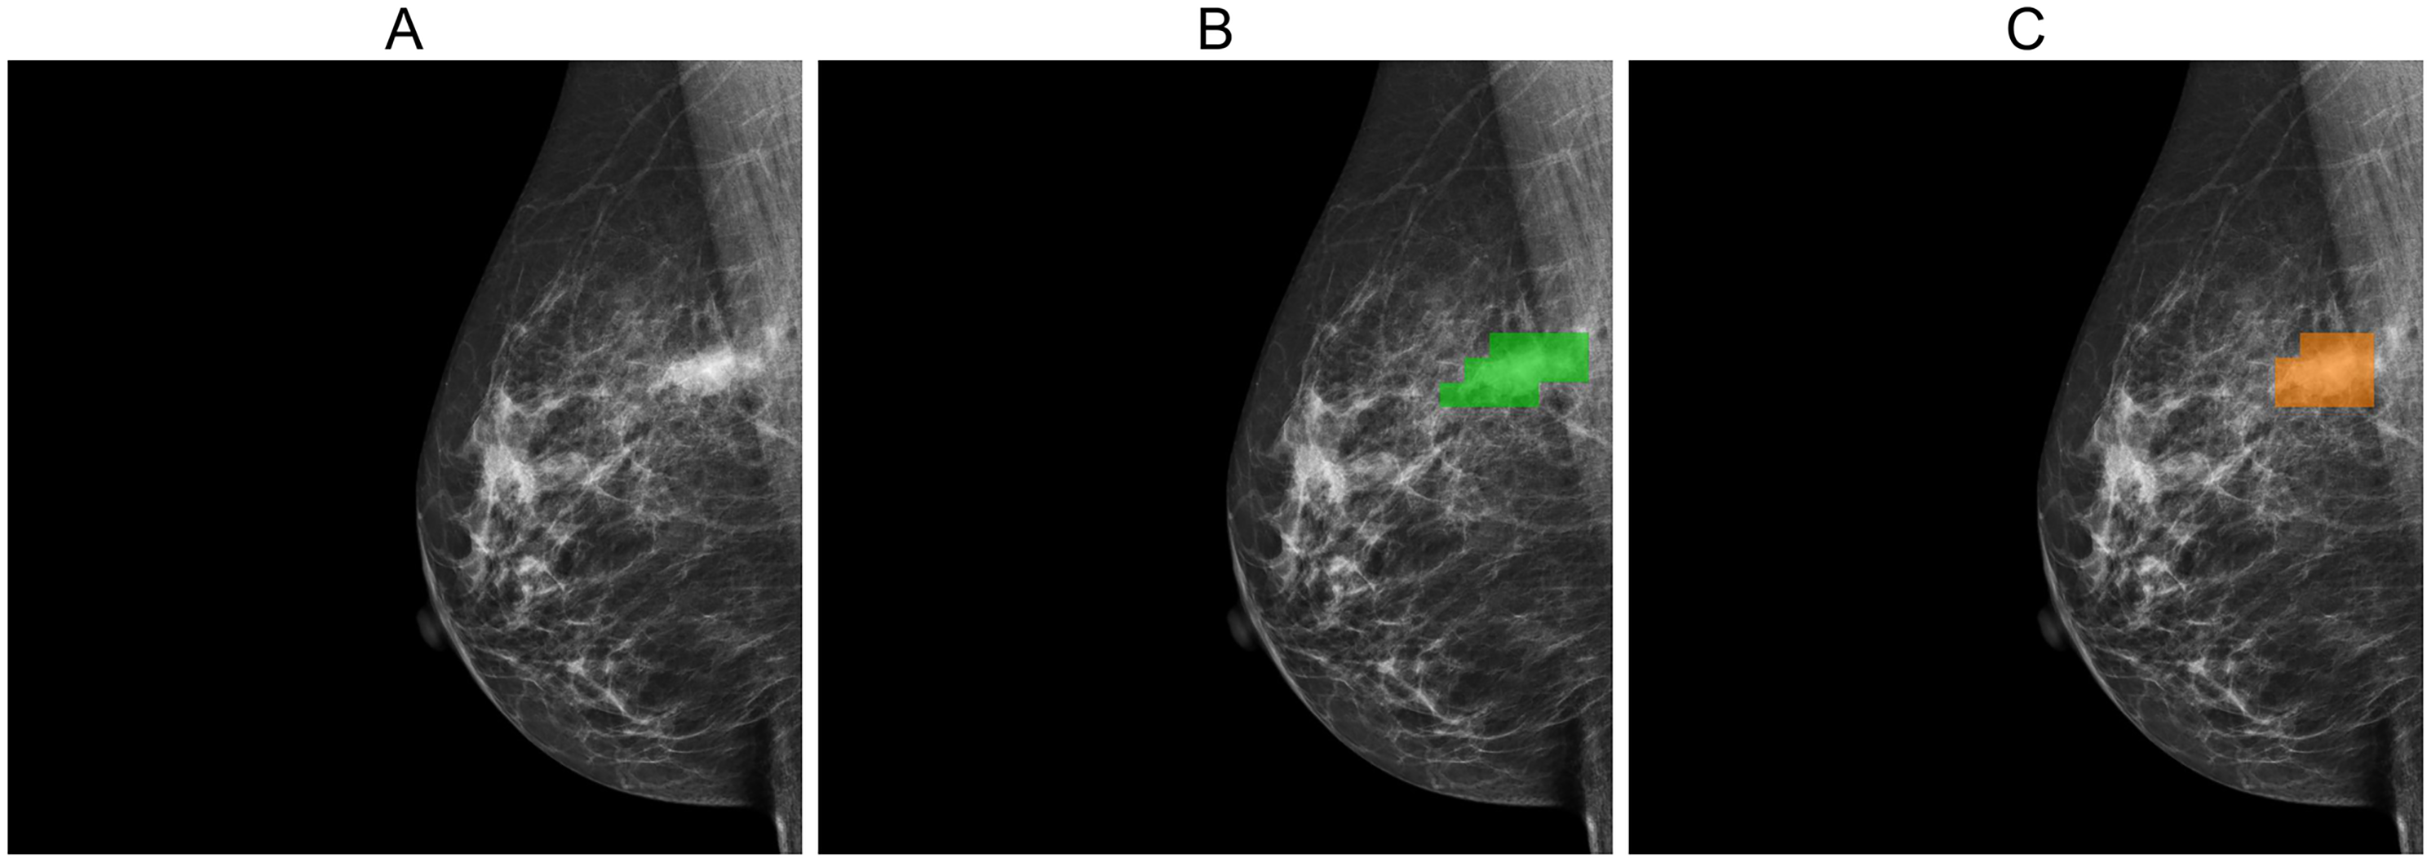
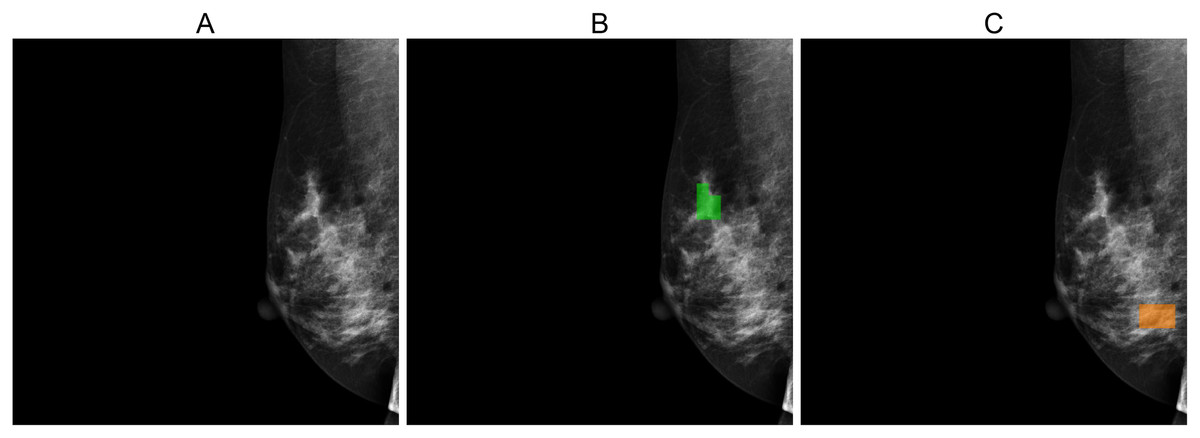
Figure 6: (A) Original image, (B) ground truth segmentation mask, (C) predicted segmentation mask using MIME-ViT.
The images depict a case where the MIME-ViT model incorrectly predicts the presence of breast lesions in areas different from the ground truth, achieving an IoU score of 0.0.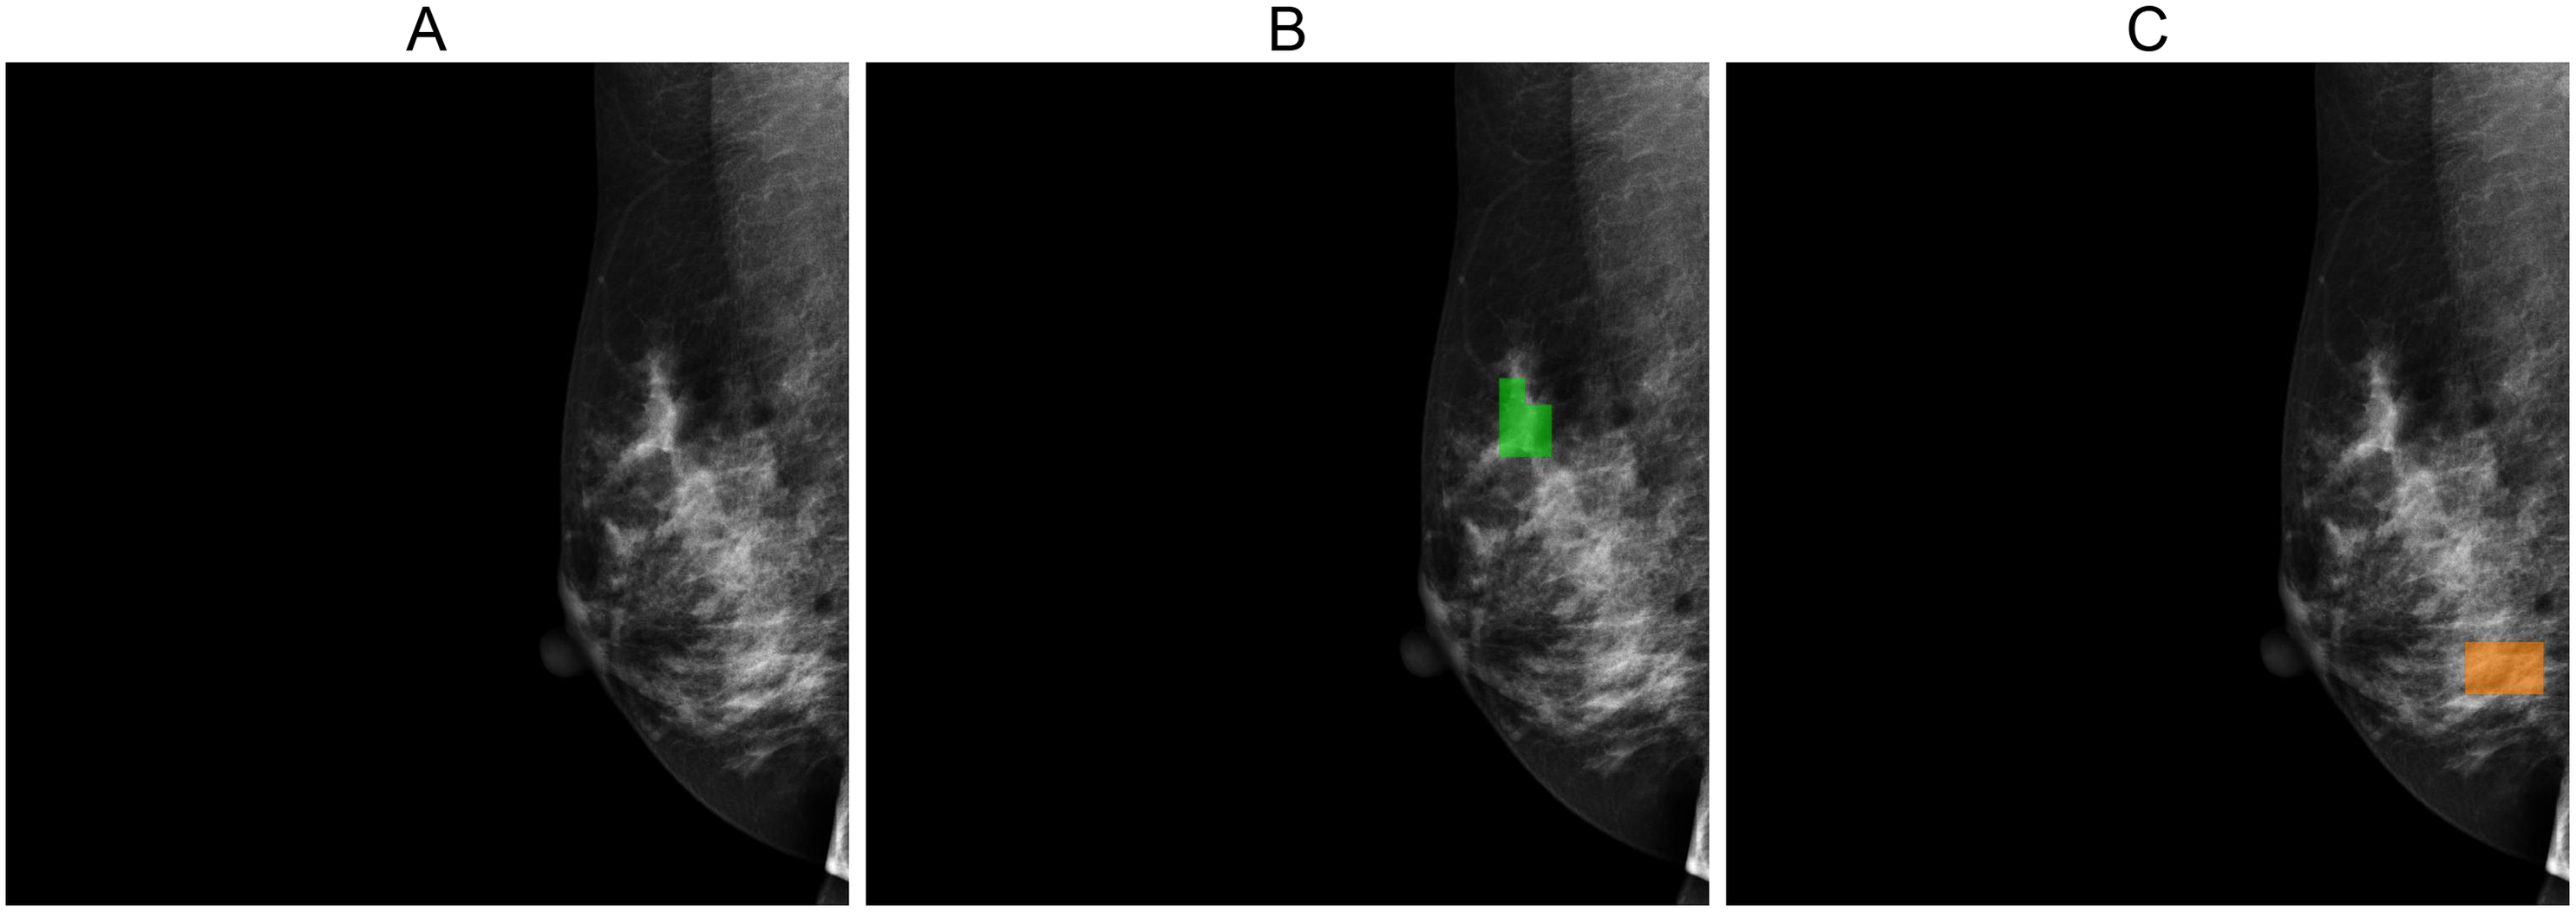
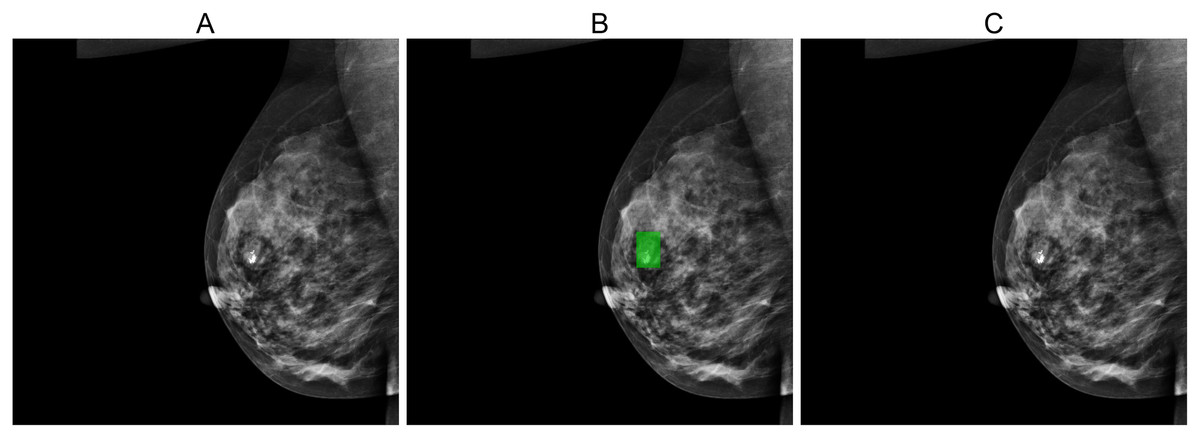
Figure 7: (A) Original image, (B) ground truth segmentation mask, (C) Predicted segmentation mask using MIME-ViT.
The images illustrated a false negative case where the MIME-ViT model did not detect any breast lesion despite the presence of a breast lesion in the ground truth, achieving an IoU score of 0.0.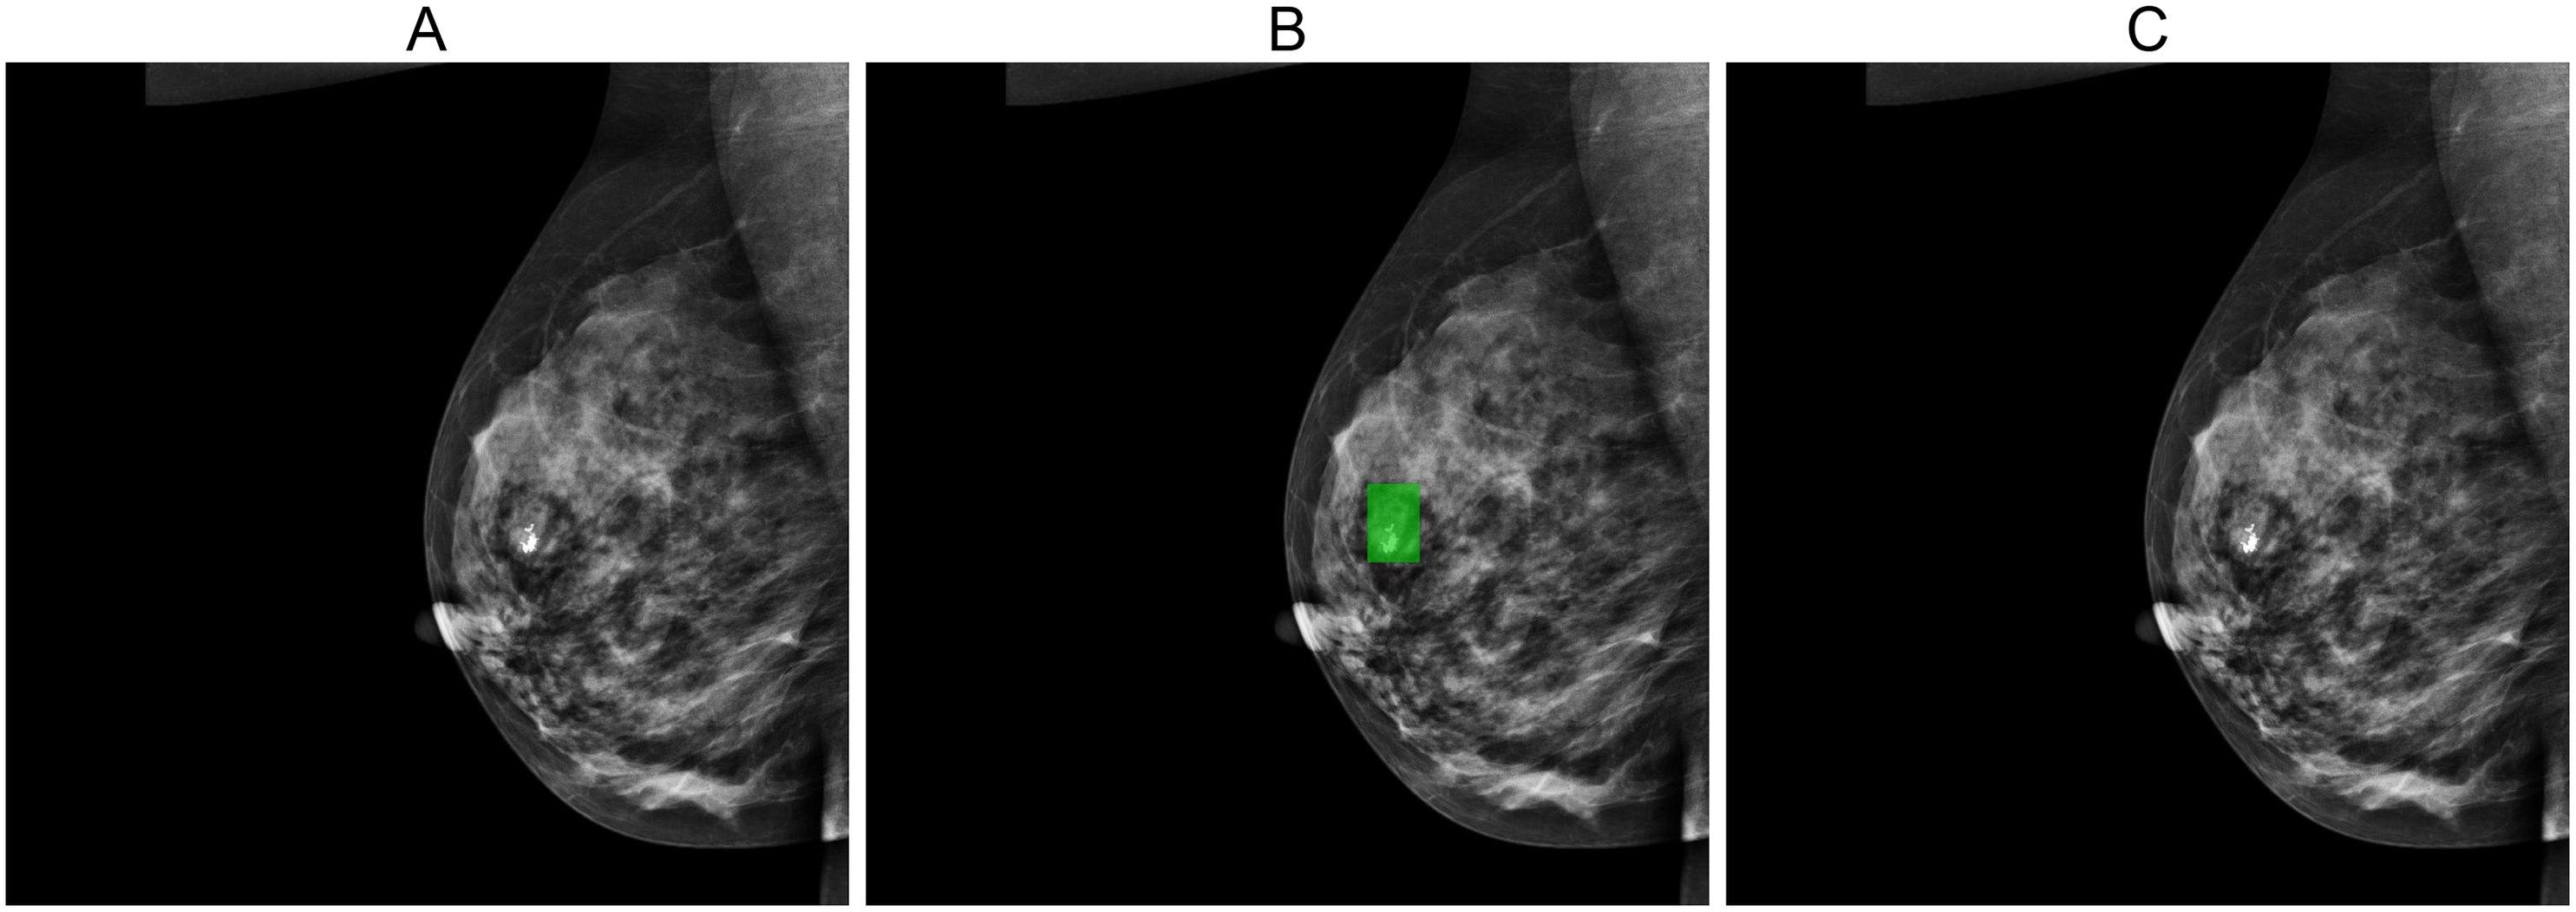
Discussion
MIME-ViT demonstrates notable detection accuracy without the need for pre-training, even with a larger parameter count (112.9 million) compared to DETR (41.3 million). This is significant because traditional Vision Transformers typically depend on extensive datasets or pre-training for optimal performance. For example, DETR-S, which lacked pre-training, registered an IoU of 0.000, highlighting the usual necessity for substantial training data. In contrast, MIME-ViT achieved comparable accuracy to the pre-trained DETR-P, indicating that its architecture is well-optimized to perform effectively without the conventional reliance on large datasets or pre-training. This showcases MIME-ViT’s capability in efficiently handling data-intensive tasks.
Traditional Vision Transformers (ViTs) generally require extensive data to achieve optimal performance, often relying on either large datasets or pre-training strategies. In this study, DETR-S, which did not undergo pre-training, demonstrated an IoU of 0.000, reinforcing this dependency. However, MIME-ViT, despite having a larger parameter count than DETR (112.9 million vs 41.3 million), matched the performance of DETR-P without the need for pre-training. This result emphasizes the efficiency and robustness of MIME-ViT’s architecture. This result is considered to be attributed to two primary reasons:
-
The integration of multiscale analysis, an inductive bias (Battaglia et al., 2018) similar to a method utilized in physicians’ evaluations, enhances the model’s efficiency. This alignment with expert assessment practices allows for more efficient parameter optimization during the model’s training. Consequently, the model finds optimal solutions more readily, leading to high accuracy in specific tasks such as the detection of calcification, as demonstrated in this research.
-
General segmentation models assign a class to each pixel within an area, whereas the MIME-ViT model allocates broader patches, specifically 64 × 64 pixel blocks. This approach categorizes MIME-ViT as a segmentation-like model. Such a segmentation-like design is believed to contribute to the model’s heightened learning efficiency (Ciresan et al., 2012). Given the demonstrated efficacy of MIME-ViT in achieving comparable accuracy, its architectural design, especially the multiscale structure, exhibits potential applicability beyond detection to include segmentation and classification tasks. This research introduced a multiscale structure with four layers: , , , and pixels. However, depending on the main task, the optimal configuration of layers might vary.
There are several limitations in this research. First, the model’s evaluation on a dataset may not cover sufficient diversity, impacting its wider applicability and presenting a risk of overfitting. Improvement could be achieved by expanding the dataset to include a wider variety of images from diverse demographics and conditions. Additionally, implementing techniques such as data augmentation and cross-validation could help mitigate overfitting and improve the model’s generalizability. Second, MIME-ViT has not undergone pre-training. While further accuracy improvements are expected with the application of pre-training, the significantly different model structure from conventional DL models poses a challenge. Adapting MIME-ViT to utilize traditional pre-trained models requires a reconstruction of the model’s structure. Future plans include exploring pre-training MIME-ViT with datasets such as ImageNet. Third, the model’s decision-making process is not transparent, a critical factor for its adoption in medical settings where interpretability is key. Although Vision Transformers (ViTs) have the capability to visualize attention maps, offering a potential pathway to greater transparency, this feature was not utilized in our study. Recent advances emphasize that Explainable AI (XAI) integration is essential for building clinical trust (Singh & Patnaik, 2025), and future development will incorporate Grad-CAM and similar interpretability techniques into MIME-ViT to enhance transparency. Fourth, our approach to generating bounding boxes by circumscribing the exterior of segmented patches for IoU calculation may warrant further consideration. For lesions with irregular shapes, this method could potentially include extraneous background regions, which in turn might lead to an underestimation of the model’s true detection performance. Exploring alternative strategies for bounding box generation in future work could therefore be beneficial for achieving a more precise evaluation. Lastly, the model’s performance in controlled conditions might not directly translate to real-world clinical environments, where variability is greater.
Conclusions
The MIME-ViT model is a significant advancement in breast cancer detection, combining Vision Transformers and CNNs for improved mammographic imaging analysis. Its development represents a crucial step forward in medical imaging, aiming to enhance early detection and patient outcomes with its innovative approach. As the field of medical imaging evolves, MIME-ViT represents a pivotal step towards more effective and technologically advanced cancer screening methodologies.