
Comparison of fractionation methods for soil phosphorus with soils subjected to various long-term fertilization regimes on a calcareous soil
- Published
- Accepted
- Received
- Academic Editor
- Jorge Gonzalez Garcia
- Subject Areas
- Bioinorganic Chemistry, Inorganic Chemistry (other), Theoretical and Computational Chemistry
- Keywords
- Soil phosphorus fractions, Tiessen-Moir fractionation method, Jiang-Gu fractionation method, Long-term fertilization experiment
- Copyright
- © 2021 Jin et al.
- Licence
- This is an open access article distributed under the terms of the Creative Commons Attribution License, which permits unrestricted use, distribution, reproduction and adaptation in any medium and for any purpose provided that it is properly attributed. For attribution, the original author(s), title, publication source (PeerJ Inorganic Chemistry) and either DOI or URL of the article must be cited.
- Cite this article
- 2021. Comparison of fractionation methods for soil phosphorus with soils subjected to various long-term fertilization regimes on a calcareous soil. PeerJ Inorganic Chemistry 3:e3 https://doi.org/10.7717/peerj-ichem.3
Abstract
Background
Diverse phosphorus (P) fractionation procedures presented varying soil P fractions, which directly affected P contents and forms, and their biological availability.
Purpose
To facilitate the selection of phosphorus (P) fractionation techniques, we compared two procedures based on a long-term experiment on a calcareous soil.
Methods
The soils containing a gradient P levels were sampled from seven treatments predictor under various long-term fertilizations. The P fractions were then separated independently with both fractionation procedures modified by Tiessen-Moir and Jiang-Gu.
Results
The results showed that the labile P in Jiang-Gu is significantly lower than that in Tiessen-Moir. The iron and aluminium-bounded P were greater in Jiang-Gu by a maximum of 46 mg kg−1 than Tiessen-Moir. Jiang-Gu fractionation gave similar Ca bounded P to that Tiessen-Moir did at low P level but greater contents at high P level. The two methods extracted much comparable total inorganic P. However, Tiessen-Moir method accounted less total organic P than ignition or Jiang-Gu method (the organic P (Po) estimated by subtract the total inorganic P (Pi) in Jiang-Gu fractionation from the total). P uptake by winter wheat was significantly and positively correlated with all phosphorus fractions in Jiang-Gu; Resin-P, NaHCO3-Pi, D. HCl-P, C. HCl-Pi, NaOH-Po, total-Po in Tiessen-Moir; P fraction categories of Ca-P, Fe & Al-P and total-Pi in both fractionations. Path coefficients indicated that Ca2-P in Jiang-Gu, NaHCO3-Pi and D. HCl-P in Tiessen-Moir had the higher and more significant direct contributions to P uptake among P fractions measured.
Conclusions
Our results suggested that Jiang-Gu procedure is a better predictor in soil P fractionation in calcareous soils, although it gives no results on organic P fractions.
Introduction
Phosphorus (P) is essential and generally considered as a constraining nutrient in most cases in natural ecosystems (Elser et al., 2007; Li et al., 2013). P exists in soils in inorganic and organic forms, and their availability are generally evaluated by soil P fractionation (Cross & Schlesinger, 1995; Negassa & Leinweber, 2009). On calcareous soils, the P fractionation method developed by Chang & Jackson (1957) has been widely accepted, which has later been modified by Jiang & Gu (1989). The modification further separated the calcium bounded phosphorus into three fractions varying in solubility and bioavailability. Calcium-related phosphorus was specifically divided into dicalcium phosphate (Ca2-P), octacalcium phosphate (Ca8-P) and apatite types (Ca10-P). However, this fractionation did not take organic P fractions into consideration. Although organic P usually constitutes less than 25% of the total P in calcareous soils (Yang et al., 2009), it cannot be ignored because it serves as an important source of phosphorus in soils with low P levels (Dalal, 1977). Microbial biomass P may play a leading role in P cycle and thus contributing to the activation and utilization of inorganic P, especially in soils with relatively higher organic carbon contents (Wu et al., 2003; Ahmed et al., 2019). Phosphorus fractionation method modified by Tiessen & Moir (1993) from that proposed by Hedley, Stewart & Chauhan (1982) took into account the fractions of both inorganic P and organic P and its availability to crops, and thus has been widely adopted to quantitatively evaluate soil P fractions and transformations under different soil types, cropping systems, tillage practices and fertilization management regimes (Cross & Schlesinger, 1995; Negassa & Leinweber, 2009; Yan et al., 2016; Braos et al., 2020).
Different phosphorus fractionation procedures presented varying soil P fractions, which directly affected their quantities and the evaluation of their biological availability (Xiang, Huang & Li, 2004; Negassa & Leinweber, 2009; Ahmed et al., 2019; Wan et al., 2019). Therefore, the comparison of soil P fractionations can not only provide reasonable explanations of the observations in terms of the bioavailability, but also give insight into the accuracy of estimation of the procedure, and thus to facilitate the selection of fractionation techniques in investigation of phosphorus pools as affected by fertilization and so forth. Previously, Levy & Schlesinger (1999) compared the fractionation procedures developed by Hedley and Ruttenberg on soils with diverse and contrasting physical and chemical characteristics, and found that Hedley fractionation underestimated the contents of NaOH-P and organic P. However, Ruttenberg fractionation was developed for investigating marine sediments, it is therefore impossible to allow the comparison of the crop-based bioavailability. On an acidic soil, Soinne et al. (2011) found that the modified Chang & Jackson procedure gave significantly lower contents of NaOH-P, but higher contents of available P and dilute hydrochloric acid extracted inorganic P (D. HCl-P) compared to modified Hedley procedure, and also found lower estimation on with latter. On three acidic soils, after comparison of the P concentrations obtained with Chang & Jackson fractionation and Sekiya fractionation, Otani & Ae (1997) concluded that the Chang & Jackson method overestimated Ca-P concentration. The chemical composition and crystallization status of soil P in acidic soils are completely different from that in calcareous soils. Therefore, the variation in P cycling process and bioavailability can be conceived. An extensive list of references can be found working on P fractionation with the Jiang-Gu procedure on a wide range of soils, but only a few on calcareous soils (Samadi & Gilkes, 1999; Lv et al., 2003; Xiang, Huang & Li, 2004; Wang et al., 2010; Song et al., 2017). In recent years, with widespread increases in soil organic carbon (Huang & Sun, 2006) and soil phosphorus accumulation (Li et al., 2011) on calcareous soils, the proportion of organic P to total P remains unchanged or even dropped (Yang et al., 2010). Concerns on the role of soil organic phosphorus have been raised. As a result, increasing number of attempts to quantify P pools, including organic P, with Tiessen-Moir fractionation have been made on calcareous soils (Zhang et al., 2006; Zhang, Wang & Feng, 2007; Yan et al., 2016; Khan et al., 2021). However, there is no information on the comparison of these two widely employed soil P fractionation procedures in calcareous soils. Here, we compared the soil phosphorus fractionation procedures proposed by Hedley and modified by Tiessen & Moir (1993) and that were improved by Jiang & Gu (1989) from that proposed by Chang & Jackson (1957) based on soils with a gradient of phosphorus level subjected to various long-term fertilization regimes on a calcareous soil. Further, we fitted linear regressions between the corresponding fractions/categories obtained with two fractionations to quantify departures from identity line (1:1). Model II regression (reduced major axis) method was employed to account for error in both x and y (Ludbrook, 2012), thus allowing us to compare the difference statistically in both slope and intercept, and to make more precise explanations to the results. The aim of this study was to provide relevant information to facilitate the selection of soil P fractionation techniques on calcareous soils.
Materials and Methods
Study site and experimental design
The soils used in this study were collected from a long-term experiment, which was initiated in October 1990 in the “Chinese National Soil Fertility and Fertilizer Efficiency Monitoring Base for Loessial Soil” (N34°17′51″, E108°00′48″, with an altitude of 524.7 m a.s.l.), located in the southern verge of Loess Plateau, Yangling, Shaanxi Province of P. R. China. The experimental site has a mean annual temperature of 13.0 °C and mean annual precipitation of ca. 550 mm. The rain falls mainly from June to September. The soil at the site is a silt clay loam (clay 32%, silt 52% and sand 16%. Anthrosols with a terric horizon derived from manure and loess material; IUSS Working Group WRB, 2014). On average, at the time of establishment the plough layer soil (0–20 cm) contained 7.44 g kg−1 organic C, 0.93 g kg−1 total N, 9.57 mg kg−1 Olsen P, 191 mg kg−1 exchangeable K and 92.5 g kg −1CaCO3, and had a pH of 8.62 (1:1 soil /water ratio).
| Treatment | Winter wheat | Summer maize | |||||
|---|---|---|---|---|---|---|---|
| N | P | K | N | P | K | ||
| (kg ha−1) | |||||||
| CK | 0 | 0 | 0 | 0 | 0 | 0 | |
| N | 165 | 0 | 0 | 187.5 | 0 | 0 | |
| NK | 165 | 0 | 68.5 | 187.5 | 0 | 0 | |
| PK | 0 | 57.6 | 68.5 | 0 | 24.6 | 77.8 | |
| NP | 165 | 57.6 | 0 | 187.5 | 24.6 | 0 | |
| NPK | 165 | 57.6 | 68.5 | 187.5 | 24.6 | 77.8 | |
| SNPK | 165+40.4a | 57.6+3.8a | 68.5+83.5a | 187.5 | 24.6 | 77.8 | |
| M1NPK | 49.5+115.5a | 57.6+105.9a | 68.5+138.9a | 187.5 | 24.6 | 77.8 | |
| M2NPK | 74.3+173.2a | 86.4+158.9a | 102.8+208.35a | 187.5 | 24.6 | 77.8 | |
Notes:
The data followed by letter “a” indicate the quantity of N/P/K contained in the organic supplements.
Long-term field experiment was under winter wheat (Triticum aestivum L.) and summer maize (Zea mays L.) two couples a year with each plot measuring 14 m ×14 m. It involved nine nutrient management treatments, i.e., no synthetic fertilizers or manure input (control, here after CK) and various combinations of synthetic nitrogen (N), phosphate (P) and potassium (K) fertilizers, as N, NK, PK, NP, NPK, and NPK plus crop straw/stalk incorporation (SNPK, S refers to stalk return) and NPK plus two doses of dairy manure (M1NPK and M2NPK, where M refers to dairy manure, 1 and 2 refer the doses of organic supplement). The SNPK treatment received 4,500 kg ha−1 wheat straw (dry weight) from the beginning of the experiment to 1998 and received about 4,392 kg ha−1 (in a range of 2,630 to 5,990 kg ha−1) of maize stalks produced from the plot since 1999. All the straw/stalk were manually chopped into a small section of about 3 cm long, and returned to the field all in when wheat was sown in autumn. The average N, P and K content of each year with straw was: 35.4, 3.4, 81.0 kg ha−1. Dairy manure was added once a year before wheat sowing, the same as straw, and the M1NPK plot was given the same rates of P, K and reduced N (30% of the total rate) from inorganic fertilizers as that of NPK plot, with the remaining 70% of N from organic manure. The M2NPK treatment involved 1.5-fold greater applications of inorganic N, P, K and dairy manure as M1NPK in the winter wheat season. In the summer maize season, the M1NPK and M2NPK plots received the same rates of N, P and K from inorganic fertilizers as in the NPK treatment without organic manure addition. The C and N contents of the manure were about 26.45% ± 7.82 (SD) and 1.32% ± 0.91 (SD), respectively. The annual mean dry weight of organic manure applied was 13.7 ± 7.2 t/ha and 20.6 t ± 10.8 t/ha (SD) in the M1NPK and M2NPK treatments, respectively, over the experimental years. Details of the precise quantities of each fertilizer used in each treatment were provided in Table 1. The crop straw/stalk and dairy manure needed for a cropping year were incorporated into the plough layer soil before wheat planting. All synthetic fertilizers applied for wheat and maize were incorporated into the soil to plowing depth of ca. 20 cm before winter wheat was sown and about 1 month after maize was planted, respectively. The N-containing inorganic fertilizer used in the experiment was urea (CO (NH2)2), P was added as single super-phosphate (Ca (H2PO4)2), and K as potassium sulfate (K2SO4). Winter wheat (Xiao Yan 22) was sown with a density of 135 kg ha−1 seeds per hectare on October and harvested in the following June, and summer maize (Zheng Dan 958) was planted with a density of 67500 plants per hectare and harvested at the end of September or in the early October. The plots were irrigated with ground water 1 to 2 times during the winter wheat season and 2 to 4 times during the summer maize annually, when necessary, with approximately 90 mm of water on each occasion. All above-ground crop residues were removed after harvest. The fields were conventionally tilled with a rototiller.
Soil sampling and analysis
The soil samples were taken in June 2010 for wheat after 20 years of experiment. Each treatment plot was divided into three subplots of equal size, and 10 soil cores at 0–20 cm depth were collected with an auger of 2.5 cm in inner diameter from each area and mixed to form a composite sample. Each subplot was repeated three times. Sample removals of plant residues and stones were air-dried and passed through 1.0 mm and 0.15 mm sieve, respectively, for phosphorus fractionation with the methods modified by Jiang & Gu (1989) and Tiessen & Moir (1993), as illustrated in Fig. 1. The inorganic phosphorus was sequentially separated into five fractions in the Jiang-Gu fractionation method: dicalcium phosphorus (Ca2-P) extracted with 0.25 M NaHCO3, octa-calcium bounded phosphorus (Ca8-P) extracted with 0.5 M NH4Ac, aluminum bounded phosphorus (Al-P) extracted with 0.5 M NH4F, iron bonded phosphorus (Fe-P) extracted with 0.1 M NaOH and 0.05 M Na2CO3, Occluded phosphorus extracted with 0.3 M Na3C6H5O7, 1 g Na2S2O4 and 0.5 M NaOH, and apatite phosphorus (Ca10-P) extracted with 0.25 M H2SO4. Soil phosphorus was sequentially separated into nine fractions in the Tiessen-Moir fractionation method: Resin-P, NaHCO3-Pi, NaHCO3, NaHCO3-Po, NaOH-Pi, NaOH-Po, D. HCl-P, C. HCl-Pi (concentrated hydrochloric acid extracted, C refers to concentrated), C. HCl-Po and Residual-P.

Figure 1: Scheme of sequential extraction methods for P fractionation modified by Jiang & Gu (1989) and Tiessen & Moir (1993).
The S1 to S6 refer to the extraction sequence. Ca-P, calcium bounded phosphorus; Al-P, aluminum bounded phosphorus; Fe-P, iron bounded P; O-P, Occluded P; D.HCl-P, dilute hydrochloric acid extracted P, D refers to dilute; C. HCl-Pi and C. HCl-Po, concentrated hydrochloric acid extracted inorganic P (Pi) and organic P (Po), C abbreviation for concentrated.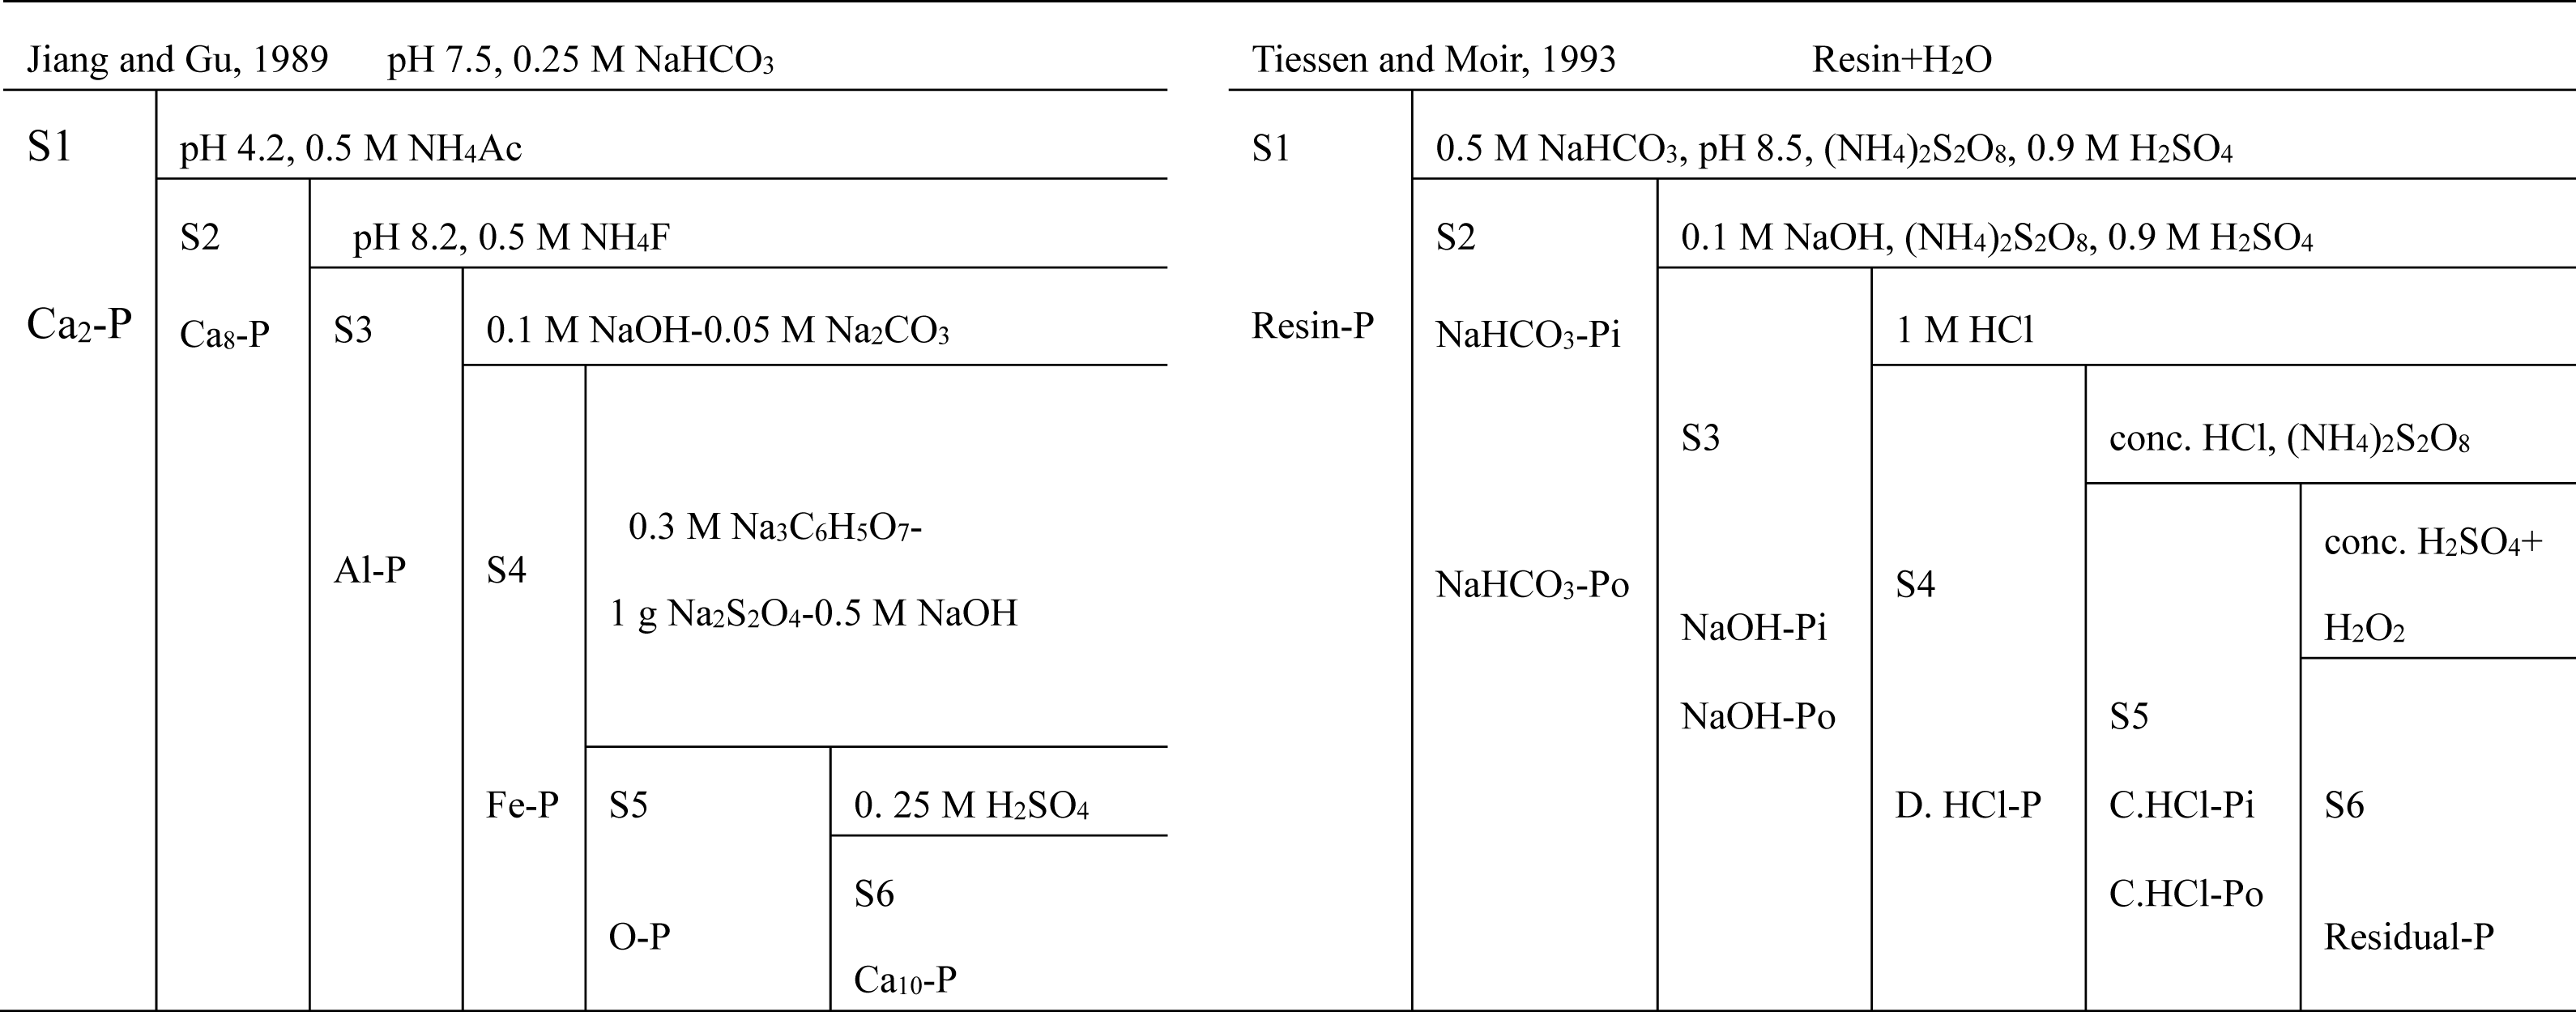
The phosphorus in the extractant or digestion was determined with molybdenum blue colorimetric method (Murphy & Riley, 1962), each sample was repeated 3 times, and the measured results were averaged.
The soil organic phosphorus was analyzed with ignition method (Kuo, 1996), which converted organic phosphorus to inorganic P by high temperature (at 550 °C), the Po was then determined by the difference between the amounts of 0.5 M H2SO4 extractable Pi for the ignited and unignited soils.
Phosphorus uptake of wheat, the sum of phosphorus concentration in grain and straw, was determined with molybdenum blue colorimetric method after digestion with concentrated sulfuric acid and hydrogen peroxide (Murphy & Riley, 1962). The total organic P of Jiang-Gu method was calculated by the difference between the total P concentration and the total inorganic P extracted with the method. Total P was measured with molybdenum blue colorimetric method after digestion with concentrated sulfuric acid, hydrogen peroxide and hydrogen fluoride (Kuo, 1996).
Statistical analysis
P uptake of wheat, Olsen-P and P fractions were calculated following the method of Murphy & Riley (1962). (1)
where is total phosphorus content in soil, ρ is determination of phosphorus, V is liquid volume, m is quality of dried sample, ts is split multiple.
Phosphorus fractions were compared in scatter plots of Jiang-Gu method vs Tiessen-Moir method, and linear regressions were fitted to quantify departures from y = x representing no difference between treatments; reduced major axis method was used to account for error in both x and y (Ludbrook, 2012). Pearson correlation analysis was also used to analyze the relationships between P uptake in above-ground biomass of winter wheat and the contents of P fractions. Path coefficient analysis was used to calculate the direct and indirect contribution of various P fractions to wheat P uptake and soil Olsen-P content. Before the calculation of path coefficient, we used the Shapiro–Wilk test in the SPSS software to test the normal distribution. The test results showed that the p-values were greater than 0.05, the dependent variable obeyed normal distribution, and regression analysis could be carried out. Then, we calculated the path coefficient by the linear regression program of SPSS. All statistical analysis was performed through SPSS 18.0 software.
Results
Comparison of phosphorus fractions measured by Jiang-Gu and Tiessen-Moir methods
Linear regressions were plotted to compare the Jiang-Gu versus Tiessen-Moir fractionation methods for categories of labile-P, Fe and Al bounded P, Ca-bounded P and total Pi (Fig. 2). Results showed that the labile P measured with Jiang-Gu method is significantly lower than that with Tiessen-Moir method (Fig. 2A). The slope of the linear regression of Fe & Al-P contents obtained from two fractionation methods was close to 1 (that of identity line), but significant difference in intercepts indicated that these kinds of P were greater in Jiang-Gu fractionation by a maximum of 46 mg kg−1 over Tiessen-Moir fractionation (Fig. 2B). Jiang-Gu fractionation gave similar Ca bounded-P contents to that Tiessen-Moir did at low P levels, but the slope >1 indicated that this method estimated greater Ca bounded P fractions where soil contained a high P level (Fig. 2C). Interestingly, these two fractionations extracted much similar total inorganic P (Fig. 2D) and total P as well (Fig. 3A), to be specific, summation of inorganic P extracted in Jiang-Gu fractionation was similar to the summation of both inorganic and organic P in Tiessen-Moir fractionation. However, the organic P estimated by subtract the total inorganic Pi in Jiang-Gu fractionation from the total P was much greater than total organic P in Tiessen-Moir fractionation when content of total organic P was greater than 22 mg kg−1(Fig. 3B). Compared to the organic P measured with ignition method, total organic P in Tiessen-Moir fractionation was underestimated to a considerable degree (Fig. 3C). Whereas, Po derived from Jiang-Gu fractionation was much similar to that of ignition method (Fig. 3D).
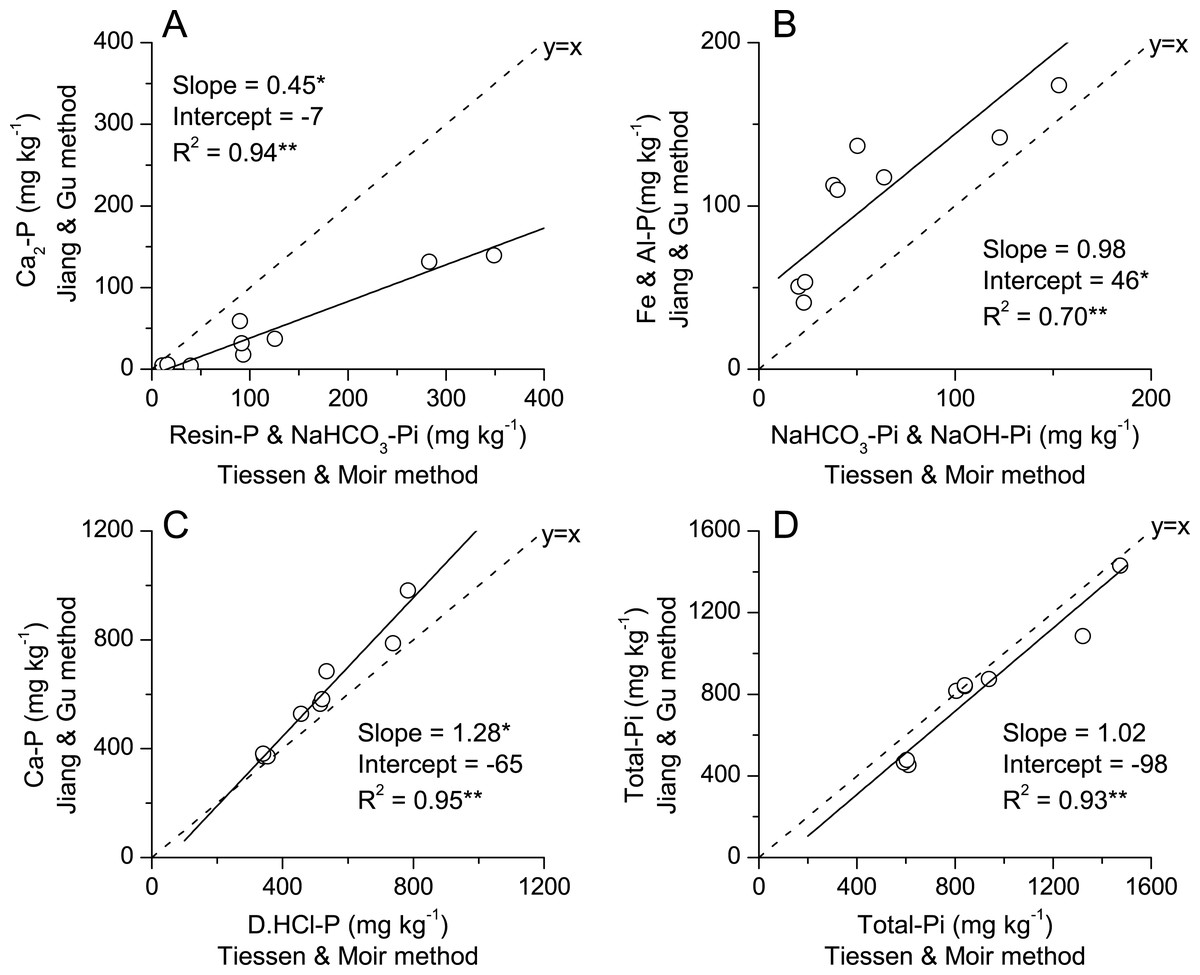
Figure 2: Comparison of labile P fractions (A), Fe & Al related phosphorus (B), Ca related phosphorus (C), Total-Pi (D) of same categories extracted by methods of P fractionation modified by Jiang & Gu (1989) and Tiessen & Moir (1993) in soils subjected to diverse fertilization regimes for 20 years on a Loess soil.
Black solid line and equation are Model II regression accounting for error in both x and y. Significance of regressions is indicated as *, ** for P < 0.05 and P < 0.01, respectively. Asterisks next to parameters indicate intercept is different from zero and slope different from 1 based on 95% confidence intervals. Dashed line is the identity line (1:1) pass through the origin point.
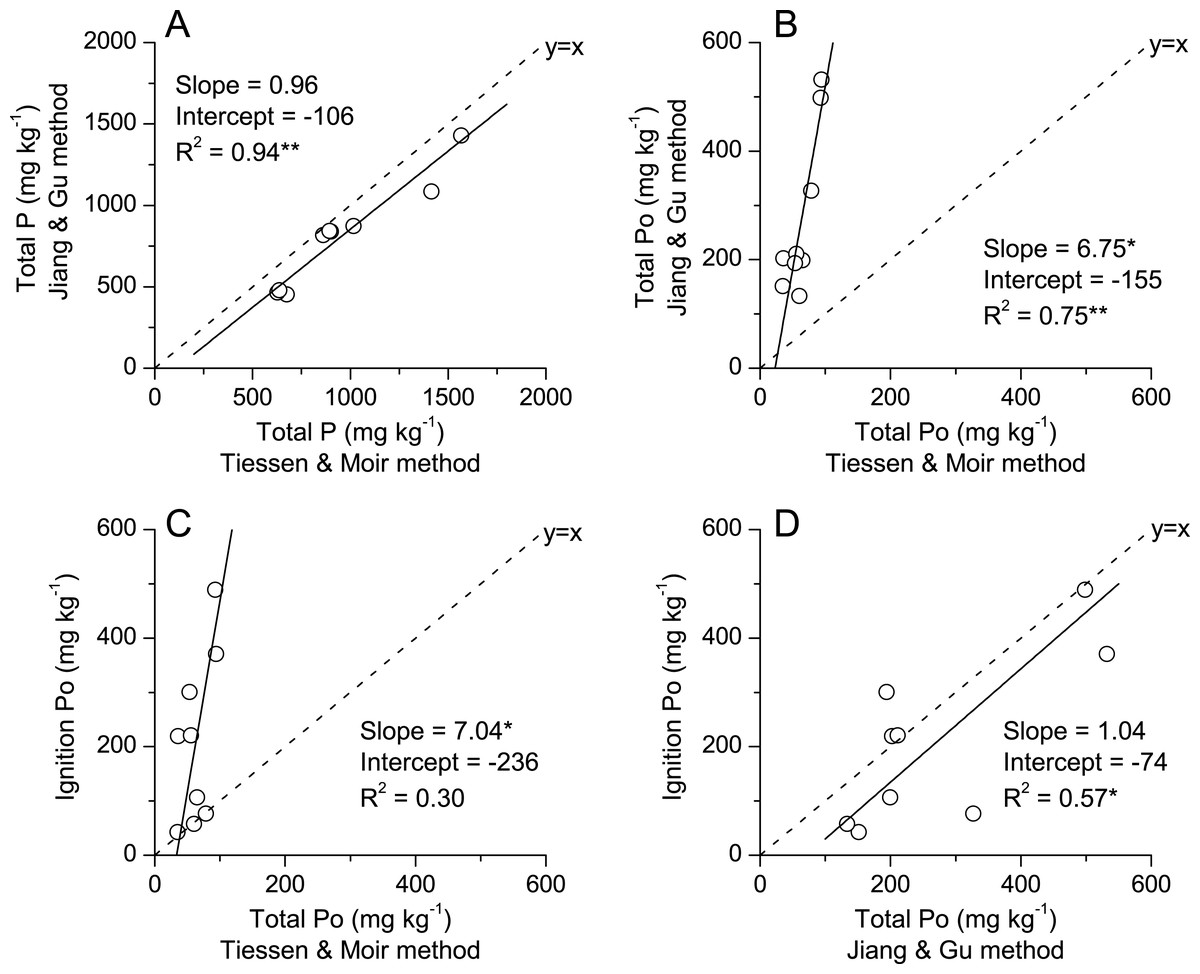
Figure 3: Comparison of total P (A) and total organic P (B) obtained by Jiang and Gu method and Tiessen and Moir method, and organic P measured with ignition method vs. total organic P by Tiessen and Moir method (C) and Jiang and Gu method (D) in soils subjected to diverse fertilization regimes for 20 years on a Loess soil.
Black solid line and equation are Model II regression accounting for error in both x and y. Significance of regressions is indicated as *, ** for P < 0.05 and P < 0.01, respectively. Asterisks next to parameters indicate intercept is different from zero and slope different from 1 based on 95% confidence intervals. Dashed line is the identity line (1:1) pass through the origin point. Po for the Jiang-Gu method is estimated by the difference of soil total P and the summation of the inorganic P fractions determined with the Jiang and Gu fractionation method.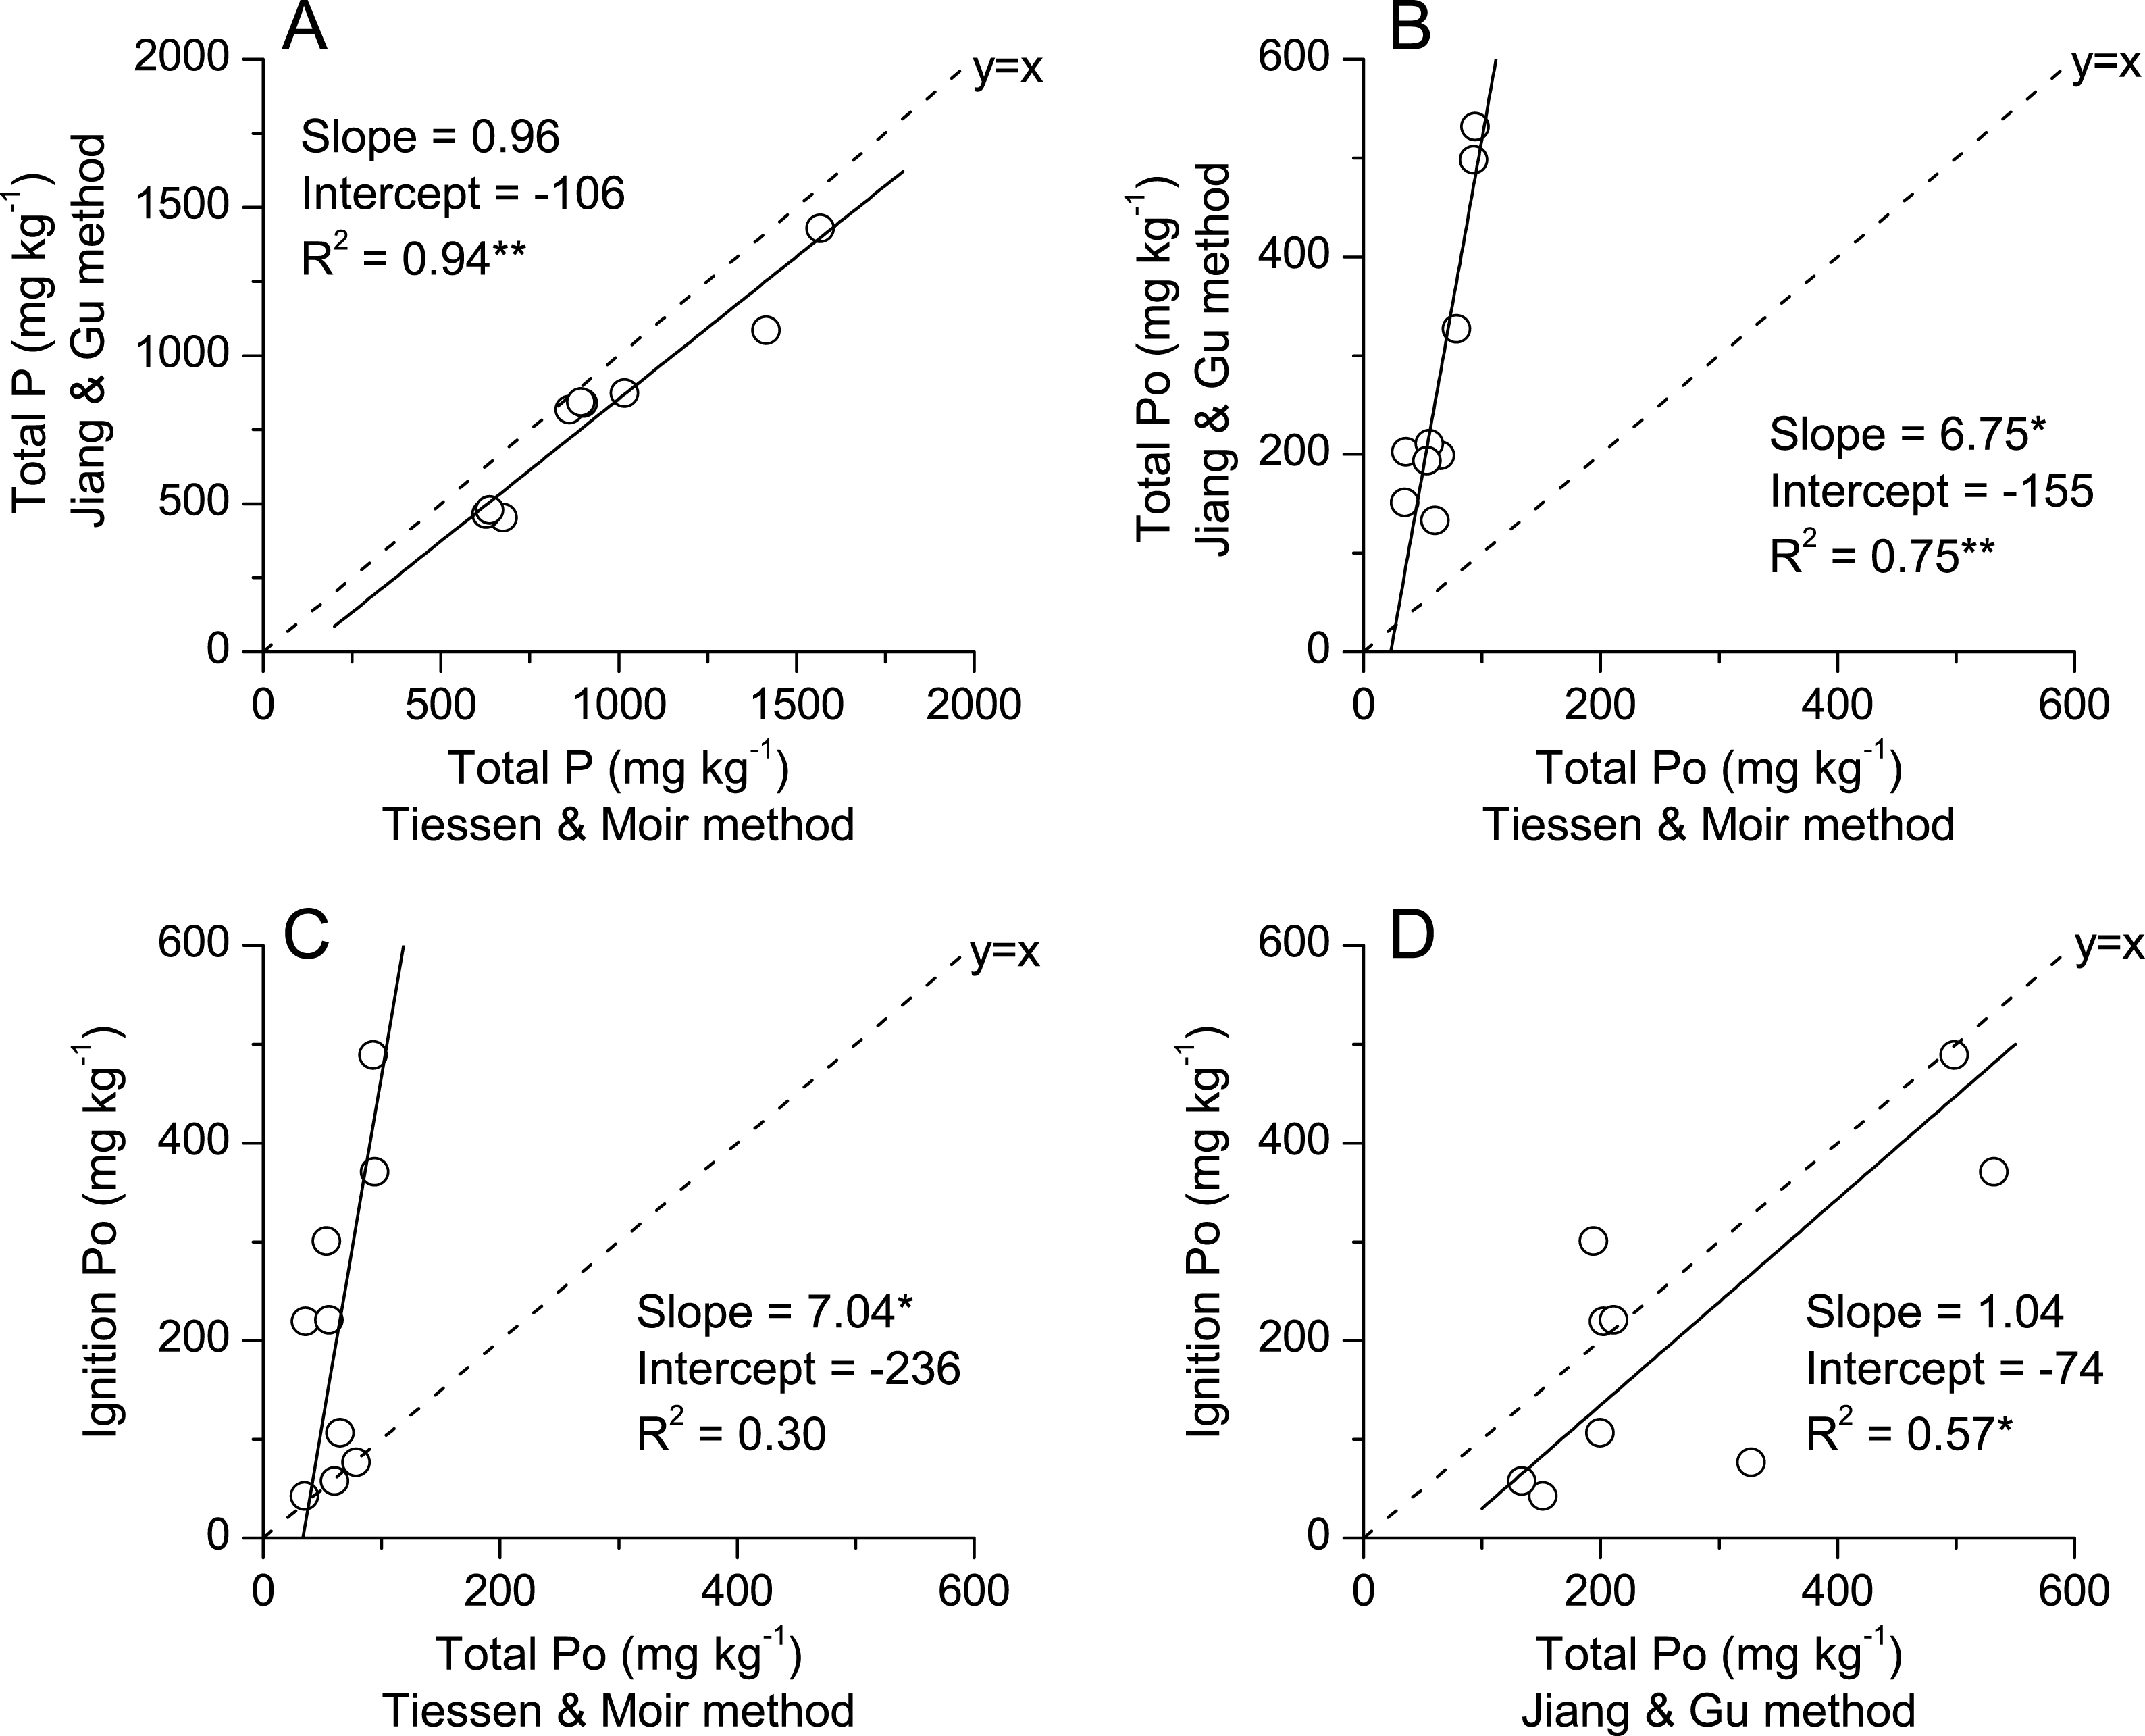
Relationship between phosphorus uptake by winter wheat and phosphorus fractions in plough layer soils
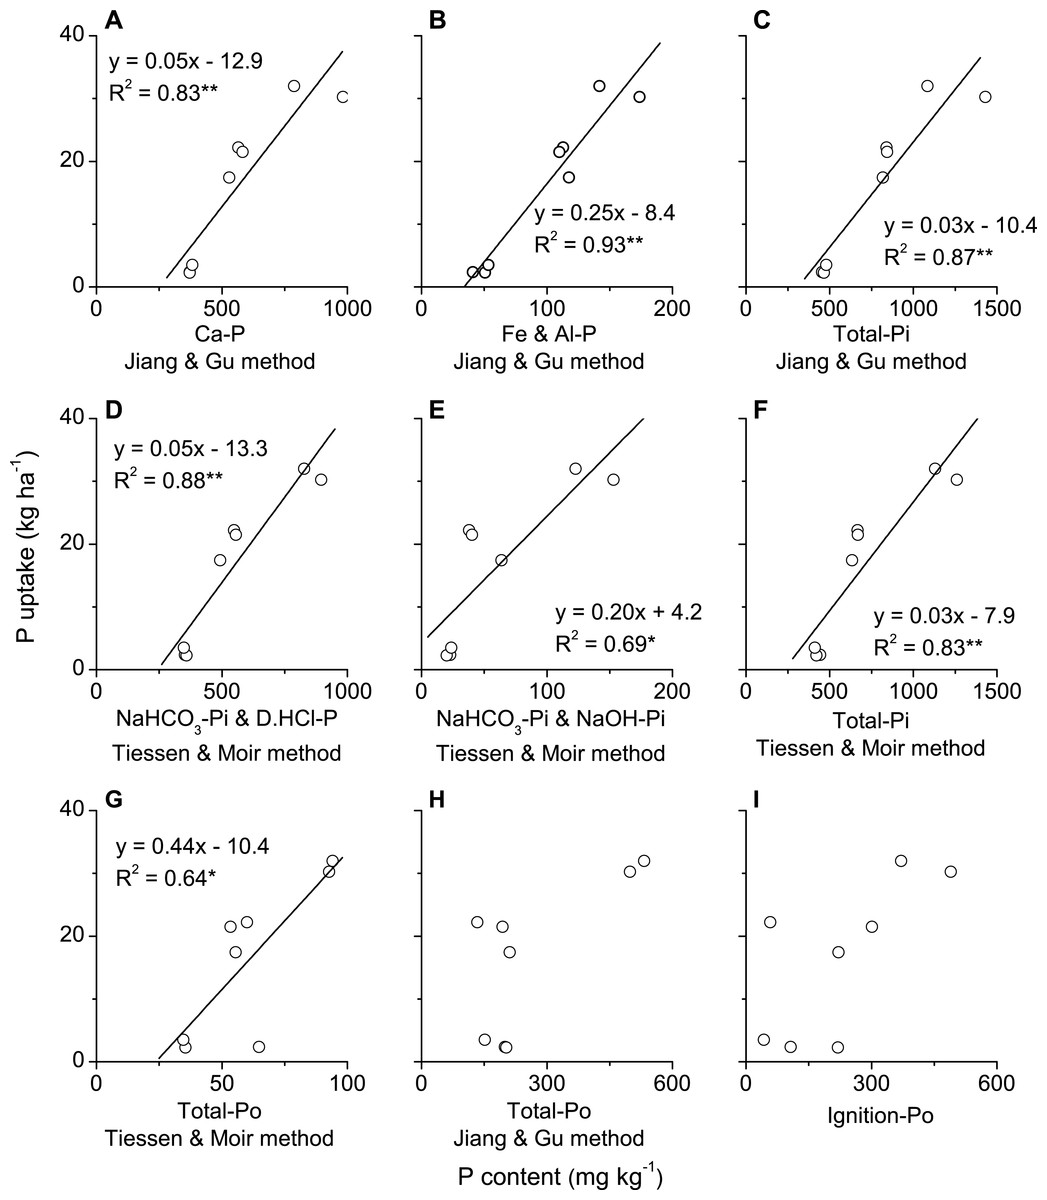
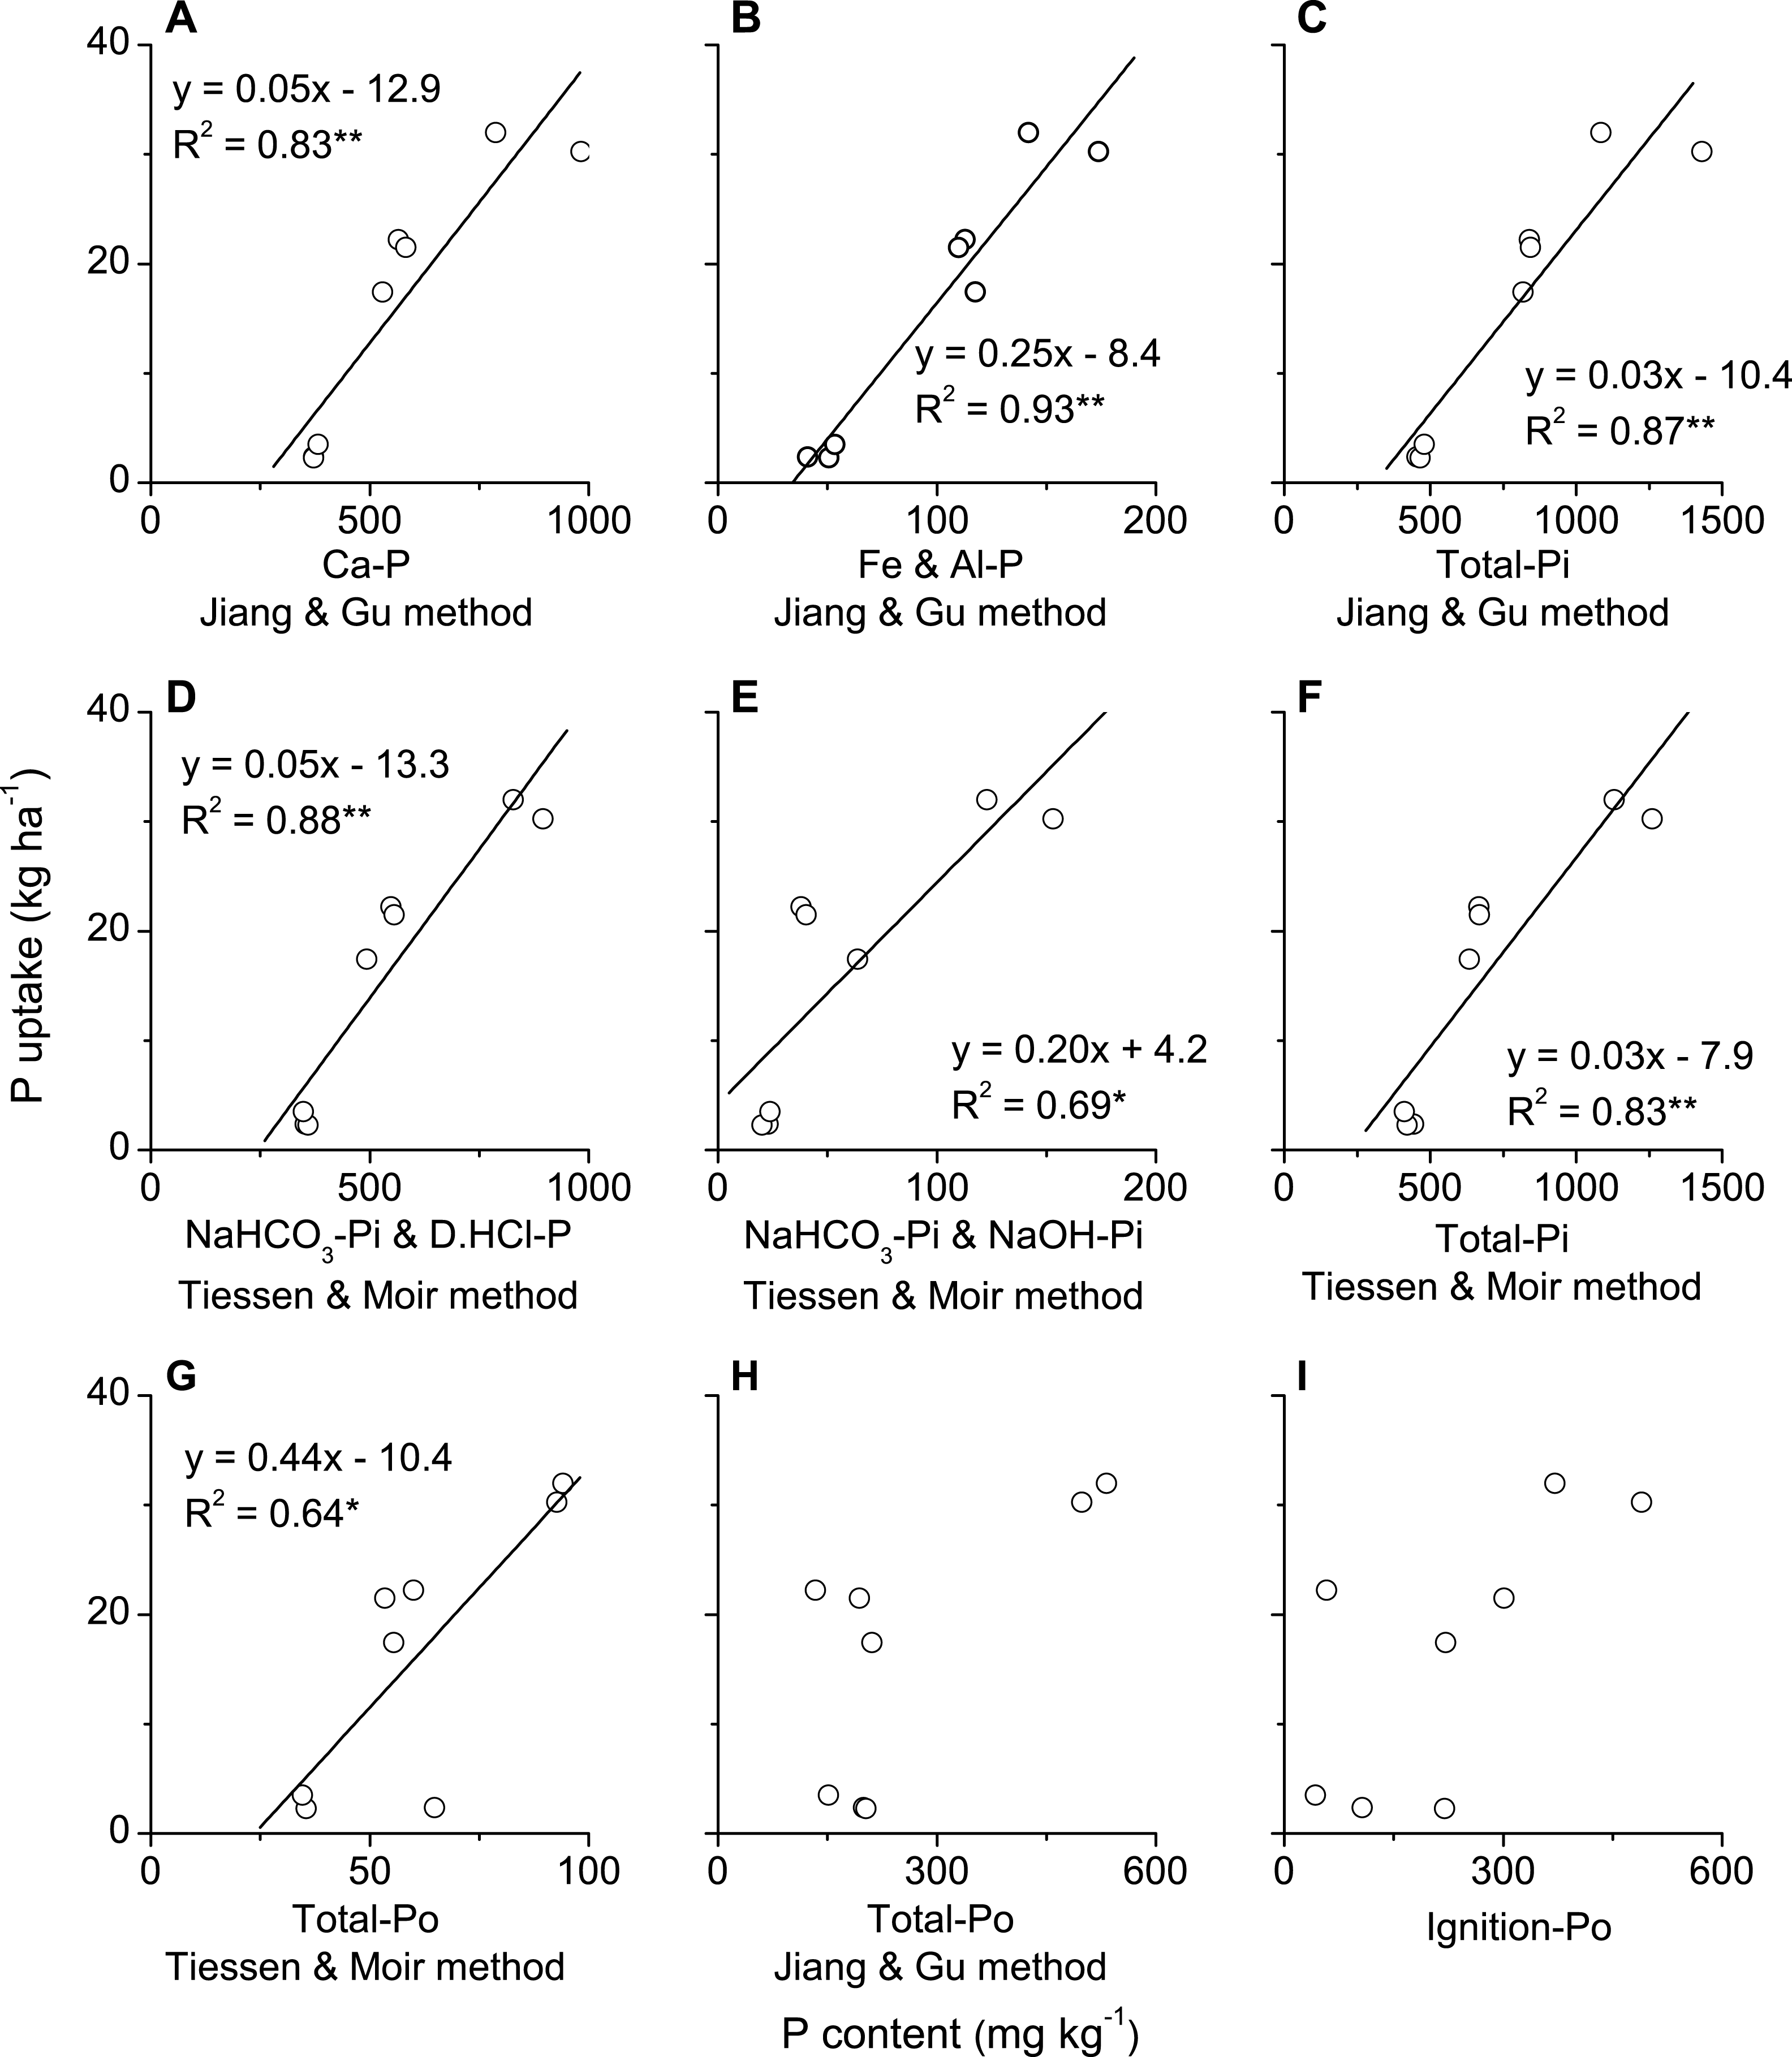
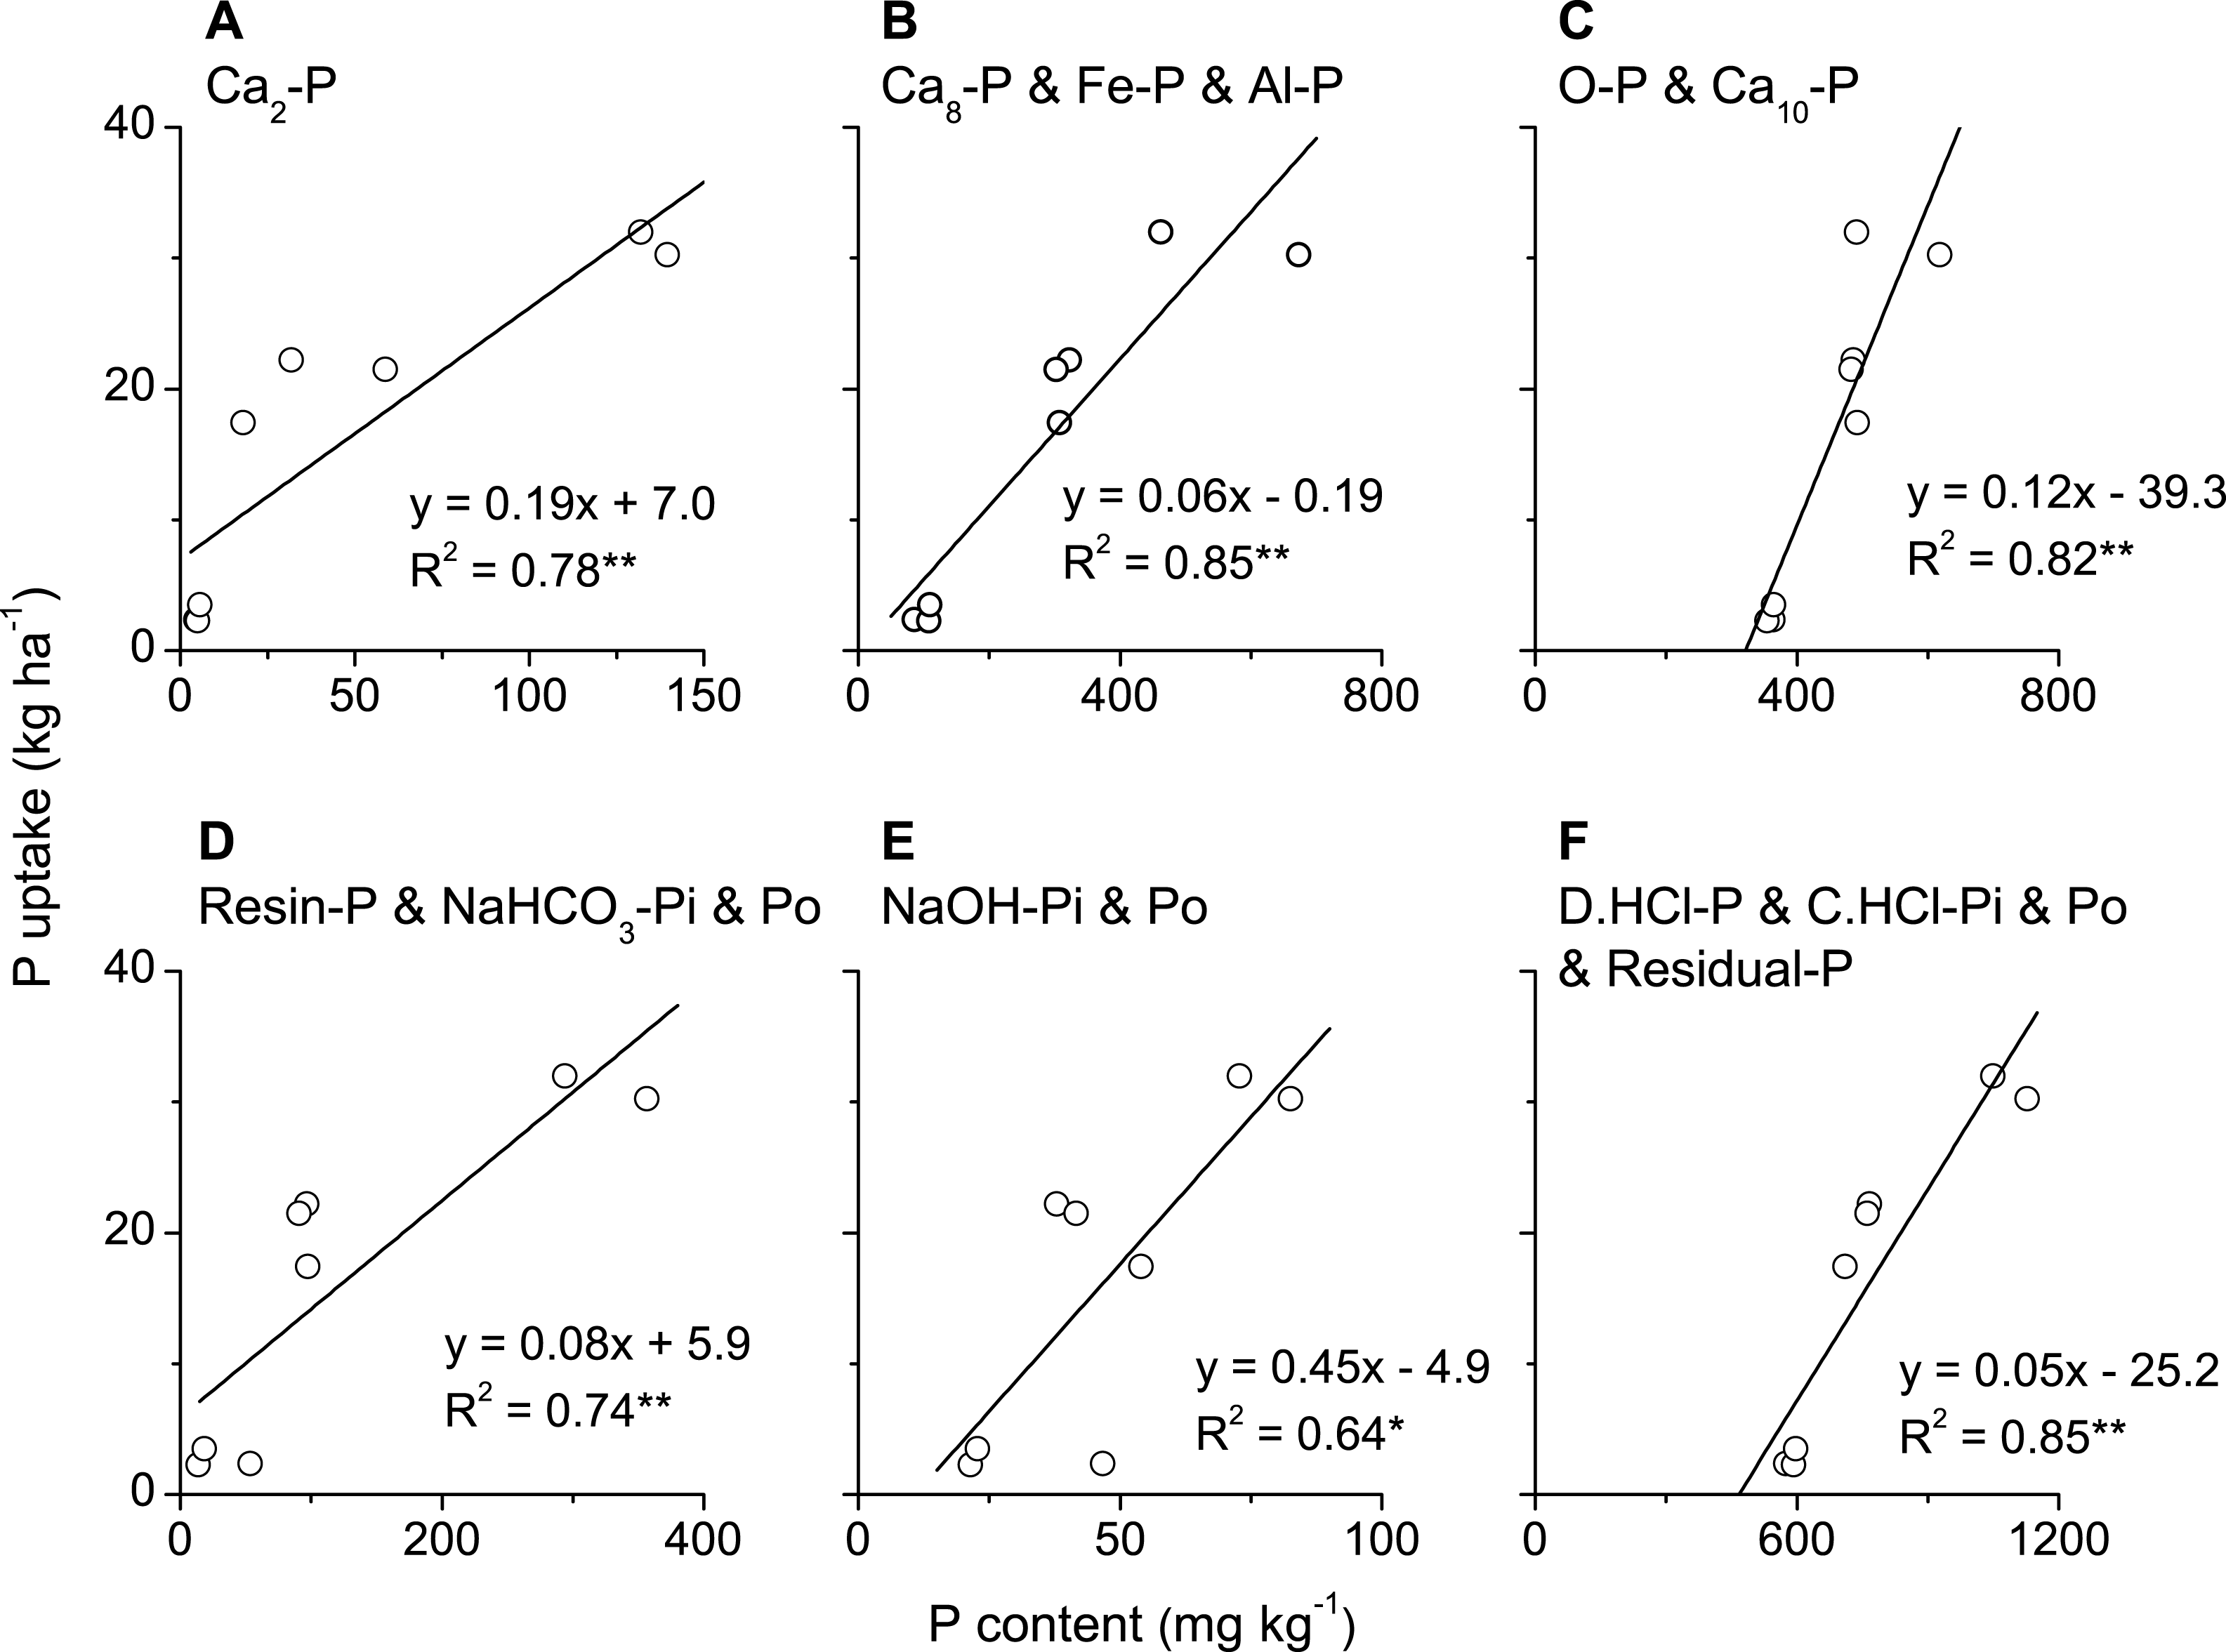
Phosphorus uptake in above-ground biomass of winter wheat was significantly and positively correlated with all phosphorus fractions, i.e., Ca2-P, Ca8-P, Al-P, Fe-P, O-P (occluded P) and Ca10-P, in plough layer soils measured with Jiang-Gu fractionation method (Figs. 4A–4F). By contrast, P uptake by winter wheat was only significantly and positively correlated with some of the phosphorus fractions, such as Resin-P, NaHCO3-Pi, NaOH-Po, D. HCl-P and C. HCl-Pi but not for NaHCO3-Po, NaOH-Pi, C. HCl-Po and Residual-P measured with Tiessen-Moir method (Figs. 5A–5I). Moreover, P uptake by winter wheat was markedly and positively correlated with P fraction cartographies of Ca-P, Fe & Al-P and total-Pi in Jiang-Gu fractionation (Figs. 6A–6C) and with the corresponding counterparts in Tiessen-Moir fractionations (Figs. 6D–6F), and total-Po in Tiessen-Moir fractionation (Fig. 6G). Winter wheat P uptake was not related to total-Po derived from Jiang-Gu fractionation and that measured with ignition method (Figs. 6H and 6I). In addition, winter wheat P uptake was also obviously positively correlated with labile, moderately labile, and high resistant P fractions in both Jiang-Gu and Tiessen-Moir fractionations (Figs. 7A–7F).
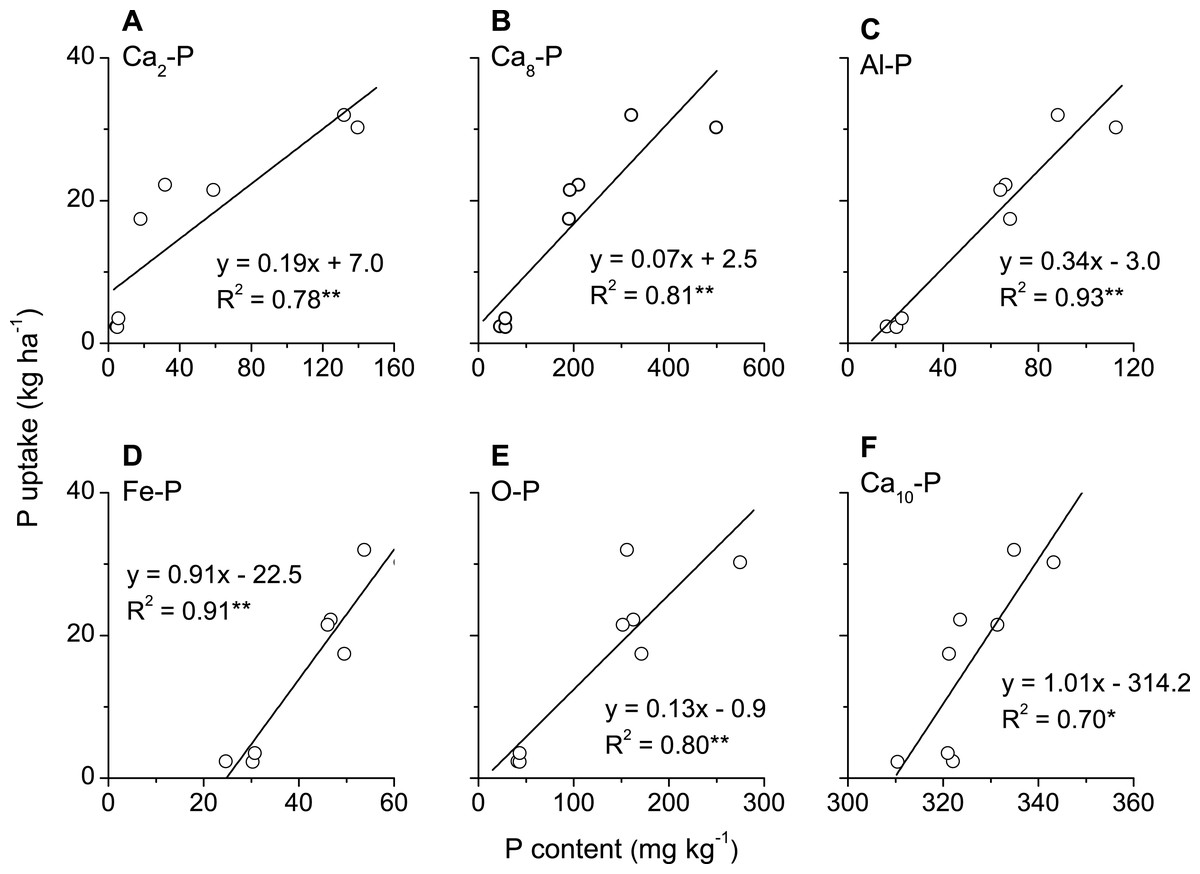
Figure 4: Correlations between P uptake in above-ground biomass of winter wheat and the content of P fractions (A–F) extracted by Jiang and Gu method in plough layer soils subjected to diverse fertilization regimes for 20 years on a Loess soil.
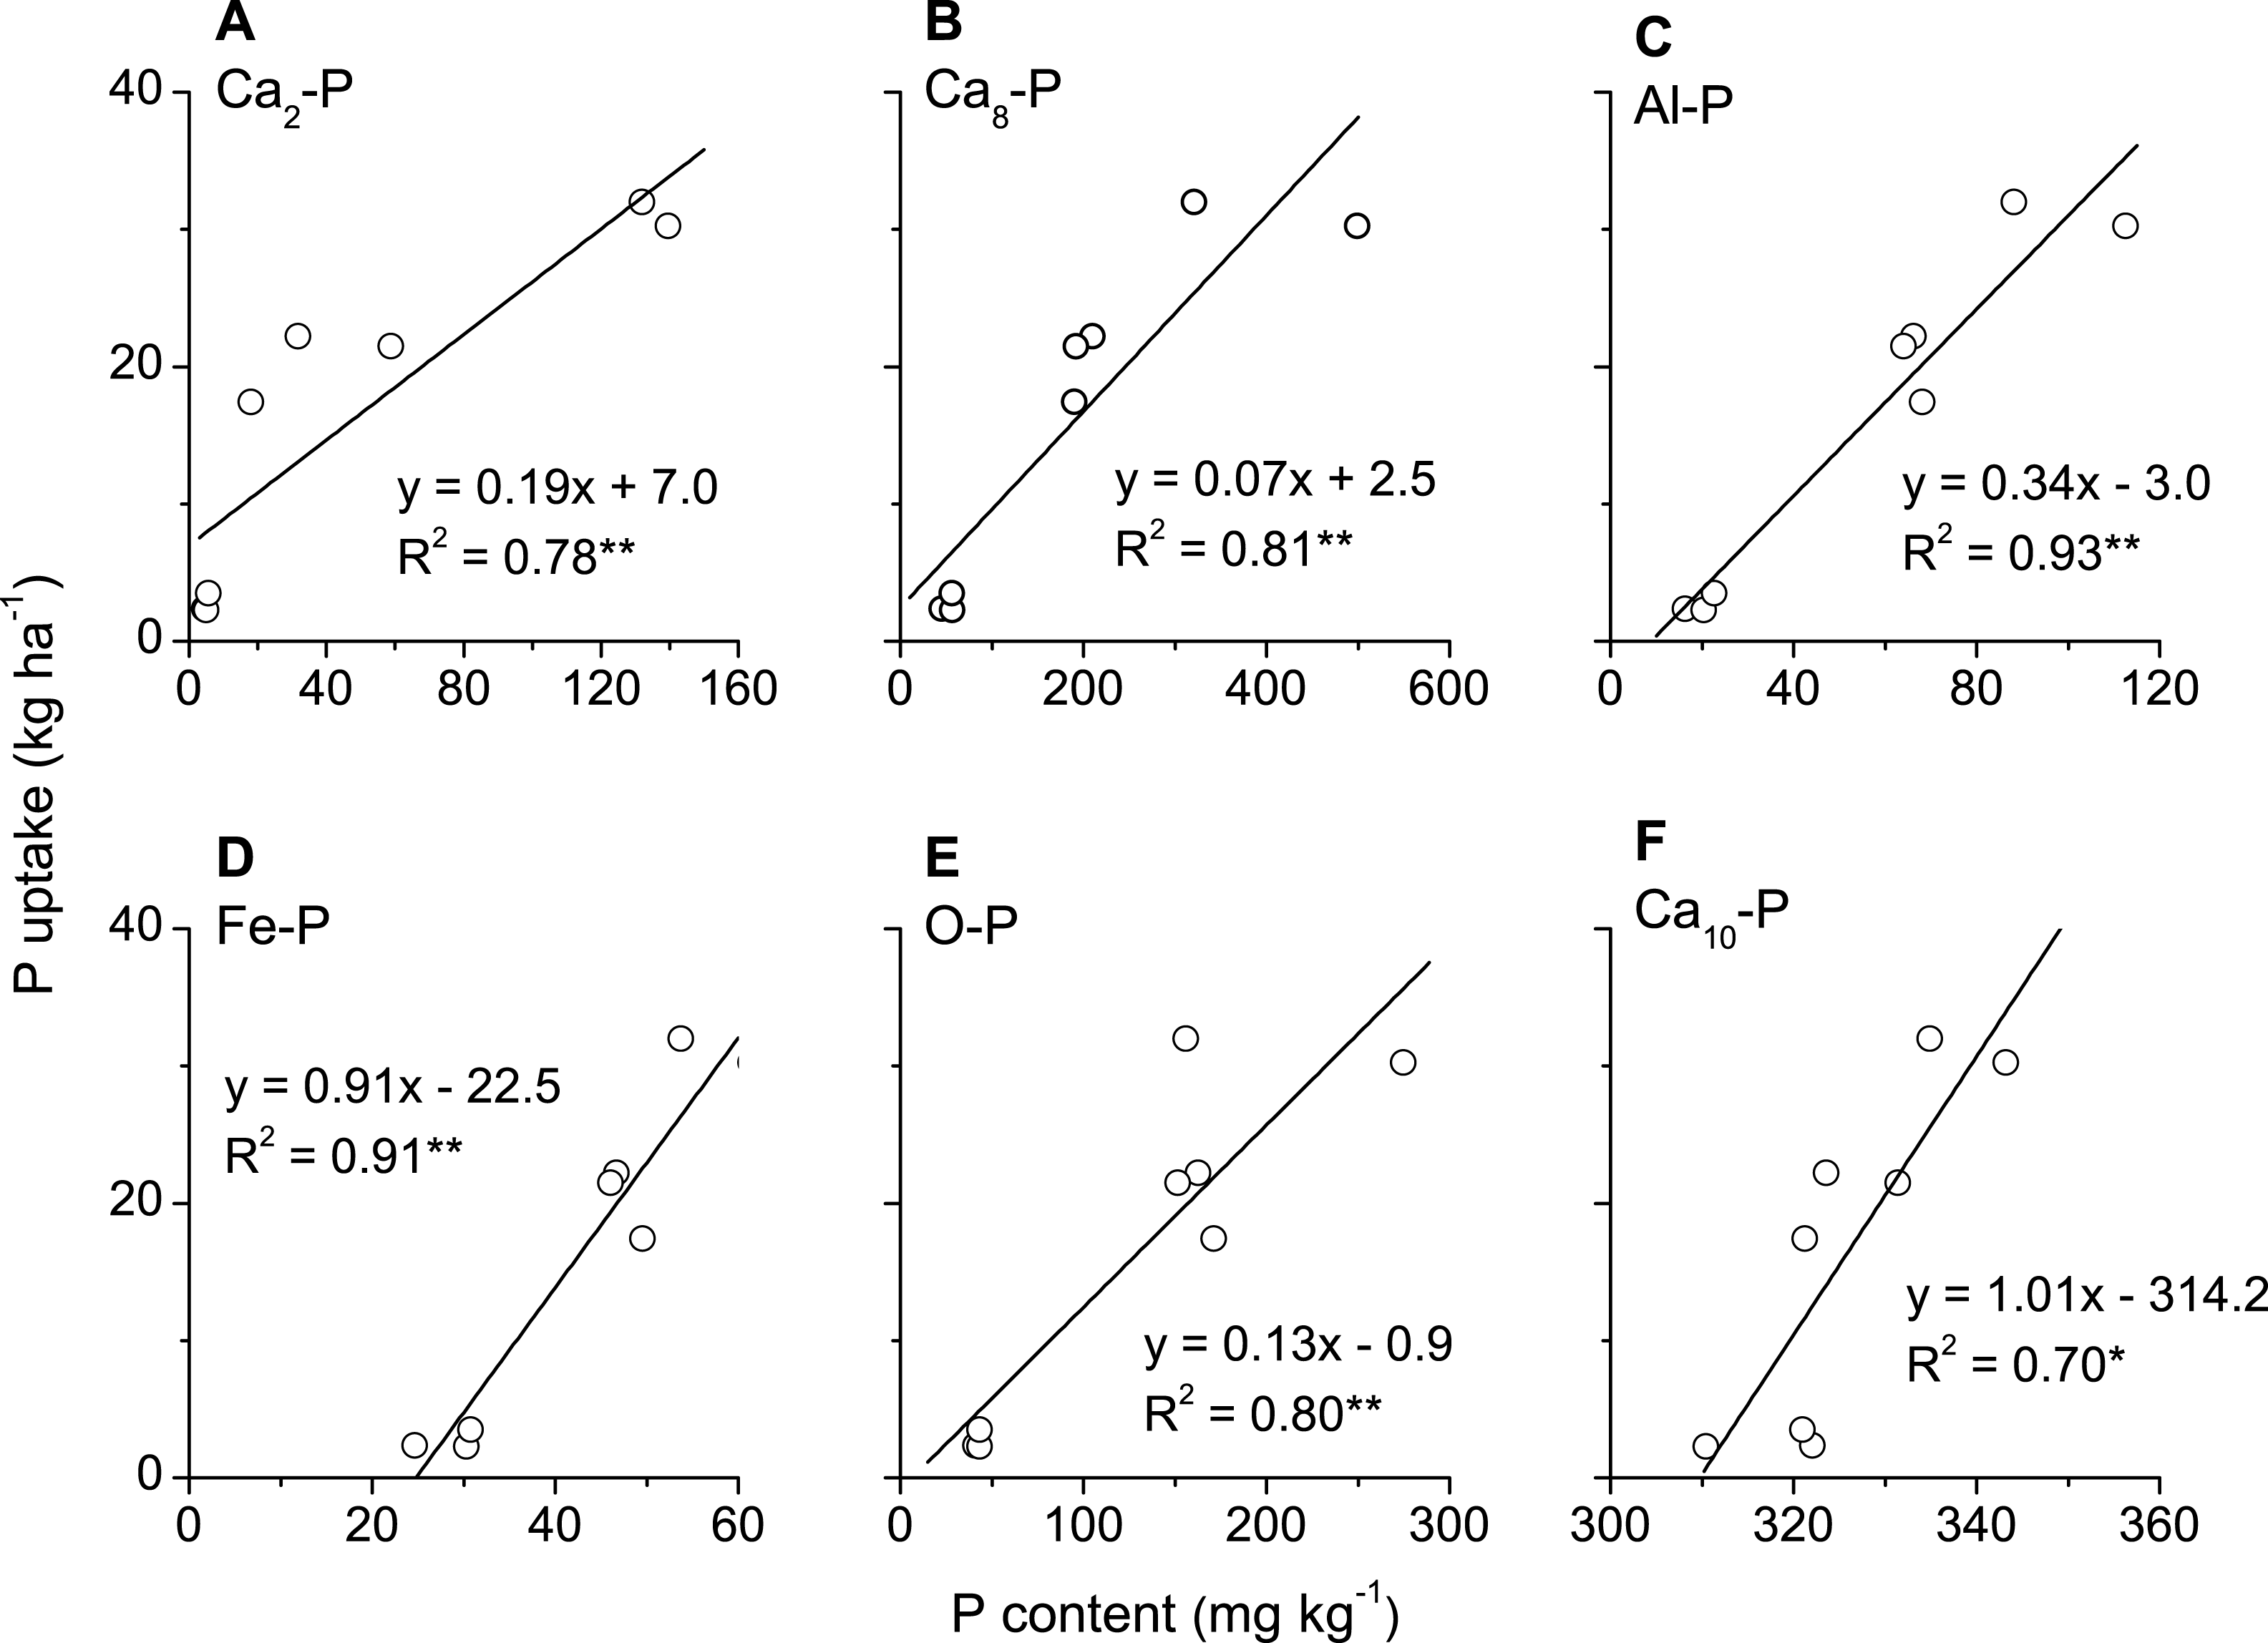
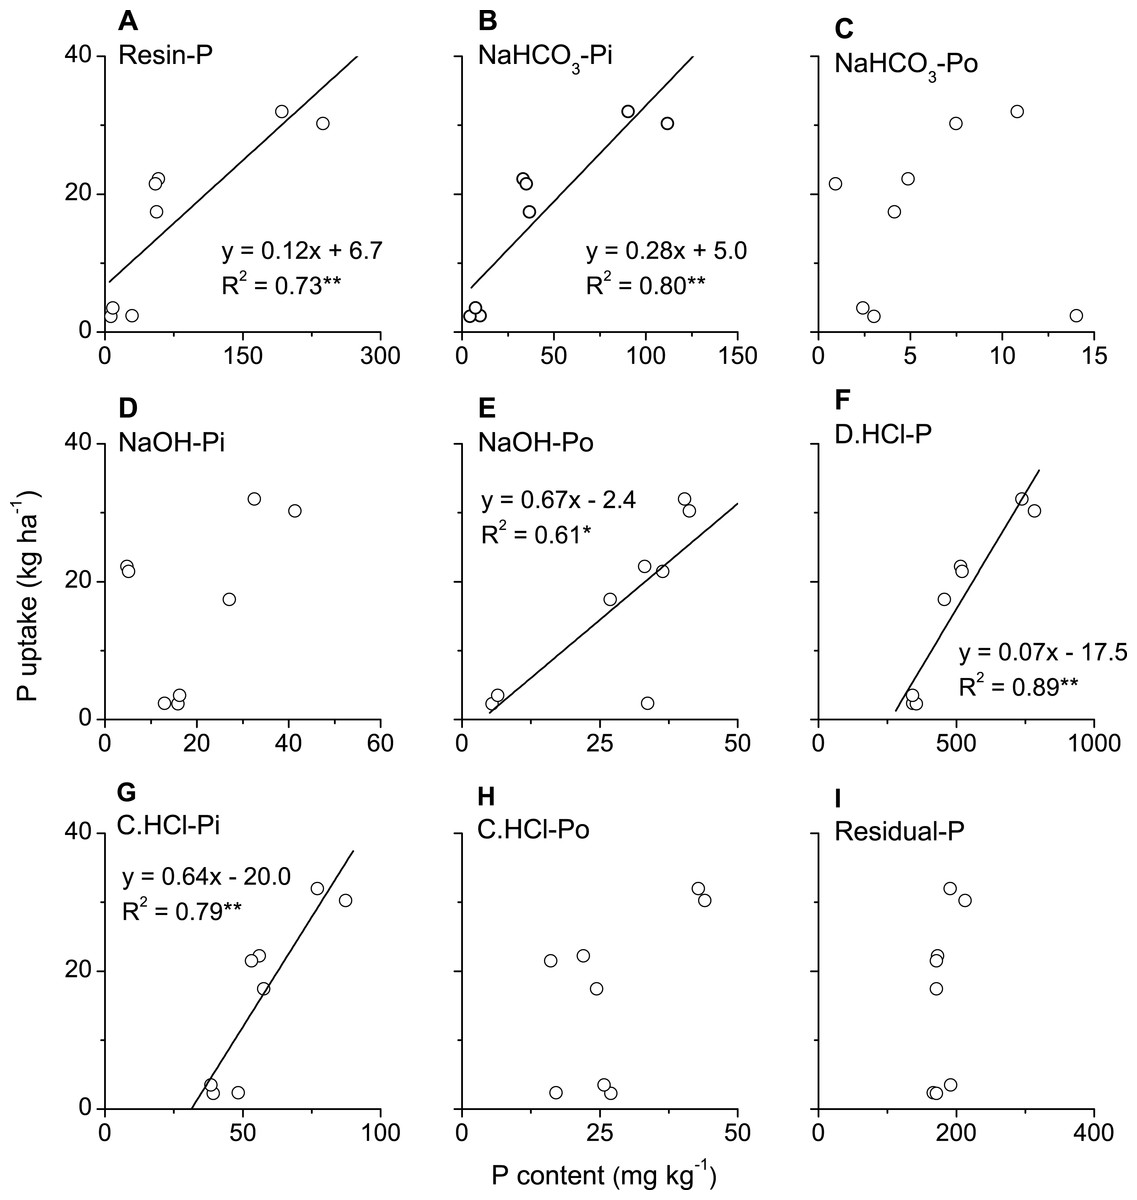
Figure 5: Correlations between P uptake in above-ground biomass of winter wheat and the content of P fractions (A–I) extracted by Tiessen and Moir method in plough layer soils subjected to diverse fertilization regimes for 20 years on a Loess soil.
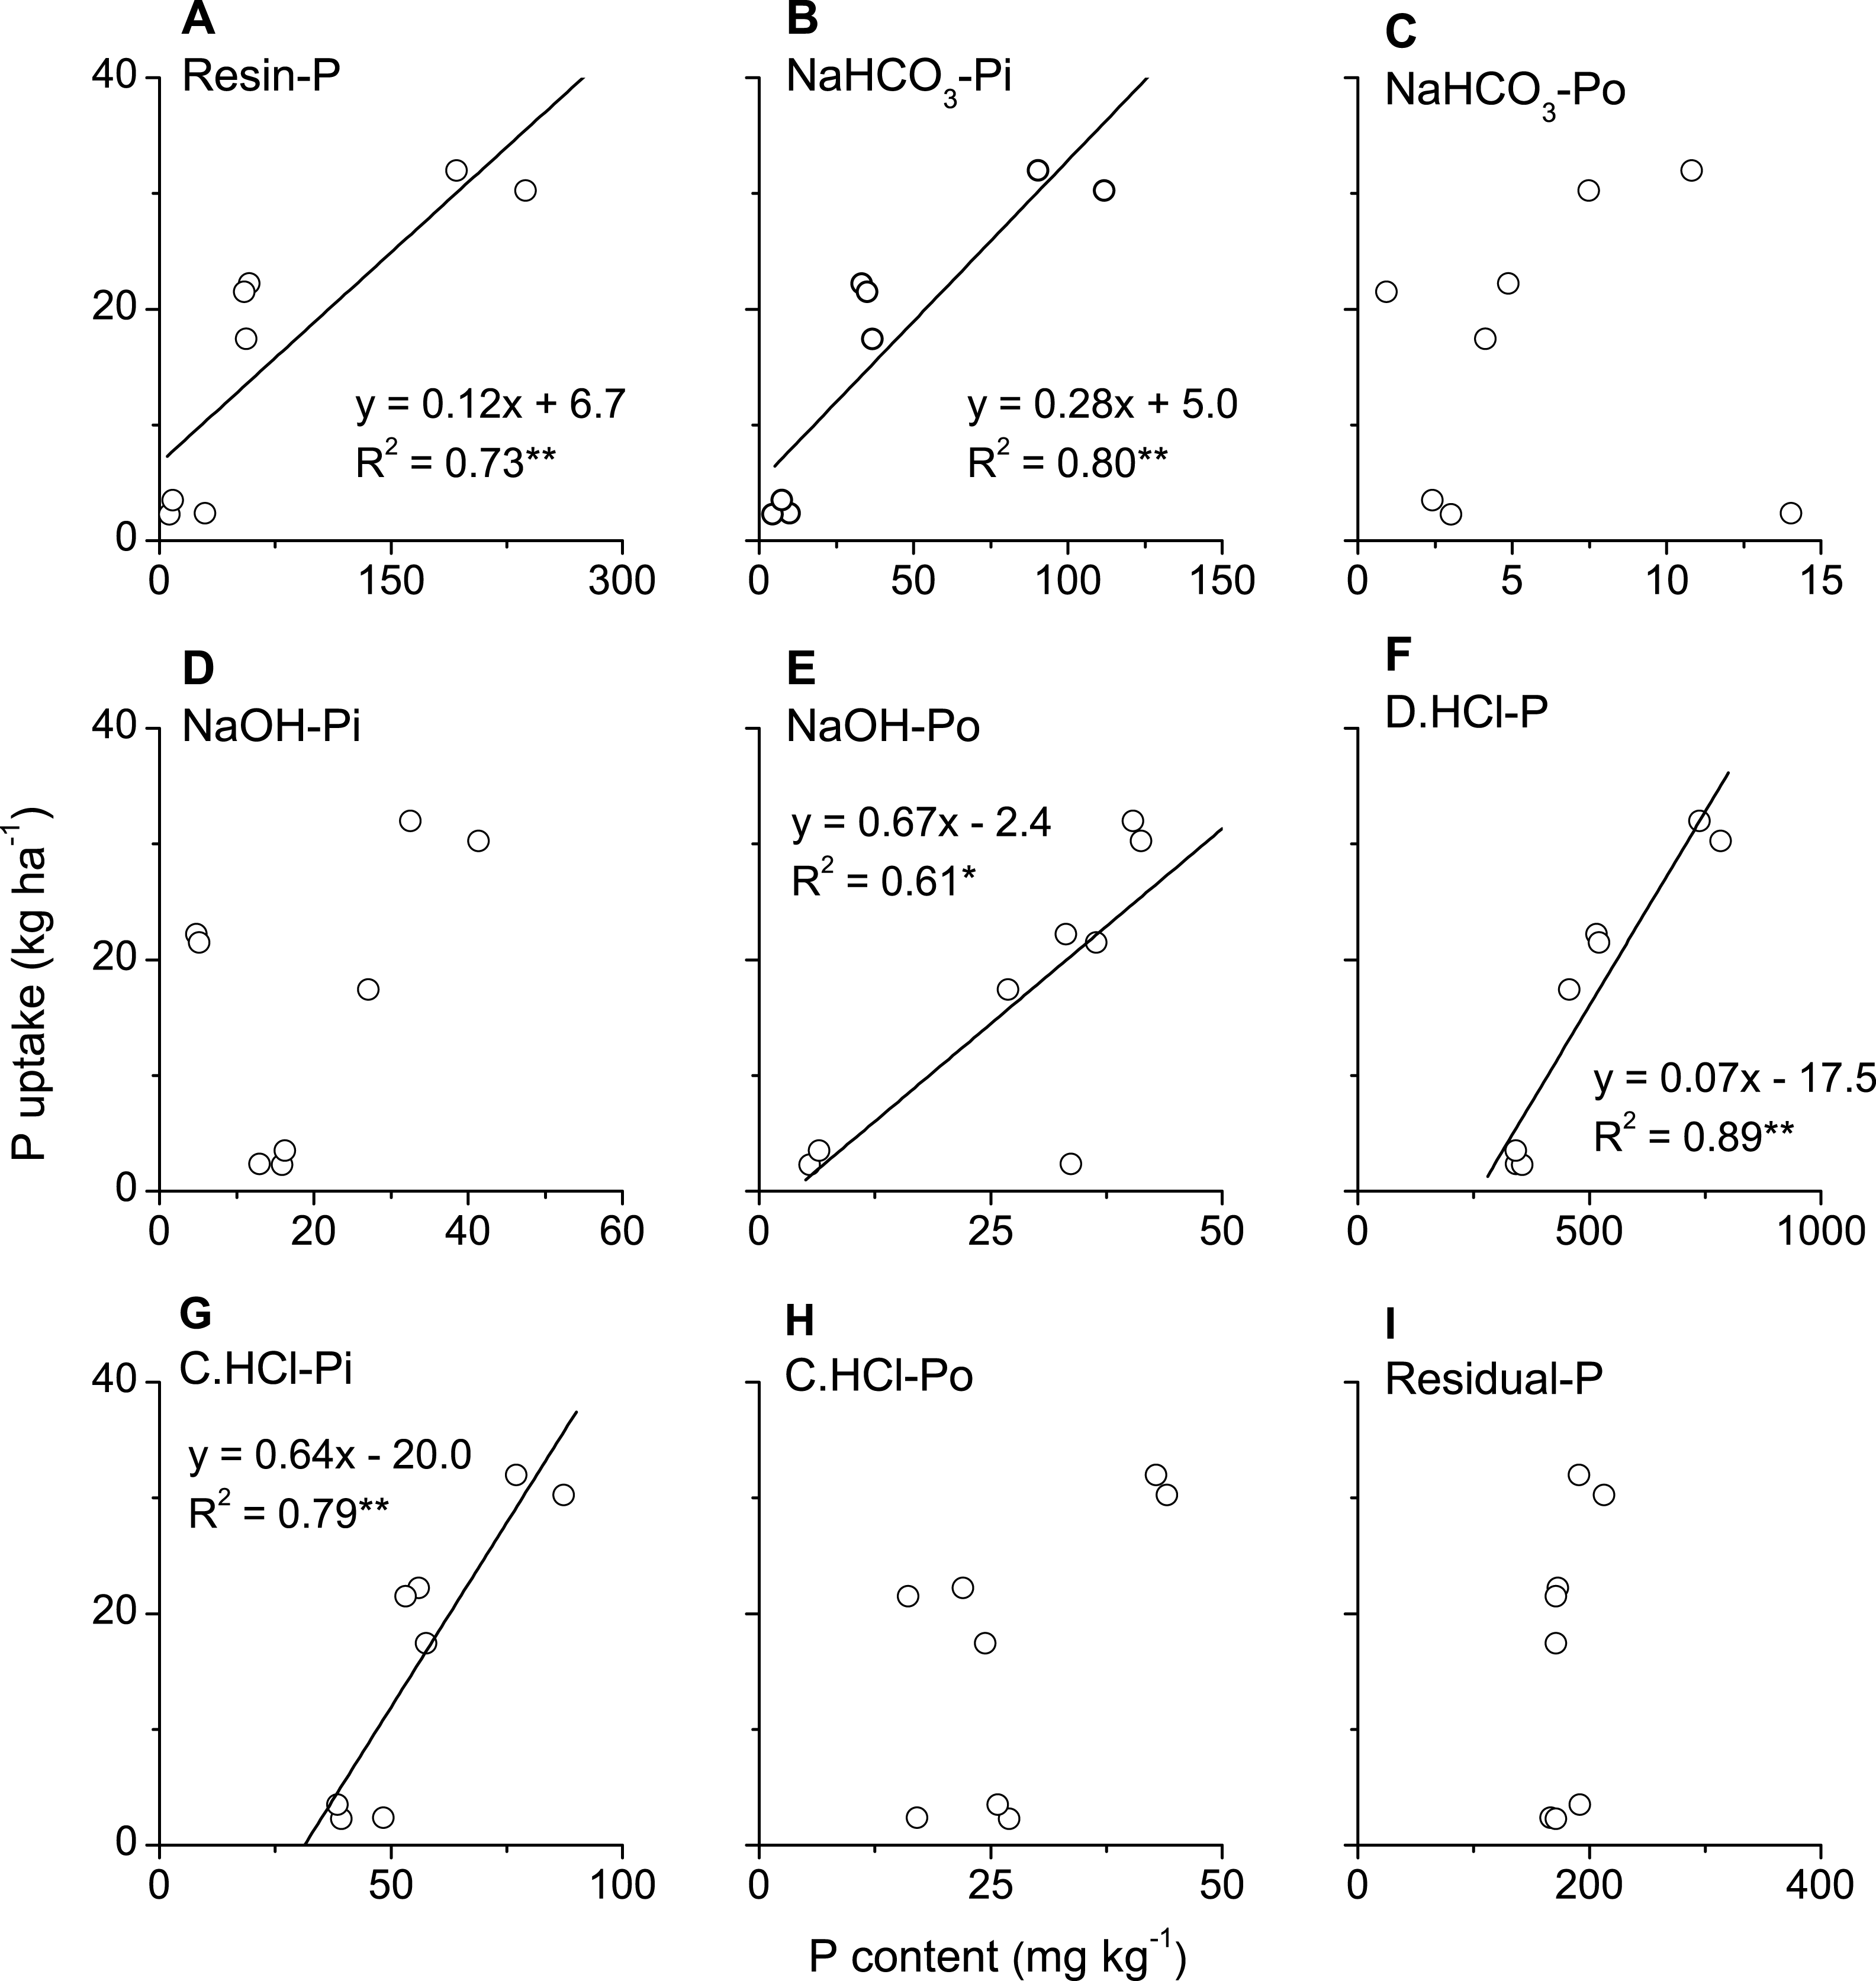

Figure 7: Correlations between P uptake in above-ground biomass of winter wheat and the content of P fractions with same bioavailability extracted by the Jiang and Gu method (A–C) and the Tiessen and Moir method (D–F).
To further understand the contribution of individual P fractions in both Jiang-Gu and Tiessen-Moir fractionations to winter wheat P uptake and soil Olsen-P, path analysis was performed to differentiate the direct and indirect effects from the total of the individual P fractions on wheat P uptake and soil Olsen-P content. As demonstrated in Table 2, path coefficients indicated that Ca2-P in Jiang-Gu fractionation had the highest and significant direct effect on winter wheat P uptake (P < 0.01) among the six individual inorganic P fractions. Moreover, the Ca8-P, Al-P, Fe-P, O-P and Ca10-P in Jiang-Gu fractionation exhibited indirect impacts on wheat P uptake through Ca2-P to the greatest extent (Table 2). The NaHCO3-Pi and D. HCl-P in Tiessen-Moir fractionation also presented significantly direct effects on winter wheat P uptake. Additionally, path coefficient also revealed that the indirect effect of other P fractions on wheat P uptake through NaHCO3-Pi was the largest except for C. HCl-Po, which exhibited an indirect effect on winter wheat P uptake through D. HCl-P with the maximum indirect coefficient (Table 3).
| Factor | Direct effect | Indirect effect | |||||
|---|---|---|---|---|---|---|---|
| x1→y | x2→y | x3→y | x4→y | x5→y | x6→y | ||
| Ca2-P (x1) | 0.921** | – | 0.132 | −0.002 | −0.064 | −0.008 | 0.042 |
| Ca8-P (x2) | 0.152 | 0.802 | – | −0.002 | −0.065 | −0.009 | 0.041 |
| Al-P (x3) | −0.002 | 0.804 | 0.140 | – | −0.062 | −0.009 | 0.045 |
| Fe-P (x4) | −0.071 | 0.824 | 0.139 | −0.002 | – | −0.009 | 0.038 |
| O-P (x5) | −0.011 | 0.695 | 0.123 | −0.002 | −0.061 | – | 0.034 |
| Ca10-P (x6) | 0.063 | 0.615 | 0.098 | −0.001 | −0.043 | −0.006 | – |
| Factor | Direct effect | Indirect effect | ||||||||
|---|---|---|---|---|---|---|---|---|---|---|
| x1→y | x2→y | x3→y | x4→y | x5→y | x6→y | x7→y | x8→y | x9→y | ||
| Resin-P (x1) | −0.023 | – | 0.442 | −0.020 | −0.036 | −0.053 | 0.354 | −0.076 | 0.044 | −0.022 |
| NaHCO3-Pi (x2) | 0.483** | −0.021 | – | −0.014 | −0.042 | −0.054 | 0.353 | −0.078 | 0.044 | −0.020 |
| NaHCO3-Po (x3) | −0.088 | −0.005 | 0.074 | – | −0.027 | −0.005 | 0.003 | −0.023 | 0.029 | −0.001 |
| NaOH-Pi (x4) | −0.082 | −0.010 | 0.245 | −0.029 | – | −0.001 | 0.194 | −0.041 | 0.066 | −0.023 |
| NaOH-Po (x5) | −0.081 | −0.015 | 0.321 | −0.006 | −0.001 | – | 0.250 | −0.052 | 0.013 | −0.003 |
| D.HCl-P (x6) | 0.454* | −0.018 | 0.376 | −0.001 | −0.035 | −0.045 | – | −0.072 | 0.048 | −0.021 |
| C.HCl-Pi (x7) | −0.091 | −0.019 | 0.413 | −0.022 | −0.037 | −0.046 | 0.357 | – | 0.037 | −0.012 |
| C.HCl-Po (x8) | 0.104 | −0.010 | 0.204 | −0.024 | −0.052 | −0.010 | 0.210 | −0.033 | – | −0.031 |
| Residual-P (x9) | −0.056 | −0.009 | 0.177 | −0.001 | −0.034 | −0.004 | 0.167 | −0.020 | 0.057 | – |
Discussion
Comparison of the phosphorus fractionation methods
Since the two phosphorus fractionation procedures extracted different P species that do not strictly match with each other and even the same or similar forms of phosphorus were isolated with different set of reagents. Therefore, the comparison can only be made in between the same fractions or categories where one or several species were included. Here, the pools of soil P obtained from each fractionation were divided into categories of labile P, Fe & Al-P, Ca-P, organic P, and total-Pi. For the investigated calcareous soil, a good correlation between various P fractions or categories in Jiang-Gu and Tiessen-Moir fractionations was observed, but labile P contents by Jiang-Gu fractionation were lower compared with Tiessen-Moir fractionation. This difference in labile P extraction between the two fractionations might be firstly ascribed to the difference in the extractants varying in extractability and solubility (Saggar et al., 1999; Soinne et al., 2011), for example, in Tiessen-Moir scheme, the labile P was separated with 0.5 M NaHCO3 at pH 8.5 and resin, while it was extracted with 0.25 M NaHCO3 at pH 7.5 in Jiang-Gu scheme. Secondly, higher concentration of HCO3− may precipitate more Ca2+ and thus release more P from Ca-bounded P fractions, which were the major fractions in the tested calcareous soil (Olsen & Sommers, 1982; Saggar et al., 1999). Thirdly, in the first step of the extraction scheme, the anion resin may remove a lot P via surface adsorption. Resin P represents inorganic phosphorus in soil solid phase in equilibrium with soil solution. Unlike other chemical extractants, the resin maintains the solution P concentration at a relatively low level, which will facilitate continued P desorption. Moreover, Resin-P constitutes the majority of labile phosphorus, so it cannot be ignored. Finally, the difference can also be due to the variation in extraction conditions including extraction time, pH of the extractant, centrifugal temperature, etc. (Tiessen, Stewart & Cole, 1984; Jiang & Gu, 1989; Bolan & Hedley, 1990). For instance, Tiessen-Moir method had a longer time in labile P extraction as compared with Jiang-Gu method. Therefore, it may remove more P from soil (Tiessen & Moir, 1993).
Since NaHCO3-Pi and NaOH-Pi do not completely exist independently, they together represent a continuum of Al-P and Fe-P (Tiessen & Moir, 1993). Levy & Schlesinger (1999) also think that the NaHCO3 may remove some P that bounded by iron and aluminum compounds. Therefore, here we made comparison of Fe & Al-P determined by Jiang-Gu fractionation with its counterpart in Tiessen-Moir fractionation, which is the summation of NaHCO3-Pi and NaOH-Pi. Our results showed that contents of Fe & Al bounded P by Tiessen-Moir fractionation were lower as compared with Jiang-Gu fractionation even though contents of NaHCO3-Pi being taken into consideration. This underestimate, on one hand, may be ascribed to the precipitation of NaOH extractable P by Ca2+, which was abundant in soils investigated, during the course of extraction in Tiessen-Moir fractionation in calcareous soils (Levy & Schlesinger, 1999). On the other hand, complex procedures such as long extraction time of Tiessen-Moir fractionation might lead to reabsorption of P released during the extraction, whereas, the Al-F complex formed in NH4F extraction in Jiang-Gu fractionation could prevent P from being re-adsorbed to aluminum hydroxyl groups, therefore present a better estimation (Jiang & Gu, 1989; Soinne et al., 2011). We observed that Jiang-Gu fractionation gave the much similar Ca bounded-P contents than Tiessen-Moir did at low P levels, but greater Ca-P fraction where soil contains a high P level (Fig. 2C). Low values for P in dilute HCl extraction may arise from the labile P being extracted by the first two steps (i.e., anion resin and NaHCO3) of the Tiessen-Moir fractionation (Fig. 2A). Tiessen-Moir fractionation showed similar total-Pi and total-P contents, lower total-Po contents relative to that derived from Jiang-Gu fractionation (Fig. 3B) and ignition method (Fig. 3C). Discrepancy in total organic P between the questioned two fractionations might be explained by the following reasons. Firstly, Tiessen-Moir fractionation excluded microbial biomass P and the organic P that adsorbed onto the surface of soil aggregates due to the lower P contents (Tiessen & Moir, 1993). Secondly, organic P was ignored by some extraction steps, i.e., Levy & Schlesinger (1999) indicated that most of the residual-P in the Hedley fractionation, on which Tiessen-Moir modification based, is in organic form. He et al. (2006) believed that phosphorus extracted by 1M HCl may contain large amount of organic P. Thirdly, excessive reactions caused by strong acid and strong alkali solutions may destroy both inorganic and organic P bounded in clay, as a results, organic P was underestimated. Besides, some organic P may be hydrolyzed or incompletely extracted during the course of sequential extraction, for example, Blake et al. (2003) reported that more than 50% of C. HCl-Po was hydrolyzed to inorganic P before determination. In addition, Thomas & Wang (1997) observed that the resin P was positively and linearly corelated to soil organic carbon, they commented that some resin P might come from organic P, which may also lead to the underestimation of organic P content. Positive linear correlations between the Resin P in Tiessen-Moir fractionation and total Po in both fractionations in our study may also support the deduction made by Thomas & Wang (1997). Whereas some organic P might not be completely oxidized with persulfate autoclaved at 121 °C, hence Po contents were underestimated (Condron et al., 1990). Furthermore, in ignition method, organic P is converted to inorganic form by high temperature, which can change the solubility of some Pi in soil and therefore lead to overestimation of organic P (Williams & Walker, 1967; Hong & Yamane, 1980). The underestimation of Po in Tiessen-Moir fractionation can be extremely high; this could be inferred from Po values measured with the protocol proposed by Bowman & Cole (1978). For example, in a study with exactly the same kind of soil as in our case collected from a 10-years field experiment, Wang, Zhang & Li (1997) reported that organic phosphorus ranged from 69.5 mg kg−1 to 250.4 mg kg−1 in Bowman and Cole method (1978), these values were about two times as much as in our cases in Tiessen-Moir fractionation ranging from 34.6 mg kg−1 to 93.3 mg kg−1.
Bioavailability of phosphorus fractions extracted by Jiang-Gu and Tiessen-Moir fractionations
Our study also showed that P uptake in above-ground biomass of winter wheat was significantly and positively correlated with Ca2-P, Ca8-P, Al-P, Fe-P and O-P in Jiang-Gu fractionation. Similar results were also reported for millet-millet-ryegrass crops on a calcareous soil (Shen & Jiang, 1992) and for soybean crop on a brown soil (Shu & Zou, 2001). The linear correlation between P uptake and O-P in our case (Fig. 4E) may be due to the release of occluded P fraction as a consequence of reduction of coated iron oxide (Hamad, Rimmer & Syers, 1992; Kuo & Jellum, 1994), because in most of the soils the frequently occurred anaerobic conditions were inevitable (Ma et al., 2008). The significant positive linear relationship between P uptake and Ca10-P in this study (Fig. 4F) was contradicted to most studies (Lin et al., 1997; Wang et al., 2010). It may suggest that Ca10-P, as a potential P source (Shen & Jiang, 1992) and the largest P fraction in tested soils, may eventually be available although its quantity of release is much less during a short period. Olsen P is a well-established indicator of phosphorus availability worldwide (Bai et al., 2013). Path analysis results suggested that Ca2-P and Ca8-P in our case had considerable direct effects on soil Olsen P, the Al-P, Fe-P and O-P made contributions to Olsen P via Ca2-P and Ca8-P, while the Ca10-P showed the least indirect effect (Table 4). Path analysis of P fractions on P uptake also demonstrated the highest and significant direct effect of Ca2-P in Jiang-Gu fractionation (P < 0.01) among the six Pi fractions, but Ca8-P, Al-P, Fe-P, O-P and Ca10-P indirectly impacted P uptake through Ca2-P in a considerable degree (Table 2). Some studies showed that wheat can solubilize Al and Fe bounded P sources, but the mechanism was not known (Osborne & Rengel, 2002; Pearse et al., 2007). While some others observed that Fe-P (Lv et al., 2003) or Al-P (Yang, Chen & Yang, 2019) had direct effect on crop growth, which acted as a sink for fertilizer P, but the desorption was rapid enough to maintain high levels of plant available P (Wang et al., 2010). These inconsistencies might also be related to soil pH, redox conditions and other factors (Xia & Gao, 1993) such as P input and soil managements (Vu, Tang & Armstrong, 2008; Jia et al., 2013; Ahmed et al., 2019; Khan et al., 2021). However, Ca2-P can be confirmed to be the most effective phosphorus source for crops in the study area.
| Factor | Direct effect | Indirect effect | |||||
|---|---|---|---|---|---|---|---|
| x1→y | x2→y | x3→y | x4→y | x5→y | x6→y | ||
| Ca2-P (x1) | 0.510** | – | 0.407 | −0.020 | 0.028 | −0.097 | 0.036 |
| Ca8-P (x2) | 0.468** | 0.444 | – | −0.021 | 0.031 | −0.099 | 0.039 |
| Al-P (x3) | −0.023 | 0.441 | 0.423 | – | 0.027 | −0.101 | 0.038 |
| Fe-P (x4) | 0.037 | 0.381 | 0.387 | −0.017 | – | −0.081 | 0.045 |
| O-P (x5) | −0.129 | 0.384 | 0.358 | −0.018 | 0.023 | – | 0.022 |
| Ca10-P (x6) | 0.063 | 0.291 | 0.292 | −0.014 | 0.026 | −0.045 | – |
In our study, C. HCl-Pi, D. HCl-P and NaOH-Po in Tiessen-Moir fractionation were also important P sources besides Resin-P and NaHCO3-Pi for winter wheat on tested soil, all these phosphorus fractions showed significant positive linear correlations with P uptake of winter wheat (Fig. 5). Similar results were reported in a calcareous paddy soil under intensive rice cropping (Zhang et al., 2006). Depletions of Resin-P and NaHCO3-Pi by plant were well documented (Boschetti, Quintero & Giuffre, 2009; Zhang et al., 2006). NaOH-Pi is believed to be held more strongly by chemisorption to Fe and Al components of soil surface (Hedley, Stewart & Chauhan, 1982), and is more labile than D. HCl-P, but the fact that it showed no significant correlation with P uptake (Fig. 5D) might be due to the underestimation of this P form in the fractionation as stated earlier. But the depletion of the C. HCl-Pi, D. HCl-P was somewhat unexpected. These two forms were normally believed to represent Ca-bound P and accounted for about 55.6–64.2% of total soil P, and in most of the cases were considered lower plant availability (Williams, Mayer & Nriagu, 1980; Boschetti, Quintero & Giuffre, 2009). There also some other studies have reported that HCl-P appears to help replenish the available-P in the soil. However, the significant positive correlations between high resistant C. HCl-Pi, D. HCl-P and P uptake were also observed by other studies (Guo et al., 2000; Zhang et al., 2006), the authors ascribed to that this P fraction may come from particulate organic matter, which is easily bioavailable but not alkali extractable (Zhang, Wang & Feng, 2007). Pertaining to organic P fractions in Tiessen-Moir fractionation, only NaOH-Po showed significant positive correlation with P uptake in aboveground biomass of winter wheat. The less response of NaHCO3-Po to P uptake might be due to its a transient pool of soil organic P (Beck & Sanchez, 1994; Zheng et al., 2004) and its lower concentration, which may produce large error in its estimation. The positive and significant correlation between NaOH-Po fractions with P uptake of wheat could be related to the wheat growth, which in turn may contribute more organic P in debris that returned to soil (Boschetti, Quintero & Giuffre, 2009). Zheng et al. (2004) indicated that NaOH-Po served as a sink for added Po, and could immobilize the labile Pi from the annual applications of mineral P fertilizer. Meanwhile, it can also be conversely mineralized and increasing labile Pi in the liquid dairy manure plot. In this study, we observed a positive correlation between P uptake and total organic P obtained with Tiessen-Moir rather than ignition method. The possible reason was ascribed to the overestimated organic phosphorus obtained by ignition method (Williams & Walker, 1967). On the other hand, the Po obtained with Tiessen & Moir fractionation only represented the small portion of organic P, of which most were labile. Organic P was mostly in the form of moderate activity (Wang, Zhang & Li, 1997). Our results also indicated that only NaHCO3-Pi and D. HCl-P made significant direct contribution to Olsen P (Table 5). This was most likely due to the influence of relatively higher contents of Ca2-P and Ca8-P contained in D. HCl-P. Other studies reported that HCl-P, along with NaOH-Pi, as both source and pool, affected the available phosphorus through NaHCO3-Pi (Beck & Sanchez, 1994; Zhang & Mackenzie, 1997). The direct effect of Resin-P on Olsen P was greater than other P forms except for NaHCO3-Pi and D. HCl-P, but it had the greatest indirect effect through NaHCO3-Pi. NaHCO3-Pi was believed more sensitive in response to crop uptake than Resin-P, this was in agreement with Tiessen & Moir (1993), but adverse to Saggar et al. (1999) on acid pasture soil and Yang & Jacobsen (1990) on calcareous soil. These may suggest that not only phosphate ions, but also dissolved and colloidal matter contributes to availability of phosphorus under these experimental conditions (Tiessen & Moir, 1993; Amer et al., 1955).
| Factor | Direct effect | Indirect effect | ||||||||
|---|---|---|---|---|---|---|---|---|---|---|
| x1→y | x2→y | x3→y | x4→y | x5→y | x6→y | x7→y | x8→y | x9→y | ||
| Resin-P (x1) | 0.220 | – | 0.590 | −0.010 | −0.004 | −0.097 | 0.251 | 0.050 | −0.016 | 0.008 |
| NaHCO3-Pi (x2) | 0.632** | 0.205 | – | −0.008 | −0.004 | −0.097 | 0.251 | 0.051 | −0.016 | 0.008 |
| NaHCO3-Po (x3) | −0.056 | 0.041 | 0.085 | – | −0.004 | 0.005 | −0.006 | 0.014 | −0.008 | −0.001 |
| NaOH-Pi (x4) | −0.011 | 0.075 | 0.251 | −0.021 | – | 0.013 | 0.110 | 0.023 | −0.018 | 0.003 |
| NaOH-Po (x5) | −0.148 | 0.145 | 0.413 | 0.002 | 0.001 | – | 0.181 | 0.031 | −0.006 | 0.003 |
| D.HCl-P (x6) | 0.314* | 0.176 | 0.505 | 0.001 | −0.004 | −0.086 | – | 0.046 | −0.016 | 0.007 |
| C.HCl-Pi (x7) | 0.060 | 0.183 | 0.539 | −0.013 | −0.004 | −0.076 | 0.243 | – | −0.012 | 0.004 |
| C.HCl-Po (x8) | −0.031 | 0.115 | 0.326 | −0.014 | −0.006 | −0.028 | 0.163 | 0.024 | – | 0.010 |
| Residual P (x9) | 0.018 | 0.101 | 0.274 | 0.005 | −0.002 | −0.023 | 0.117 | 0.014 | −0.017 | – |
Conclusions
Adopting a sound phosphorus fractionation procedure will enable researchers to have a more accurate understanding of the fate and transformation of phosphorus added in the forms of synthetic or organic supplements under different environmental conditions. In this study, we observed that Tiessen-Moir fractionation procedure extracted more available phosphorus but underestimate the contents of iron and aluminum bounded phosphorus, which were believed to be the most important sources of available P in most of the cases, and especially underestimated the total organic phosphorus fractionation compared with that derived from Jiang-Gu and ignition method. By contrast, Jiang-Gu fractionation procedure can better elucidate the bioavailability of different inorganic P fractions and their response to Olsen-P on the calcareous soil in question, although it did not provide any information about soil organic phosphorus. In view of the disadvantages of the Tiessen-Moir fractionation procedures as stated above, complicated steps and time-consuming feature. We would like to recommend Jiang-Gu fractionation procedure in calcareous soils.
Supplemental Information
Datas for all the papers
Each value is the average of three replicates.
Concentration of inorganic phosphorus (P) fractions in soils subjected to diverse fertilization for 20 years on an irrigated Loess soil (Jiang-Gu method).
Values are the means. The same lowercase letters inside the bars with same color means no significant difference between treatments at 5% level by LSD.
Concentration of inorganic phosphorus (P) fractions in soils subjected to diverse fertilization for 20 years on an irrigated Loess soil (Tiessen-Moir method)
Values are the means. The same lowercase letters inside the bars with same color means no significant difference between treatments at 5% level by LSD. Resin, NaHCO3, NaOH, D. HCl, C. HCl denote the extracting agents of resin (in water), sodium bicarbonate, sodium hydroxide, diluted hydrochloric acid and concentrated hydrochloric acid, respectively.
Proportion of phosphorus fractions by Jiang & Gu (1989) to total phosphorus of the plough layer soils subjected to diverse fertilization managements for 20 years on an irrigated Loess soil (%)
Total phosphorus denotes the summation of all the fractions.
Proportion of phosphorus fractions by Tiessen & Moir (1993) to total phosphorus of the plough layer soils subjected to diverse fertilization managements for 20 years on an irrigated Loess soil (%)
Note: Total phosphorus denotes the summation of all the fractions.