
Synthesis of fluorescent polystyrene nanoparticles: a reproducible and scalable method
- Published
- Accepted
- Received
- Academic Editor
- Sreeprasad Sreenivasan
- Subject Areas
- Electronic, Optical and Magnetic, Nano and Microstructured Materials, Polymers
- Keywords
- Nanoparticles, Composite materials, Synthesis, Optical materials, Component synthesis, Parameter screening
- Copyright
- © 2022 Bartos et al.
- Licence
- This is an open access article distributed under the terms of the Creative Commons Attribution License, which permits unrestricted use, distribution, reproduction and adaptation in any medium and for any purpose provided that it is properly attributed. For attribution, the original author(s), title, publication source (PeerJ Materials Science) and either DOI or URL of the article must be cited.
- Cite this article
- 2022. Synthesis of fluorescent polystyrene nanoparticles: a reproducible and scalable method. PeerJ Materials Science 4:e22 https://doi.org/10.7717/peerj-matsci.22
Abstract
Methods
Polystyrene nanoparticles (PS NPs) were fabricated from an emulsion of PS/toluene in water using several surfactants, and purified via dialysis in a simple procedure. The synthesis process was carried out at room temperature, without hazardous chemicals, and with a workload of 5 h. All relevant parameters–surfactant type, component concentration, solvent volume, polymer chain length, sonication time–were varied and the effect on the size of the resulting PS NPs were determined. A robust PS NP synthesis procedure was developed, repeated, and tested by three independent researches. The procedure was up-scaled to prove the applicability of the method and the NPs were prepared with four different hydrophobic dyes.
Results
All products were found to be comparable, and we conclude that the method can provide PS NPs with or without dye dopants with an average diameter of 25 nm in a reproducible size distribution.
Introduction
With an interest in functional fluorescent materials (Frankær et al., 2018; Frankær et al., 2019; Carro-Temboury et al., 2018; Arppe-Tabbara, Tabbara & Sørensen, 2019; Sørensen et al., 2012), we have followed the development of fluorescent nanomaterials that has seen great developments since the coining of the term in the 1950s (Feynman, 1959). Today, luminescent quantum dots, fluorescent polymer nanoparticles (NPs), luminescent nanodiamonds, and lipid-based nano-assemblies are used in various applications from display technologies for household electronic products and smartphones to cancer theranostics (Alivisatos, 1996; Wang et al., 2005; Shen, Sun & Yan, 2008; Guo & Wang, 2011; Biju, 2014; Peng et al., 2014; Yao, Yang & Duan, 2014; Lim, Shen & Gao, 2015; Wolfbeis, 2015; Binderup et al., 2019). Most prevalent in industrial use are quantum dots, or specifically fluorescent semiconductor nanoparticles, which over three decades have been engineered to the point where bulk production (hundreds of kilograms to tons) of emitters with colors all across the spectrum are possible (Alivisatos, 1996; Peng, Wickham & Alivisatos, 1998; Peng et al., 2000; Bera et al., 2010). This has led to an industrialization of the material and products like quantum-dot TV (Bourzac, 2013), and quantum-dot based solar cells (Carey et al., 2015). A similar evolution of other fluorescent nanomaterials is yet to happen, and there are only few industrial fluorescent nanomaterials.
Fluorescent nanomaterials offer high brightness and photostability in components that on the macroscale distribute as if they were molecules. Thus, they give rise to homogeneous fluorescent signals from bulk materials. Surface attachments, especially swelling-diffusion methods, are widely used to incorporate dyes into preformed polymer particles (Lee et al., 2011; Xie et al., 2014; Wang et al., 2018; Ueya et al., 2021; Wang et al., 2019). Commercially available dyed beads are often prepared by this technique. The brightest nanomaterials are dye-doped nanoparticles, where Reisch and Klymchenko have created super bright fluorescent nanomaterials by doping polymer nanoparticles with rhodamines ion paired with bulky fluorinated anions (Reisch et al., 2014; Reisch et al., 2017; Andreiuk et al., 2019). While this method is limited by aggregation-induced quenching (Reisch & Klymchenko, 2016; Chen & Yin, 2014), several high performing materials have been reported (Wu et al., 2010; Grazon et al., 2013; Tian, Shaller & Li, 2009). Very recently, fluorescent materials with a record brightness have been reported by Flood and Laursen, the technology, based on small-molecule ionic isolation lattices (SMILES) surpass all other organic dye-based fluorescent materials (Reisch & Klymchenko, 2016; Benson et al., 2020), and has recently been used to make fluorescent nanomaterials (Chen et al., 2021). All these ultrabright nanomaterials constitute great advances in nanoscience, yet for nanotechnological applications, controlled manufacture is still needed.
Quantum dots are often made from heavy metals, which, despite the excellent photophysical properties, limits applications (Pelley, Daar & Saner, 2009; Tsoi et al., 2013; Valizadeh et al., 2012; Wegner & Hildebrandt, 2015). Fluorescent materials for biological applications has to pass USP class IV certification (U.S. Pharmacopeia), which limits the amount of hazardous material that can be included. Here, polymer based nanoparticles synthesized from certified starting materials with low intrinsic toxicity and good biocompatibility have a significant advantage. Polystyrene (PS) in particular is a good material which is widely used and the synthesis of PS NPs has received a great deal of attention as a model system for developing polymer nanotechnology (Loos et al., 2014; Nasir & Kausar, 2015). By functionalizing the NPs with dyes or biological molecules, PS NPs have been used in optical sensors for metabolism tracking (Sapsford et al., 2013), and commercial PS beads doped with fluorophores are sold at high prices.
PS NPs are often synthesized by the microemulsion polymerization method, by polymerizing the monomer styrene directly in the emulsion (Ueya et al., 2021; Ming et al., 1996; Ming, Jones & Fu, 1998; Zhang et al., 2002; Xu et al., 1999; He & Pan, 2004; Fang et al., 2000; Ishii et al., 2014; Alkadasi & Al-Eyani, 2018; Harkins, 1947). In these systems an emulsifier, an initiator, and a cross-linker are also needed (Nuruzatulifah, Nizam & Ain, 2016). Briefly, the NP fabrication occurs in the emulsion at temperatures in the range of 65–80 °C, which is kept for 6–8 h in an N2 atmosphere (Fang et al., 2000; Ishii et al., 2014). The emulsion polymerization has been used to synthesize polymer particles for more than 50 years, and it has been shown in the scientific literature that this method allows for production of batches of monodisperse PS NPs smaller than 100 nm. However, these NPs may contain residual contaminant (monomer, oligomers, initiators, etc.) from the synthesis, and to our knowledge an industrial supply of dye doped PS NP is still to emerge (Al-Hanbali et al., 2006). To remedy this, we explored an alternative PS NP production process. By starting from PS, we have no additives, which should ensure USP class IV certification. Thus, we report a standard protocol for making dye doped PS NPs for use as components in fluorescent materials. We fabricated PS NPs using a pure physical method directly from the bulk PS polymer. We used a surfactant enabled microemulsion method based on toluene/water mixtures (Landfester, 2006; Groeneveld & de Mello Donegá, 2014; Landfester, 2009). A NP size range of 10 to 200 nm is most relevant to biochemical targeting through both intravascular and site-specific deliveries. Size is one of the main parameters of NPs. Methods were reported about the preparation of polymer NPs with controlled sizes (Hickey et al., 2015; Rao & Geckeler, 2011). We found several parameters that change the outcome of the synthesis:
Surfactant type
Surfactant concentration
Ratio of toluene to water
PS in toluene concentration
PS molecular weight
Number of refinements (sonication cycles)
Sonication effect (power) in each refinement
Waiting time between refinements
Addition of hydrophobic additives (dyes)
We chose to vary all the parameters above to thoroughly investigate how each factor influence the PS NPs produced using our protocol. We mapped the influence of each parameter, and tested the repeatability of the fabrication protocol. Finally, we explored the potential for industrial scale production by increasing the scale five times. As part of the study, we included four different hydrophobic dyes and found that they were all included in the PS NPs, and all maintained their photophysical properties.
Materials and Methods
Regents and materials
Polystyrenes (Mw = 35,000, 280,000 and 350,000), sodium dodecyl sulphate (SDS), cetyltrimetylammonium bromide (CTAB), Triton X-100, Synperonic F-108, toluene, thioxanthene-9-one, celestine blue and the dialysis tube (cellulose membrane, avg. flat width 23 mm, MWCO 12400) were purchased from Sigma-Aldrich. N,N-bis(2,6-diisopropylphenyl)perylene-3,4:9:10-bis(dicarboximide) (PDI) was obtained from KU Dyes ApS, Denmark. N,N-(2-ethylhexyl)-1,13-dimethoxyquinacridinium hexafluorophosphate (DMQA) were synthesized in house (Hargenrader et al., 2018; Kacenauskaite et al., 2021). Milli-Q water was used for the preparation of the PS NPs.
The standard PS NP synthesis procedure
A total of 14 mg/48.5 mmol of SDS was dissolved in 14 mL of water. A total of 0.3 mg of the desired dye was added to the PS toluene solution (17.34 mg 35,000 Mw polystyrene in 2 mL toluene). The two solutions were mixed and the resulting two-phase system was sonicated (Sonicator probe diameter: 8 mm, sonication power: 60 W) with pulsed sonication (1 s on and 1 s off) for a total duration of 60 s while the solution was stirred at 300 rpm. This sonication process, described as a refinement, was repeated four more times, five refinements were performed in total.
In between each refinement, the vial was left stirring at 300 rpm with a closed cap for 60 min. After the final refinement, the sample was left stirring at 300 rpm for 48 h with an open cap. This allowed most of the toluene to evaporate. The sonicator probe was cleaned with ethanol and dried with science precision wipes before use, after use, and between different samples. After the 48 h of toluene evaporation, extra surfactant as well as molecular impurities and salts were removed by dialysis:
A suitable length of dialysis tubing was cut, sealed at one end with a clamp, and loaded with the reaction mixture using a transfer pipette. The tube was sealed with a second clamp and placed in a beaker with at least 250 mL Milli-Q water and a bar magnet. The beaker with the tube was placed on a stirrer, and left to dialyze for at least 2 days. The water was changed at least five times. The dialyzed sample should not foam when shaken.
Variations over the standard PS NP synthesis procedure
PS NPs were prepared with different surfactant concentrations. Different amount of SDS (0.014, 0.14, 1.4, 7, 14, 70, 140 or 280 mg) was dissolved in 14 mL of water and 1% PS (Mw, 35,000) was prepared in 2 mL of toluene. For the rest of the synthesis procedure the standard process above was followed.
For the PS NPs prepared with different surfactants, 1.73 mM of different surfactants (correspondingly SDS 0.5 mg/mL, CTAB 0.6 mg/mL, Triton X-100 1.1 mg/mL, Synperonic F-108 25 mg/mL) was dissolved in 14 mL of water and 1% PS (Mw, 35,000) was prepared in 2 mL of toluene. No dye was loaded. For the rest of the synthesis procedure the standard process above was followed.
For the PS NPs prepared with different PSs, the same weight percentage 1% was used for each batch. SDS (1 mg/mL in 14 mL water) was used for each sample. No dye was loaded. The rest of the process was identical to the standard procedure.
For the scaled-up PS NP batch, the organic phase was 10 mL of 1% PS (Mw, 35,000) toluene solution, while 70 mL of SDS (1 mg/mL) water solution was used as aqueous phase. No dye was loaded. The rest of the process was identical to the standard procedure.
Instrumentation and measurements
Sonicator (Ultrasonic Processor, FS-300N) with a titanium metal horn probe was used for the NP preparation.
Scanning electron microscopic (SEM) images were obtained using a Jeol 7800F-prime scanning electron microscope (10 kV) with a silicon wafer support. The samples were deposited on cleaned polished side of the silicon wafers and left them dry before the measurements.
For dynamic light scattering (DLS), an ALV/LSE-3 & ALV-5000/60XO Correlator by ALV was used to measure the correlation function of the scattered laser intensity at 90° from the beam path of a 630 nm Laser. The correlation function was then fitted using a regularized fit and then linear number weighted to yield the mean peak position. This was repeated for five runs per sample.
Small-angle X-ray scattering (SAXS) was measured on a SAXSLab instrument (JJ-X-ray, Hørsholm, Denmark) at the Niels Bohr Institute, University of Copenhagen. PS NP solutions were dried by rotary evaporation at 36 °C and the as-prepared powders were loaded in sandwich cells and measured at room temperature. The instrument is equipped with a 100XL + microfocus sealed X-ray tube from Rigaku that produces a photon beam with a wavelength of = 1.54 Å and a 2D 300 K Pilatus detector from Dectris. The 2D scattering patterns were azimuthally averaged, normalised for sample transmission, primary beam intensity and exposure time and corrected for detector inhomogeneities using Saxsgui. The scattering angles ϑ, were converted to a Q-scale:
The data was fitted in Diffpy-CMI (Juhas et al., 2015) and SASVIEW (https://www.sasview.org/) with a power law to describe the long-range order of the particles and a spherical SAXS form factor, with a lognormal size-distribution, to describe the particle size and shape.
Results
Protocol for polystyrene nanoparticle preparation
Polystyrene nanoparticles (PS NPs) were prepared with the sonication microemulsion method (Rao & Geckeler, 2011; Santra et al., 2001; Sanchez-Dominguez, Boutonnet & Solans, 2009; Destrée & Nagy, 2006; Yabu et al., 2005). PS beads (Mw, 35,000, 280,000 or 350,000, with or without dye) were dissolved in toluene at concentrations between 0.5 and 2 w/w%. Toluene was used because of the good solubility of PS in toluene, the low miscibility with water, the low toxicity, and the high volatility in water mixtures (Gündüz & Dincer, 1980; García et al., 2009). Other organic solvents with these properties are also available.
A surfactant (sodium dodecyl sulfate (SDS), cetyltrimetylammonium bromide (CTAB), Triton X-100 or Synperonic F-108) in a concentration between 1 µg/mL and 20 mg/mL was dissolved in water. The NP synthesis was performed using a standardized method as shown in Scheme 1. The two phases were mixed by sonication for 1 min (cycling the sonication with 1 s on and 1 s off) using an immersion sonicator probe (8 mmØ) and sonication power of 60 W. Each 1 min sonication cycles is also known as a refinement.

Scheme 1: Standard synthesis procedure for the PS NPs.
Each refinement was followed by stirring in a closed vessel for 1 h (conditioning in Scheme 1). This emulsification was done in a series of five refinements. Subsequently, the toluene was evaporated by stirring (20 × 5 mm bar magnet at 300 rpm) at room temperature for 2 days. Finally, the PS NPs was isolated and purified by dialysis for 2 days (23 mm 12,400 MWCO dialysis tube sealed with clamps) in at least 250 mL of Milli-Q water, with five changes of the water. Several parameters affect this process and we set out to explore which were critical for obtaining similar products.
Probing the effects of each parameter
Effect of the surfactant concentration
Surfactants are used to stabilize the toluene/PS emulsion in the NP synthesis. As the concentration of the surfactant is expected to change the area of the water/toluene interface, NPs was expected to show different size distributions at different surfactant levels (Walker, Decker & McClements, 2015; Zirak & Pezeshki, 2015).
We prepared PS NPs using different amounts of the surfactant sodium dodecyl sulfate (SDS) (from 1 µg/mL to 20 mg/mL, see the synthesis procedure in experimental section). Figure 1 shows SEM images of six different batches of PS NPs with varying concentrations. Diameters of more than 200 NPs in each image were measured using the ImageJ software. The size distribution statistics were plotted and included in Fig. 1. The size distribution of the particles does change with the concentration of SDS, but not significantly. Less SDS leads to a slightly wider size distribution and larger particles. However, NP diameter distributions are all centered around 20 nm. More SEM images can be found in the Supporting Information.

Figure 1: SEM images and corresponding size distributions for PS NPs with PDI at various SDS concentrations.
(A and B) 0.1, (C and D) 0.5, (E and F) 1.0, (G and H) 5.0, (I and J) 10 and (K and L) 20 mg/ml. PS NPs were prepared according to the standard protocol with PS (Mw, 35,000) 1% w/w% in 2 mL toluene and corresponding amount of SDS in 14 mL water. Scale bars in the images are 100 nm.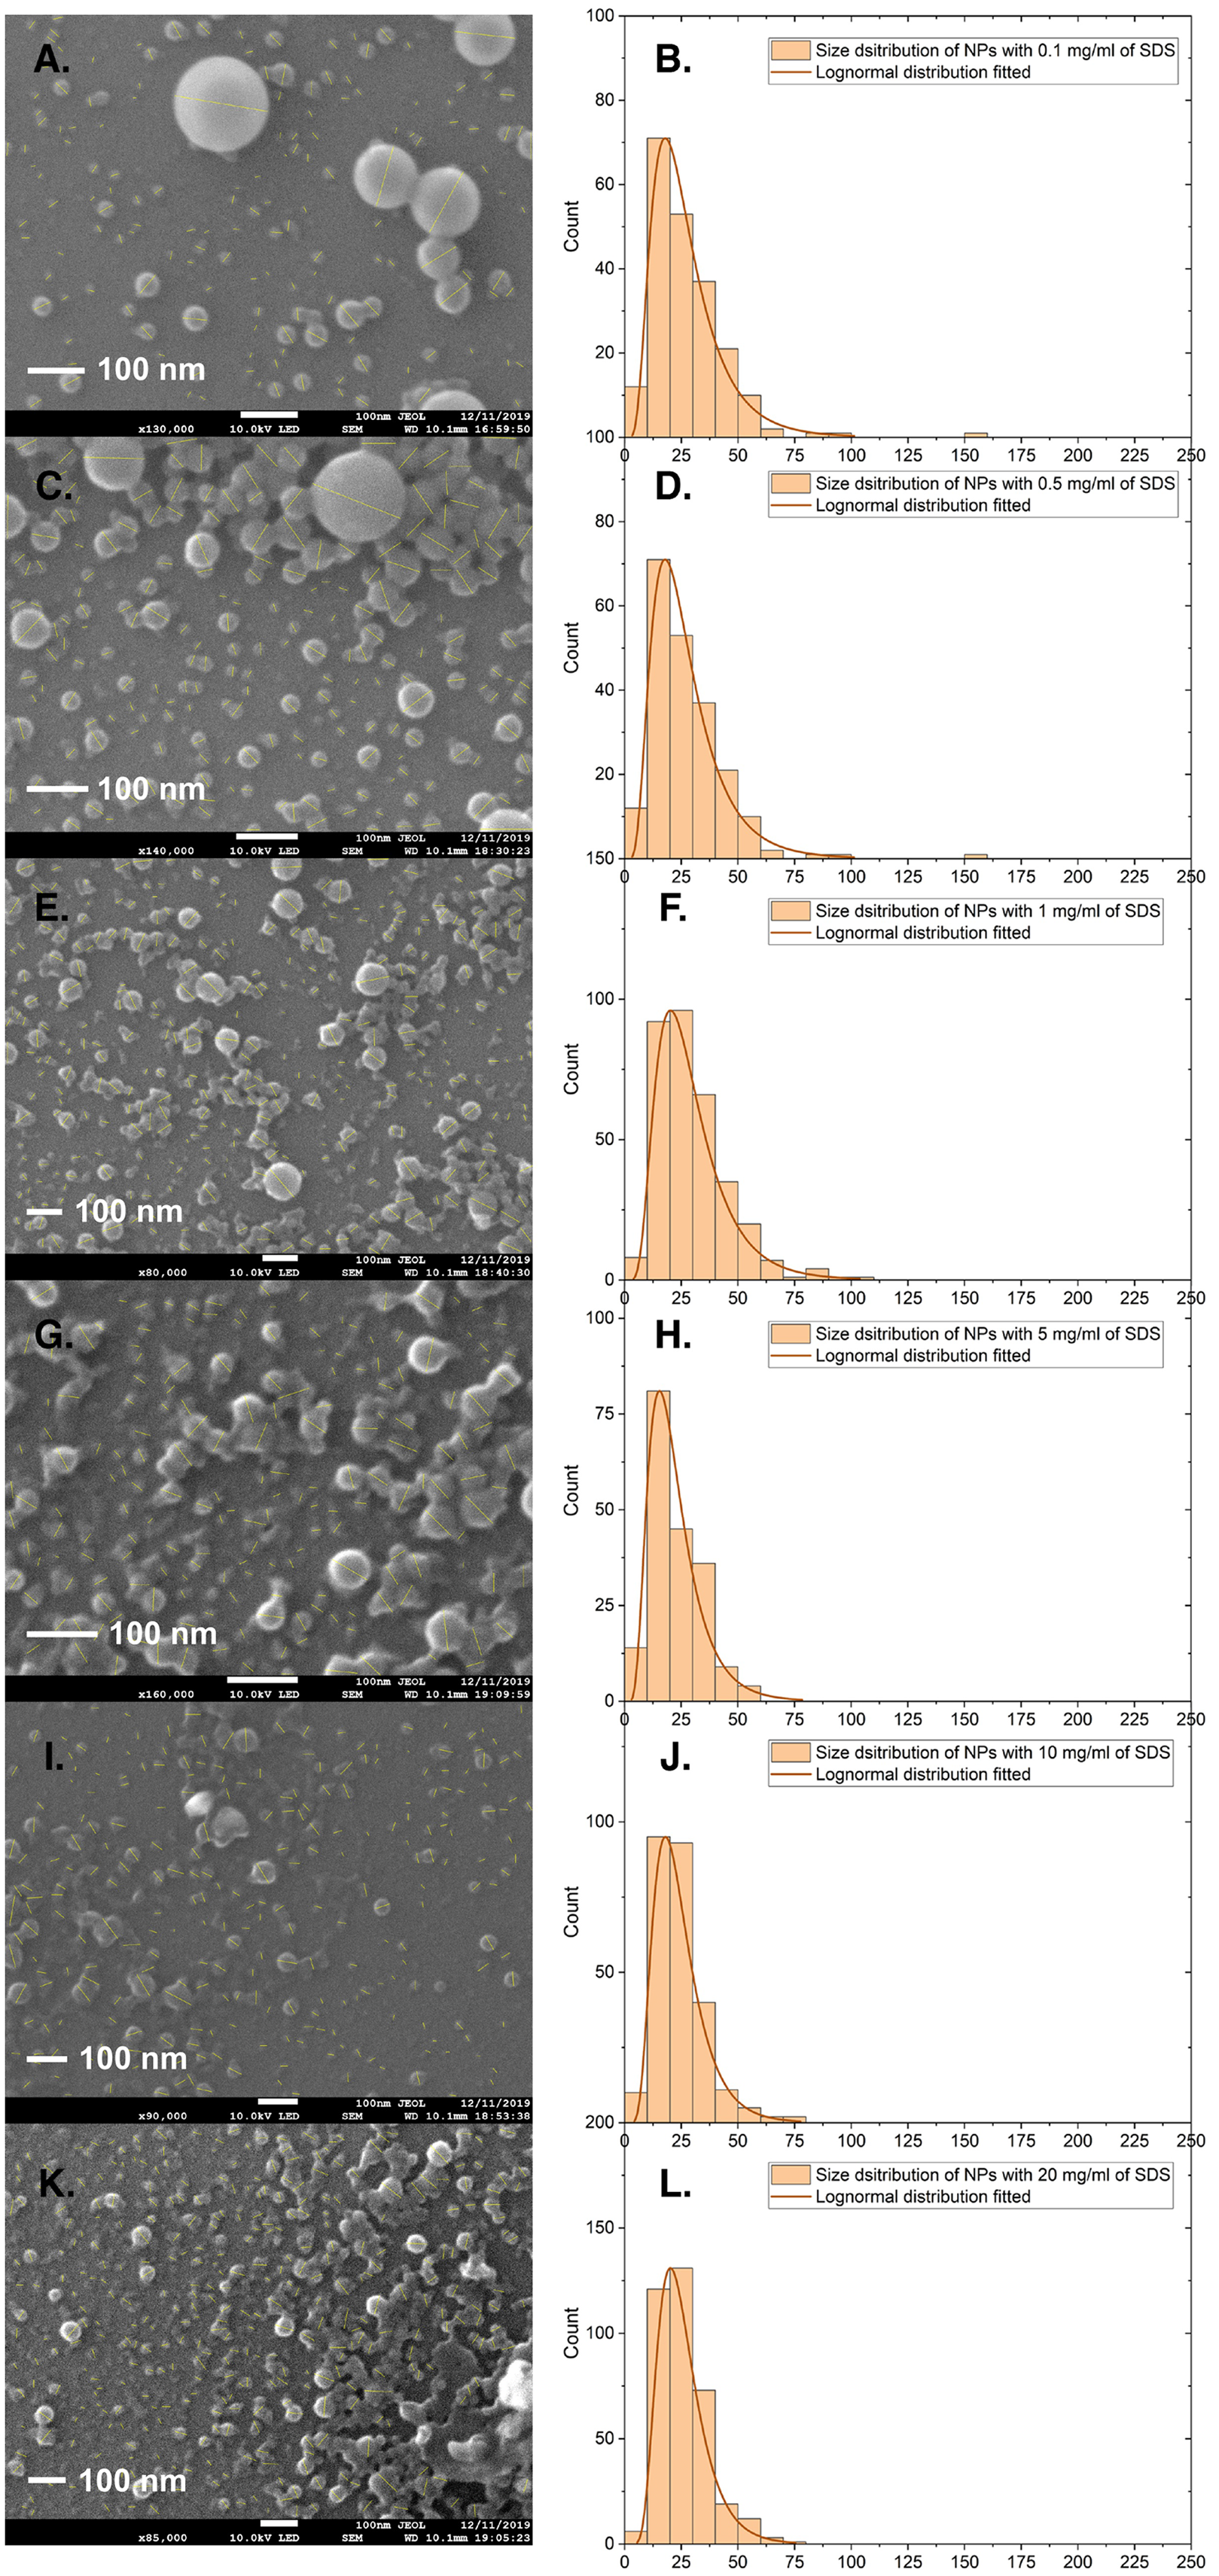
DLS was also used to evaluate the size distribution of the particles. Figure 2 shows the DLS results for the size distribution for the same batches of PS NPs with SDS concentrations varying from 1 µg/mL to 20 mg/mL. Compared with SEM results, the DLS analysis results in larger diameters for PS NPs and also show palpable variations from 50 to 250 nm. SEM works by measuring the conductivity of the dried sample surface and converts it to the geometry signal and therefore provides the physical size of the solid particles. DLS measures the scattering light changing with the movement of the particles, which are covered by stationary double-layers. Thus, the observed differences between DLS and SEM can have two origins.
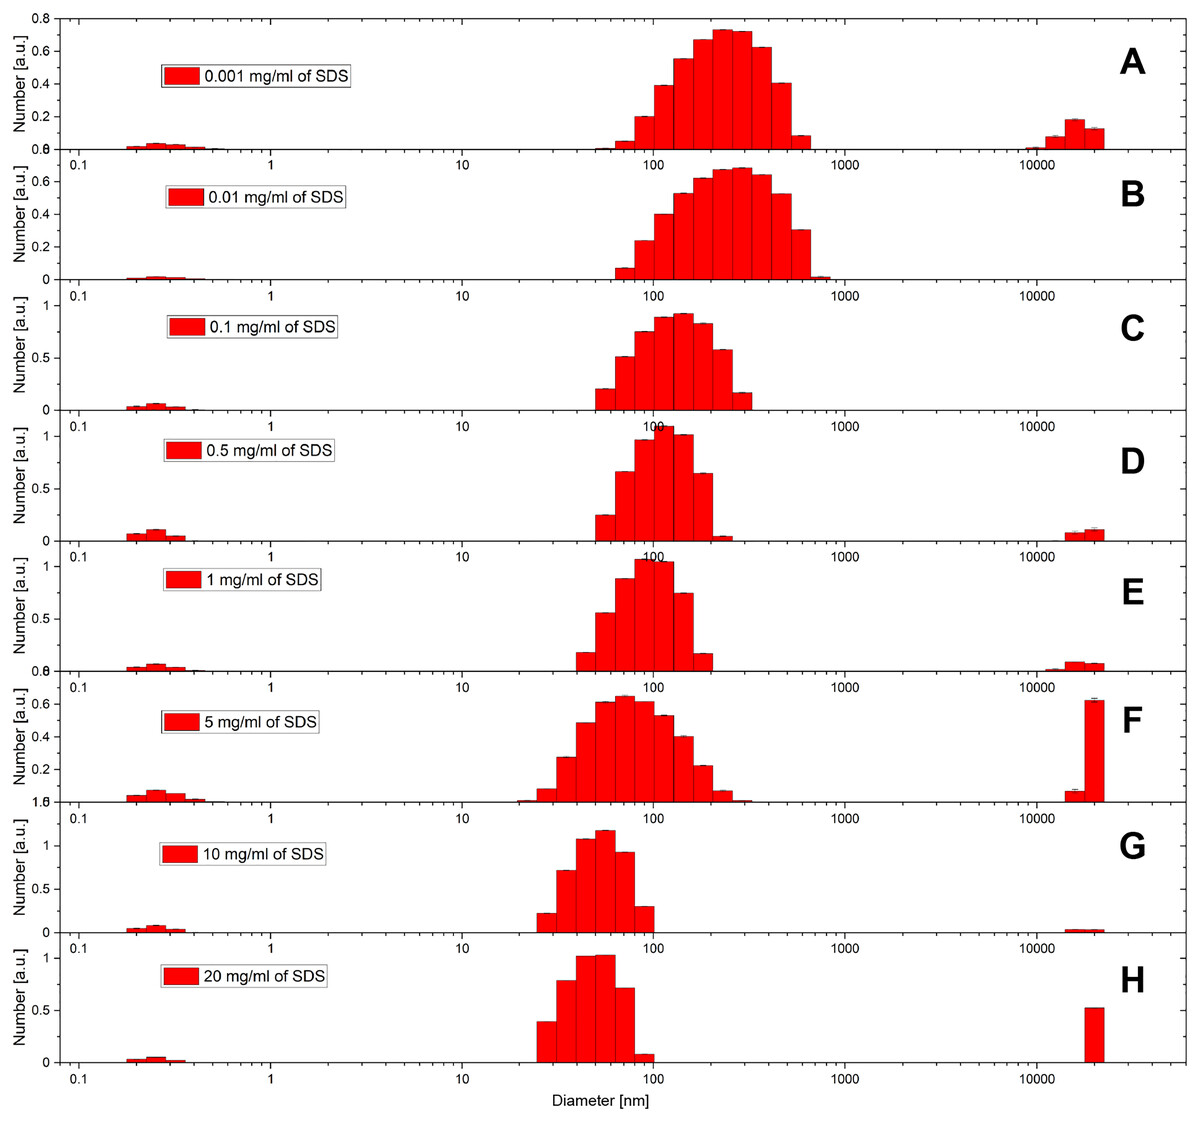
Figure 2: DLS results of size distribution for PS NPs with PDI at various SDS concentrations.
(A) 0.001, (B) 0.01, (C) 0.1, (D) 0.5, (E) 1.0, (F) 5.0, (G) 10.0 and (H) 20.0 mg/mL. PS NPs were prepared according to the standard protocol with PS (Mw, 35,000) 1% w/w% in 2 mL toluene and corresponding amount of SDS in 14 mL water.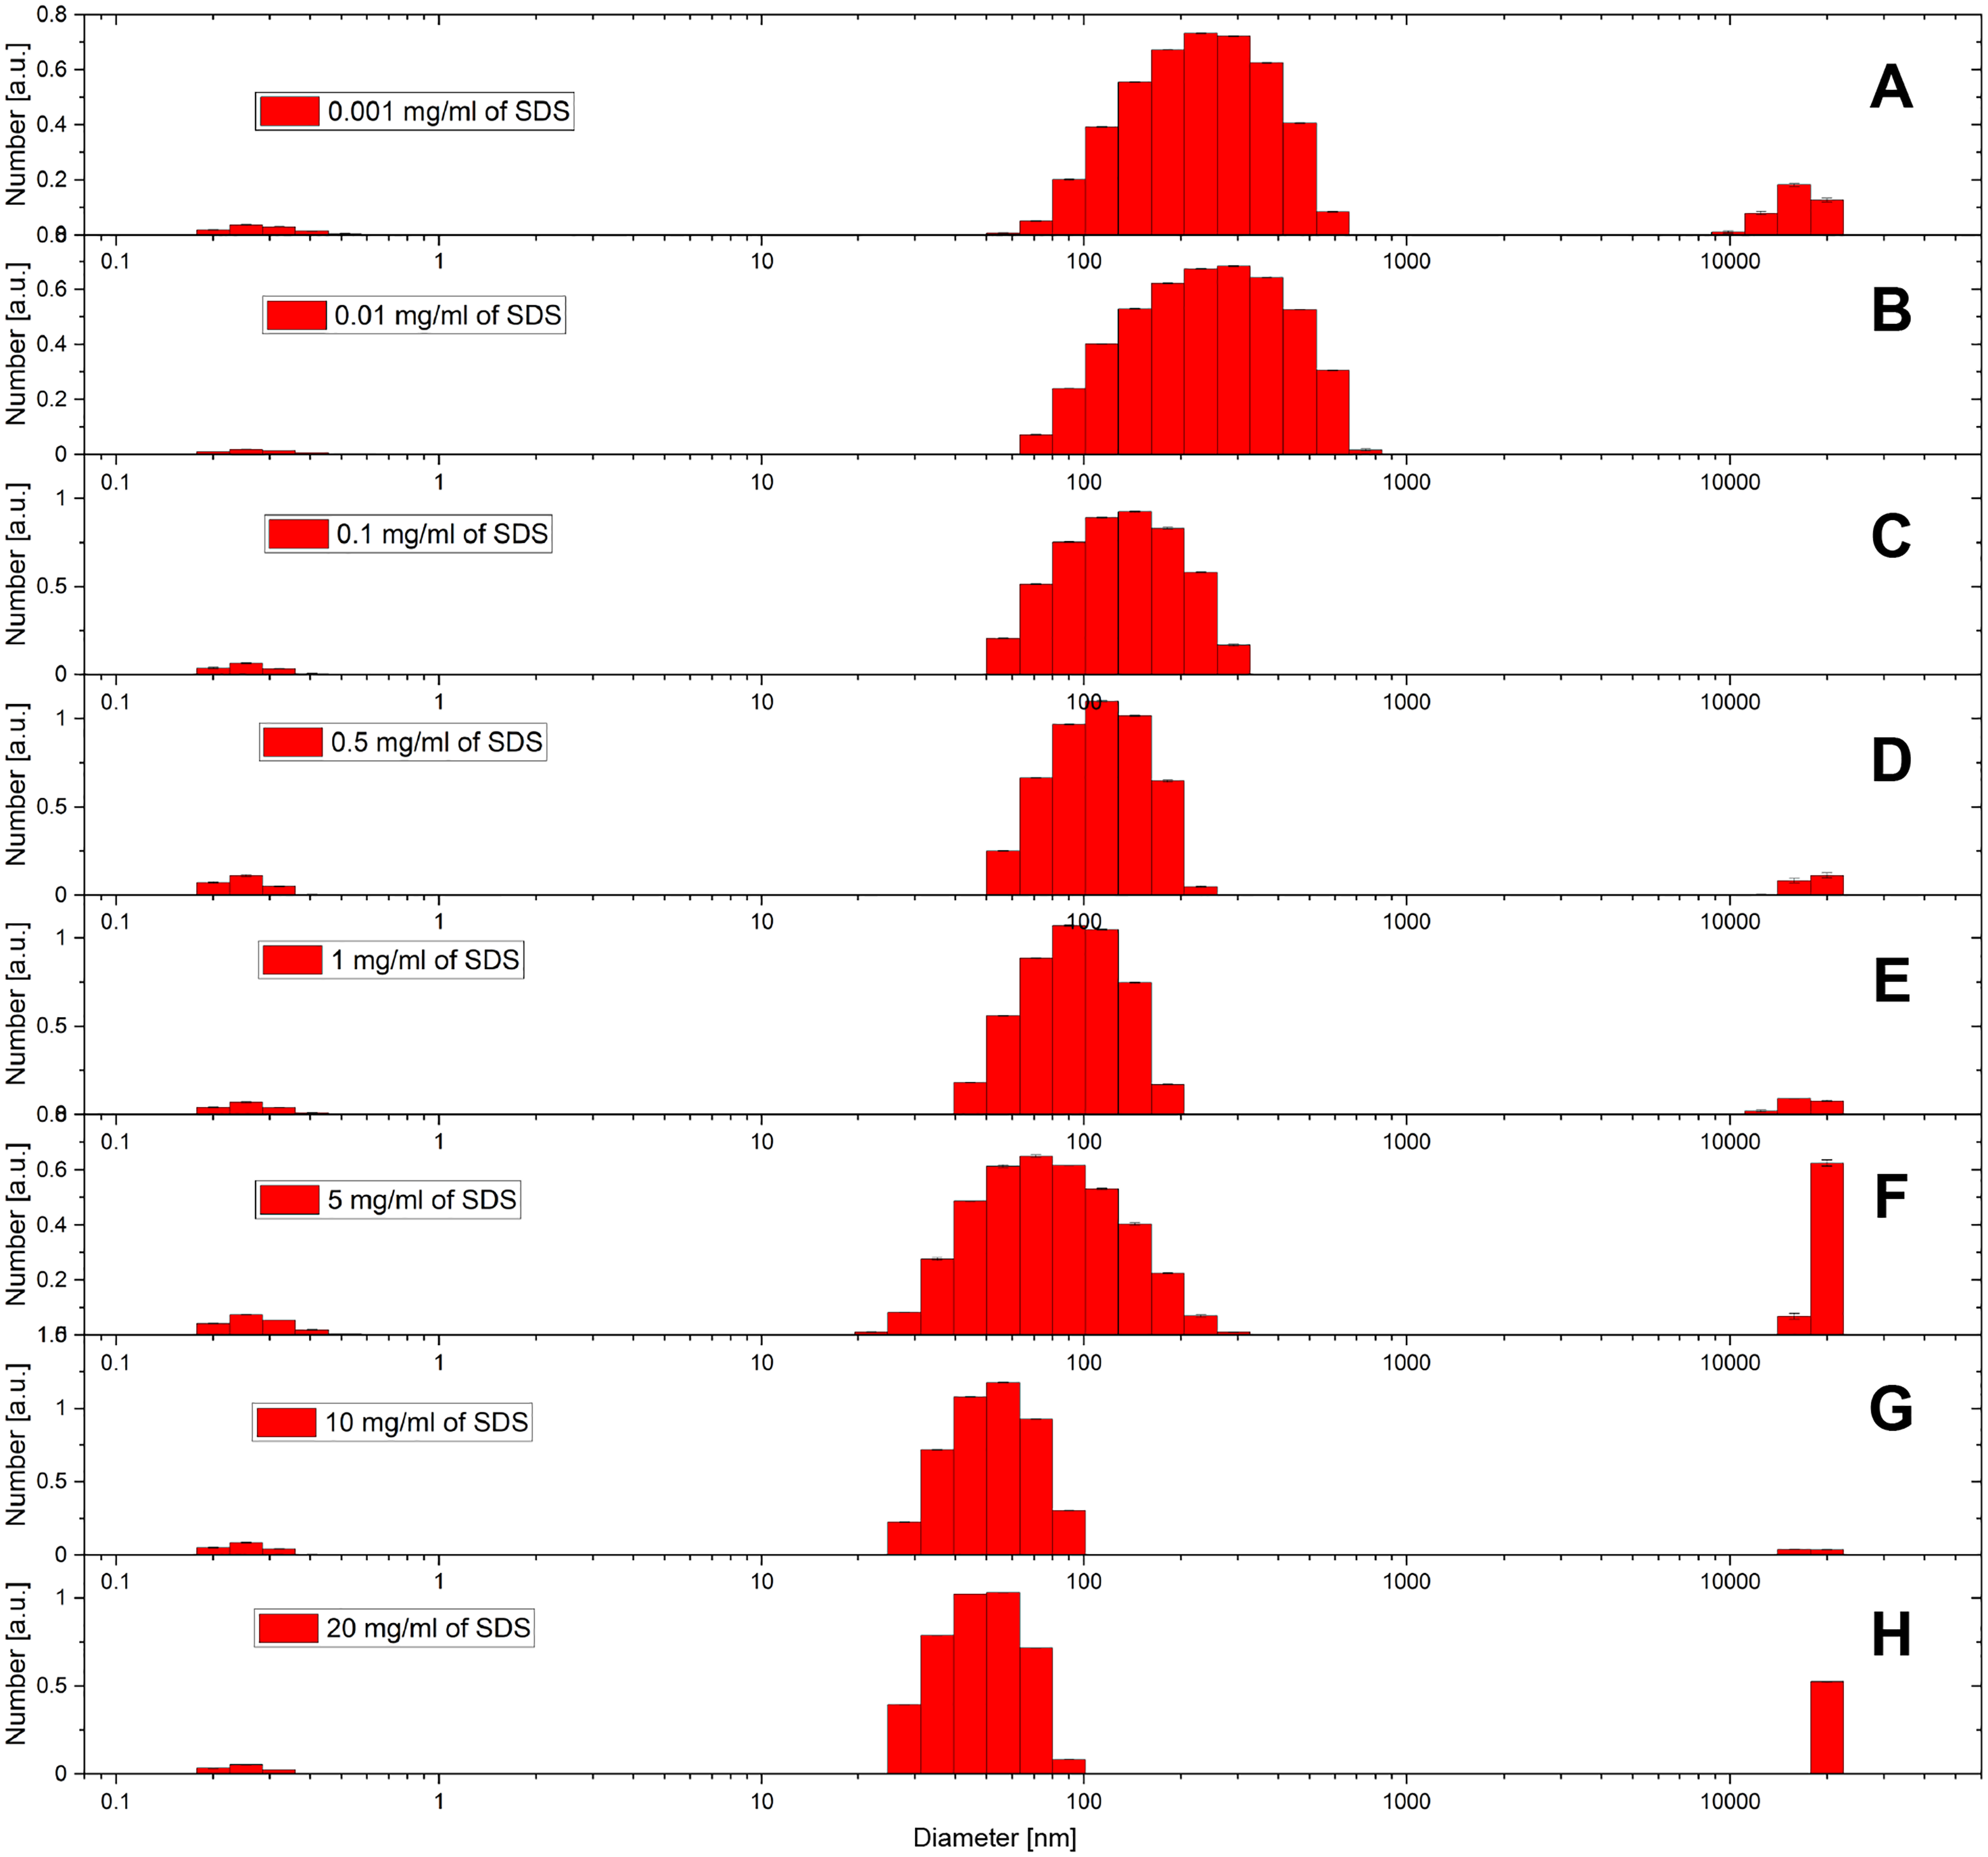
The first explanation is related to surface charge. Figure 2 includes the variations in the DLS results as the SDS concentration is decreased. This change can be caused by the changing of surface charge. As SDS is an ionic compound, a higher SDS level produces particles with more charge without considering the solid core size difference. Particles with higher zeta-potential tend to stay separately with high electrostatic repulsion among each other, while low charged particles have more risk to precipitate, which benefits the larger diameter result from DLS. This would lead to the observed trend in size distribution.
The second, trivial, explanation is that the larger NPs are underrepresented in the SEM images used to generate the size distribution plots. As multiple syntheses, SEM sample preparations, and several images gave rise to the same size distributions, we consider this origin of the difference between SEM and DLS results to be less likely, and assume that the differences between SEM and DLS are due to aggregation.
To verify the obtained size distribution, a third method that probes the ensemble was used. Small angle X-ray scattering (SAXS) data were measured for the batch of standard PS NPs made with SDS, 1 mg/mL. The data was recorded on NPs isolated as a powder. Figure 3 shows the resulting size distribution that shows a mean diameter of d = 21 nm. The size distribution obtained from SAXS analysis is similar to the one obtained from SEM. The SAXS ensemble size distribution is narrower than what is indicated by the size statistics from the SEM images (Fig. 1F), where outliers are readily identified. All SAXS modeling details are included below and in the Supporting Information.

Figure 3: SAXS result of size distribution for standard PS NPs with DMQA.
PS NPs were prepared according to the standard protocol with PS (Mw, 35,000) 1% w/w% in 2 mL toluene and 1 mg/ml of SDS in 14 mL water.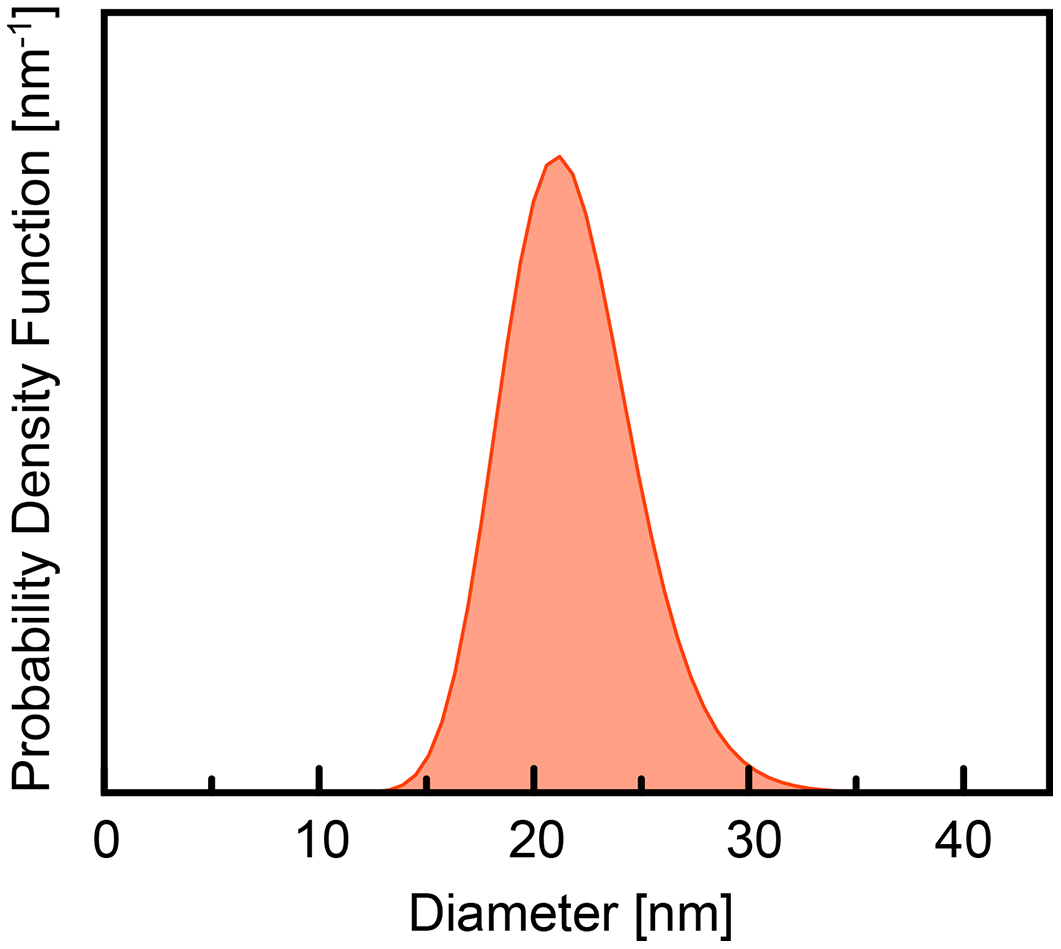
The confirmation of the size distribution by the SAXS experiment, allow us to conclude that SEM can be used as a representative tool to determine size distributions. Further we can conclude that the overall effect of the SDS concentration on the size distributions is small.
To probe the effect of surfactant concentration in detail and to facilitate screening, we adopted an easy and direct way that manually measure the largest and smallest NP observed in the SEM images with ImageJ. Figure 4 shows the largest and smallest particle size for the particle, with different amounts of SDS used in the synthesis. This analysis is more sensitive to changes than the overall size distribution. The data in Fig. 4 shows that the smallest size does not change, it is limited by the resolution of SEM. The largest recorded NP size decreases with the concentration of SDS, but stops changing when the surfactant concentration reached the critical micelle concentration (CMC) of SDS (8.08 mM or 2.33 mg/mL in water, 25 °C) (Fuguet et al., 2005). The inserted photo in Fig. 4 shows that the NP synthesis solution is more transparent and creates more foam when stirred for solution with higher SDS concentration.

Figure 4: Size of largest and smallest observed nanoparticles in SEM images as a function of SDS concentration in mg/mL plotted on semi-log plot.
Samples were prepared according to the standard protocol with 2 mL of the organic phase (PS, Mw, 35,000 1% w/w% in toluene) and 14 mL water phase containing corresponding SDS concentration. Inserted photo is for the PS NPs with PDI at various SDS concentrations in mg/mL. The picture was taken before purification.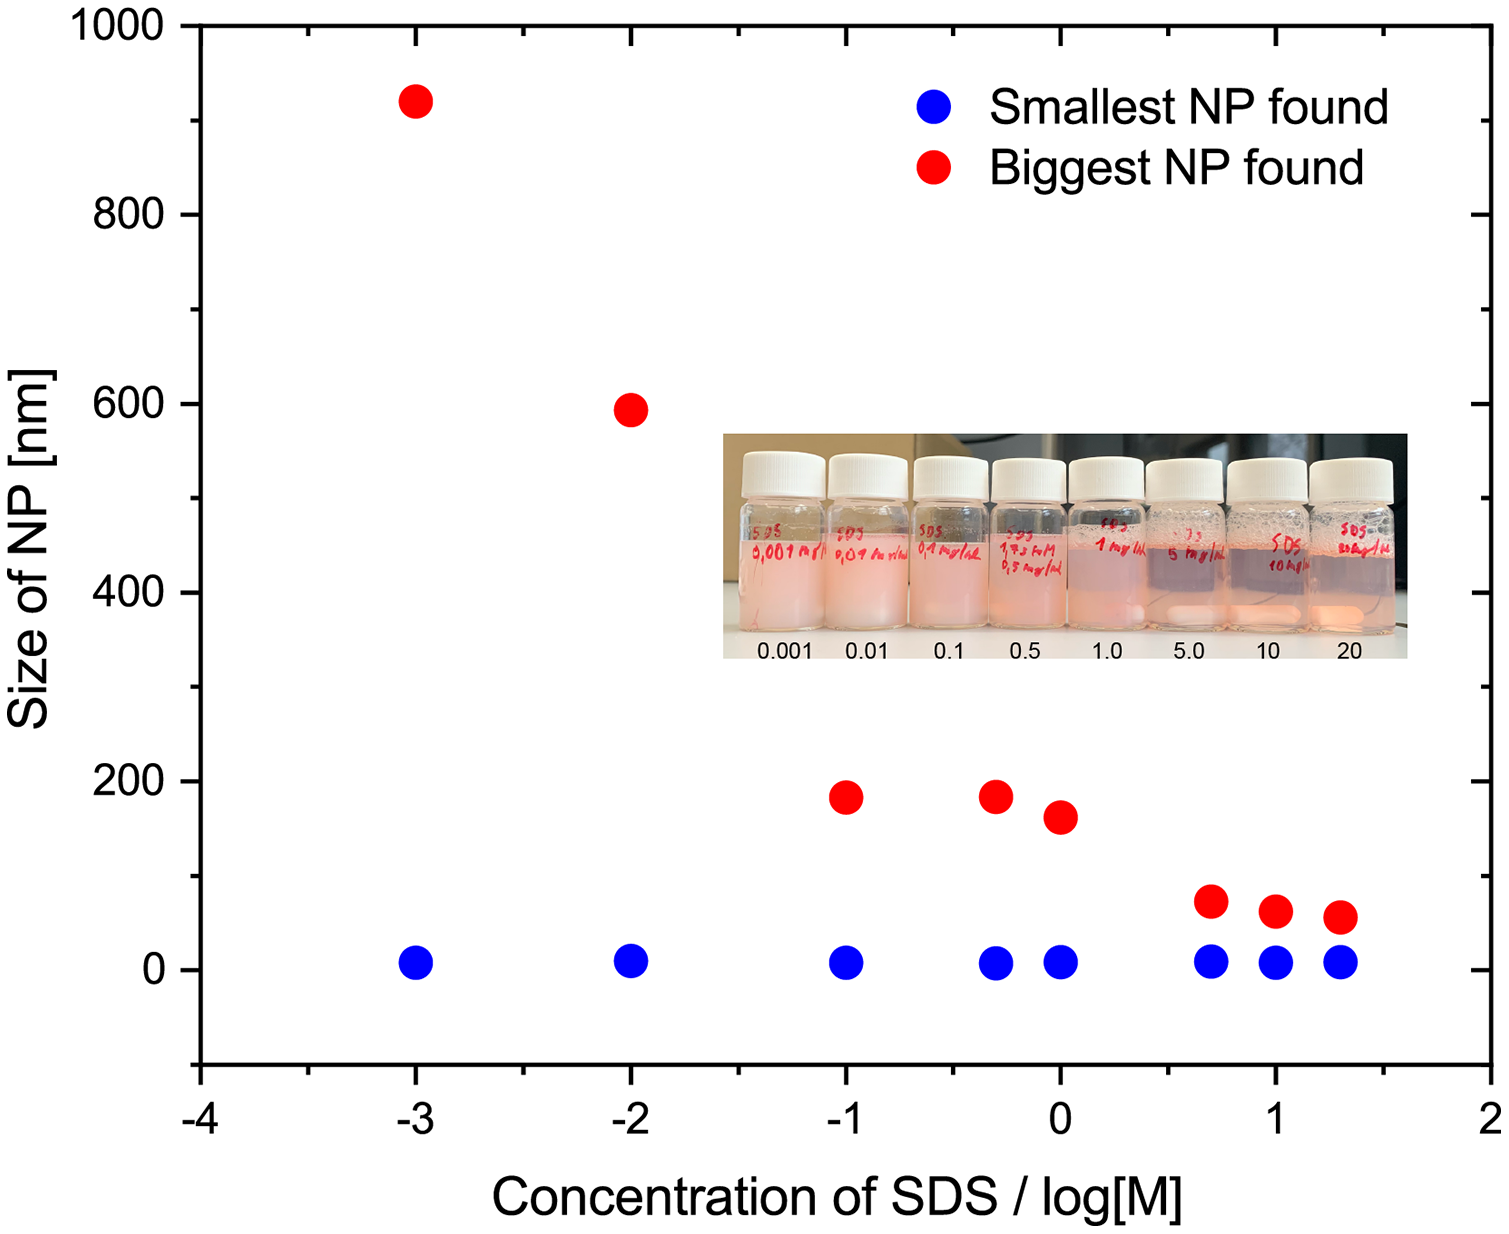
Effect of the relative volume of toluene and concentration of polystyrene
In addition to the surfactant concentration, the amount of the other ingredients should also influence the size distribution. Thus, we prepared the PS NPs by varying the volume of toluene from 1 to 4 mL to the 14 mL of water, and the concentration of polystyrene in the toluene phase. The SDS concentration was kept constant at 0.01 mg/mL in each sample. We evaluated the effect using the largest and the smallest nanoparticles, see above. The data in Fig. 5 shows that larger NPs can be found when the volume of the organic phase is increased, while a higher polystyrene concentration also gives a moderate increase in size. To ensure that it was not an effect related to a system where SDS was used as a surfactant, we also used Triton X-100, where the effects are the same (see Supporting Information for details).

Figure 5: Size of largest and smallest observed nanoparticles in SEM images as a function of various amounts of toluene.
Various amounts of (A) toluene (PS NPs were prepared according to the standard protocol with 1% of PS (Mw, 35,000) in 1, 2 or 4 mL toluene; SDS 0.01 mg/mL in 14 mL of water), and (B) polystyrene (PS NPs were prepared with respectively 0.5%, 1% or 2% of PS (Mw, 35,000) in 2 mL of toluene; SDS, 0.01 mg/ml in 14 mL of water). Respective data was plotted on semilogaritmic axis in inserts.
The amount of toluene was found to significantly change the outcome of the synthesis. A larger amount of toluene allows for a larger amount of polymer to be added. Thus, in the simple picture more toluene leads to bigger droplets with more polymer, which in turn giver bigger NPs. A large fraction of larger particles was found when the volume of toluene was doubled (4 mL), while the appearance of these were reduced with a lower toluene volumes (1 mL). Fewer NPs were created with less toluene, so we conclude that the ratio of 2 mL toluene to 14 mL of water should be maintained.
Effects of surfactant type and polystyrene chain length
Both foaming capacity and CMC value vary between different types of surfactants (Fuguet et al., 2005; Bhattarai, Shrivastav & Adhikari, 2014; Tiller et al., 1984; Gyulai et al., 2016). Surfactants will affect many characteristics of an emulsion including charge of NPs, the interfacial layer thickness, and the permeability (Palanuwech & Coupland, 2003; Mcclements, 2007; Bouchemal et al., 2004). In this work, two ionic (SDS is anionic and CTAB is cationic) and two non-ionic (Triton X-100 and Synperonic F-108) surfactants (see the structures in Scheme S1) were used in the same molar concentration to fabricate four batches of PS NPs following the standard synthesis procedure. The size of the largest and the smallest nanoparticles found with SEM are plotted in Fig. 6A, and the SEM images are shown in the Supporting Information. NPs with SDS and CTAB show narrower size distribution than the NPs with Triton X-100 and Synperonic F-108. Surface charge benefits the stability of the NPs and ionic surfactant leads to smaller NP size while non-ionic NPs have a higher risk to aggregate and turn out to be bigger particles. We must conclude that the type of surfactant is the one parameter probe so far that has a substantial effect on the resulting particle size, as well as the particle properties.

Figure 6: Size of largest and smallest observed nanoparticles in SEM images for samples prepared.
(A) A total of 1.73 mM of different surfactants (correspondingly SDS 0.5 mg/mL, CTAB 0.6 mg/mL, Triton X-100 1.1 mg/mL, Synperonic F-108 25 mg/mL in 14 mL of water; PS (Mw, 35,000) 1%, w/w% in 2 mL of toluene; with the standard protocol). (B) Polystyrenes with Mw respectively 35,000, 280,000, and 350,000 (1%, w/w% PS in 2 mL of toluene; SDS 1.0 mg/mL in 14 mL of water; with the standard protocol). Respective data was plotted on semi-logarithmic axes in smaller graphs inserted.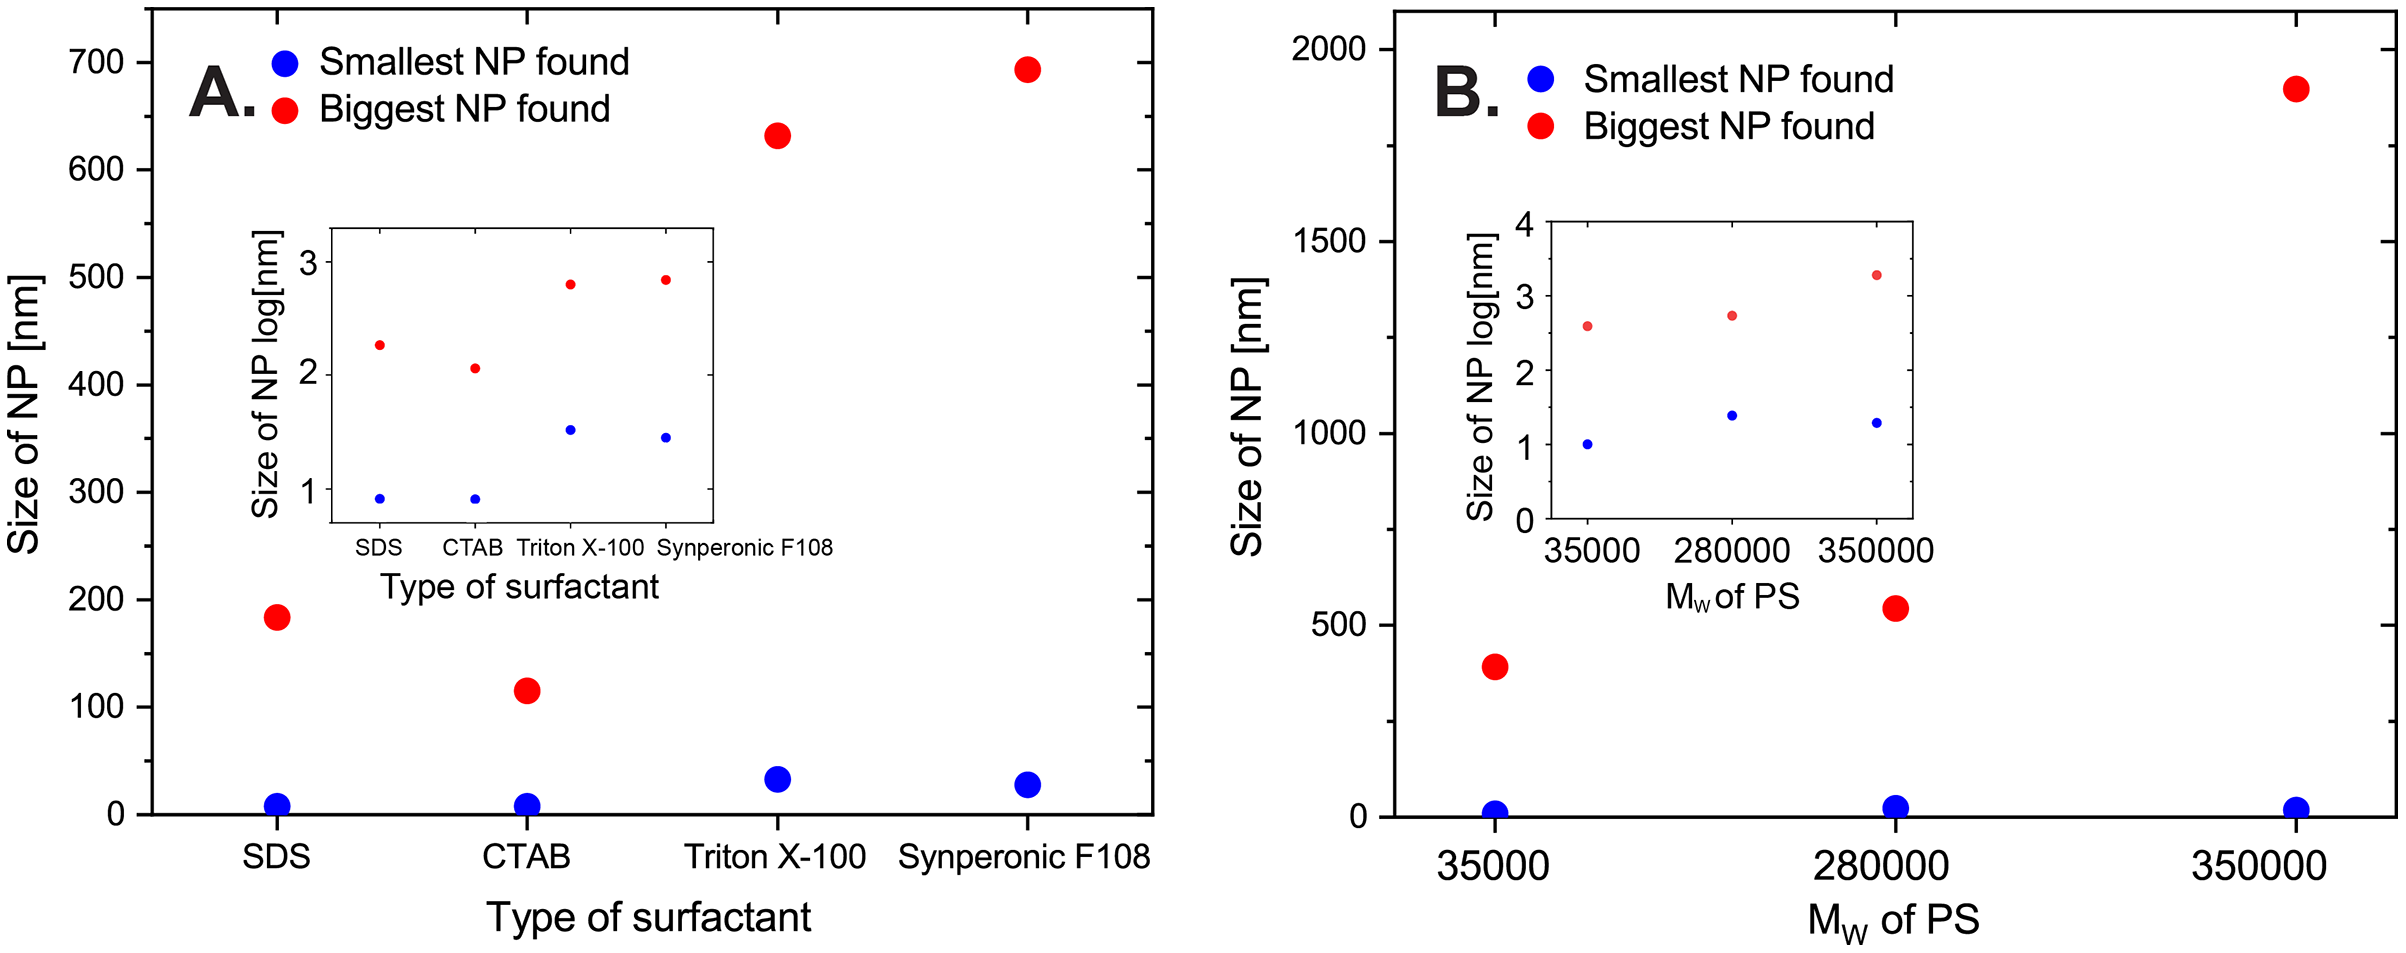
The molecular weight of the polystyrene can vary in several orders of magnitude, so we also considered this as a factor that influences the size distribution. We prepared the PS NPs with the standard method but PS with different molecular weights (Mw, 35,000, 280,000, and 350,000) using the same weight percentage (1%). Figure 6B shows the size of the biggest and the smallest nanoparticles found with SEM (see Supporting Information for details). We could find bigger NP for the sample prepared with a bigger molecular weight. DLS results are coincident with the SEM results showing mean diameters of the three batches of 48, 68, and 74 nm (see Supporting Information for details), and they are not significantly different. Additionally, SAXS data were collected for these three batches. Unfortunately, the SAXS data could not be well modeled because the particles agglomerated into an ordered structure, with repeating distances of 18 and 36 Å (see Supporting Information for details). However, the scattering patterns are similar to those obtained from the less ordered particles (35,000_DMQA in the Supporting Information for details), which means all the type of this PS-vary samples have size distributions that are close to the previous batch (SDS, 1 mg/mL; dye, DMQA). The molecular weight of PS does influence the size distribution, and larger Mw leads to larger particles.
Final procedure optimization and scale-up
We also tried to optimize the standard synthesis procedure by adjusting the number of refinements (sonication cycles) and duration between the refinements. The standard synthesis procedure was followed to prepare six samples where only the conditioning durations between the refinements were adjusted respectively to 15, 30, 45, 60, 75, and 90 min. The smallest and the largest nanoparticles of each sample were observed with SEM. Data in the supporting information shows no obvious difference when we tune the conditioning time between refinements.
Different numbers (1 to 5) of refinement were also tested for effects on the resulting properties of the NPs. Data in the supporting information shows the largest and the smallest nanoparticles observed for the samples prepared with the standard mixture of reagents (2 mL organic phase/14 mL water phase) with different times of refinements. No significant change was found. We did find that fewer than five rounds of sonicating/refinements lead to the unwanted result of residual PS toluene solution in a separate layer on top of the emulsion (see Supporting Information for details). Although SEM results do not indicate a significant difference in microscale, five refinements was considered to be preferable to make full use of the polystyrene solution by ensuring that all of toluene/PS mixture is incorporated in the emulsion.
In order to check the repeatability of this standard synthesis method, we fabricated another three batches of PS NP with respectively three different PS (Mw, 35,000, 280,000, 350,000) using 1 mg/mL SDS as the surfactant. SEM images in (see Supporting Information for details), and SAXS (see Supporting Information for details) show how their size distributions are similar to the previous three batches (PS, Mw, 35,000, 280,000, 350,000) (see Supporting Information for details). Two batches of PS NP were prepared with PS (Mw, 35,000) and respectively CTAB and Triton X-100 as surfactants using the standard method. From SAXS (see Supporting Information for details), we observe how PS NP made from Triton X-100 shows a larger diameter while the one made from CTAB, which has similar size distribution as NPs prepared using the SDS. They are in agreement with the previous result, so our standard synthesis method is also repeatable for other surfactants.
A five-times larger preparation for the PS NP (PS, Mw, 35,000; SDS, 1 mg/mL) was prepared with the standard synthesis method. DLS shows the hydrodynamic radius is 66 nm which is larger than the NPs prepared in the normal scale (~24 nm from see Supporting Information for details). While SEM (see Supporting Information for details) and SAXS (see Supporting Information for details) results proved the size distribution is similar to the batch with normal amount ingredients.
Functionalization of PS NPs with dye loading
We tested the encapsulation of four dyes (PDI, Fig. 4, DMQA, Supporting Information, thioxanthene-9-one, Fig. 7, and celestine blue, Supporting Information) using the standard preparation protocol. Fluorescence spectra show these purified dye-doped PS NPs in water solution are highly fluorescent with spectra similar to the dyes dissolved in organic solvents such as dichloromethane. DMQA doped PS NPs have been characterized and used as a reference dye for the pH optical sensor in our lab (see Supporting Information for detail). Stability was tested by long-term continuous measurement (22 h) and no obvious decay was detected (Bartos et al., 2021) Fig. 7 shows the fluorescence emission and excitation spectra, size distribution, and some SEM images for the thioxanthene-9-one doped PS NPs. Average diameter is 25 nm for these dyes doped NPs and size distribution does not change when the particles are doped with dyes.

Figure 7: Excitation and emission spectra and size distribution counted from SEM images.
(A) Fluorescence excitation and emission spectra (normalized at Ex. 385 nm and Em. 447 nm), (B) size distribution counted from SEM image D (n = 397, bin size 10 nm) and (C–E) SEM images for PS NPs loaded with Thioxantene-9-one. The blurred edge of NPs in image E is due to the resolution of the SEM technique.
While characterizing the photophysics of these fluorescent NPs is outside the scope of this work, the result allows us to conclude the following:
As the dyes are quenched by water, they must be distributed across the nanoparticle
As the dyes remain in the nanoparticles past weeks of dialysis, we can conclude that leaching is insignificant.
Both critical points when optimizing dye-doped versions these PS NPs as components for specific fluorescent devices (Bartos et al., 2021).
For the applications of these nanoparticles as components in functional materials, the fact that our characterisation is on materials that has undergone dialysis for days, if not weeks, is important. It shows that the PS NPs are unchanged and can be used in a window of days past production, which is more than adequate for any further processing. The final stability of the PS NPs in the device will depend exclusively on the device fabrication and architecture. The one device we have reported so far is cured at a temperature, where the integrity of the NPs are compromised, but the nanosegregation and compartmentalization these fluorescent components offer are intact in the final device (Bartos et al., 2021).
Discussion
We have prepared more than 20 batches of pure and dye doped polystyrene nanoparticles. In addition to these preparations, where parameters were varied, three individual researchers have independently prepared batches of dye doped PS NP using our standard procedure. All three obtained comparable results.
The knowledge gleaned from the collected experience is shown in Table 1. The ratio of the ingredients affects the size distribution, but the critical aspect is not the specific values used—volumes do not have to be measured to the third significant digit—but the nature of the chosen ingredients. The most prominent factors are the amount of polystyrene used, the nature of the surfactant, and the amount of toluene. Specifically, more PS, toluene or both lead to larger NPs and to wider size distribution.
| Name of a variable | Magnitude of the effect | Size of PS NPs | Notes | |
|---|---|---|---|---|
| Increase | Decrease | |||
| Increasing surfactant concentration | medium | √ | – | |
| Increasing volume of toluene | strong | √ | Should be kept constant | |
| Increasing concentration of PS | medium | √ | – | |
| Type of surfactant | strong | – | – | Surfactant dependent |
| Increasing of PS molecular weight | medium | √ | ||
| Increasing number of refinements | low | – | – | No apparent effect observed |
| Increasing time between refinements | low | – | – | No apparent effect observed |
| Addition of dye | low | – | – | No apparent effect observed |
The surfactant type could dramatically influence the size distribution, and higher concentrations of surfactant leads to smaller NPs and narrower size distributions to a certain point. Meanwhile the influence of the PS molecule weight can be ignored.
The procedure itself, such as the duration between refinements and times of sonication cycles, do not affect the largest or smallest size of NP. However, to make full use of the ingredients, 1-h duration between refinements and five cycles of sonication are preferred.
Finally, we saw no effect of adding dyes to the PS NPs.
Conclusions
We proposed a simple fabrication method for making dye doped polystyrene nanoparticles with a physical diameter of 20–25 nm in a reproducible manner. Four different dyes were successfully doped into polystyrene nanoparticles, and three different scientists have repeatedly prepared nanoparticles with similar properties and size distributions. Thus, we conclude that we have developed and mapped a robust procedure for preparing dye doped polystyrene nanoparticles, which can be applied in many areas including optical sensors, cell tracking, and optical microscopy.
Supplemental Information
Supporting information.
Additional data, molecular structures, raw data and fits from SAXS, additional SEM images, and optical spectra