
Molecular insights into the binding of carnosine and anserine to human serum carnosinase 1 (CN1)
- Published
- Accepted
- Received
- Academic Editor
- Haibo Yu
- Subject Areas
- Theoretical and Computational Chemistry
- Keywords
- Carnosine, Anserine, Carnosinase 1, MD simulation
- Copyright
- © 2022 Toviwek et al.
- Licence
- This is an open access article distributed under the terms of the Creative Commons Attribution License, which permits unrestricted use, distribution, reproduction and adaptation in any medium and for any purpose provided that it is properly attributed. For attribution, the original author(s), title, publication source (PeerJ Physical Chemistry) and either DOI or URL of the article must be cited.
- Cite this article
- 2022. Molecular insights into the binding of carnosine and anserine to human serum carnosinase 1 (CN1) PeerJ Physical Chemistry 4:e25 https://doi.org/10.7717/peerj-pchem.25
Abstract
Carnosine (CAR) and anserine (ANS) are histidine-containing dipeptides that show the therapeutic properties and protective abilities against diabetes and cognitive deficit. Both dipeptides are rich in meat products and have been used as a supplement. However, in humans, both compounds have a short half-life due to the rapid degradation by dizinc carnosinase 1 (CN1) which is a hurdle for its therapeutic application. To date, a comparative study of carnosine- and anserine-CN1 complexes is limited. Thus, in this work, molecular dynamics (MD) simulations were performed to explore the binding of carnosine and anserine to CN1. CN1 comprises 2 chains (Chains A and B). Both monomers are found to work independently and alternatingly. The displacement of Zn2+ pair is found to disrupt the substrate binding. CN1 employs residues from the neighbour chain (H235, T335, and T337) to form the active site. This highlights the importance of a dimer for enzymatic activity. Anserine is more resistant to CN 1 than carnosine because of its bulky and dehydrated imidazole moiety. Although both dipeptides can direct the peptide oxygen to the active Zn2+ which can facilitate the catalytic reaction, the bulky methylated imidazole on anserine promotes various poses that can retard the hydrolytic activity in contrast to carnosine. Anserine is likely to be the temporary competitive inhibitor by retarding the carnosine catabolism.
Introduction
Carnosine (β-alanyl-L-histidine: CAR) and its methylated analog, anserine (β-alanyl-3-methyl-histidine: ANS), are archetypes of a family of histidine-containing dipeptides that are abundant in animal tissue (Gil-Agusti, Esteve-Romero & Carda-Broch, 2008; Mora, Sentandreu & Toldra, 2008; Pavlin et al., 2016). In particular, ANS is present in birds and certain fish (e.g., salmon, tuna, and trout) (Boldyrev, Aldini & Derave, 2013; Derave, De Courten & Baba, 2019). Both compounds play an important role in muscular function, homeostasis, antioxidant defense, therapeutic interventions (Boldyrev, Aldini & Derave, 2013; Derave, De Courten & Baba, 2019; Wu, 2020), and protective ability against diabetes (Pavlin et al., 2016), Alzheimer’s and Parkinson’s diseases (Basun et al., 1991; Davies et al., 2014; Hipkiss, 2009). With their potential biological activities, there is a growing interest to explore their fundamental properties. CAR and ANS are absent in plant, but rich in meat. Beef is the high source of carnosine (Chan, De Cker & Means, 1993; Mori et al., 2015), while anserine is abundant in chicken muscle, especially black-boned chicken (Khumpeerawat, Duangjinda & Phasuk, 2021; Tian et al., 2007). Both CAR and ANS are also used as an athlete supplement for many years (Oppermann et al., 2021; Saunders et al., 2017). However, both CAR and ANS are rapidly hydrolysed by carnosinase (CN) enzymes (Aldini et al., 2011; Everaert et al., 2012; Gilardoni et al., 2020; Peters et al., 2011). The faster CAR degradation by serum carnosinase was reported(Peters et al., 2011; Yeum et al., 2010). In addition, the anserine ingestion was reported to significantly reduce the carnosine degradation implying the ability of anserine to inhibit carnosinase activity (Pegova, Abe & Boldyrev, 2000; Wu, 2020; Yeum et al., 2010). Previously, the ability of erythrocytes and co-administration of CAR and CN1 inhibitor to prevent CAR catabolism were studied (Gilardoni et al., 2020). Although a wide range of CAR derivatives has been studied (Bellia, Vecchio & Rizzarelli, 2014; Gilardoni et al., 2020; Pavlin et al., 2016), an in-depth microscopic detail remains limited, especially for ANS. Thus, the understanding of how CN1 binds CAR and ANS becomes important for developing new strategies for CAR and ANS preservation.
Human carnosinases (CNs) are dipeptidases belonging to the metallopeptidase M20 family. They cleave histidine-containing dipeptides such as carnosine (CAR) and anserine (ANS) to β-alanine and histidine. CNs play diverse roles in protein maturation, tissue repair, and cell-cycle control (Chen et al., 2008). The CN concentration was found to be correlated with diabetes and neurological disorders (Bellia, Vecchio & Rizzarelli, 2014). Two isoforms of human carnosinases (Carnosinase 1 (CN1) found in serum and Carnosinase 2 (CN2) in tissue) were identified (Teufel et al., 2003) with 54% sequence identity. CN1 and CN2 are classified as a metal-ion-activated aminopeptidase where their activators are Zn2+ and Mn2+, respectively (Unno et al., 2008). Both CNs exist as homodimers (chains A and B) (Boldyrev, Aldini & Derave, 2013). Each chain consists of two domains which are the dimerization and catalytic domains with two Zn2+ ions at the active center (Fig. 1A). Each chain has the latching loop (residues 328-341: L2) that holds two monomers together (a green loop in Fig. 1A). Both chains can accommodate a ligand (Unno et al., 2008). Homodimeric CN1 was found to be the main contributor for metabolising CAR and ANS (Baguet et al., 2014; Everaert et al., 2012; Teufel et al., 2003; Unno et al., 2008) (Fig. 1B). In rat, CN1 shows higher activity for CAR than ANS and homocarnosine (hydrolysis rates for carnosine, anserine, and homocarnosine are 31.6, 8.16, and 0.05 µmole/g tissue/h, respectively) (Gilardoni et al., 2020; Pegova, Abe & Boldyrev, 2000; Peters et al., 2011). Although many studies have been devoted to the physiological role, biological properties, and their structural action, the insight into CAR-degrading CN1 and the Michaelis complex formation remain limited to date. Even though the binding of carnosine and homocarnosine to CN1 was computationally studied (Pavlin et al., 2016; Peters et al., 2017), the data on the binding of ANS is limited to date. Therefore, in this work, the binding mechanism of ANS is studied in comparison to CAR via Molecular Dynamics (MD) simulations. MD simulations have been widely used to explore the structural and functional properties of biomolecules including CN1 (Baicharoen, Vijayan & Pongprayoon, 2018; Pavlin et al., 2016; Peters et al., 2017; Vistoli et al., 2006). The key interaction networks used to stabilise both substrates are extracted. Why CN1 prefers CAR to ANS is also revealed here. The microscopic understanding obtained here will be useful for designing new strategies to elongate a half-life of both bioactive compounds after ingestion.

Figure 1: CN1 structure.
(A) Structure of Zn2+-containing carnosinase 1 (CN1) homodimer. Bound carnosine and anserine with two Zn2+ ions in the binding site are shown in the insets. The catalytic and dimerization domains are displayed on the right. The latching loops (L2) are labelled in green (residues 324–341). Chemical structures of carnosine (CAR) and anserine (ANS) are shown in (B).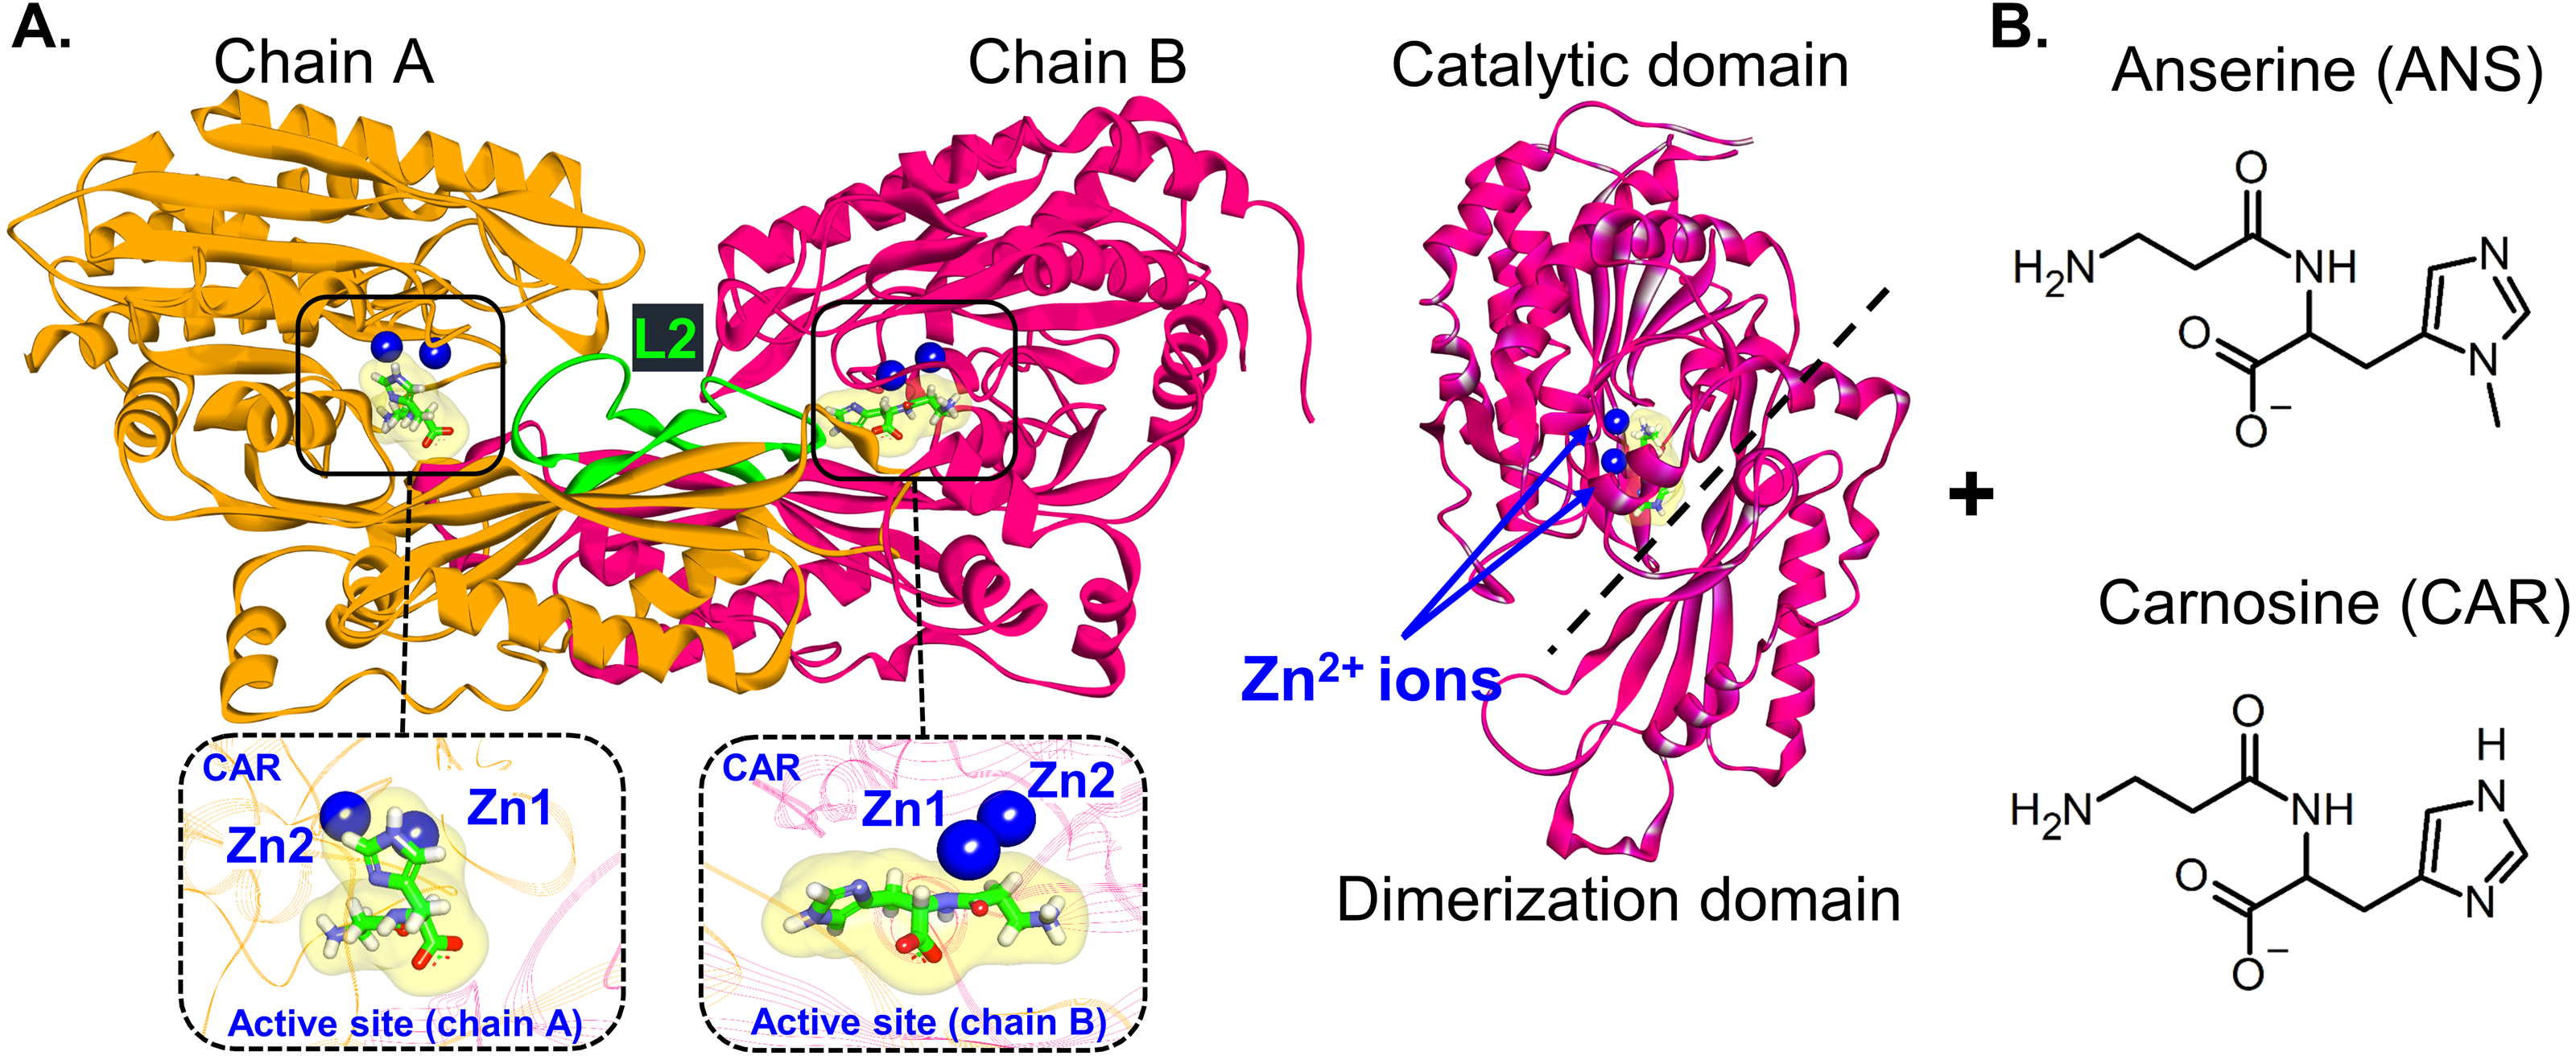
Materials & Methods
Preparation of protein-ligand complexes
The crystal structure of CN1 homodimer was downloaded from the RCSB protein databank (PDB ID: 3DLJ; resolution of 2.26 Å). Missing residues were modelled using Modeller 10.0 (Martí-Renom et al., 2000; Sali & Blundell, 1993; Webb & Sali, 2016). Two Zn2+ ions were kept in each binding site. The protonation states of most charged residues were set at physiological pH. In a previous quantum work (Pavlin et al., 2016), a hydroxide ion was used as one of metal-bridging molecules where E173 was set uncharged due to its proton-accepting role. On the contrary, in this work, E173 was set deprotonated because the role of water in bridging metal centre is investigated here. In case of histidines, their protonation states were assigned based on pKa calculation using Propka 3.1 (Olsson et al., 2011; Søndergaard et al., 2011). Histidine residues were defined as HID except for His235 and His367 which were defined as HIE. Carnosine (CAR) and anserine (ANS) structures were built by Discovery studio visualizer. All ligand topologies were generated using ACPYPE with AMBER forcefield (Sousa da Silva & Vranken, 2012). The partial atomic charge of ligands was calculated by the restrained electrostatic potential (RESP) charge using the Hartree–Fock calculation with a 6-31G(d) basis set. (Bayly et al., 1993). The AMBER99SB forcefield was used for the Zn2+ topology. The initial orientations of CAR and ANS inside CN1 were obtained by the superimposition of CN1 and each dipeptide onto bestatin-bound carnosinase 2 crystal structure (PDB code: 4RUH). Molecular docking was then performed by GOLD5.1 software (Jones et al., 1997; Verdonk et al., 2003) using flexible ligand docking with default setting. Residues within a distance of 10 Å from a ligand were defined as the binding site. No water is included in this docking step. For each system, a complex with highest Gold-score was used for MD simulations (Table S1 and Fig. S1). Then, each complex was placed in a cubic simulation box solvated with TIP3P water and counter ions. 0.15 M NaCl was set in each system.
Molecular dynamics simulations
GROMACS 2020 package (http://www.gromacs.org/) (Lindahl, Hess & Van der Spoel, 2001) with AMBER99SB forcefield (Hornak et al., 2006) was used. The 1000-step energy minimizations using steepest descent algorithm were applied to remove bad contacts. Particle mesh Ewald (PME) method (Darden, York & Pedersen, 1993) was used for long-range electrostatic treatment (a short range cutoff of 1 nm, a Fourier spacing of 0.12 nm, and fourth-order spline interpolation). The constant number of particles, pressure, and temperature (NPT) ensemble was used in all simulations. CN1, substrates, solvent and ions were coupled separately using the v-rescale thermostat (Bussi, Donadio & Parrinello, 2007) at 300 K with a coupling constant τt = 0.1 ps. The Parrinello-Rahman barostat at 1 bar with a coupling constant τp = 1 ps was used for pressure coupling. The 2-fs time step for integration was employed. Coordinates were saved every 2 ps for subsequent analysis. For each system, the 500-ps equilibration was performed and followed by the 500-ns production run. Each system was duplicated twice (the suffixes of “1 and 2” are used to refer to simulation 1 and simulation 2). CAR and ANS stand for carnosine-bound and anserine-bound complexes. The ending of “A” and “B” refer to chains A and B, respectively.
All results provided here are the average values between repeats. The data were analysed by GROMACS and in-house codes. Visual Molecular Dynamics (VMD) (Humphrey, Dalke & Schulten, 1996) was performed for protein visualisation. The initial structure from each production run was used as a reference for C-alpha RMSD and RMSF calculation. Principal Component Analysis (PCA) was computed by “gmx covar” and “gmx anaeig” options in GROMACS. Only the first eigenvector was utilised for the major protein motion analysis. The default hydrogen-donor–acceptor cutoff angle (30°) and the cutoff radius (X-acceptor of 0.35 nm) were used. The binding free energies of protein-ligand complex was computed by Poisson–Boltzmann surface area (MM/PBSA) using “gmx mmpbsa”.
Results and Discussion
At the beginning, the structural drift and fluctuation of ligand-bound CN1 complexes are measured via the root mean-square deviations (RMSDs) and fluctuations (RMSFs) of all C-alpha atoms (Fig. 2). The initial structure at time = 0 ns was used as a reference for RMSD and RMSF calculation. It appears that both complexes are stable after 250 ns with RMSDs of ∼3.5 Å (Fig. 2A). Each unit in both ANS and CAR shows comparable degrees of C-alpha flexibility; however, ANS gives slightly different RMSDs between chains (Fig. 2A). It is noticeable that the origin of protein fluctuation in CAR and ANS is from the mobility of residues 69–88, 111–134, and 272–287, respectively (Figs. 2B and 2C). The β-hairpin region (residues 69-88) (red region in Fig. 2C) has the most prominent motion. This event was also observed in a previous work (Pavlin et al., 2016). Such mobility may be due to their locations at a protein surface.
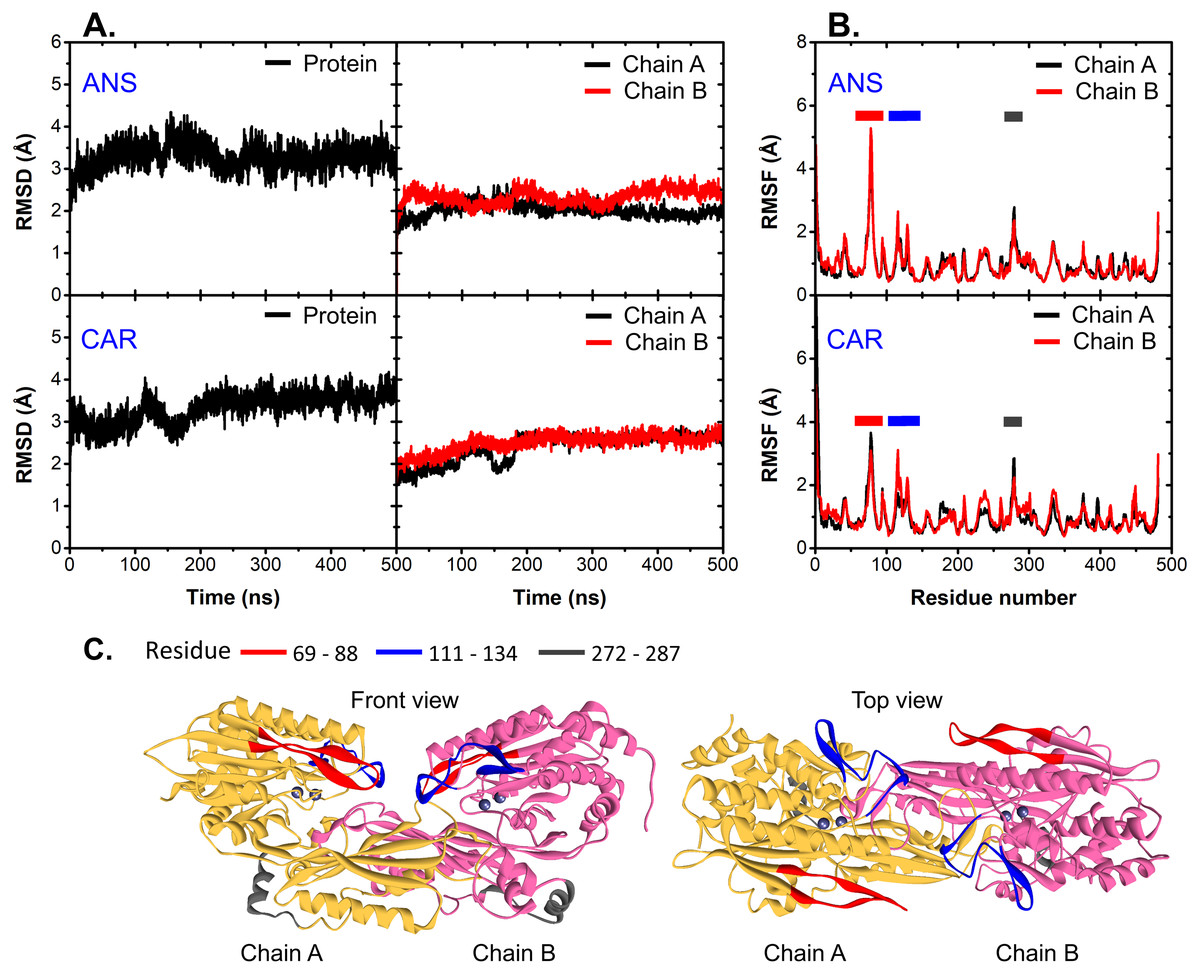
Figure 2: RMSD and RMSF.
(A) C-alpha RMSDs of the whole protein (left) and each chain (right). (B) is the C-alpha RMSFs of all systems where the highly fluctuated regions are shown as cartoon representatives in (C).
To capture the main protein dynamics, Principal Component Analysis (PCA) was computed on the C-alpha atoms. Only the motion obtained from the first principal component 1 (PC1) is considered here, because it accounts for the major motion (Fig. S2). In Fig. 3A, there are three main regions dominating the protein dynamics (residues 69-88, 111-134 and 272-287) where the highest mobile region is the peripheral β-hairpin loop region (residues 69–88: L1 (a red loop in Fig. 3C)). These are in a good agreement with RMSF data. For each system, L1 in one subunit can swing back and forth, while the other is kept frozen (Fig. S3). The distance between C-alpha atoms of the tips of L1 (D78) and L2 (P333) was measured to observe the L1 dynamics (Figs. 3B and 3C). In Fig. 3, one of L1 in a dimer is kept close to the tip of L2 (CAR1B, CAR2A, ANS1A, and ANS2A), while the other (CAR1A, CAR2B, ANS1B, and ANS2B) is mobile (Figs. 3B and 3C). This scenario demonstrates the desynchronization of both L1 motions. The effect of L1 motion on ligand-binding activity is discussed later in the text.
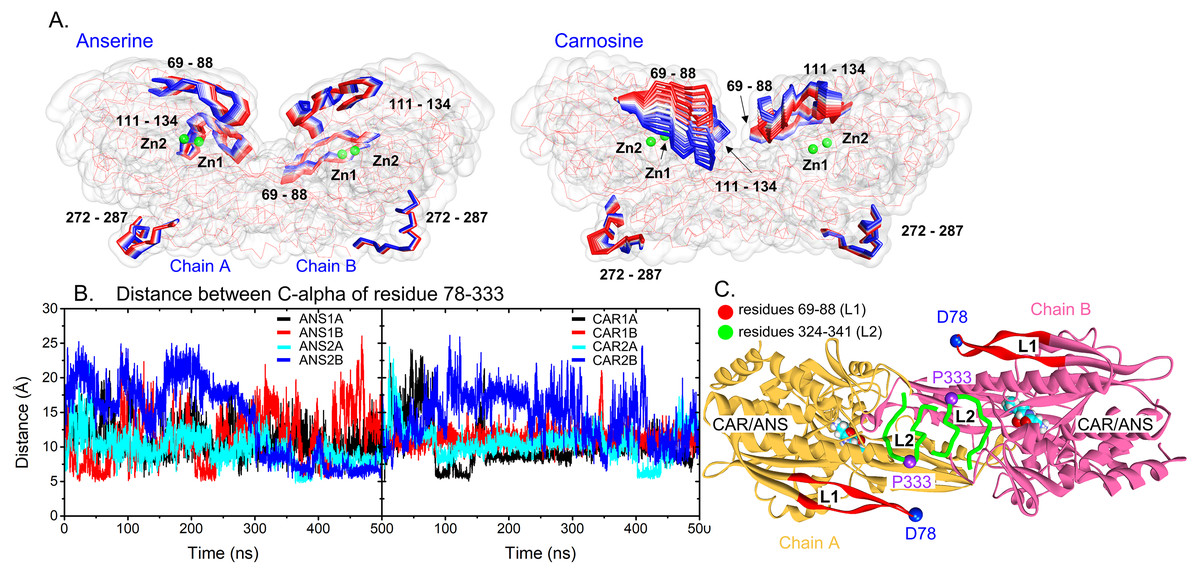
Figure 3: Protein dynamics.
(A) Cartoon views of the time-dependent motions of anserine- and carnosine-bound CN1 calculated from the first principal component analysis. Only highly flexible regions with labels are shown in the RWB format where the displacements for t = 0 to t = 500 ns change from red to blue. Two Zn2+ ions are also shown in green beads. (B) Distances between the C-alpha atoms of D78 and P333 in all systems (left: ANS and right: CAR). The locations of these two residues are shown in (C). The L1 and L2 loops are labelled in red and green. The ligands are displayed in Vdw format.
Considering the ligand-binding environment, ANS and CAR form a comparable degree of interactions with CN1 (∼4–6 hydrogen bonds), where ANS shows a slightly higher number of hydrogen bonds with CN1 (Table 1). The solvent accessible area (SASA) is also computed in Table 1. The size of binding cavities in CAR1 and CAR2 are preserved (24.05–24.87 nm2), whereas, in ANS1 and ANS2, bound ANS molecules induce more diverse cavity sizes (Table 1). The non-preserved substrate-binding cavities of ANS thus result in various water and protein contacts. Approximately, each ANS forms ∼2 contacts with water and ∼4–6 contacts with CN1, while CAR shows more water exposure (∼4 water contacts) with similar number of CN1 interactions (∼4–5 interactions) (Table 1). Specific water bridging Zn2+ inside the active site were reported to mediate the catalysis (Pavlin et al., 2016). Thus, more water accessibility of CAR may enhance more chances for bridging water-Zn2+ complex formation which can facilitate the enzymatic activity. These different degrees of wettability can reflect the importance of substrate-CN1 conformation and interactions on the catalytic activity. Further details will be discussed later in the text.
| System | Number of Hydrogen bonds | Solvent accessible area (nm3) | ||||
|---|---|---|---|---|---|---|
| With water | With protein | |||||
| Chain A | Chain B | Chain A | Chain B | Chain A | Chain B | |
| ANS1 | 2.58 ± 1.26 | 2.30 ± 1.17 | 5.42 ± 1.10 | 5.93 ± 1.11 | 24.96 ± 0.54 | 26.58 ± 0.91 |
| ANS2 | 1.75 ± 0.92 | 2.20 ± 1.14 | 3.91 ± 0.98 | 4.77 ± 1.17 | 25.13 ± 0.64 | 23.75 ± 0.40 |
| CAR1 | 4.05 ± 1.11 | 3.59 ± 1.06 | 3.97 ± 1.26 | 3.77 ± 2.03 | 24.05 ± 0.68 | 24.31 ± 0.41 |
| CAR2 | 4.44 ± 1.84 | 3.58 ± 1.18 | 4.76 ± 0.88 | 4.50 ± 1.03 | 24.87 ± 0.71 | 24.32 ± 0.49 |
Furthermore, the ligand-CN1 hydrogen bond analysis is investigated (Figs. 4 and 5). Overall, both CAR and ANS point their amine terminus towards the Zn2+ site and direct the imidazole moiety to the opposite end (Fig. 4B). In chain A, the amine ends of both ANS and CAR are anchored by D202 in an assistance with E173, E174, E451, while, in chain B, only D202 is used to trap the amine end (Figs. 4 and 5). At the opposite end, the imidazole ring of ANS is anchored by N220, while not only N220, but also T335 from the adjacent subunit (T335B) are employed to trap a CAR imidazole group (Figs. 4–5). Another residue, T337, on L2 from the neighbour (T337B) can sometime interact with a imidazole ring of both substrates in chain A. The involvement of residues from the adjacent monomer (T335 and T337) in the active site architecture emphasizes the importance of being dimer for effective catalysis. Besides, this result can explain why the substrate-monomeric CN1 complex is less favourable for hydrolysis as reported in previous studies (Pavlin et al., 2016; Peters et al., 2010b). Moreover, the backbone of both ligands (carboxylate and amide groups) is stabilised by interactions with R350 and T424 (Figs. 4 and 5). It is interesting that the carbonyl oxygens (O3) of CAR and ANS align differently between chains. O3 in chain A flips down and form an interaction with H235B (H235 from chain B), while that of chain B is oriented towards Zn2+ (Zn1) (Figs. 1, 4 and 5). This O3 shift is generally found in dizinc peptidases (Bellia, Vecchio & Rizzarelli, 2014; Gilardoni et al., 2020; Lindner et al., 2003). These scenarios can be confirmed by a short Zn1-O3 distance of ∼2 Å in chain B (this distance is in a range of the Zn-O bond length reported in previous metalloprotein studies (Patel, Kumar & Durani, 2007; Peters et al., 2010a; Zhu & Pan, 2005) and long Zn1-O3 distance (>6 Å in chain A (Fig. 6A)). In addition, the flip of O3 to H235B can be determined by the close O3-H235B distance in Fig. S4. Only H235B-O3 interaction was reported in a previous simulation work (Pavlin et al., 2016), but longer simulations here display that O3 can point to either the Zn2+ site or H235B. These two O3 conformations may be affected by the diverse Zn2+-coordinating environments in each chain. For the Zn2+ site, two Zn2+ are bridged by D139 and E173 (Figs. 4B, 5B, and Fig. S5). Not only bridging the cations, but E173 also interact with a substrate in chain A. Each Zn2+ is water-accessible where Zn2+ ions in chain A show more water accessibility (Fig. S6). Mostly, Zn2+ is tetracoordinated, but a presence of substrate also induces Zn2+-pentacoordinating and octacoordinating structures (Fig. S7). Such pentahedral and octahedral coordination can also occur in other Zn2+ metalloproteins (Ataie et al., 2008; Li, Hayik & Merz Jr, 2010). Amino acids (Asp, Glu, and His), substrates, and water are observed to be involved in the divalent Zn2+-chelating structure (Figs. 4 and 5, and Fig. S7). Zn1 is mainly coordinated by the carboxylate oxygens of D139, E173, and E174, whereas Zn2 is surrounded by the carboxylate oxygens of D139, E173, and D202 (Figs. 4B and 5B). The additional interactions with H106 (Zn2), D108 (Zn1), E451 (Zn2), H452 (Zn1), and water molecules are also captured. Both subunits share similar Zn2+-chelating interaction network, but Zn1 in chain B can interact with a substrate via Zn-O3 ion pairs which is absent in chain A (Fig. 6A and Fig. S7). The Zn1-O3 interaction in chain B drags the Zn2+ ion pair towards the active site which can facilitate the catalysis (Fig. 6A). The Zn1-Zn2 alignment in both chains are different. The Zn1-Zn2 pair in chain A lays nearly perpendicular to the ligand backbone, while, in chain B, the dizinc pair is aligned parallelly (Fig. 6B). The upright pose of Zn1-Zn2 in chain A is due to the interactions with D108, E451, and H452, respectively (Figs. 4, 5 and 6B). In particular, D108 can strongly drag Zn1 upwards resulting in the standing pose of a dizinc pair in chain A (Fig. 6B). The loss of Zn1-O3 contact causing by the upright pose of dizinc allows the free O3 to flip down and form an interaction with H235B instead. Furthermore, the Zn1-Zn2 displacement in chain A does not only break down the contact with O3, but also allow the substrate reorientation. With this reason, chain A thus induces various poses of CAR and ANS (Fig. 6C) which can be confirmed by fluctuated ligand RMSDs in Fig. S8.
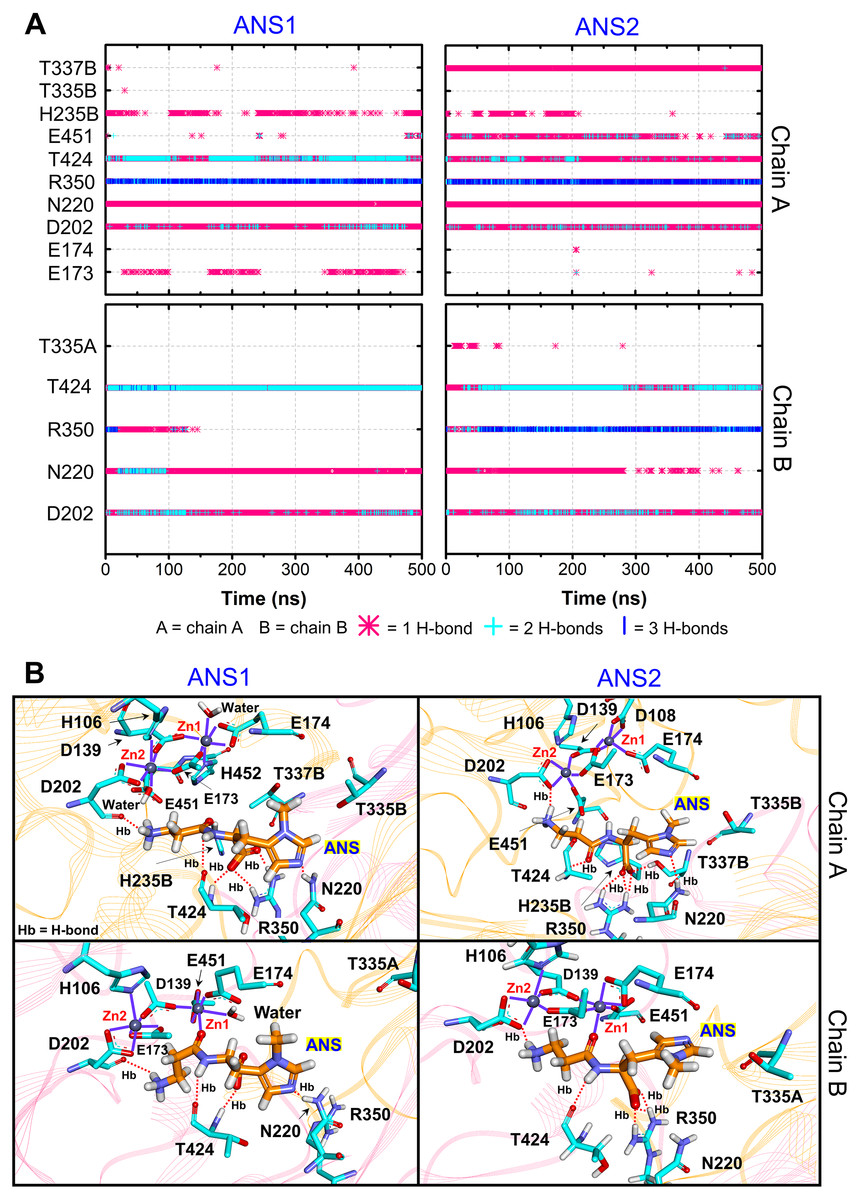
Figure 4: CN1-ANS interactions.
(A) Hydrogen bonds between anserine in both repeats (ANS1 and ANS2) and key residues. The locations of key components are displayed in (B). The purple lines show residues and waters that are within 3 Å of dizinc ions. The red dashed lines indicate the hydrogen bonds occurred.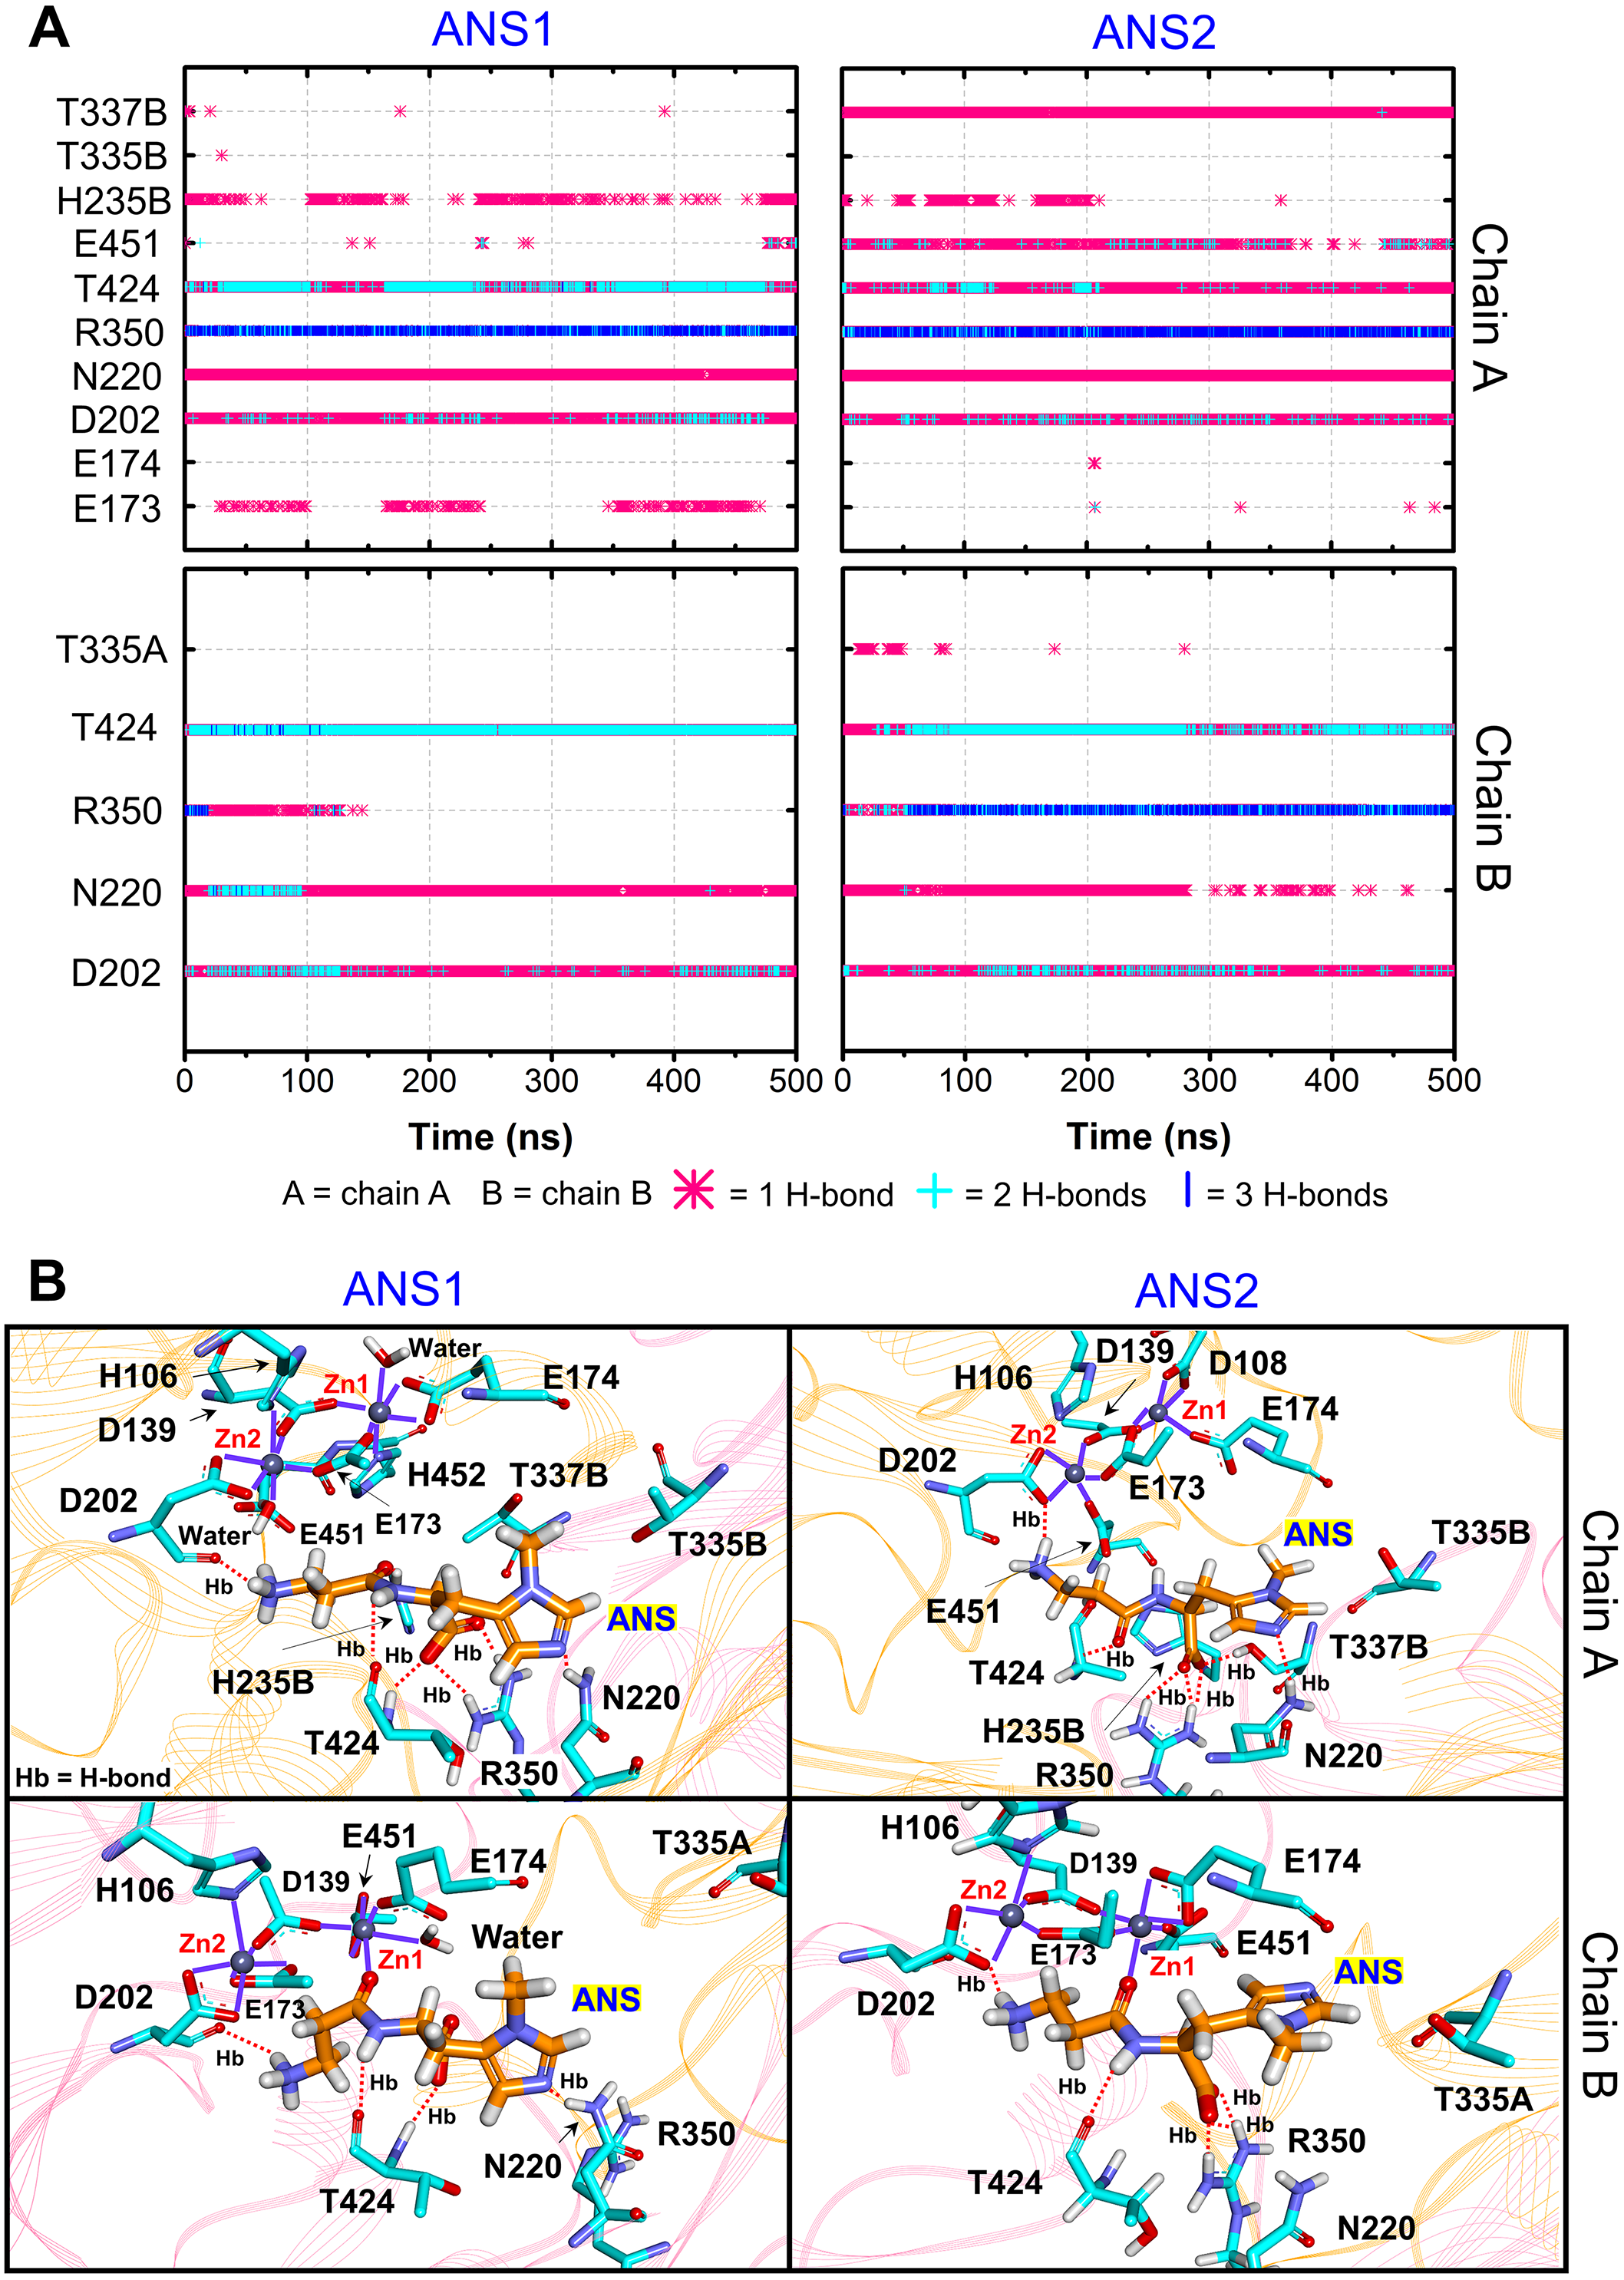

Figure 5: CN1-CAR interactions.
(A) Hydrogen bonds between carnosine in both repeats (CAR1 and CAR2) and key residues. The locations of key components are displayed in (B). The purple lines show residues and waters that are within 3 Å of dizinc ions. The red dashed lines indicate the hydrogen bonds occurred.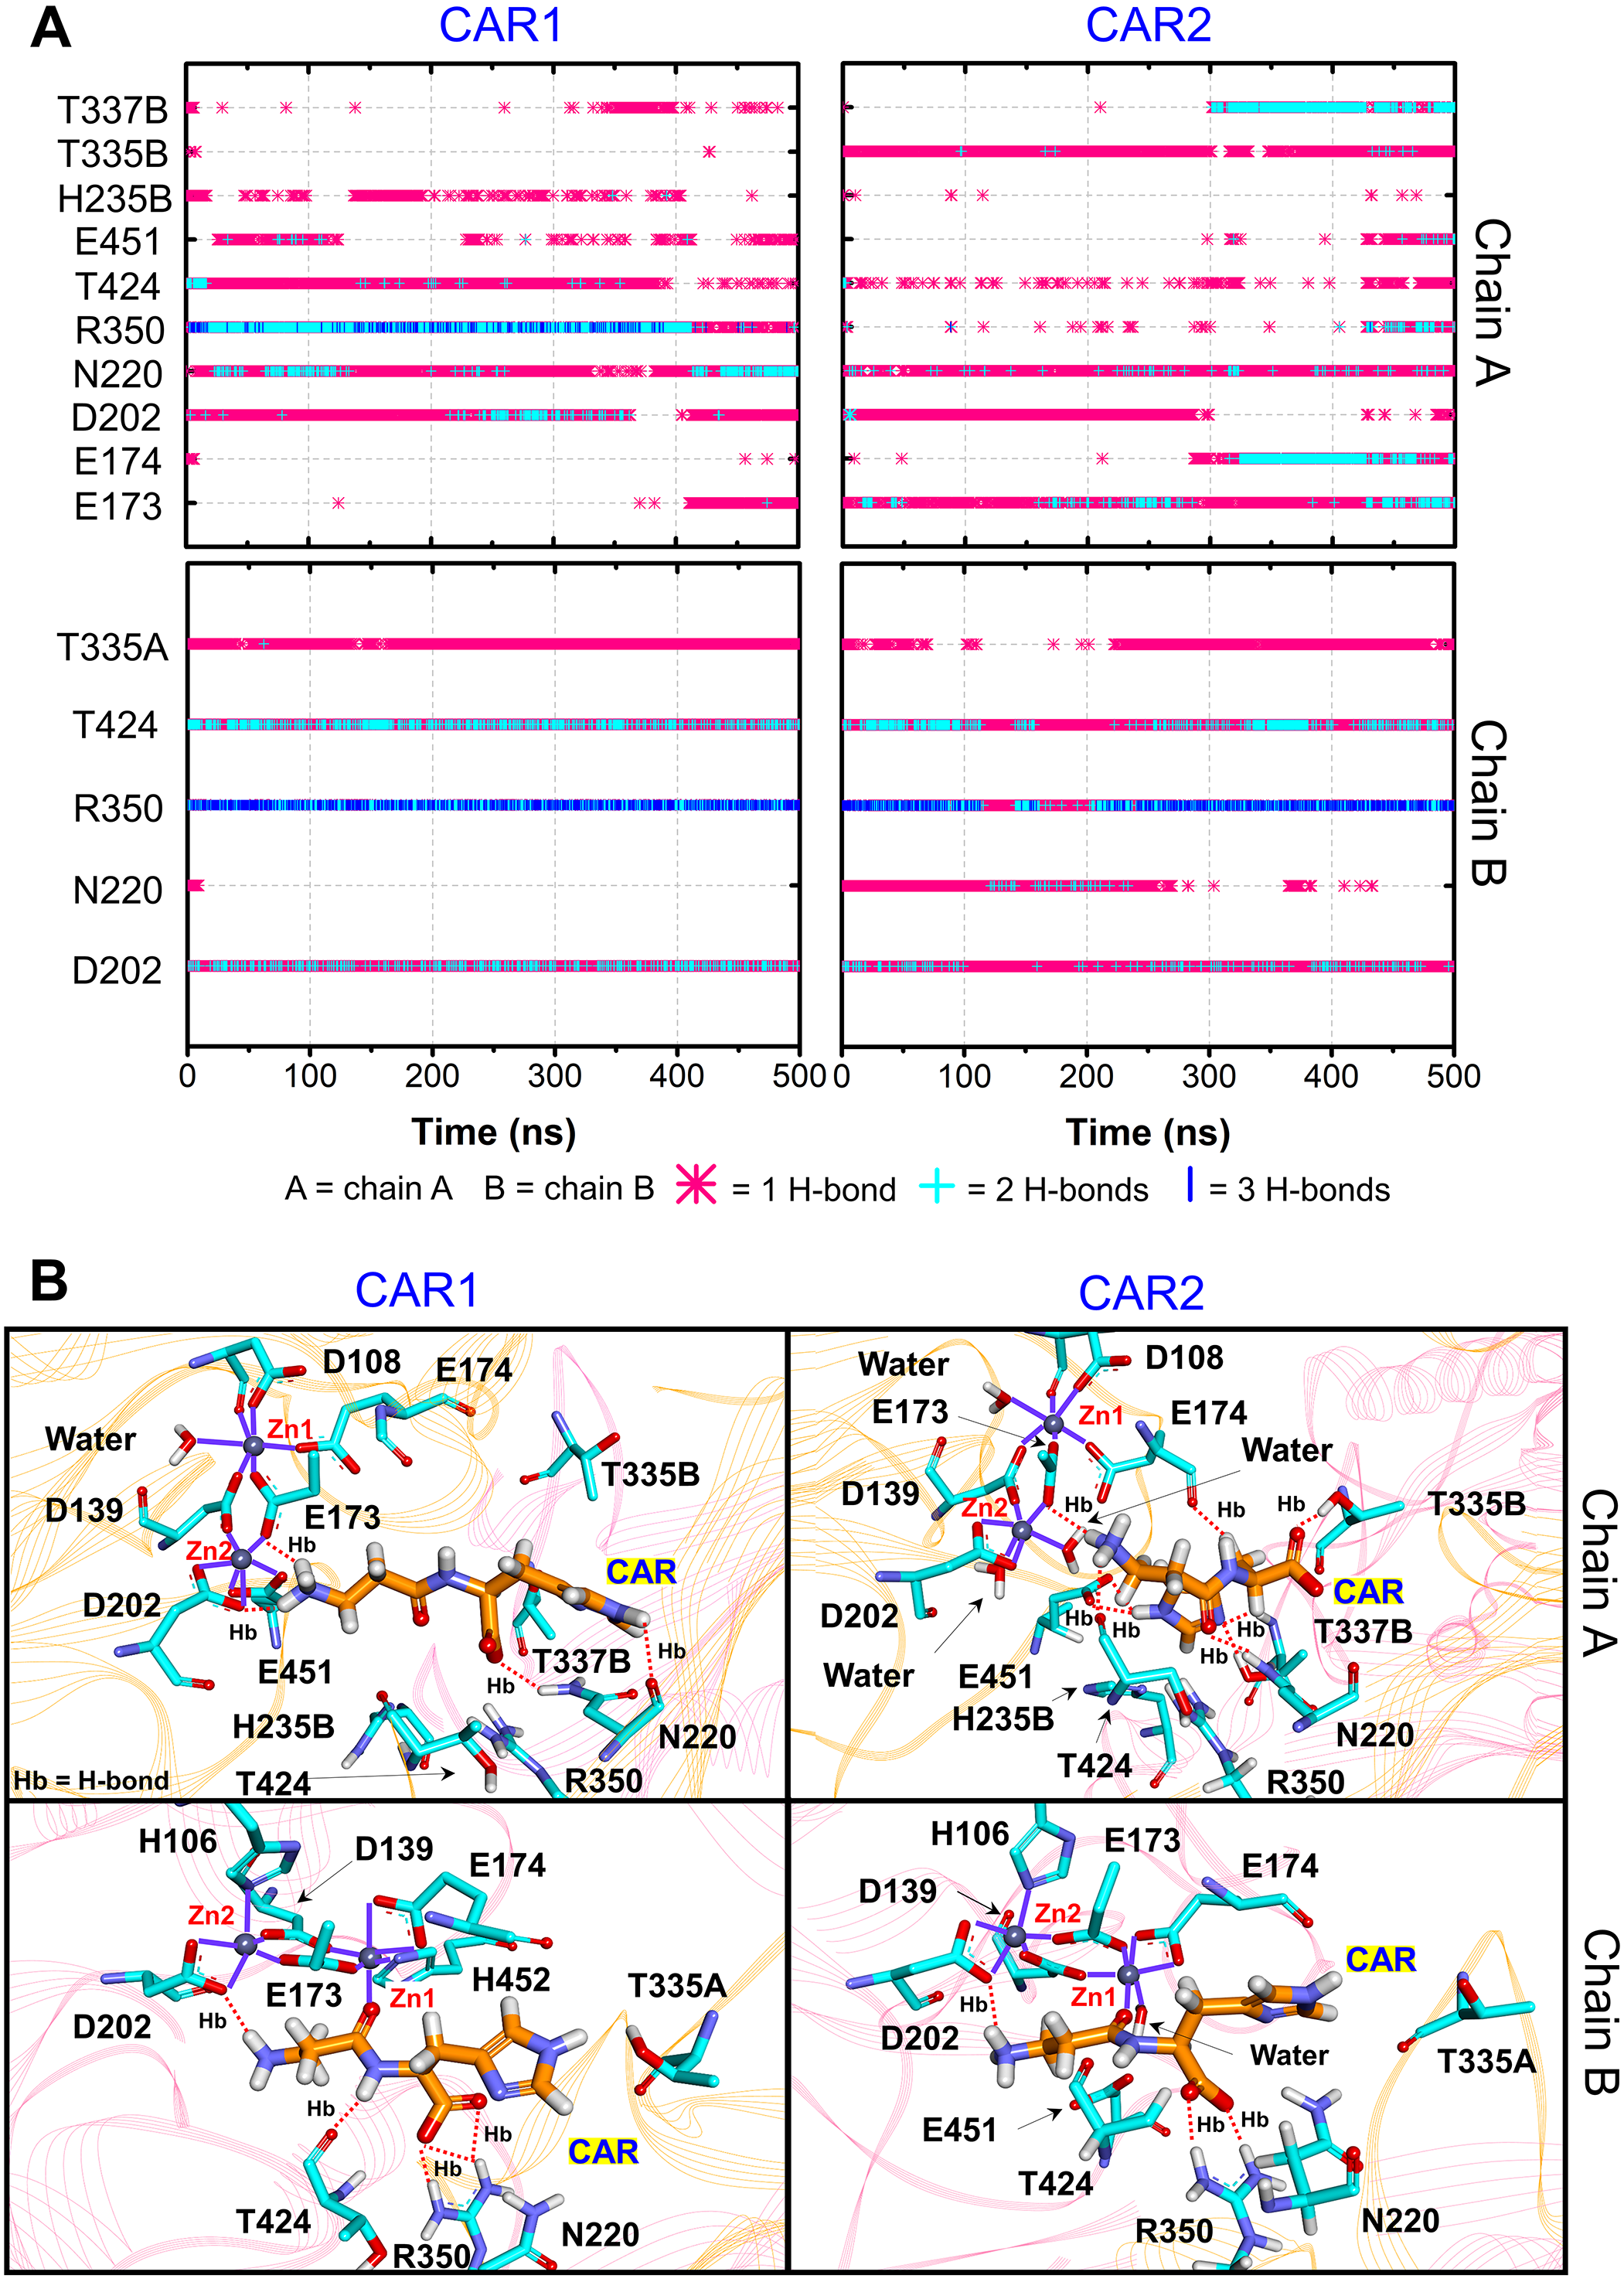

Figure 6: Ligand poses.
(A) Distances between Zn2+ (Zn1) and carbonyl oxygen on each ligand (O3) in all systems. The positions of O3 and Zn1 are shown on the right. The black arrow indicates the flipping direction of a histidine ring on ANS. (B) displays the orientations of CAR in the active site of chains A (top) and B (bottom). (C) The snapshots of ligand and two Zn2+ ions at t = 50 ns, 150 ns, and 500 ns, respectively.
In many dizinc peptidases or M20 members, the amide oxygen (O3) of a substrate was suggested to be one of Zn2+ coordinators (Holz, Bzymek & Swierczek, 2003; Lindner et al., 2003; Straeter & Lipscomb, 1995). The catalytic reaction is propagated by the attack of Zn-mediating water nucleophile (or hydroxide ion) (Lindner et al., 2003; Straeter & Lipscomb, 1995) where here only mediating water is investigated due to its abundance. The orientation of O3 pointing towards Zn1 in chain B seems to benefit the amide hydrolysis by facilitating the nucleophilic attack at the peptide carbonyl group as seen in many dizinc dipeptidases (Holz, Bzymek & Swierczek, 2003; Lindner et al., 2003). In contrast, the Zn1-Zn2 shift and loss of O3 contact in chain A can retard the catalytic activity by shielding the nucleophilic attack by Zn-bridging water (or hydroxide ion). Overall, chain B seems to promote more suitable substrate orientation for catalysis than chain A. This finding suggests both chains function non-simultaneously and independently. Further investigation on enzymatic activity is required to prove this hypothesis.
To explore the substrate-binding affinity, the interaction energies were calculated using MMPBSA (Table 2). The total energies in Table 2 clearly illustrate the different binding environments of both chains. Chain B seems to be slightly more substrate-favourable than chain A, except ANS2. Chain A in ANS2 promotes the highest binding affinity of -328.38 kJ/mol due to the highest number of protein contacts (forming permanent interactions with 6 residues in Fig. 4). In general, chain A employs a comparable degree of electrostatic and hydrophobic interactions to stabilise a substrate, while the electrostatic forces are dominant in chain B which may facilitate the better enzymatic activity in a pocket (Table 2). This finding supports the idea of an alternating function of CN1 subunits. In case of ligand binding, there is no large energetic difference between the binding of ANS and CAR (∼260–360 kJ/mol), however CAR seems to bind slightly tighter to CN1 (Table 2). This suggests not only the interaction network, but also proper orientation mediating the catalytic reaction are important for a faster catabolism of CAR. Altogether, each subunit provides non-identical environment for a substrate where chain B is more favoured. Both CAR and ANS share similar degree of binding affinities.
| System | Chain A (kJ/mol) | Chain B (kJ/mol) | ||||
|---|---|---|---|---|---|---|
| ΔEvdW | ΔEElec | Total Energy | ΔEvdW | ΔEElec | Total Energy | |
| ANS1 | −131.29 ± 11.94 | −132.88 ± 20.81 | −264.17 ± 24.29 | −116.63 ± 15.70 | −168.87 ± 15.83 | −285.50 ± 13.67 |
| ANS2 | −144.23 ± 11.59 | −184.15 ± 14.87 | −328.38 ± 16.44 | −132.52 ± 15.68 | −161.37 ± 16.43 | −293.89 ± 19.66 |
| CAR1 | −131.10 ± 10.42 | −128.99 ± 21.14 | −260.09 ± 19.31 | −107.48 ± 14.24 | −194.56 ± 12.82 | −302.04 ± 13.39 |
| CAR2 | −131.84 ± 12.92 | −155.61 ± 16.94 | −287.45 ± 16.18 | −114.07 ± 13.69 | −205.13 ± 18.35 | −319.20 ± 18.86 |
Considering the tight ligand-binding in chain B, the CAR backbone linearly aligns inside a cavity where its imidazole is trapped by a strong interaction with T335A, whereas ANS with a methylated histidine ring shows more mobility. The methylation of ANS significantly disrupts the interaction network at the active site. A presence of -CH3 group blocks the imidazole from T335B (Fig. 4) and leads the whole ring downward to form a hydrogen bond with N220 instead (Fig. 6A, right), although the peptide oxygen O3 still directs to Zn1. This move causes the histidine ring to bend away from an ANS backbone (Fig. 6C). This shift also induces slightly larger solvent accessible areas. A bulky methylated histidine moiety also causes ANS more dehydrated than CAR (Fig. S9). A bulky and dehydrated methylated imidazole moiety enhances a steric hindrance that also breaks down the interaction network with CN1. ANS wobbles inside a pocket, while CAR is more stable, especially CAR1 and CAR2 in chain B (Fig. 6C). In addition, CAR can form more water-mediating hydrogen bonds than ANS which can facilitate the more decent binding of CAR (Figs. S10 and S11). Taken together, the stable stretching conformation of CAR where O3 points towards Zn1 can explain why CAR can be hydrolysed faster than ANS.
Conclusions
In this work, the binding mechanisms of ANS in comparison to CAR are studied here for the first time. In general, each CN1 monomer seems to function independently and alternatingly. The involvement of residues from a neighbour chain (H235, T335, and T337) in the active site structure indicates the importance of being a dimer for effective enzymatic activity. For the substrate-binding activity, ANS and CAR induce a comparable degree of interactions with CN1 reflecting similar binding affinities. The faster catalysis rate of CAR experimentally reported is because of its stability and proper pose where its backbone is linearly aligned, and its peptide oxygen directs to the active Zn2+. This orientation can enhance the propensity for hydrolysis. On the contrary, a presence of the methyl group on ANS breaks down the interaction of the imidazole ring with T335 from the adjacent monomer. A bulky methylated histidine moiety also causes more dehydrated ANS. This scenario allows ANS to adopt various conformations which delays the hydrolytic activity.
A previous work reported that both homocarnosine and anserine inhibit the carnosine degradation (Peters et al., 2011; Peters et al., 2010b). Homocarnosine shows higher binding affinity than CAR does, but its hydrolysis rate is negligible (Pavlin et al., 2016; Pegova, Abe & Boldyrev, 2000). Thus, homocarnosine is likely to be the unhydrolysed inhibitor that blocks the CAR binding. In contrast to homocarnosine, ANS can be hydrolysed with a low catalytic rate. A similar number of CN1-substrate interactions to CAR reflects a comparable degree of binding activity. This also implies the ability of ANS to be a competitive inhibitor for CAR. However, homocarnosine seems to be better for competitive inhibition than ANS due to its strong binding affinity and the ability of ANS to be metabolised. ANS is likely to be the temporary competitive inhibitor by retarding the CAR catabolism. Hence, the ANS concentration should affect its competitive inhibition ability. Due to the therapeutic potential of carnosine and anserine, extending the half-life of both chemicals is required. Nonetheless, CAR was reported to show a wider range of medicinal effect (Derave, De Courten & Baba, 2019; Ding et al., 2018). Thus, more CN1 occupancies by ANS can enhance a number of free CAR in a blood stream which can benefit the clinical effects.